Article

Soil Microbial Functional Diversity under the Single-Season Influence of Traditional Forest Management in a Sessile Oak Forest of Central Europe

1
Department of Geology and Soil Science, Mendel University in Brno, Zemědělská 1, 613 00 Brno, Czech Republic
2
Department of Forest Botany, Dendrology and Geobiocenology, Mendel University in Brno, Zemědělská 1, 613 00 Brno, Czech Republic
3
Department of Forest Management and Applied Geoinformatics, Mendel University in Brno, Zemědělská 1, 613 00 Brno, Czech Republic
4
Department of Silviculture, Mendel University in Brno, Zemědělská 1, 613 00 Brno, Czech Republic
*
Author to whom correspondence should be addressed.
Forests 2021, 12(9), 1187; https://doi.org/10.3390/f12091187
Submission received: 29 June 2021 / Revised: 23 August 2021 / Accepted: 27 August 2021 / Published: 1 September 2021
(This article belongs to the Section Forest Ecology and Management)

Abstract

:
This one-year study focuses on the responses of a soil environment to the implementation of traditional forest management practices in oak–hornbeam stands with the following treatments: cut (C), cut + litter raking (CR), cut + grazing (CG), cut + litter raking + grazing (CRG) and control (Ctrl). The cut was conducted in 2018 through extremely heavy thinning. In autumn of 2017 and 2018, we sampled the soils, focusing on microbial functional diversity (FD) assessments using BIOLOG EcoplateTM. After one season, the FD was the highest in the Ctrl stand and the lowest in the CRG stand. Furthermore, we detected significant seasonal differences in soil reaction, nitrate nitrogen content, phosphatase activity and microbial biomass among the treatments. In particular, the Ctrl stand was defined via FD indices and biochemical and biological soil properties that contrasted mainly with those of the CRG stand defined by the content of mineral nitrogen forms. The soil properties did not differ substantially in the remaining treatments. Of the 31 carbon sources defining FD, 6 were treatment-specific (putrescine, L-arginine, L-serine, L-threonine, D-cellobiose and glycogen), while the remaining carbon sources mainly displayed either uniform high or low activity across the treatments.

1. Introduction

Forests are characterized by the presence of long-lived tree species. In connection with these tree species, forest soils typically display arrangements of forest floor horizons (litter). Most organic matter, and thus the biological activity in the soil, is concentrated in the upper soil horizons [1]. Therefore, the upper horizons represent an integral part of the forest soil body [2].
Intensive forest management significantly affects the soil environment. Traditional forest management measures, including coppicing, grazing and litter raking, represent a variety of anthropogenic disturbances [3] that, according to some studies, cause long-term impact on the soil level [4,5,6]. These methods are controversially discussed and frequently abandoned due to the resulting soil degradation and gradual reductions in the production capacities of habitats. According to certain studies, these methods inhibit the succession of forest ecosystems, and thus, in a way, are beneficial in terms of the presence of rare taxa [7].
Some abandoned traditional management types [8] are currently applied again [9]. The purpose is not to acquire natural resources, but to promote species diversity. Some traditional management measures are prohibited in the Czech Republic [10], but their impact on both the soil environment and understory vegetation has been intensively studied [11].
Litter raking and grazing affect forest ecosystems for decades [12,13]. Many studies focused on the effect of these management types on aboveground parts of forest stands [14] and, in instances of soil environment research, on the soil hydrophysical and chemical properties [2,3,7,15,16,17,18,19].
In Central Europe, coppicing was traditional management for centuries [20,21,22]. In the Czech Republic, it was systematically eliminated during the second half of the 20th century [23,24]. Grazing and litter raking are prohibited due to their significant degradation effects on the soil environment. The negative effects of litter raking on nutrient uptake capacity, acid-neutralizing capacity and the C/N ratio of the soil were already known [2] during the first half of the 19th century. Some local contemporary works attempted to assess the soil microbiota response to changing external conditions. Nonetheless, effects of litter raking and grazing on biological activity and the functional diversity of the soil microbial community have not yet been clarified sufficiently.
The rate and turnover intensity of organic matter conversion in forest ecosystems involve participation of soil microorganisms and depend on the composition of the microbial community [25,26]. Therefore, the function of soil microbiota is substantial for the carbon cycle and the cycles of other elements.
The structure and diversity of soil microbial communities reflect climate conditions, weather patterns (temperature and moisture regimes), trophic level, composition and diversity of plant communities [27], anthropogenic influences and the habitat disturbance regime. Higher microbial functional diversity can be expected in species-diverse communities or in communities with equilibrium balance at the food web level [28]. Thus, functionally more diverse ecosystems are more resistant to stress and disturbances. This resistance can be enhanced by mixing species [29,30,31]. In addition, the adaptive capacity of an ecosystem can be increased by alternative forest management measures [32]. On the contrary, disturbances can (temporarily) promote specific functional groups by an increased source of carbon [33]. The exact nature of the interaction between the soil environment-soil microbial functional system and the plant management approach remains unclear.
The soil microbial functional diversity can be expressed as the diversity index of carbon utilization patterns from known carbon sources using the BIOLOG EcoPlateTM system. The BIOLOG EcoPlateTM system expresses the impact of the external environment on microbial functional diversity under various types of environments, management measures and tree species compositions [25,34].
The aim of our study was to assess the influence of coppicing, grazing and litter raking and their combinations on a wide range of soil properties, especially the microbial functional diversity over one season. We formulated the following hypotheses: The effects of particular treatments on soil properties would not differ significantly. The treatments would affect the soil microbial functional diversity and lead to promotion of certain microbial functional groups (as revealed also in Tomao et al.’s study of fungal communities [35]). This would thus lead to overall decrease of diversity indices, whereas in the intact forest stands (control) the diversity index values would be higher.

2. Materials and Methods
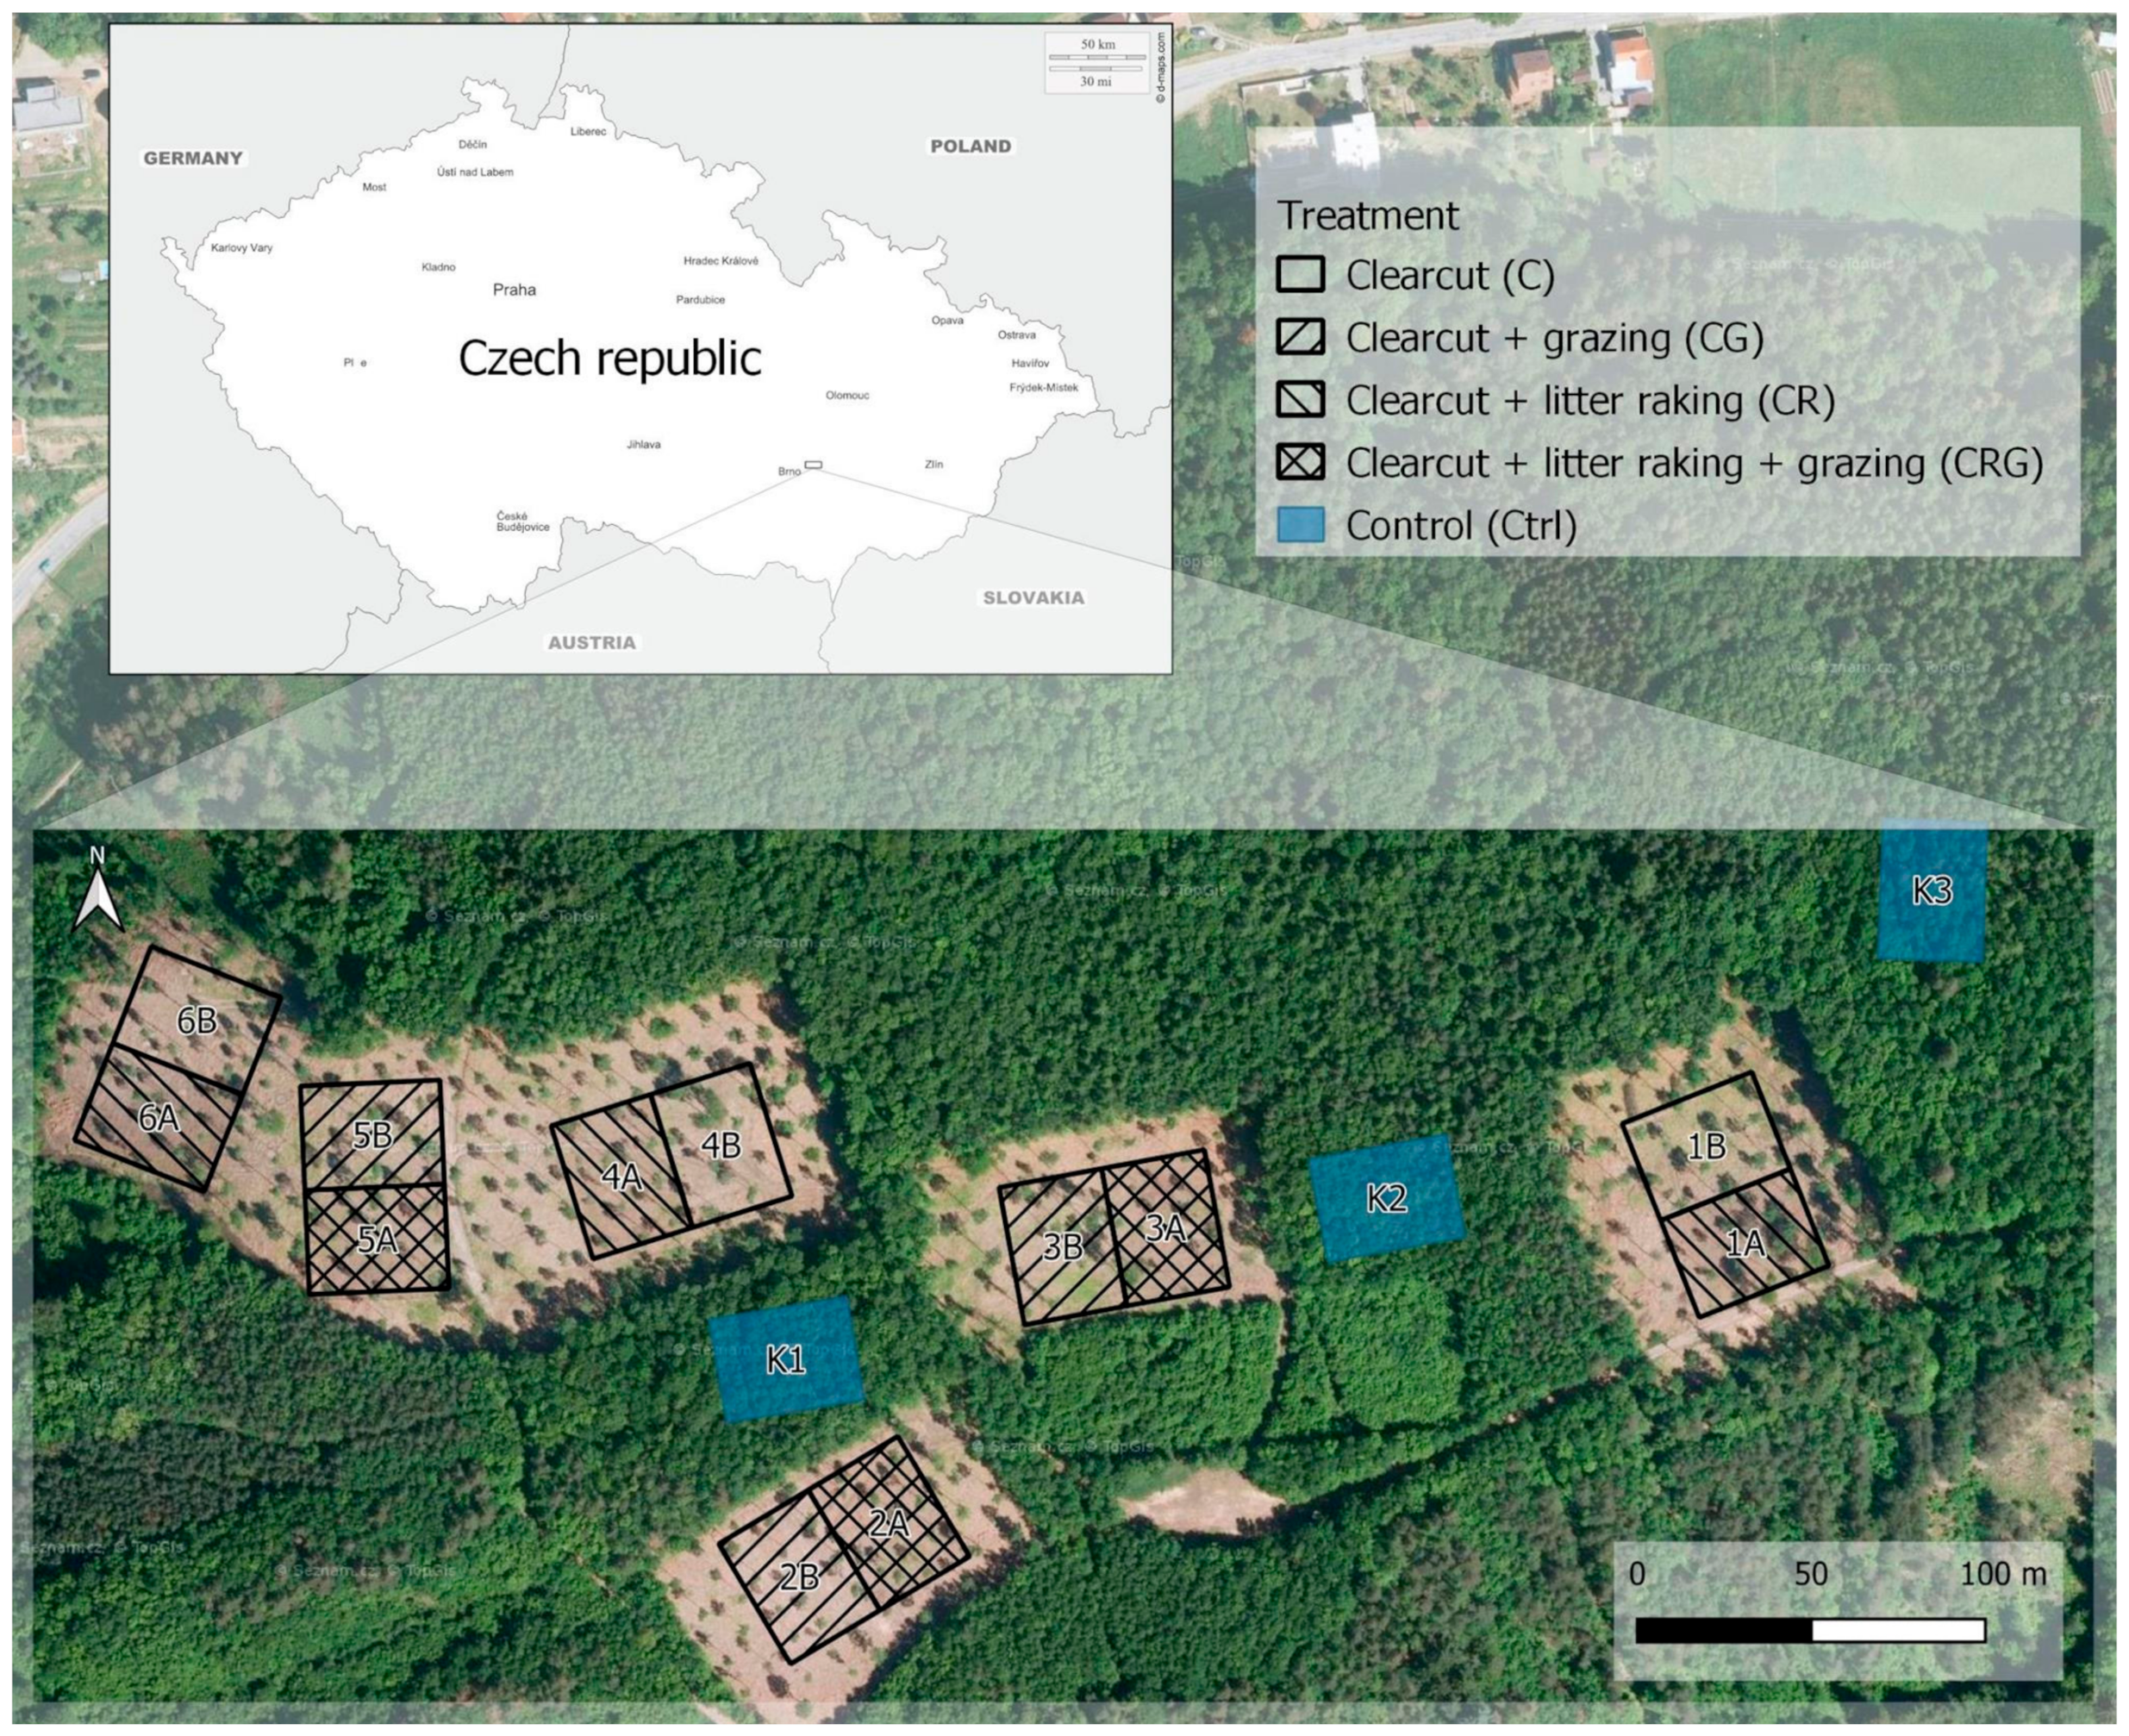
2.1. Study Area

The study area is situated at the Training Forest Enterprise Masaryk Forest Křtiny of the Bílovice forest district, in the southeastern part of the Czech Republic (49.2513756N, 16.6832958E; 275–325 m a.s.l.; prevailing slope orientation W–N; prevailing slope 5–10°; maximum slope 20°).
The tree species composition consists of sessile oak (Quercus petraea agg. [Matt.] Liebl.), European hornbeam (Carpinus betulus L.) and European beech (Fagus sylvatica L.) with respective average representations of 58.0%, 20.3% and 14.0%. Thus, the forest vegetation of this region has the characteristics of oak–hornbeam forests (alliance Carpinion betuli). According to the Czech forest ecosystem classification [36], the forest sites are mostly classified as nutrient-rich beech–oak (Fageto–Qurcetum eutrophicum), rarely transitioning to nutrient-rich oak–beech (Querceto–Fagetum eutrophicum) on the north-oriented slopes and, to loamy beech–oak (Fageto–Quercetum illimerosum trophicum) on the rare loess loam soils, and to water-deficient beech–oak (Fageto–Quercetum subxerothermicum) forest site complexes on the very rare sunny slopes.
The annual precipitation totals in 2017 and 2018 were 551.6 and 392.4 mm, respectively, and during May–November, the total precipitation amounts were 428.4 and 278.8 mm, respectively. The bedrock of the region consists of granodiorite with irregular admixture of loess loam (with thickness of 10–55 cm). The soils are classified as Eutric Cambisols (Siltic or Loamic, event. Ruptic) altering with Stagnic Luvisols (Loamic, Ruptic) [37] with obscure reductimorphic and oximorphic features due to the loess admixtures, depending on the loess loam thickness. The humus form is represented mainly by Eumoder (48%), followed by Oligomull (7% Oligomull and 15% Oligomull mycogène) and Hemimoder (12%). Remaining humus forms (Dysmull, Amphimull and Dysmoder) represent 8%, 5% and 5%, respectively [38]. Average organic layer thickness ranges from 4 to 11 cm.

2.2. Experimental Design

In 2017, we established six 60 m × 40 m experimental blocks (blocks 1–6; Figure 1). In January 2018, extremely heavy thinning (C—cut) was performed on each block with a buffer zone of 20 m (for the elimination of edge effects) with an intensity of 88%, and the remaining 12% of trees were preserved as standards (trees preserved on the plot after thinning) [39]. Each experimental block was divided into two 30 m × 40 m plots (plots A and B, 12 plots in total). Blocks 2, 3 and 5 were assigned as cut + grazed on the 2B, 3B and 5B plots (CG) and as cut + grazed + raked on the 2A, 3A and 5A plots (CRG). Blocks 1, 4 and 6 were assigned as cut on the 1B, 4B and 6B plots (C) and as cut + raked on the 1A, 4A and 6A plots (CR). The assignment of these treatment to the blocks was performed randomly. We also established three 30 m × 40 m control plots (representing undisturbed forests) assigned as Ctrl.
The litter (L, F and part of the H horizons) was raked in the CR and CRG plots in April 2018. The total weight of the dry mass of the removed litter was 30.5 t ha−1 (sd 8.74). From June to September 2018, blocks 2, 3 and 5 were grazed by Šumavka breed sheep under the conditions of one 14-day rotation (4-pc herd) and two 10-day rotations (6-pc herd).

2.3. Field and Laboratory Work

The soil taxonomic units were defined (1) using deep soil probes (10 in total) to sample the soil down to the soil-forming substrate and distinguish the diagnostic horizons (41 samples in total) and (2) using a probe rod (26 in total) to the verify soil taxonomic units according to the World Reference Base [37].
Each of the 15 plots was divided into four quadrants for soil sampling. From each quadrant, one mixed soil sample was collected (four samples per plot, 60 samples in total) from the 25 cm × 25 cm mineral A horizon subsurface area (depth of 5–10 cm). In this sampling survey, we avoided a 15 m × 15 m area in each plot center, which was reserved for geobotanical inventory (not included in this work). We also marked the sampling quadrants in each plot and for each sample to allow comparisons between 2017 and 2018. The samples were taken in autumn 2017 (prior to thinning) and autumn 2018 (one season after thinning). The functional diversity was determined in 2018, and the other soil properties were analyzed in 2017 and 2018.
The soil was analyzed after homogenization and sieving of the samples through a 2 mm sieve, except the analyses performed for the determination of organic carbon and total nitrogen, for which the 2 mm samples were completely transferred through a 0.25 mm sieve after pulverization. The determinations follow: the active (pH/H2O) and potential (pH/KCl in 0.2 M KCl) soil reactions with sample, eluent ratio of 1:2.5 (w:v); hydrogen cation concentration (H+) (mmol+ kg−1) (obtained using dual pH measurements [40]); mobile aluminum content (Al3+) (mmol+ kg−1) according to Sokolov [41]; available mineral nutrients (Ca, Mg, K) (mg kg−1) from Mehlich II leachate [42]; cation exchange capacity (CEC) (mmol+ kg−1) (obtained by employing a summation method); base saturation (BS) (%) (derived by applying the equation BS = (Ca2+ + Mg2+ + K+)/CEC); acid saturation (AS) (%) (derived by applying the equation AS = (H+ + Al3+)/CEC); P content (P) (mg kg−1) (obtained using spectrophotometry in a solution of ascorbic acid, H2SO4 and Sb3+); organic carbon (Corg) (%) content (obtained spectrophotometrically in chromosulfuric acid [43]); total nitrogen (Nt) (%) content (measured using the Kjeldahl method [44]); and humic substances (assessed according to Kononowa and Bělčikova [45] (%) as humic acid carbon (C-HA), fulvic acid carbon (C-FA), the C-HA/C-FA ratio, C-THS (sum of humic substances), and the degree of humification (DegHum) as a C-THS percentage from Corg). We also expressed nutrient content ratios such as Ca/K, Ca/Mg and Mg/K, and derived K ratio law using the equation K-rat.law = K+/sqrt(Ca2+ + Mg2+) [46]. Corg and Nt were applied to express the C/N ratio, and base cation content (Bc) was expressed as the sum of base cations (mmol+ kg−1).
The activity of soil proteases was determined by hydrolysis with casein as a substrate, and the amount of l-tyrosine produced was measured according to the methodology by Rejšek et al. [47]. The ammonium and nitrate nitrogen (N-NH4+ and N-NO3) contents in the soil extracts were determined using 1 M KCl extract according to the method described by Kučera et al. [48]. The urease activity of the soil was determined by the Kandeler and Gerber method [49] after incubation of the urea samples. The acid phosphomonoesterase activity was determined using the Rejšek method [50]. The determination of the amount of microbial carbon (Cmic) in the soil biomass was performed by the fumigation–extraction method according to Zbíral et al. [43].
The microbial functional diversity was assessed using the BIOLOG EcoPlateTM [51,52] technique with 31 organic substrates (each with 3 repetitions per plate) used as carbon sources for microbial community cultivation. The carbon compounds were coupled to capture electrons by colorless tetrazolium salts, forming reduced purple formazans that could be readily measured spectrophotometrically via absorbance. The degree of substrate oxidation was monitored through the reduction of a tetrazolium dye. The degree of staining depended on the amount and activity of the microbial cells. The microplate inoculation was based on a fresh soil sample (10 g) shaken for 20 min (at 200 rounds per min) with 90 mL 0.40% NaCl solution and centrifuged for 8 min at 4000 rpm. The supernatant was diluted 1:1000 and 150 μL of this extract was incubated in BIOLOG EcoPlateTM at 23 °C for 384 h. The absorbance was recorded every 12 h during the first two days and every 24 h during the remaining incubation period using a Tecan Infinte M200Pro Nano+ microplate reader at 590 nm against a control well (pure water) as a blank.

2.4. Data Analysis

The data were processed using Statistica CZ 12 software (with graphical outputs of post hoc Tukey multiple comparison test) [53] and R software for statistical computing (R version 3.6.2 and RStudio version 1.3.1056) (remaining statistical analysis) [54]. The functional diversities obtained based on the microplates were assessed using the (1) Shannon–Wiener diversity index (S–W index), calculated as follows [55,56]:
H’ = −∑[pi × (ln pi)],
where pi is the mean absorbance of the three repetitions of the substrate per microplate. The average well color development index (AWCD) (2) was calculated as follows:
AWCD = ∑[(Ai−A0)/31],
where Ai is the absorbance within each well and A0 is the absorbance of the control well.
For the data processing, we used the whole data set of n = 60 (12 values for each treatment and 4 values for each plot).
We used paired sample t-tests to compare the soil parameter values obtained in 2017 and 2018. The pairs were determined using the zone sampled within each sampling plot in 2017 or 2018. Parametric ANOVA followed by Tukey´s HSD test (with the treatments set as categorical variables) was employed to compare (1) the soil properties in each year separately and (2) the diversity indices (S–W index, AWCD) at each absorbance reading time of ecoplate incubation. For the diversity indices, we finally used the 384 h incubation period with the most significant differences in the diversity index values. A two-tailed correlation analysis was performed for n = 60 samples (Pearson critical value was 0.250) using the ´corrplot´ function as a graphical output. Principal component analysis (PCA) was performed with the ´vegan´ package version 2.5-6 [57] after data standardization using the ´scale´ function. For the PCA, the treatments were applied for categorical variables and for continuous variables: (1) the S–W index and AWCD; (2) the soil properties determined in 2018 (Nt_2018, etc.); and (3) the differences in soil properties between 2018 and 2017, set as the ’delta‘ values (Nt_delta, etc.). The number of variables was reduced in the instance of a significant correlation, as assessed from the ordination plot. In 2018, and again in the 2018-2017 delta soil data, we followed an equal list of soil properties (AWCD, S–W index, Nt, DegHum, BS, AS, K-rat.law, N-NH4+, N-NO3- and Cmic). The individual treatment factor levels are shown on the ordination plot of the first two axes using the ´ordispider´ function. The functions ggplot and qplot (´ggplot2´ package version 3.3.0 [58]) were applied as graphic instruments to show the extent to which each substrate contributed to the total index. The pattern of utilization of the 31 carbon substrates was scaled to 5 categories in relation to the AWCD index plate (1: <1st quartile; 2: <median; 3: AWCD; 4: <3rd quartile; 5: >3rd quartile). All the tests were performed at the significance level of alpha = 0.05.

3. Results

3.1. Differences between 2017 and 2018

Before the thinning, the soils were typical with slightly acidic soil reactions, a slight predominance of C-FA, and a contribution of approximately 25% of humus substances to the total organic matter content (Table 1). The nutrient contents corresponded to the mesotrophic habitat as well as the development of humus forms, with a slight predominance of bivalent base cations over potassium and optimal base saturation in mineral A horizon above 50%.
The results of the paired t-test detected differences between 2017 and 2018 in the monitored parameters within the treatments. In all plots, increases in Nt, Ca and N-NO3- and decreases in H+ and acid phosphomonoesterase activity between 2017 and 2018 could be observed. Statistically significant increases were observed in the soil response associated with the CRG and Ctrl plots, an increase in the humus fraction content was observed in connection with the CRG plots, and an increase in N-NH4+ within the C between 2017 and 2018. The greatest increase in the N-NO3- concentration occurred in the context of the CRG (nearly a tenfold increase), and the N-NH4+ concentration increased almost comparably (at the statistically significant threshold) in conjunction with the CG and CRG plots (cf. Ctrl without any significance).

3.2. Specifications of the Treatments

ANOVA showed significant differences among the treatments for the delta values of five soil parameters between 2017 and 2018 (Table 2). The greatest increases in the soil reaction values occurred within the CRG and Ctrl plots, while in connection with the CR plots, a very slight decrease was measured. The largest increase in the nitrate nitrogen concentration was detected in the CRG plots, and the smallest increase was observed in the Ctrl plots. The smallest decreases in the acid phosphomonoesterase activity with respect to the baseline were shown by the CRG and Ctrl plots, while the greatest decrease was observed in the C plots. The greatest increase in the Cmic content was recorded in the CRG plots, and the greatest decrease was recorded in the C plots.
The CRG evinced the highest annual change rate in all instances where the ANOVA null hypothesis was rejected, while in Ctrl plots the response did not show such an unequivocal trend.
The treatments differed in the spatial heterogeneity of the blocks (Table 3), which was systematically higher in pH and lower in Cmic in 2017 than in 2018. The variability increased in the concentration of nitrate nitrogen, especially within plots and after their aggregation to blocks, except for the CG plots. The highest increase in variability was observed in the CRG plots, especially in the 3A and 2A plots. The variability in phosphatase activity decreased, especially in plots within the CR, CRG and Ctrl sites. Both diversity indices were the most homogenous in the Ctrl plots in 2018 (Table 3), in which the variability was the lowest and most balanced. In contrast, the highest AWCD and S–W variabilities were in the CRG plots.

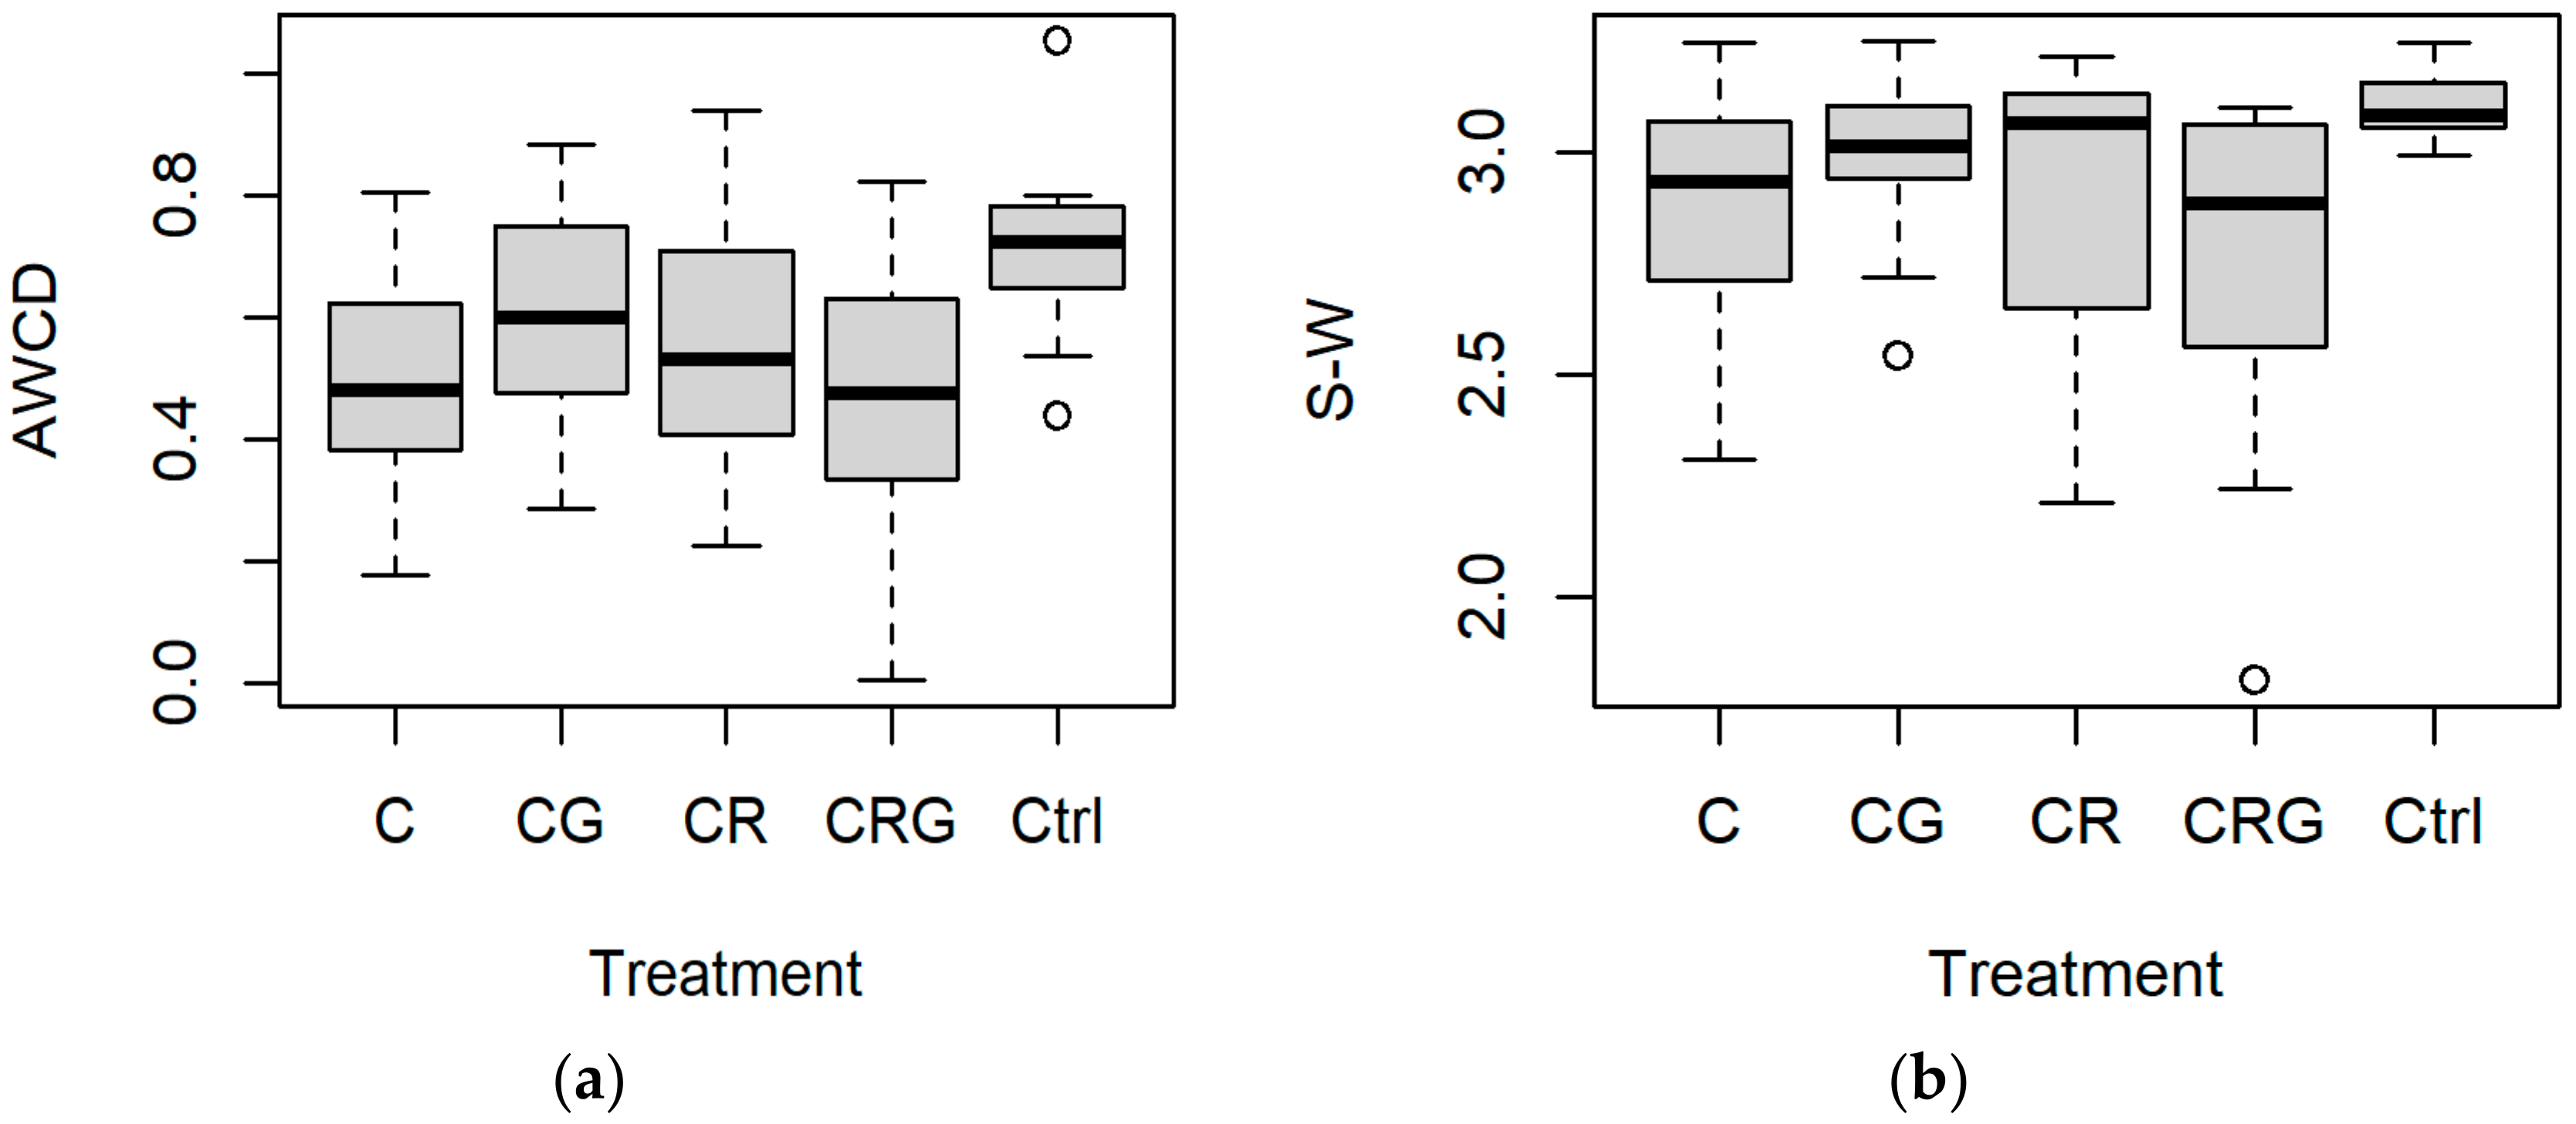
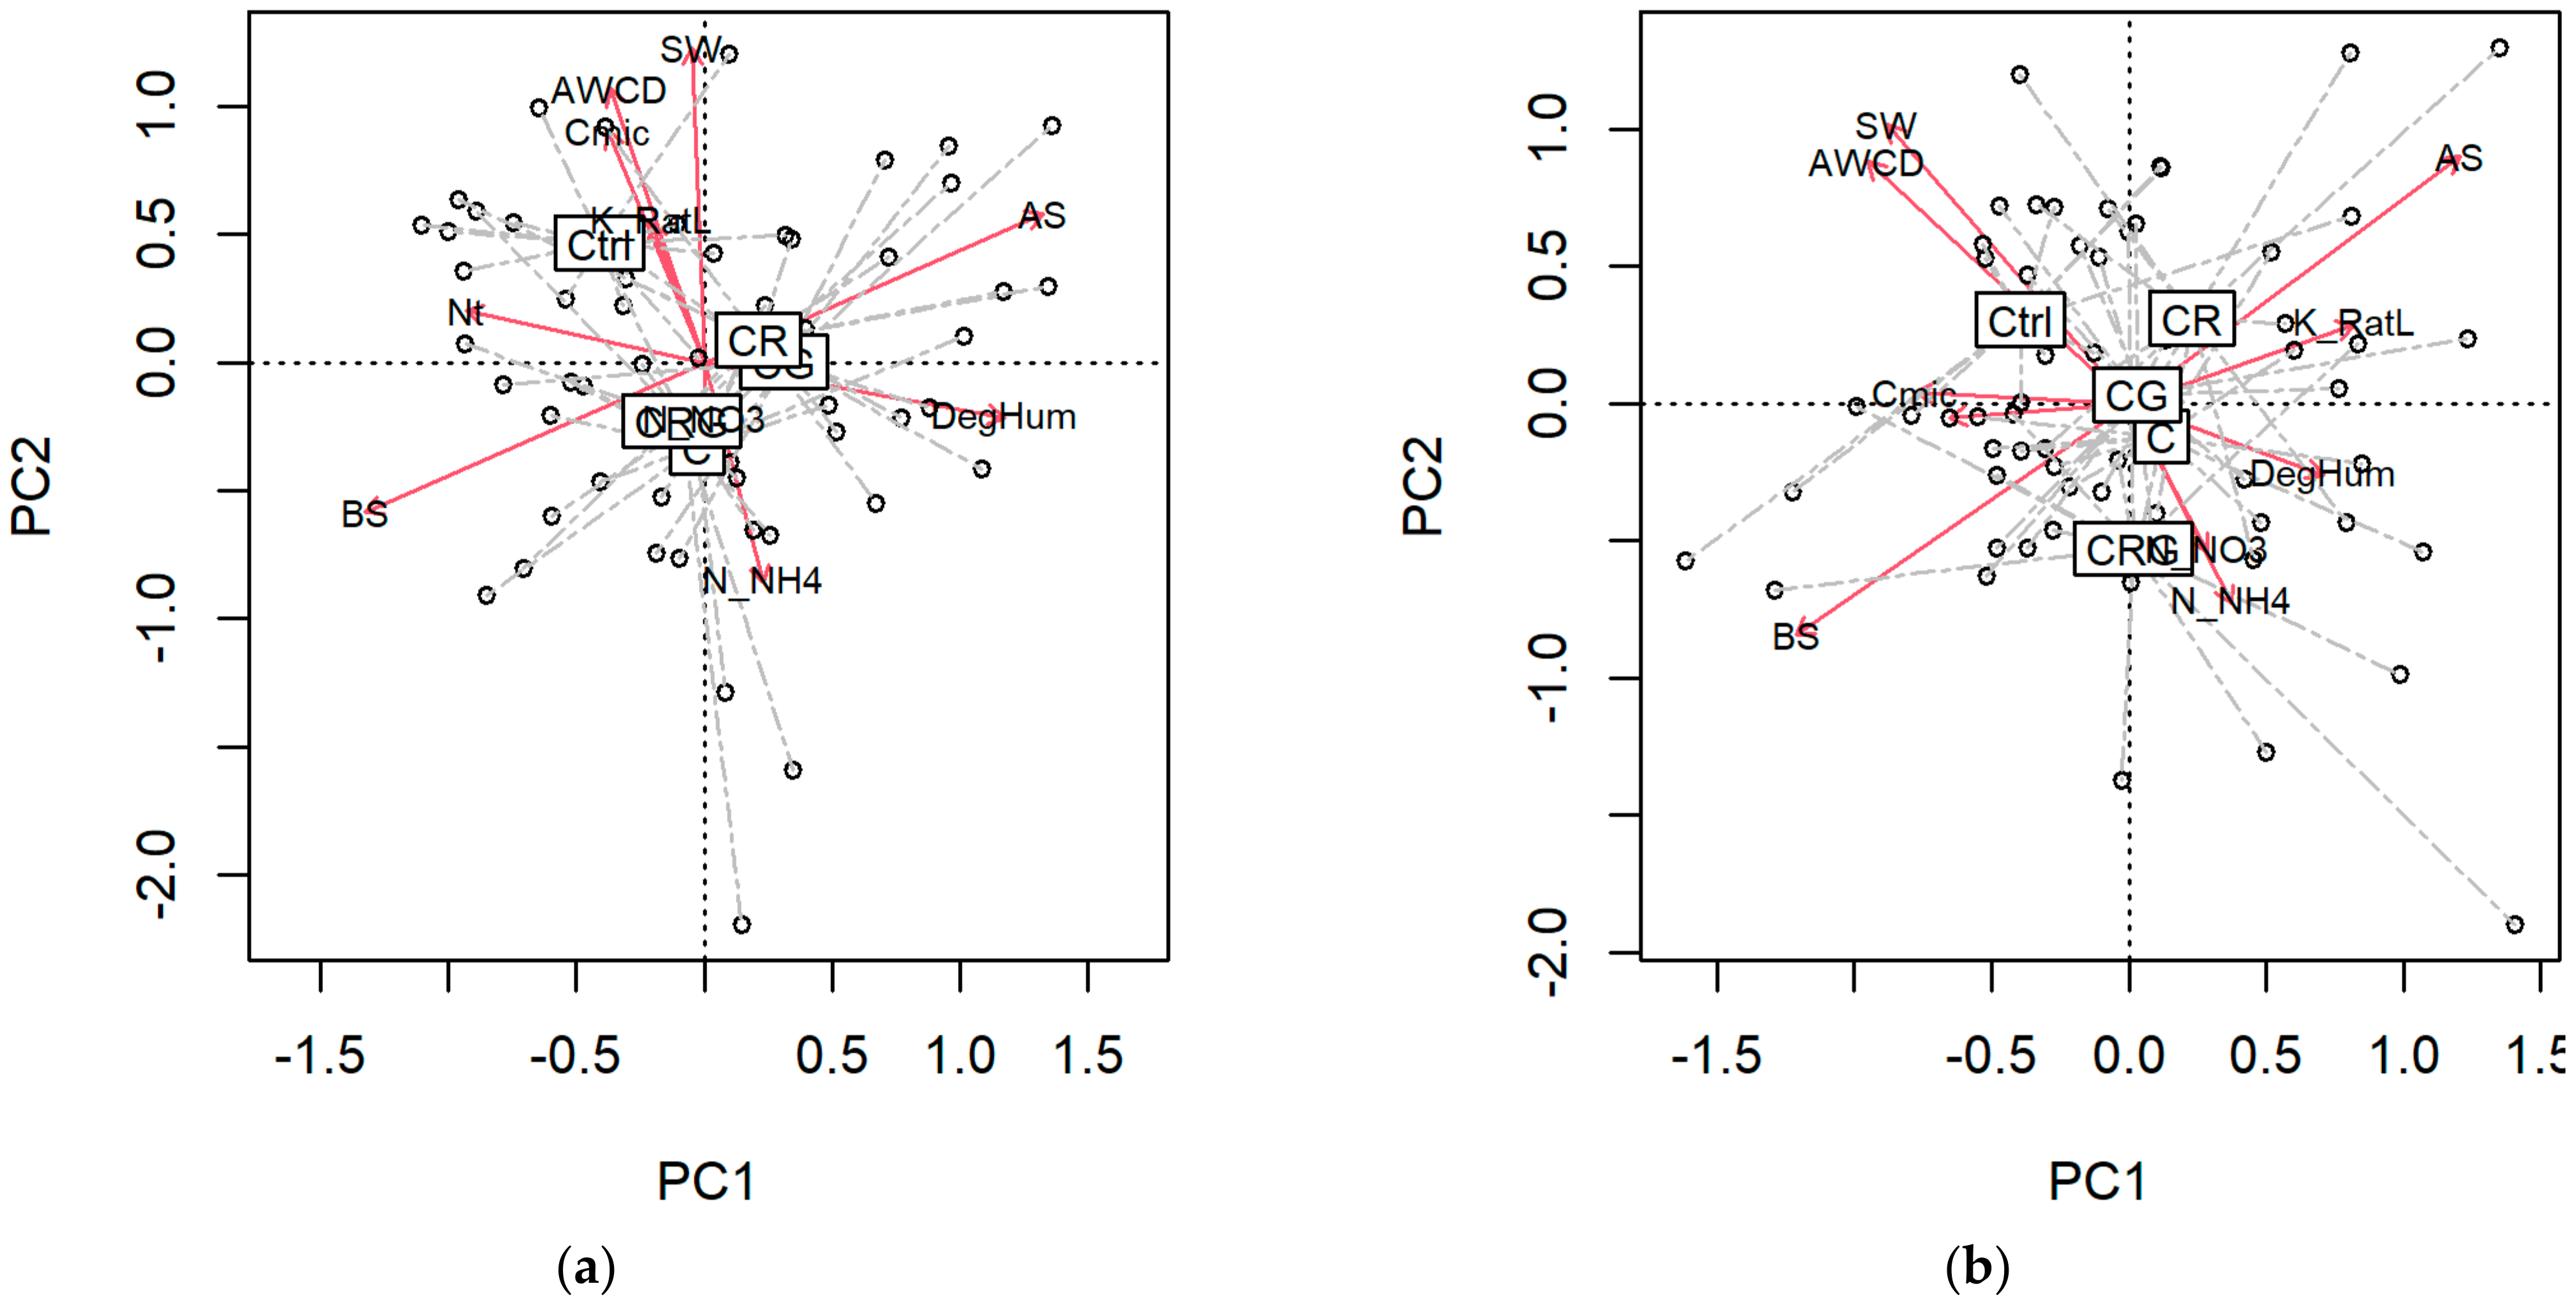
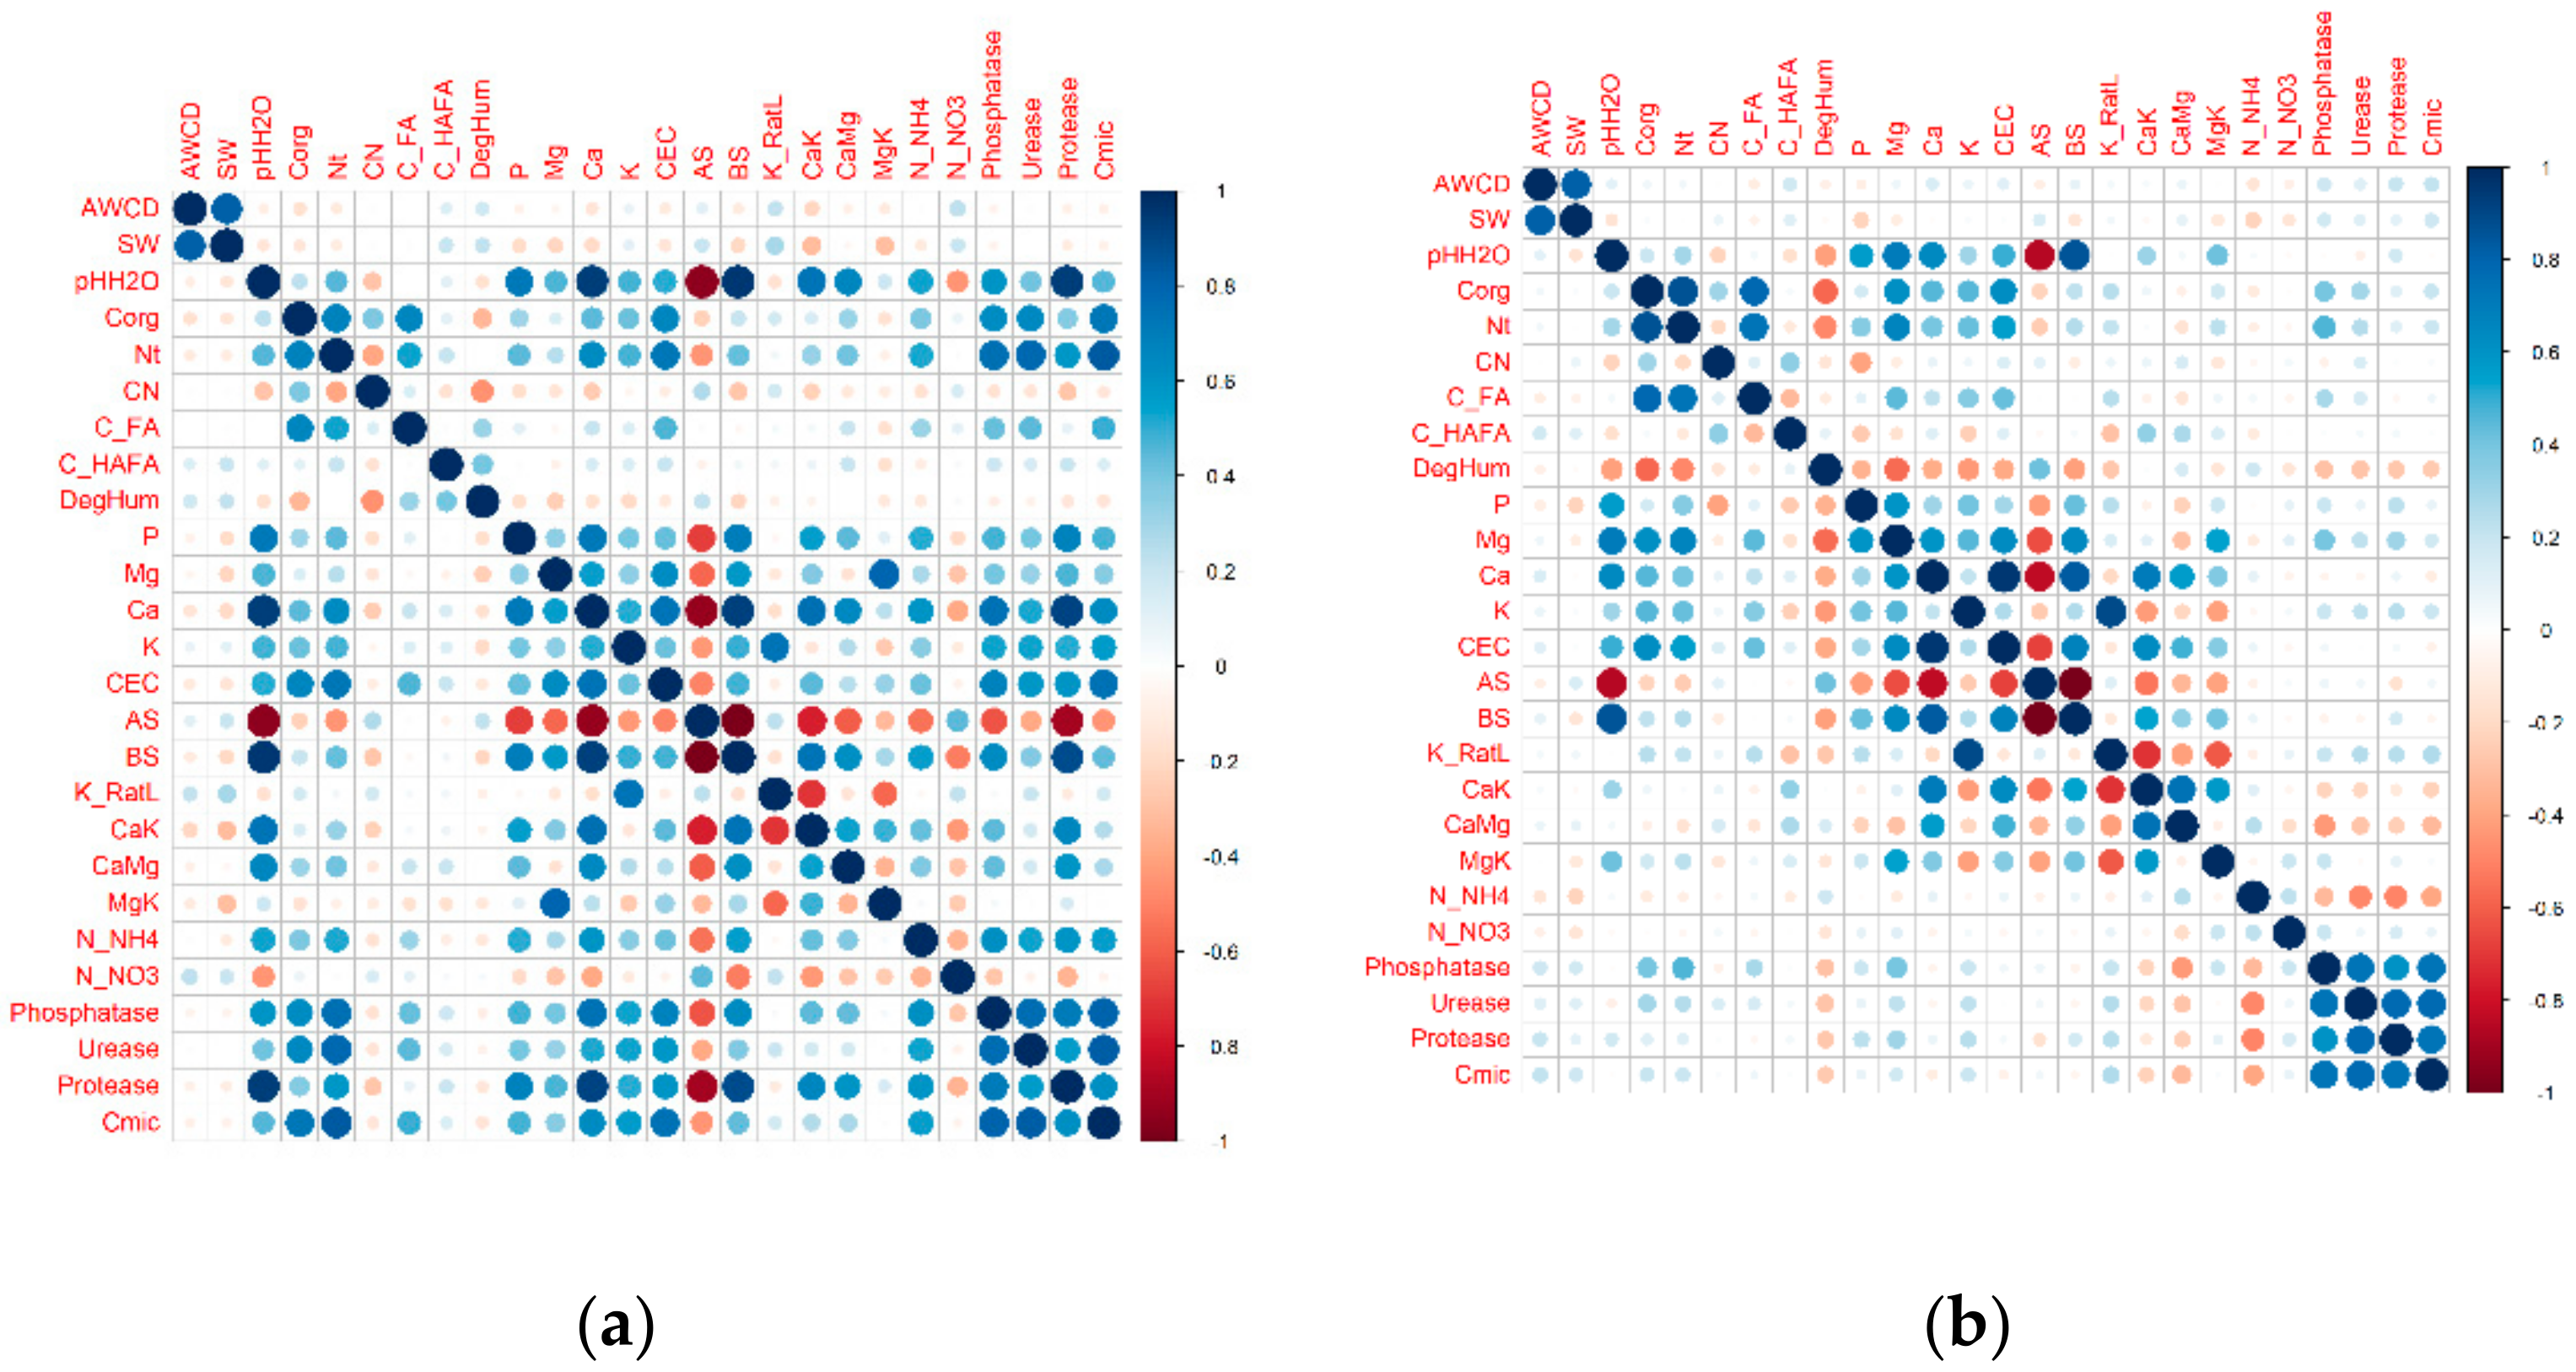
3.3. Diversity Indices and Multiple Relations

The diversity index development over the whole incubation time is shown in Figure S1. The AWCD index showed the highest values in the Ctrl sites during the whole incubation time and the lowest values since the 168th hour of reading in the CRG. At 384 h of incubation, both the AWCD and S–W indices showed similar results (Table 2). Similar and symmetrical distributions of these values were observed especially in the AWCD values, with the lowest variability and the highest median recorded in the Ctrl plots. The S–W index was characterized by a slightly right-skewed distribution under the CR treatment. The highest soil spatial heterogeneity was in the CRG plots (Figure 2).
Figure 3 shows the results of the PCA analysis for the soil properties surveyed in 2018 (Figure 3a) and the changes in the soil properties measured one season after the establishment of the plots (Figure 3b). In 2018, principal component (PC) 1 was mainly connected with chemical properties. Acid saturation was negatively correlated with total nitrogen and base saturation, and positively correlated with the degree of humification. PC2 was positively correlated with enzymatic activity (represented by Cmic), with the functional diversity indices and with K-ratio law. PC2 was negatively correlated with the mineral nitrogen contents. The treatment levels were clustered around the center of the factorial plane except for the Ctrl plots, which corresponded with the positive PC2 values.
Figure 3b reflects changes measured in the soil properties during one season. The Ctrl and CRG plots underwent the most distinct treatments, i.e., a nonintervention treatments and the highest management intensity. The soil properties in control plots remained in their original positions in correlation with the diversity indices whereas those of the CRG plots shifted towards negative PC2 values defined by mineral nitrogen. The remaining treatments were clustered around the center of the diagram. The nonintervention treatment still followed the pattern of the functional diversity trend (the highest in this treatment), while the CRG plots monitored the soil dynamics, reflecting the strongest disturbance by means of mineral forms of nitrogen.
Regarding the relationships of soil properties in correlation matrices (Figure 4), the diversity indices (measured only in 2018) were more correlated with the soil properties assessed in 2017 (Figure 4a) than those assessed in 2018 (Figure 4b). The relationships obtained in 2018 were affected by the disturbances, which was also evident regarding the enzyme activities and chemical property correlations. While in 2017 the correlation coefficient reached a significant value of 1 (obviously higher than 0.5 or lower than −0.5), in 2018 the correlations were very weak. In 2017, all enzyme activities were strongly correlated with the soil reactions, calcium contents and base saturation (and with the other chemical properties). In 2018, the correlation coefficients substantially decreased under a significance level of 0.250, and the ammonia nitrogen contents switched in their coefficient values from positive to negative correlations with all enzymes.
The measurement of substrate absorbance participation on the AWCD index is shown graphically in Figure 5 and in a numerical form in the Supplementary Material (Table S1). The substrate consumption was found to be heterogeneous mainly for compound groups of amino acids (L-arginine, L-serine, L-threonine) and then for putrescine, D-cellobiose and glycogen, and partially also for 4-hydroxybenzoic acid and D-galactonic acid-gamma-lactone.
As demonstrated in Figure 6 and Figure S2, the weakest reliance of diversity index on activity of particular substrate was in Ctrl, which contradicted specifically with the CRG plots as well as with all the management practices. This situation was analogous in the dependency of the S–W index on the overall activity of the compound groups (Figure S3).

4. Discussion

The microbial communities of forest soils are affected by several factors [59,60,61]. In our study, we measured early responses of soil parameters and soil microbial functional diversity to traditional forest management practices. The outcomes of this study confirm our hypotheses that in many soil parameters the effects of different management practices are ambiguous after one season. This is due to the different robustness or ’sensitivity‘ levels of soil properties. At the same time, management changes result in reductions in microbial functional diversity. As the outputs of this short-term study were not directly recognizable, we explain the results, including several issues, in the sections that follow.

4.1. Soil under Influence of Traditional Management

The traditional management of forests in the European region, both due to the intensity and duration of management measures, has substantially influenced fertility and overall soil chemistry in a long-term outlook.
According to numerous authors [62,63,64,65,66], coppicing leads to root-to-shoot ratio imbalances, the thinning of organic soil layers due to accelerated mineralization and, consequently, nutrient losses from the forest floor. Coppicing is considered to be the cause of soil degradation due to acidification and soil genetic processes leading to accelerated soil profile differentiation, as reported in historical studies starting in the 1950s [23,67]. On the other hand, Hölscher et al. [68] showed increases in both pH and the concentrations of exchangeable cations in a 20-year-old coppice forest on acidic soils in the organo-mineral horizons, corresponding with our results, albeit in a shorter time interval. Coppicing does not limit the accessibility of nutrients in soils, nor does it impoverish the soil environment [68].
A study from Mediterranean oak stands in Italy [69] also showed increased pH after three years of coppicing, as opposed to the organic carbon content. This increase in pH was explained by decreased root exudation associated with increasing H+ concentration in soil solution, and by release of nutrients from organic bonds in the forest floor. The work also reported the response of soil microbiota to coppicing in terms of their functional diversity. The microbiota responded to active management by increasing their amount of microbial biomass and their respiratory and enzymatic activity by up to 47.8%. In our research, increase in Cmic was observed in three of the five treatments, including the nonintervention treatment, but these increases were not statistically significant.
Similar conclusions were presented in a short-term study from hardwood forests near the town of Saranac, New York, that were converted to pastures and silvopastures [18]. During the two years following these conversions, the percentage of nitrogen and phosphorus increased compared to the woodlot and pretreatment levels, while the observed decrease in pH was not statistically significant. Similarly, other nutrient contents did not manifest significant trends that were dependent on the treatment, even when compared with the pretreatment values.
Litter raking may be equivalent in effect to acidification by atmospheric deposition in the 20th century [16]. In the study conducted in the Slavkov Forest and Ore Mountains (Czech Republic) with Norway spruce (Picea abies (L.) H. Karst.), one litter raking depleted the soil exchangeable base cation pool by up to 31%, and the overall nutrient loss exceeded the annual inputs by atmospheric deposition and weathering. Some authors mention the possibility of compensating for soil depletion due to litter raking through atmospheric nitrogen deposition [2,7]. Strong pH decreases and base cation leaching following litter removal were observed in the leaf-rich Luzulo–Fagetum habitat of the Schwarzwald forest [70], which we could not confirm via single-season data. However, these acidification and related degradation processes were also confirmed by Dzwonko and Gawroński [2], who investigated the effect of litter raking on soils in a 16-year-old study. They revealed the expected substantial nutrient impoverishment of the soil (mainly P, Mg and Ca together with the cation exchange capacity) in the H and A horizons and the lessivage layer.
The impacts of litter raking not only include nutritional impoverishment but also include changes in organic carbon inputs, soil moisture levels, surface temperatures, soil surface fauna and understory vegetation. In our study, litter raking combined with coppicing had an insignificant effect on the diversity index after one season. The lowest microbial functional diversity was found merely in the plots in which all three types of management were combined.

4.2. Factors Influencing Soil Response Measure

In our study, increased concentrations of phosphorus and bivalent bases were detected after one year, with the highest increase observed in the CRG plots.
Despite the general assumption that traditional management significantly affects the soil environment, in our treatise, management cannot be clearly attributed to this influence for the following reasons: (1) The soil environment is characterized not only by temporal heterogeneity but also by spatial heterogeneity within blocks and plots. Another reason (2) is the characteristics of short-term data, as the changes in soil did not yet display significant differences over the short time. The third reason (3) involves microclimatic conditions, i.e., the extremely low precipitation totals and soil moisture levels recorded in 2017 and 2018.

4.2.1. Soil Spatial Diversity

Variability in the data (Table 3) was mostly higher in the instance of blocks (where n = 12) than among plots (where n = 4). This result has also been confirmed by several authors [18,71,72,73]. The spatial heterogeneity of blocks was higher in 2017 than in 2018 (Table 3), especially in the CR plot. We attribute this result to the intensive disturbance conducted in this plot, which led to the homogenization of soil under equal intensities of external factors. We attribute the prominent increase in N-NO3- variability in the CRG block to the reduced root exudation [74] and to the additional input of N from feces. Compared with the remaining soil properties, the S–W index demonstrates a more homogenous soil environment (expressed by the carbon source consumption) in the Ctrl plot; this plot showed very similar values when comparing the variability among blocks and plots.

4.2.2. Temporal Aspect of Changes in Soil Environment

This study monitored the immediate response of the soil environment. Management changes had a systemic effect on some soil properties after one season, while other properties showed no apparent trends.
Responses in microbial biomass and metabolic activity were monitored by Chen et al. [61] following a management change after more than five years, and significant differences were measured using a paired comparison design. The results showed a decrease of microbial biomass due to increased nutrient uptake by trees. This trend clearly did not occur with Cmic in our study; however, it can be expected in the subsequent hypotheses. We noted distinctive decreases in phosphatase, urease and protease activities and in microbial biomass in C (42, 27, 29 and 27%, respectively) during one season, despite the other treatments in which the control confirmed no disturbance and reflected common stand conditions and soil seasonal dynamics.
As also reported by Bürgi and Gimmi [12], no rapid soil chemistry changes can be expected after litter raking. At the same time, we lack long-term data on the response of the soil environment (a fortiori, soil microbiota) to traditional management practices, as studies of traditional management have thus far given insufficient attention to the plant–soil relationship from the landscape perspective [14,22]. Soil changes over a 40-year horizon were addressed in four different soil taxonomical units by Hédl and Rejšek [75] at the soil texture, soil reaction, carbonates and organic carbon content levels. In addition to the incompatibility of laboratory methods, which represent a problem in pedological long-term studies [76,77], the authors concluded that the temporal changes were insignificant, and neither the leaching of carbonates nor decreases in soil reaction joined with acidification or soil environment impoverishment occurred due to nutrient depletions. Alterations in soil properties on a physicochemical basis can be expected with an uncertain trend due to the buffering capacity [78].

4.2.3. Microclimate Limitations

Changes in the climate and seasonal dynamics can influence the common behaviors of soil microbiota in the context of disturbances and forestry adaptation strategies. In our study, the soil moisture fell below 10% during the 2018 growing season [71]. The nature of the causes of low soil moisture varied between 2017 (when the low soil moisture originated from below-average precipitation and was escalated by the water suction function of the forest stand involved) and 2018 (when the water deficit came mainly from low precipitation totals). Thus, the lack of water as a key soil medium did not mediate sufficient cation exchanges, as did the expected eradication of nutrient leaching in the mineralization process.
The relationship between functional diversity and ecological stability, underlined by environmental conditions (e.g., the moisture regime), was specified in Hallett’s [79] study focused on grazed ecosystems. Functional diversity was found to rapidly decline under wet conditions of grazed systems, while it was maintained (not elevated) under drier conditions (cf., [80]). In addition, grazed systems with greater functional diversity have been found to be more environmentally stable across varied moisture conditions.
The responses of microbial communities are markedly associated with environmental conditions but less with management (as in our research paper) or plant species compositions, according to Howes´ study [81]. Nevertheless, he worked with the soil-limiting systems of Michigan (USA) dunes, i.e., a more preliminary system development. He revealed significant relations between functional diversity and the organic matter content, temperature, distance from a forest and surface detritus thickness.
The environmental limitation of microbial activity was also discussed in a study by Rosíková et al. [82]. In that work, the amelioration effect (effect of forest management practice) expressed as CO2 efflux from the soil surface was obscured by environmental limitations such as drought and low temperatures. Hence, the results showed substantial seasonal dynamics that, however, could not be attributed to the treatments of the amelioration experiment.

4.3. Substrate Consumption Level, Diversity Indices and Metabolic Profile

The approaches used to assess soil functional diversity differ depending on the use of different methods. The abilities and limits of the EcoPlateTM method have been discussed in several studies [83,84]. In general, EcoPlateTM metabolic profiles provide a better understanding of in situ ecological and ecosystem functions that are based on metabolic activities. The BIOLOG EcoPlateTM system expresses the metabolism of carbon sources as a key factor associated with the development of microbial biomass [52,85,86]. However, fungi are only included in the metabolic profile to a limited extent (they experience slow growth due to the incubation duration). In addition, we obtained information only about culturable microorganisms, while during incubation, changes may have occurred in the structure of the microbial community. This is also why we applied the determination of the enzymatic activity. The EcoPlateTM system better reflects the presence of low-molecular-weight organic compounds in the soil that are bound to the exudation of the physiologically active root system. Enzymatic activity captures the ability of the soil to hydrolyze complex polymers into simple compounds, capturing the state of the soil following disturbances associated with extremely heavy thinning (88% of the stock volume in our case) or other management changes (in our case, litter raking and grazing).
In a three-year-long study by Pignataro et al. [86] conducted in central Italy (Quercus cerris spp.), a decrease in the total organic carbon and an increase in pH were observed. The AWCD index was higher in aged coppice stands than in three-year-old coppice stands. In contrast, the activity of microbial enzymes increased in the coppiced soil, suggesting that different analytical approaches target diverse ecological processes depending on the quality of the available substrates. In contrast, the results of our study suggest higher diversity indices in the nonintervention treatment, demonstrating nonextremeness and the balance of food and metabolic soil relations at the microbiological level. As we stated in our hypotheses, the disturbances led to reductions in the diversity indices and thus reductions in specific functional groups of soil microorganisms, but the enzymatic activity itself did not yet show any clear response.
Regarding the partial substrate consumption uniformity, the results of which contradict those of the Pignataro study [87], the majority of substrates revealed rather similar reactions when the treatments were compared. The exceptions include the substrates mentioned above, which were consumed differently among the treatments. Some carbon sources were detected as displaying either uniform high activity or low activity, for which the uniform presence or absence of the substrate consumers was detected, respectively (Figure 6; see also Figure S2 for the carbon sources and Figure S3 for the compound groups).

4.4. Multivariate Soil Responses and Disturbance Regime

The relations between disturbance events and soil microbial community responses were studied by Gömöryová et al. [88] on windthrow plots in the Tatra Mountains of Slovakia. They revealed the highest microbial activity and biomass in reference and fire plots with burnt organic matter in comparison with extracted and nonextracted plots. However, the trend of microbial response development corresponded mainly with time after the windthrow season × treatment interactions. The results were attributed to ’unstressed‘ microbial communities in the undisturbed reference plot and to a reduction in the surface organic layer and enrichment of organo-mineral horizons by released nutrients in the burnt plot. Compared with our results, the microbial diversity did not show any significant differences despite such extremely different habitats.
The complexity of soil systems cannot be denied, as shown in Figure 4 via the correlation matrices. The correlation matrices demonstrate the acidifying effect of the increased nitrate nitrogen concentration. The correlation was significant before treatments (Figure 4a) but not after the disturbances (Figure 4b). The correlation of the S–W index with the initial soil state was slightly statistically significantly (Figure 4a) positive with the K-ratio law and, subsequently, negative with the Ca/K and Mg/K ratios at similar correlation coefficient values (0.28; −0.31 and −0.31, respectively). In all three cases, these results indicate a positive response in the diversity index in relation to the amount of potassium in the soil. The S–W index was also (insignificantly) positively correlated with the C-HA/FA ratio and the degree of humification (with coefficients of 0.20 and 0.22, respectively). Simultaneously, the AWCD index was significantly positively correlated with the calcium content.
Likewise, in the study of Vuong et al. [89], strong correlations between soil diversity indices and enzyme activities were not detected. In 2017, the enzyme activity was positively correlated with the K, Corg and Nt contents, with CEC and especially with pH/H2O, which also confirmed the findings in the studies of Błońska et al. [90] (urease activity), Adamczyk et al. [91] (protease, phosphatase activities) and Klose and Tabatabai [92] (phosphatase activity). In contrast, negative correlations between the soil reaction and enzyme activity were described by Tan et al. [93], and specifically with phosphatase activity by Šarapatka and Kršková [94]. Therefore, as reported in other studies [86], the chemical properties and the characteristics of the soil sorption complex, which indicate the characteristics of soil chemistry, together determine the microbial environment and the state and composition of the soil microbial communities. Regarding Figure 4b, the relationships substantially depend on the measure of disturbance, leading to decreases or even to changes in the signs of the correlations.
Likewise, in the work of Pignataro [87], treatments influenced the functional diversity by causing deviations from the balanced microbial community composition with a high diversity index. Numerous studies have reported a direct link between biological diversity and ecosystem stability [52,95,96]. This relation can be perceived as a feedback mechanism. Therefore, disturbances may result in reduced ecosystem stability and hence in reduced soil microbial functional diversity.
In our study, six months after the experiment was established, the individual treatments could still be perceived simply as thinned areas. A gradual increase in the importance of the treatments for the spatial differentiation of the soil environment in relation to specific management practices can be expected. The changes were linked to the disturbances and to the consequent mineralization of organic matter in the forest floor or the enrichment of nitrogen components by nitrification or grazing [97] (the changes in Cmic were statistically insignificant in our study). We also expect the following changes in the composition and metabolic profile of the microbial community. Zhang et al. [97] noted these changes after three years in semiarid temperate steppe conditions, which characterize a water-limiting environment in terms of biological activity. In our study, this trend was already demonstrated after a short time response (Figure 3), in which the concentration values of the mineral forms of nitrogen and the diversity index values were negatively correlated.
Although some differences could already be seen after such a short period of time, it was not possible to predict clear or unchanging trends in the dynamics of soil properties with certainty [64]. However, silvopastures are perceived by many authors [18,19] as beneficial and preserving in terms of agroforestry systems being an adaptive strategy under global climate change.

5. Conclusions

This study focused on the responses of soils to extremely heavy thinning (88% of stock volume) and subsequent litter raking and grazing. An alteration in microbial functional diversity occurred after one observation season. Microbial functional diversity was reduced compared to the parental forest stand and was differentiated according to the treatments in some parameters. In addition to the microbial functional diversity, the interventions also affected other soil characteristics, such as soil reaction (significant increase in stand in which a combination of thinning, litter raking and grazing was applied), nitrate nitrogen content (similar reactions with more distinct differentiations related to the nonintervention status of the stand), acid phosphomonoesterase activity (decreased activity was observed, especially in the thinned stands) and the microbial carbon content (the most significant increases compared to the nonintervention state were observed at the plots where thinning, litter raking and grazing were combined).
A better comprehension of soil metabolic processes contributes to the consideration of appropriate adaptation strategies during environmental changes. In subsequent studies, more unequivocal and increasing differentiations in relation to individual traditional management types can be expected. Further studies may also be focused on the closely related water regime of the forest soil in a particular habitat, which also closely affects soil microbiota activities.

Supplementary Materials

The following data are available online at https://www.mdpi.com/article/10.3390/f12091187/s1, Figure S1: (a) the mean values and confidence intervals of the average well color development (AWCD) and (b) the Shannon–Wiener diversity index development of the metabolized substrates in Biolog EcoPlates based on a 384 h incubation (n of replications = 12). C—cut; CR—cut/raking; CG —cut/grazing; CRG—cut/raking/grazing; Ctrl—control treatment without disturbance. Bars show 95% confidence intervals, Table S1: Utilization pattern of the 31 carbon substrates used for the treatments; ’sd abs‘ is the standard deviation of the absorbance within three replications in the plate, and ’deg AWCD‘ is the absorbance value related to the quantile and AWCD value of the plate (1: <1st quartile; 2: <median; 3: <AWCD; 4: <3rd quartile; 5: >3rd quartile). Figure S2: Shannon–Wiener diversity index values within treatments as a function of carbon sources (C—cut; CR—cut/raking; CG—cut/grazing; CRG—cut/raking/grazing; Ctrl—control). Figure S3: Shannon–Wiener diversity index values within treatments as a function of compound groups (C—cut; CR—cut/raking; CG—cut/grazing; CRG—cut/raking/grazing; Ctrl—control).

Author Contributions

Conceptualization, A.K.; methodology, A.K.; formal analysis, A.K. and M.K.; investigation, A.K., L.H., J.R. and T.V.; writing—original draft preparation, A.K., M.F. and J.K.; writing—review and editing, all authors; visualization, R.K., M.K. and A.K.; supervision, D.V.; project administration, B.U.; funding acquisition, B.U. All authors have read and agreed to the published version of the manuscript.

Funding

This research received funding from the Specific University Research Found of the FFWT Mendel University in Brno, grant number LDF_TP_2020005 and from the European Union’s H2020 Research and Innovation Programme under Grant Agreement No. 952314.

Institutional Review Board Statement

Not applicable.

Informed Consent Statement

Not applicable.

Data Availability Statement

The data presented in this study are available on request from the corresponding author.

Acknowledgments

Acknowledgements belong to those who participated in designing and implementing the study: Eva Dařenová, Jiří Skládanka, Martin Pavelka, Tereza Uchytilová, Florián Vojtek, Matěj Kostka, Zdeněk Adamec, Tomáš Slach and Jan Šebesta. Special thanks belong to the colleagues at the Louisiana State University, AgCenter, Michael Blazier and Lewis Gaston, for their contribution to the methodological advancement of the Geology and Soil Science Department (MENDELU). Very special thanks also go to Markus Gorfer (AIT, Austria) for enriching manuscript consultations.

Conflicts of Interest

The authors declare no conflict of interest. The funders had no role in the design of the study; in the collection, analyses, or interpretation of data; in the writing of the manuscript, or in the decision to publish the results.

References

  1. Jabiol, B.; Jévy, G.; Bonneau, M.; Brêthes, A. Comprendre les Sols Pour Mieux Gérer les Forêts, 1st ed.; AgroParisTech ENGREF: Nancy Cedex, France, 2009; 624p. [Google Scholar]
  2. Dzwonko, Z.; Gawroński, S. Effect of litter removal on species richness and acidification of a mixed oak-pine woodland. Biol. Conserv. 2002, 106, 389–398. [Google Scholar] [CrossRef]
  3. Gimmi, U.; Bürgi, M.; Stuber, M. Reconstructing anthropogenic disturbance regimes in forest ecosystems: A case study from the Swiss Rhone valley. Ecosystems 2008, 11, 113–124. [Google Scholar] [CrossRef] [Green Version]
  4. Koerner, W.; Dupouey, J.L.; Dambrine, E.; Benoit, M. Influence of Past Land Use on the Vegetation and Soils of Present Day Forest in the Vosges Mountains, France. J. Ecol. 1997, 85, 351–358. [Google Scholar] [CrossRef]
  5. Dupouey, J.L.; Dambrine, E.; Laffite, J.D.; Moares, C. Irreversible Impact of past Land Use on Forest Soils and Biodiversity. Ecology 2002, 83, 2978–2984. [Google Scholar] [CrossRef]
  6. Aggestam, F.; Konczal, A.; Sotirov, M.; Wallin, I.; Paillet, Y.; Spinelli, R.; Lindner, M.; Derks, J.; Hanewinkel, M.; Winkel, G. Can nature conservation and wood production be reconciled in managed forests? A review of driving factors for integrated forest management in Europe. J. Environ. Manag. 2020, 268, 110670. [Google Scholar] [CrossRef]
  7. Douda, J.; Boublík, K.; Doudová, J.; Kyncl, M. Traditional forest management practices stop forest succession and bring back rare plant species. J. Appl Ecol. 2017, 54, 761–771. [Google Scholar] [CrossRef]
  8. Kadavý, J.; Adamec, Z.; Uherková, B.; Kneifl, M.; Knott, R.; Kučera, A.; Friedl, M.; Dařenová, E.; Skládánka, J.; Drápela, K. Growth response of sessile oak and European hornbeam to traditional coppice-with-standards management. Forests 2019, 10, 515. [Google Scholar] [CrossRef] [Green Version]
  9. Vild, O.; Kalwij, J.M.; Hédl, R. Effects of simulated historical tree litter raking on the understorey vegetation in a central European forest. Appl. Veg. Sci. 2015, 18, 569–578. [Google Scholar] [CrossRef] [PubMed] [Green Version]
  10. Forest Act No. 289/1995 Coll., On Forests, Under Article 20. Available online: https://www.zakonyprolidi.cz/cs/1995-289 (accessed on 17 September 2020).
  11. Debussche, M.; Debussche, G.; Lepart, J. Changes in the vegetation of Quercus pubescens woodland after cessation of coppicing and grazing. J. Veg. Sci. 2001, 12, 81–92. [Google Scholar] [CrossRef]
  12. Bürgi, M.; Gimmi, U. Three objectives of historical ecology: The case of litter collecting in Central European forests. Landsc. Ecol. 2007, 22, 77–87. [Google Scholar] [CrossRef] [Green Version]
  13. Mayer, M.; Prescott, C.E.; Abaker, W.E.A.; Augusto, L.; Cécillon, L.; Ferreira, G.W.D.; James, J.; Jandl, R.; Katzensteiner, K.; Laclau, J.-P.; et al. Tamm Review: Influence of forest management activities on soil organic carbon stocks: A knowledge synthesis. For. Ecol. Manag. 2020, 466, 118127. [Google Scholar] [CrossRef]
  14. Hédl, R.; Kopecký, M.; Komárek, J. Half a century of succession in a temperate oakwood: From species-rich community to mesic forest. Divers. Distrib. 2010, 16, 267–276. [Google Scholar] [CrossRef]
  15. Gimmi, U.; Poulter, B.; Wolf, A.; Portner, H.; Weber, P.; Bürgi, M. Soil carbon pools in Swiss forests show legacy effects from historic forest litter raking. Landsc. Ecol. 2013, 28, 835–846. [Google Scholar] [CrossRef] [Green Version]
  16. Hofmeister, J.; Oulehle, F.; Krám., P.; Hruška, J. Loss of nutrients due to litter raking compared to the effect of acidic deposition in two spruce stands, Czech Republic. Biogeochemistry 2008, 88, 139–151. [Google Scholar] [CrossRef]
  17. Schulz, K.; Voigt, K.; Beusch, C.; Almeida-Cortez, J.S.; IngoKowarik, I.; Walz, A.; Cierjacks, A. Grazing deteriorates the soil carbon stocks of Caatinga forest ecosystems in Brazil. For. Ecol. Manag. 2016, 367, 62–70. [Google Scholar] [CrossRef]
  18. Orefice, J.; Smith, R.G.; Carroll, J.; Asbjornsen, H.; Kelting, D. Soil and understory plant dynamics during conversion of forest to silvopasture, open pasture, and woodlot. Agrofor. Syst. 2017, 91, 729–739. [Google Scholar] [CrossRef]
  19. Stewart, A.; Coble, A.; Contosta, A.R.; Orefice, J.N.; Smith, R.G.; Asbjornsen, H. Forest conversion to silvopasture and open pasture: Effects on soil hydraulic properties. Agrofor. Syst. 2020, 94, 869–879. [Google Scholar] [CrossRef]
  20. Kadavý, J.; Servus, M.; Knott, R.; Hurt, V.; Flora, M. Nízký a Střední les Jako Plnohodnotná Alternativa Hospodaření Malých a Středních Vlastníků Lesa, 1st ed.; Lesnická Práce, s.r.o.: Kostelec nad Černými lesy, Czech Republic, 2011; 294p. [Google Scholar]
  21. Zhu, W.Z.; Xiang, J.S.; Wang, S.G.; Li, M.H. Resprouting ability and mobile carbohydrate reserves in an oak shrubland decline with increasing elevation on the eastern edge of the Qinghai-Tibet Plateau. For. Ecol. Manag. 2012, 278, 118–126. [Google Scholar] [CrossRef]
  22. Müllerová, J.; Szabó, P.; Hédl, R. The rise and fall of traditional forest management in southern Moravia: A history of the past 700 years. For. Ecol. Manag. 2014, 331, 104–115. [Google Scholar] [CrossRef] [Green Version]
  23. Pelíšek, J. Stanovištní poměry pařezin v oblasti ČSR. Sborník Ceskoslov. Akad Zemědělských Věd 1957, 3, 85–108. [Google Scholar]
  24. Kupec, P.; Kučera, A.; Kadavý, J.; Kneifl, M. Contribution to a discussion on the influence of coppicing on soil environment. J. For. Sci. 2015, 61, 216–224. [Google Scholar] [CrossRef] [Green Version]
  25. Chodak, M.; Klimek, B.; Azarbad, H.; Jaźwa, M. Functional diversity of soil microbial communities under Scots pine, Norway spruce, silver birch and mixed boreal forests. Pedobiologia 2015, 58, 81–88. [Google Scholar] [CrossRef]
  26. Tedersoo, L.; Bahram, M.; Põlme, S.; Kõljalg, U.; Yorou, N.S.; Wijesundera, R.; Villarreal Ruiz, L.; Vasco-Palacios, A.M.; Quang Thu, P.; Suija, A.; et al. Global diversity and geography of soil fungi. Science 2014, 346, 1256688. [Google Scholar] [CrossRef] [Green Version]
  27. Ladygina, N.; Hedlund, K. Plant species influence microbial diversity and carbon allocation in the rhizosphere. Soil Biol. Biochem. 2010, 42, 162–168. [Google Scholar] [CrossRef]
  28. Zak, J.C.; Willig, M.R.; Moorhead, D.L.; Wildman, H.G. Functional diversity of microbial communities: A quantitative approach. Soil Biol. Biochem. 1994, 26, 1101–1108. [Google Scholar] [CrossRef]
  29. Aerts, R.; Honnay, O. Forest restoration, biodiversity and ecosystem functioning. BMC Ecol. 2011, 11, 1–10. [Google Scholar] [CrossRef] [PubMed] [Green Version]
  30. Cadotte, M.W.; Carscadden, K.; Mirotchnick, N. Beyond species: Functional diversity and the maintenance of ecological processes and services. J. Appl. Ecol. 2011, 48, 1079–1087. [Google Scholar] [CrossRef]
  31. Thom, D.; Taylor, A.R.; Seidl, R.; Thuiller, W.; Wang, J.; Robideau, M.; Keeton, W.S. Forest structure, not climate, is the primary driver of functional diversity in northeastern North America. Sci. Total Environ. 2021, 762, 143070. [Google Scholar] [CrossRef] [PubMed]
  32. Duveneck, M.J.; Scheller, R.M.; White, M.A. Effects of alternative forest management on biomass and species diversity in the face of climate change in the northern Great Lakes region (USA). Can. J. For. Res. 2014, 44, 700–710. [Google Scholar] [CrossRef]
  33. Escalas, A.; Hale, L.; Voordeckers, J.W.; Yang, Y.; Firestone, M.K.; Alvarez-Cohen, L.; Zhou, J. Microbial functional diversity: From concepts to applications. Ecol. Evol. 2019, 9, 12000–12016. [Google Scholar] [CrossRef] [Green Version]
  34. Klimek, B.; Chodak, M.; Jaźwa, M.; Solak, A.; Tarasek, A.; Niklińska, M. The relationship between soil bacteria substrate utilisation patterns and the vegetation structure in temperate forests. Eur. J. For. Res. 2016, 135, 179–189. [Google Scholar] [CrossRef] [Green Version]
  35. Tomao, A.; Bonet, J.A.; de-Miguel, C.S. How does forest management affect fungal diversity and community composition? Current knowledge and future perspectives for the conservation of forest fungi. For. Ecol. Manag. 2020, 457, 117678. [Google Scholar] [CrossRef]
  36. Viewegh, J.; Kusbach, A.; Mikeska, M. Czech forest ecosystem classification. J. For. Sci. 2003, 49, 85–93. [Google Scholar] [CrossRef] [Green Version]
  37. IUSS Working Group WRB. World Reference Base for Soil Resources 2014. In International Soil Classification System for Naming Soils and Creating Legends for Soil Maps, 1st ed.; World Soil Resources Reports No. 106; FAO: Rome, Italy, 2014; p. 203. [Google Scholar]
  38. Jabiol, B.; Brêthes, A.; Toutain, F.; Ponge, J.-F.; Brun, J.J. L´Humus Sous Toutes Ses Formes, 1st ed.; École Nationale du Génie Rural des Eaux et Forêts: Nancy, France, 1995; 63p. [Google Scholar]
  39. Van Calster, H.; Baeten, L.; Verheyen, K.; De Keersmaeker, L.; Dekeyser, S.; Rogister, J.E.; Hermy, M. Diverging effects of overstorey conversion scenarios on the understorey vegetation in a former coppice-with-standards forest. For. Ecol. Manag. 2008, 256, 519–528. [Google Scholar] [CrossRef]
  40. Adams, F.; Evans, C.E. A rapid method for measuring lime requirement of yellow podzolic soils. Soil Sci Soc. Am. J. 1990, 26, 355–357. [Google Scholar] [CrossRef]
  41. Sokolov, A.V. Determination of exchangeable Al in soil. Chem. Soc. Zemled. 1939, 7, 30–35. [Google Scholar]
  42. Mehlich, A. New extractant for soil test evaluation of phosphorus, potassium, magnesium, calcium, sodium, manganese and zinc 1. Commun. Soil Sci. Plant. Anal. 1978, 9, 477–492. [Google Scholar] [CrossRef]
  43. Zbíral, J.; Malý, S.; Váňa, M. Soil Analysis, Soil Survey Laboratory Methods Manual; Central Institute for Supervising and Testing in Agriculture: Brno, Czech Republic, 2011; Volume 3, p. 290. [Google Scholar]
  44. Kirk, P.L. Kjeldahl Method for Total Nitrogen. Anal. Chem. 1950, 22, 354–358. [Google Scholar] [CrossRef]
  45. Konova, M.; Bělčikova, N. Uskorennyje metody opredelenija sostava gumusa mineralnych počv. Počvovedenie 1961, 10, 75–87. [Google Scholar]
  46. White, R.E. Principles and Practice of Soil Science: The Soil as a Natural Resource, 4th ed.; Wiley-Blackwell: Oxford, UK, 2006; 376p. [Google Scholar]
  47. Rejšek, K.; Formánek, P.; Pavelka, M. Estimation of protease activity in soils at low temperatures by casein amendment and with substitution of buffer by demineralized water. Amino Acids 2008, 35, 411–417. [Google Scholar] [CrossRef]
  48. Kučera, A.; Holík, L.; Marosz, K.; Martiník, A.; Vavříček, D. Changes in forms of available nitrogen and respiration in soil of beech forest as a reaction to a deforestation resulting from wind storm. Acta Univ. Agric. Silvic. Mendel. Brun. 2013, 61, 107–113. [Google Scholar] [CrossRef] [Green Version]
  49. Kandeler, E.; Gerber, H. Short-term assay of soil urease activity using colorimetric determination of ammonium. Biol. Fertil. Soils 1988, 6, 68–72. [Google Scholar] [CrossRef]
  50. Rejšek, K. Acid phosphomonoesterase activity of ectomycorrhizal roots in Norway spruce pure stands exposed to pollution. Soil Biol. Biochem. 1991, 23, 667–671. [Google Scholar] [CrossRef]
  51. Islam, K.R.; Weil, R.R. Microwave irradiation of soil for routine measurement of microbial biomass carbon. Biol. Fertil. Soils 1998, 27, 408–416. [Google Scholar] [CrossRef]
  52. Xu, W.; Ge, Z. Application and Optimization of Biolog EcoPlates in Functional Diversity Studies of Soil Microbial Communities. MATEC Web Conf. 2015, 22, 1–6. [Google Scholar] [CrossRef] [Green Version]
  53. StatSoft Inc. STATISTICA (Data Analysis Software System); Version 12; StatSoft: Tulsa, OK, USA, 2013; Available online: http://www.statsoft.com (accessed on 17 September 2020).
  54. R Core Team. R: A Language and Environment for Statistical Computing; R Foundation for Statistical Computing: Vienna, Austria, 2017; Available online: http://www.R-project.org/ (accessed on 17 September 2020).
  55. Pielou, E.C. The measurement of diversity in different types of biological collections. J. Theor. Biol. 1996, 13, 131–144. [Google Scholar] [CrossRef]
  56. Shannon, C.E.; Weaver, W. The Mathematical Theory of Communications, 1st ed.; University of Illinois Press: Urbana, IL, USA, 1963; 131p. [Google Scholar]
  57. Oksanen, J.; Blanchet, F.H.; Friendly, M.; Kindt, R.; Legendre, P.; McGlinn, D.; Minchin, P.R.; O’Hara, R.B.; Simpson, G.L.; Solymos, P.; et al. ‘Vegan’ Community Ecology Package; Version 2.5–6; 2019. Available online: https://cran.r-project.org; https://github.com/vegandevs/vegan (accessed on 18 September 2020).
  58. Wickham, H.; Lionel, H.; Pedersen, T.L.; Takahashi, K.; Wilke, C.; Woo, K.; Yutani, H.; Dunnington, D. Create Elegant Data Visualisations Using the Grammar of Graphics. Package ggplot2 Version 3.3.0 for R Software for Statistical Computing. 2020. Available online: https://ggplot2.tidyverse.org/ (accessed on 21 September 2020).
  59. Rogers, P. Disturbance Ecology and Forest Management: A review of the Literature; General Technical Report INT-GTR-336; U.S. Department of Agriculture, Forest Service, Intermountain Research Station: Ogden, UT, USA, 1996; 16p. [Google Scholar]
  60. Van Calster, H.; Baeten, L.; De Schrijver, A.; Keersmaeker, L.D.; Rogister, J.E.; Verheyen, K.; Hermy, M. Management driven changes (1967–2005) in soil acidity and the understorey plant community following conversion of a coppice-with-standards forest. For. Ecol. Manag. 2007, 241, 258–271. [Google Scholar] [CrossRef]
  61. Chen, F.; Zheng, H.; Kai, Z.; Ouyang, Z.; Lan, J.; Li, H.; Shi, Q. Changes in soil microbial community structure and metabolic activity following conversion from native Pinus massoniana plantations to exotic Eucalyptus plantations. For. Ecol. Manag. 2013, 291, 65–72. [Google Scholar] [CrossRef]
  62. Mohr, D. Soil Degradation in simple Oak Coppice Forests of the Ahr-Eifel. Implications for Forest Management Derived from Soil Ecological Studies. Ph.D. Thesis, Universität zu Köln, Cologne, Germany, 2004. [Google Scholar]
  63. Sasaki, N.; Putz, F.E. Critical need for new definitions of “forest” and “forest degradation” in global climate change agreements. Conserv. Lett. 2009, 2, 226–232. [Google Scholar] [CrossRef]
  64. Papaioannou, A.G. Assessment of the Empirical Management Method of Coppice Chestnut (Castanea sativa Mill.) Forests Practiced by the Monks and its Effect on the Availability of Forest Soil Resources in Mount Athos, Greece. Not. Bot. Horti Agrobot. Cluj-Napoca 2013, 41, 317–325. [Google Scholar] [CrossRef] [Green Version]
  65. Salomón, R.; Rodríguez-Calcerrada, J.; Zafra, E.; Morales-Molino, C.; Rodríguez-García, A.; González-Doncel, I.; Oleksyn, J.; Zytkowiak, R.; López, R.; CarlosMiranda, J.; et al. Unearthing the roots of degradation of Quercus pyrenaica coppices: A root-to-shoot imbalance caused by historical management? For. Ecol. Manag. 2016, 363, 200–211. [Google Scholar] [CrossRef]
  66. Vacca, A.; Aru, F.; Ollesch, G. Short-term Impact of Coppice Management on Soil in a Quercus ilex l. Stand of Sardinia. Land Degrad. Dev. 2017, 28, 553–565. [Google Scholar] [CrossRef] [Green Version]
  67. Zlatník, A. Výmladkové lesy s hlediska proměn lesů pod vlivem člověka a úloha ekologie pří přeměnách a převodech výmladkových lesů (in Czech). Sborník Ceskoslov. Akad Zemědělských Věd 1957, 3, 109–123. [Google Scholar]
  68. Hölscher, D.; Schade, E.; Leuschner, C. Effects of coppicing in temperate deciduous forests on ecosystem nutrient pools and soil fertility. Basic Appl Ecol. 2001, 2, 155–164. [Google Scholar] [CrossRef]
  69. Pignataro, A.; Moscatelli, M.C.; Mocali, S.; Benedetti, A.; Grego, S. Effect of oak forest coppicing on soil biochemical properties in mediterranean environment. Ann. Univ. Crainova 2011, 41, 162–172. [Google Scholar]
  70. Wilke, B.; Bogenrieder, A.; Wilmanns, O. Differenzierte Streuverteilung im Walde, ihre Ursachen und Folgen. Phytocoenologia 1993, 23, 129–155. [Google Scholar] [CrossRef]
  71. Darenova, E.; Čater, M. Effect of spatial scale and harvest on heterogeneity of forest floor CO2 efflux in a sessile oak forest. Catena 2020, 188, 104455. [Google Scholar] [CrossRef]
  72. Petersen, P.M. Importance of site conditions and time since abandonment for coppice vegetation on Langeland, Denmark. Nord. J. Bot. 2003, 22, 463–481. [Google Scholar] [CrossRef]
  73. Logli, F.; Joffre, R. Individual variability as related to stand structure and soil condition in a Mediterranean oak coppice. For. Ecol. Manag. 2001, 142, 53–63. [Google Scholar] [CrossRef]
  74. Kaiser, C.H.; Fuchslueger, L.; Koranda, M.; Gorfer, M.; Stange, C.F.; Kitzler, B.; Rasche, F.; Strauss, J.; Sessitsch, A.; Zechmeister-Boltenstern, S.; et al. Plants control the seasonal dynamics of microbial N cycling in a beech forest soil by belowground C allocation. Ecology 2011, 92, 1036–1051. [Google Scholar] [CrossRef]
  75. Hédl, R.; Rejšek, K. Soil changes after forty years of succession in an abandoned coppice in the Czech Republic. Acta Agron. Hung. 2007, 55, 453–474. [Google Scholar] [CrossRef]
  76. Kučera, A.; Šikl, J.; Oulehle, F.; Šamonil, P.; Marosz, K.; Hleb, R.; Houška, J.; Hruška, J. Comparison of modern and traditional methods of soilsorption complex measurement: The basis of long-term studies and modelling. Ekol. Bratisl. 2014, 33, 48–59. [Google Scholar] [CrossRef]
  77. Cullotta, S.; Bagarello, V.; Baiamonte, G.; Gugliuzza, G.; Iovino, M.; La Mela Veca, D.S.; Maetzke, F.; Palmeri, V.; Sferlazza, S. Comparing Different Methods to Determine Soil Physical Quality in a Mediterranean Forest and Pasture Land. Soil Sci. Soc. Am. J. 2016, 80, 1038–1056. [Google Scholar] [CrossRef]
  78. Boyle, J.R.; Powers, R.F. Forest Soils and Ecosystem Sustainability, 1st ed.; Elsevier: Amsterdam, The Netherlands, 2001; 474p. [Google Scholar]
  79. Hallett, L.M.; Stein, C.; Suding, K.N. Functional diversity increases ecological stability in a grazed grassland. Oecologia 2017, 183, 831–840. [Google Scholar] [CrossRef] [PubMed]
  80. Chazarenc, F.; Brisson, J.; Merlin, G. Seasonal and spatial changes of microorganism communities in constructed wetlands: A community level physiological profiling analysis. Int. J. Chem. Eng. 2010, 2010, 490240. [Google Scholar] [CrossRef] [Green Version]
  81. Howes, A.S. Environmental Factors, Not Plants, Contribute to Functional Diversity of Soil Bacteria in the Dunes of Lake Michigan. Master’s Thesis, University of Louisville, Louisville, KY, USA, May 2017. [Google Scholar]
  82. Rosíková, J.; Darenova, E.; Kučera, A.; Volarik, D.; Vránová, V. Effect of different dolomitic limestone dosages on soil respiration in a mid-altitudinal Norway spruce stand. iForest 2019, 12, 357–365. [Google Scholar] [CrossRef]
  83. Preston-Mafham, J. Analysis of microbial community functional diversity using sole-carbon-source utilisation profiles—A critique. FEMS Microbiol. Ecol. 2002, 42, 1–14. [Google Scholar] [CrossRef] [PubMed]
  84. Miki, T.; Yokokawa, T.; Ke, P.-J.; Hsieh, I.-F.; Hsieh, C.-H.; Kume, T.; Yoneya, K.; Matsui, K. Statistical recipe for quantifying microbial functional diversity from EcoPlate metabolic profiling. Ecol. Res. 2018, 33, 249–260. [Google Scholar] [CrossRef]
  85. Biolog Inc. Microbial Community Analysis: EcoPlateTM; Biolog Inc.: Hayward, CA, USA, 2007; p. 2. [Google Scholar]
  86. Pignataro, A.B.; Moscatelli, M.C.; Mocali, S.; Grego, S.; Benedetti, A. Assessment of soil microbial functional diversity in a coppiced forest system. Appl. Soil Ecol. 2012, 62, 115–123. [Google Scholar] [CrossRef]
  87. Pignataro, A. Assessment of microbial functional and genetic diversity of forest soils in Central Italy. Ph.D. Thesis, Università Degli Studi Della Tuscia, Viterbo, Italy, 27 April 2012. [Google Scholar]
  88. Gömöryová, E.; Fleischer, P.; Gömöry, D. Soil microbial community responses to windthrow disturbance in Tatra National Park (Slovakia) during the period 2006–2013 / Odozva pôdneho mikrobiálneho spoločenstva na veternú kalamitu v Tatranskom národnom parku (Slovensko) v období rokov 2006–2013. Cent. Eur. For. J. 2014, 60, 137–142. [Google Scholar] [CrossRef]
  89. Vuong, T.M.D.; Zeng, J.Y.; Man, X.L. Soil fungal and bacterial communities in southern boreal forests of the Greater Khingan Mountains and their relationship with soil properties. Sci. Rep. 2010, 10, 22025. [Google Scholar] [CrossRef] [PubMed]
  90. Błońska, E.; Lasota, J.; Gruba, P. Effect of temperate forest tree species on soil dehydrogenase and urease activities in relation to other properties of soil derived from loess and glaciofluvial sand. Ecol. Res. 2016, 31, 655–664. [Google Scholar] [CrossRef] [Green Version]
  91. Adamczyk, B.; Adamczyk, S.; Kukkola, M.; Tamminen, P.; Smolander, A. Logging residue harvest may decrease enzymatic activity of boreal forest soils. Soil Biol. Biochem. 2015, 82, 74–80. [Google Scholar] [CrossRef]
  92. Klose, S.; Tabatabai, M.A. Response of phosphomono-esterases in soils to chloroform fumigation. J. Plant. Nutr. Soil Sci. 2002, 165, 429–434. [Google Scholar] [CrossRef]
  93. Tan, X.; Chang, S.X.; Kabzems, R. Soil compaction and forest floor removal reduced microbial biomass and enzyme activities in a boreal aspen forest soil. Biol. Fertil. Soils 2008, 44, 471–479. [Google Scholar] [CrossRef]
  94. Šarapatka, B.; Kršková, M. Interactions between phos-phatase activity and soil characteristics at some locations in the Czech Republic. Plant. Prod. 1997, 43, 415–419. [Google Scholar]
  95. Attiwill, P.M. The disturbance of forest ecosystems: The ecological basis for conservative management. For. Ecol. Manag. 1993, 63, 247–300. [Google Scholar] [CrossRef]
  96. Marshall, V.G. Impacts of forest harvesting on biological processes in northern forest soils. For. Ecol. Manag. 2000, 133, 43–60. [Google Scholar] [CrossRef]
  97. Zhang, N.; Wan, S.; Li, L.; Bi, J.; Zhao, M.; Ma, K. Impacts of urea N addition on soil microbial community in a semi-arid temperate steppe in northern China. Plant. Soil 2008, 311, 19–28. [Google Scholar] [CrossRef]
Figure 1. Location and distribution of the experimental plots, where 1B, 4B and 6B belong to treatment C; 1A, 4A and 6A belong to treatment CR; 2B, 3B and 5B belong to treatment CG; 2A, 3A and 5A belong to treatment CRG; and K1-K3 are control plots (Ctrl). (Orthophoto map © Seznam.cz, a.s., © TopGis, s.r.o.).
Forests 12 01187 g001
Figure 2. Boxplots of the (a) average well color development (AWCD) and (b) Shannon–Wiener diversity indices of metabolized substrates after the 384 h incubation. The boxplots show the medians and quantiles (0.25 and 0.75).
Forests 12 01187 g002
Figure 3. The ordination plot of the diversity indices and soil parameters measured (a) in 2018 and (b) as differences between 2018 and 2017.
Forests 12 01187 g003
Figure 4. Correlation matrices of diversity indices measured in 2018 with initial soil properties measured in 2017 (a) and in 2018 (b).
Forests 12 01187 g004
Figure 5. Graphical expression of the utilization pattern of 31 carbon substrates in the treatments in relation to the AWCD index.
Forests 12 01187 g005
Figure 6. Shannon–Wiener diversity index values within treatments as a function of carbon sources: (a) L-threonine, (b) L-asparagine and (c) α-cyclodextrin from the group of substrates (a) differing among the treatments, (b) high-activity substrates among all the treatments and (c) low-activity substrates among all the treatments.
Forests 12 01187 g006
Table 1. The results of the paired t-test comparison of the soil parameter values in relation to the individual treatments in 2018 and 2017. n-s > α; 0.05–0.1; * 0.01–0.05; ** 0.001–0.01; *** < 0.001.
CCRCGCRGCtrl
ParameterMean Δt-testMean Δt-testMean Δt-testMean Δt-testMean Δt-test
2017p2017p2017p2017p2017p
pH/H2O5.58+0.29*5.430.09n-s5.61+0.33·5.28+0.57**5.42+0.58**
pH/KCl4.83+0.28·4.650.17n-s4.93+0.38n-s4.53+0.65*4.73+0.6*
Corg4.56+0.65n-s3.77+1.025*3.78+0.32n-s3.7+1.07*4.51+0.7·
Nt0.31+0.076**0.28+0.089**0.29+0.062**0.27+0.098***0.32+0.1**
C/N151.23n-s13.83-0.808n-s13.751.61*13.920.89n-s14.752.33*
C-THS1.15+0.09n-s0.94+0.19·0.97+0.072n-s0.87+0.22**1.11+0.018n-s
C-HA0.51+0.055n-s0.36+0.16*0.39+0.068·0.33+0.14**0.46+0.024n-s
C-FA0.61+0.039·0.56+0.023n-s0.57+0.028n-s0.5+0.103**0.610.007n-s
C-HA/FA0.85+0.03n-s0.65+0.245*0.68+0.078n-s0.67+0.11n-s0.75+0.095n-s
DegHum25.471.38n-s25.481.44n-s25.740.49n-s24.211.01n-s24.752.9**
P45.33+1n-s46.33+19.17*38.75+14.42**47.33+25.42*57.25+14.17*
Mg191.17+72.42**181.92+1.33n-s238.5+51.17**171.17+93.92**240.92+70.25n-s
Ca2066.4+1172.25**1614.5+593.6*1966.2+758.8*1513.67+1142.5**1876.25+963.58*
K152.2521.5n-s128.75+2.42n-s125.17+5.67n-s123.67+59.08n-s181.4223.75*
H+65.2517.25**69.174.58n-s60.9222.42*70.0826.25**72.3326**
Al3+7.675.67·10.75+0.08n-s4.758.33*8.757.5*5.334.17·
CEC195.17+40.75**178.25+25.25*186.25+11.25n-s171.17+32·195.5+22.67n-s
AS34.2412.16**40.37+3.11n-s32.8611.54*41.4818.22**38.8615.86**
Bc123+63.58**98.83+29.75·121+42.17*92.75+66.25**118.08+53.25*
BS61.88+16.03**53.22+5.49n-s64.78+18.02**53.69+22.93**58.21+18.89**
K-rat.law0.370.02*0.3020.006n-s0.3580.01n-s0.3440.007n-s0.4630.023**
Ca/K13.63+13.18**12+5.065·16.23+5.29*10.43+4.78*10.43+7.845**
Ca/Mg127.38+31.25·100.72+27.22·113.15+21.7n-s105.88+16.19n-s100.26+11.07n-s
Mg/K1.3+0.74***1.460.03n-s1.94+0.29·1.44+0.3·1.36+0.64·
N-NH4+9.09+9.17**9.03+2.014n-s9.64+15.23·9.4+14.86·10.43+0.41n-s
N-NO3-0.45+1.058**0.78+1.58***0.27+1.3**0.39+3.39*0.68+0.95*
Phosphatase429.9184.81***357.6283.17*408.5678.58*375.4769.72·457.6763.19*
Urease75.9820.58*70.1+10.75n-s70.7512.84·66.83+9.06n-s90.071.01n-s
Protease128.0437.02n-s106.47+33.64n-s130.83+16.22n-s97.49+84.12*130+50.29·
Cmic3707.71020n-s3264+265.9n-s3280-200.1n-s2844.5+1145.3n-s4160.6+41.17n-s
Table 2. Effect of the treatments on the differences in the soil properties between 2018 and 2017. ANOVA or Kruskal–Wallis tests were used, followed by multiple comparison tests (indices are shown in the mean and median columns).
IndexCCRCGCRGCtrlp-Value
MeanMedianMeanMedianMeanMedianMeanMedianMeanMedian
pH/H2O–delta 3ab0.300b0.150ab0.350a0.450a0.6000.03611
pH/KCl–delta 3ab0.300b0.150ab0.400a0.600ab0.5000.04771
N-NO3–delta 3ab1.011ab1.675ab1.241a1.796b0.8600.04461
Phosphatase–delta 3b−174.18ab−106.06ab−89.37a−95.89a−72.480.01691
Cmic–delta 3b−1207.99ab177.48ab−131.402a789.72ab−6.190.04871
AWCD–20180.487 b0.4820.544 ab0.5320.605 ab0.6000.464 b0.4770.715 a0.7250.01841
S-W–20182.8592.934 ab2.9103.067 ab2.9863.013 ab2.7562.886 b3.1023.083 a0.03302
1 parametrical ANOVA; 2 nonparametrical Kruskal–Wallis test; 3 mean values, see Table 1; a statistically significantly higher than b, ab statistically insignificant difference between a and b.
Table 3. Spatial heterogeneity (standard deviation) of the soil properties with significant differences detected by ANOVA within blocks (C, CG, CR, CRG and Ctrl) and study plots (1A–6B and controls K1–K3) in 2017 and in 2018.
2017
Soil PropertyBlock (Treatment)
(n = 12/Block)
CCGCRCRGCtrl
Plot
(n = 4/Plot)
1B4B6B2B3B5B1A4A6A2A3A5AK1K2K3
pH/H2Osd (block)0.680.800.550.610.56
sd (plot)0.340.400.260.150.440.640.100.360.170.150.590.280.230.640.70
pH/KClsd (block)0.850.980.700.720.68
sd (plot)0.410.540.360.170.590.730.120.480.210.120.750.370.360.770.83
N-NO3-sd (block)0.430.550.110.270.44
sd (plot)0.030.250.620.650.180.670.160.130.140.190.100.120.170.430.62
Phosph.sd (block)47747276113
sd (plot)33415244292512611034693447684140
Cmicsd (block)60985962710311759
sd (plot)628524735957101548674757357449013481585349531776
2018
pH/H2Osd (block)0.550.600.640.430.46
sd (plot)0.060.380.450.450.670.720.320.250.240.600.430.100.260.720.42
pH/KClsd (block)0.630.720.680.420.50
sd (plot)0.170.460.590.520.740.910.360.390.190.630.420.170.300.790.44
N-NO3-sd (block)0.950.140.674.331.08
sd (plot)0.190.781.600.410.601.150.350.510.632.276.930.290.331.690.29
Phosph.sd (block)4064817789
sd (plot)3643343881361052029648226366282
Cmicsd (block)854109412151727964
sd (plot)93877469766715477191105442901134111754927681237621
AWCDsd (block)0.180.170.210.240.15
sd (plot)0.190.260.100.130.120.130.310.140.140.330.150.150.110.150.15
S-Wsd (block)0.280.190.330.410.07
sd (plot)0.240.400.210.130.220.670.470.170.340.400.480.080.010.040.05
Publisher’s Note: MDPI stays neutral with regard to jurisdictional claims in published maps and institutional affiliations.

