1. Introduction
The control and monitoring of the forests’ health in boreal zones areextremely difficult due to the size and inaccessibility of these forest areas. The outbreaks of insect populations are one of the main factors in forest stand weakening. Significant economic and environmental losses during desiccation and destruction of forests make it extremely important to assess the current state and immunity of tree stands to insect attacks [
1]. A short-term forecast for the upcoming years is no less important. Unfortunately, assessments based on visual signs (crown condition or trunk damage) work only at later stages, when it is almost impossible to manage the tree stand state.
The only real possibility for analyzing tree stand states across large areas (such as taiga territories) is the use of Earth remote sensing (ERS) data. Currently, such data are used mainly for damage assessment. One of the main methods used in such analysis is calculation of various vegetation indices based on the difference in the reflection of red and near-infrared radiation [
2]. The vegetation index makes it possible to assess the productivity and physiological properties of the plant components of the ecosystem [
3,
4]. It is a spectral indicator of photosynthesis and the intensity of plant metabolism [
5,
6]. When studying the dynamics of vegetation indices, both intra-annual and interannual changes associated with climate variability are considered [
7]. Remote sensing data are widely used to map the spatial dynamics of insect outbreaks [
8,
9,
10]. However, the main purpose of these studies is to estimate the damage caused by outbreaks and calculate the area of loss. Such an index reliably and promptly shows the degradation of the tree crown during the development of an insect outbreak. In addition, with the weakening of forest stands, a decrease of trees’ robustness against insects develops over several years before the start of a sharp rise in pest populations. These changes are not presented in the
NDVI (normalized difference vegetative index), and attempts to use remote sensing data to assess the resilience of forest stands to external influences have not been successful [
11,
12,
13].
There are publications in which the level of trees’ damage by insects is assessed using remote sensing methods. In [
14], using UAV data for stands damaged by
Polygraphus proximus Blanchford, methods were proposed for assessing trees in six categories of condition, ranging from healthy intact trees to trees that have been damaged for a long time. In [
15], using remote sensing data, an assessment of fir stands areas damaged by the Siberian silkmoth is given, depending on the landscape structure of the territory.
However, these works are devoted to assessing the level of pest impact on the already dead forest when it is too late to take any forest protection measures. In the present work, the task is to assess risks of future damage when insects have not yet begun to damage trees. In this case, by determining the area where changes in the proposed distance indicators take place without noticeable damage to the trees, it is possible to estimate the area of future outbreaks several years before the outbreak starts. Then, once such assessments have been obtained, there is sufficient time to take action to suppress pest populations.
2. Materials and Methods
In this work, we moved from quantitative measurements of plant biomass based on the absolute values of the NDVI to assessing the response of the photosynthetic apparatus to environmental changes. Input and output parameters for this model can be obtained simultaneously from remote sensing data and synchronized at the time and place of the observation.
There are sufficient satellite systems that can obtain operational data on the characteristics of the environment in a local area. The key factors in choosing such a system are the periodicity of receiving ERS data, sufficient spatial resolution, and the availability of the necessary spectral, optical, and lidar data transmission channels. In this work, the choice was made in favor of the Terra/Aqua satellites operating under the NASA EOS (Earth Observing System) program. The equipment of these two satellites is sufficiently duplicated, which makes it possible to recover the received information, removing atmospheric interference for one of the satellites. Initial ERS data from the Terra/Aqua satellites are available for free download on the NASA server [
16]. The main instrument for collecting the necessary information on the satellite is MODIS (Moderate-Resolution Imaging Spectroradiometer).
The extraction of the necessary indicators for the selected coordinates from the raw remote sensing data is a technically complex GIS task. For selected products, there is the Application for Extracting and Exploring Analysis Ready Samples (AρρEEARS) server software solution
https://lpdaacsvc.cr.usgs.gov/appeears/, accessed on 30 June 2021. The type of product (initial or calculated indicator), set of observation point coordinates, and time period are used as part of the query to the database. The results are also generated on the NASA server and can be downloaded as a text file.
As an indicator that characterizes the state of plantations, we propose using an indicator for the sensitivity of the vegetation index (NDVI) during the season to changes in the radiation temperature of the territory (LST).
The following Terra/Aqua products were used for the analysis:
- -
The MOD11A1 and MYD11A1 products contain information about the underlying surface temperature (LST). This indicator correlates well with meteorological observations of air temperature. Observations are collected daily. The spatial resolution is 1 km × 1 km.
- -
The original spectral channels sur_refl_b01 (red) and sur_refl_b02 (near-infrared) are used for calculating the vegetative index, NDVI, contained in the MOD09Q1 and MYD09Q1 products. They represent an eight-day composite (purified and selective data over a period of eight days). The spatial resolution is 250 m × 250 m.
NDVI scores have been used successfully for various assessments of vegetation status and changes since
NDVI values are associated with photosynthetically active radiation. In this paper, the
NDVI is calculated using the standard formula:
where
NIR and
RED are the normalized values of the reflection intensity in the near-infrared and red ranges of the spectrum for a given point on the Earth’s surface (the sur_refl_b02 and sur_refl_b01 channels of the MOD09Q1 and MYD09Q1 products, respectively).
NDVI-dimensionless indicator is in range (0–1).
NDVI and
LST time series follow similar patterns increasing in values until reaching a peak in mid-summer and then decreasing in values (
Figure 1).
Since the growth and condition of the crown of trees significantly depend on changes in ambient temperature, the analysis of the relationships between the
NDVI and
LST will make it possible to assess the adaptive resources of trees in the plantation. In this case, the change in the
NDVI can be considered a function of changes in weather conditions. For a particular year, the
LST variable can be considered an input in the system, and the
NDVI variable can be considered an output. If we assume that the output signal is linearly dependent on the input signal, then this relationship can be written in terms of some linear operator
F:
The operator
F is limited by the natural condition of causality: the value of
NDVI(t) at time t will depend only on the values of
LST(t-τ) in the past. Since the seasonal dynamics of
NDVI(t) and
LST(t) have a nonmonotonic nonlinear trend (see
Figure 1), to satisfy the linearity condition of operator
F, it is necessary to pass from the nonmonotonic variables
NDVI and
LST to the variables ∆
NDVI(t) = NDVI(t)–NDVI(t–1) and ∆
LST(t) = LST(t)–LST(t–1), respectively.
When describing the relationship between these variables, it is necessary to take into account the possible delay in the NDVI response to a change in LST.
Consider the cross-correlation function Φ
yx connecting Δ
NDVI(t) and Δ
LST(t) [
17,
18]:
where
E is the expectation operator,
y-Δ
NDVI;
x-Δ
LST.
Since the operations of the mathematical expectation
E and linear transformation
F can be rearranged, we can write:
where
h(
τ) is the so-called weight function (response function), and Φ
xx is the autocorrelation function Δ
LST.
Then, from (3) and (4), we derive:
Since the time series of ΔNDVI and ΔLST during the season are known, their values are used to calculate the cross and autocorrelation functions, and in Equation (5), only the weight function (response function) h(τ) is unknown. This function describes the NDVI’s susceptibility to LST change.
To find the response function [
19,
20], we perform the Fourier transform (
FT) of the left and right sides of Equation (5):
where
H(f) = FT(h(τ)).
From (6), we can find the value of the response function spectrum
H(
f) [
21]:
The spectral function
H(
f) characterizes the rate and intensity of weather impact on the photosynthetic apparatus state of the stand. A typical form of function
H(
f) is shown in
Figure 2.
The value of the spectral response function H(f0) at frequency f0 characterizes the intensity and speed v =1/f0 of the NDVI response to the LST change. The components of the H(f) spectrum at low frequencies (near f = 0) characterize a strongly inertial NDVI response to a change in LST, and the components of the H(f) spectrum at high frequencies (near f = 0.5) characterize a fast NDVI response.
The spectral power of the response function is the area under the spectrum curve in
Figure 2. Further analysis uses power of low-frequency spectrum (
LF) for
f < 0.16 1/day and power of high-frequency spectrum (
HF) for
f> 0.35 1/day. Pairs of these values are compared for damaged and control stands:
For automated calculation of the spectral response function during the season, the original calculation program was used [
22]. The program is a stand-alone utility that runs under the Windows operating system. The time series of
NDVI and
LST indices are input data of the program. Preliminary data preparation requires correction of possible errors or meteorological observation interference (cloudiness and other effects) by using the method of smoothing by neighboring values. The program also excludes from the calculation the nonvegetative period of winter observations. The results are presented as a set of discrete values of the spectral response function
H(
f) for each year of observation.
The analysis was performed for fir stands in the taiga zone in regard to the Siberian silkmoth Dendrolimus sibiricus Tschetv. population outbreak in the Yenisei and Severo-Yenisei districts in the Krasnoyarsk region. This outbreak occurred between 2015 and 2017. During the outbreak, the pest damaged and destroyed approximately 1 million hectares of forest. The implementation of measures to suppress the outbreak cost the regional budget at least 300 million RUB.
The study examined sites that have been damaged since 2015 by the caterpillars of the Siberian silk moth and adjacent intact areas.
Figure 3 shows the location of the test plots within the outbreak (the Yenisei River Basin near Ust’-Pit village, coordinates 58.721310° N, 90.421236° E) and control test plots.
Additionally, fir stands of mountain taiga in the southern area of the Ermakovsky District in the Krasnoyarsk region were considered an experimental object. These areas were significantly damaged by black fir sawyer
Monochamus urussovi Fischer in 2013 (coordinates 52.408660° N, 93.582923° E). Sample damaged areas are located on two adjacent mountain slopes; the nearest slopes with intact stands were used as controls.
Figure 4 shows the locations of the test plots before and after insect damage. The Siberian silkmoth is a phyllophage and feeds only on needles, while the black fir sawyer is a stem pest. This causes certain differences in the dynamics of tree stand weakening by these types of insects.
Data on the studied sites were provided by the Forest Protection Center of the Krasnoyarsk region.
3. Results
Seasonal NDVI and LST data from 2009 to 2019 were collected for seventest plots (eightcontrol undamaged plots) for the site damaged in 2015 by the Siberian silkmoth. During the 2013 black fir sawyer outbreak, indicators were measured from 16 test and 16 control sites. To improve measurement accuracy, sixsections of 250 × 250 m were considered in each area, which corresponds to the minimum spatial resolution of the AQUA/MODIS system for the selected spectral channels.
How does the
NDVI indicator during the season characterize the state of the stands? For the damaged and control sample plots, the total values of the photosynthetic index were calculated during the season:
The obtained
NDVI and
LST data were averaged for damaged and control areas.
Figure 5 shows ratios of the seasonal mean
NDVI values for the outbreaks and controls in two sample plots.
As shown in
Figure 5, prior to the outbreak (2015), no significant differences in the
NDVI of trees in future outbreaks and control intact stands were observed. Only after the needles were damaged by pests did such differences appear. Thus, according to the total
NDVI indicators, it is not possible to obtain an early assessment of the risks of insect attacks on woodlands.
Let us consider the possibility of using spectral response functions from Equation (8) for an early assessment of the risks of pest attacks on plantations. To compare the spectral response functions of damaged and undamaged plots, we use the parameters LF (f < 0.16) and HF (f > 0.35). Further analysis used indicators from 2003 to 2019.
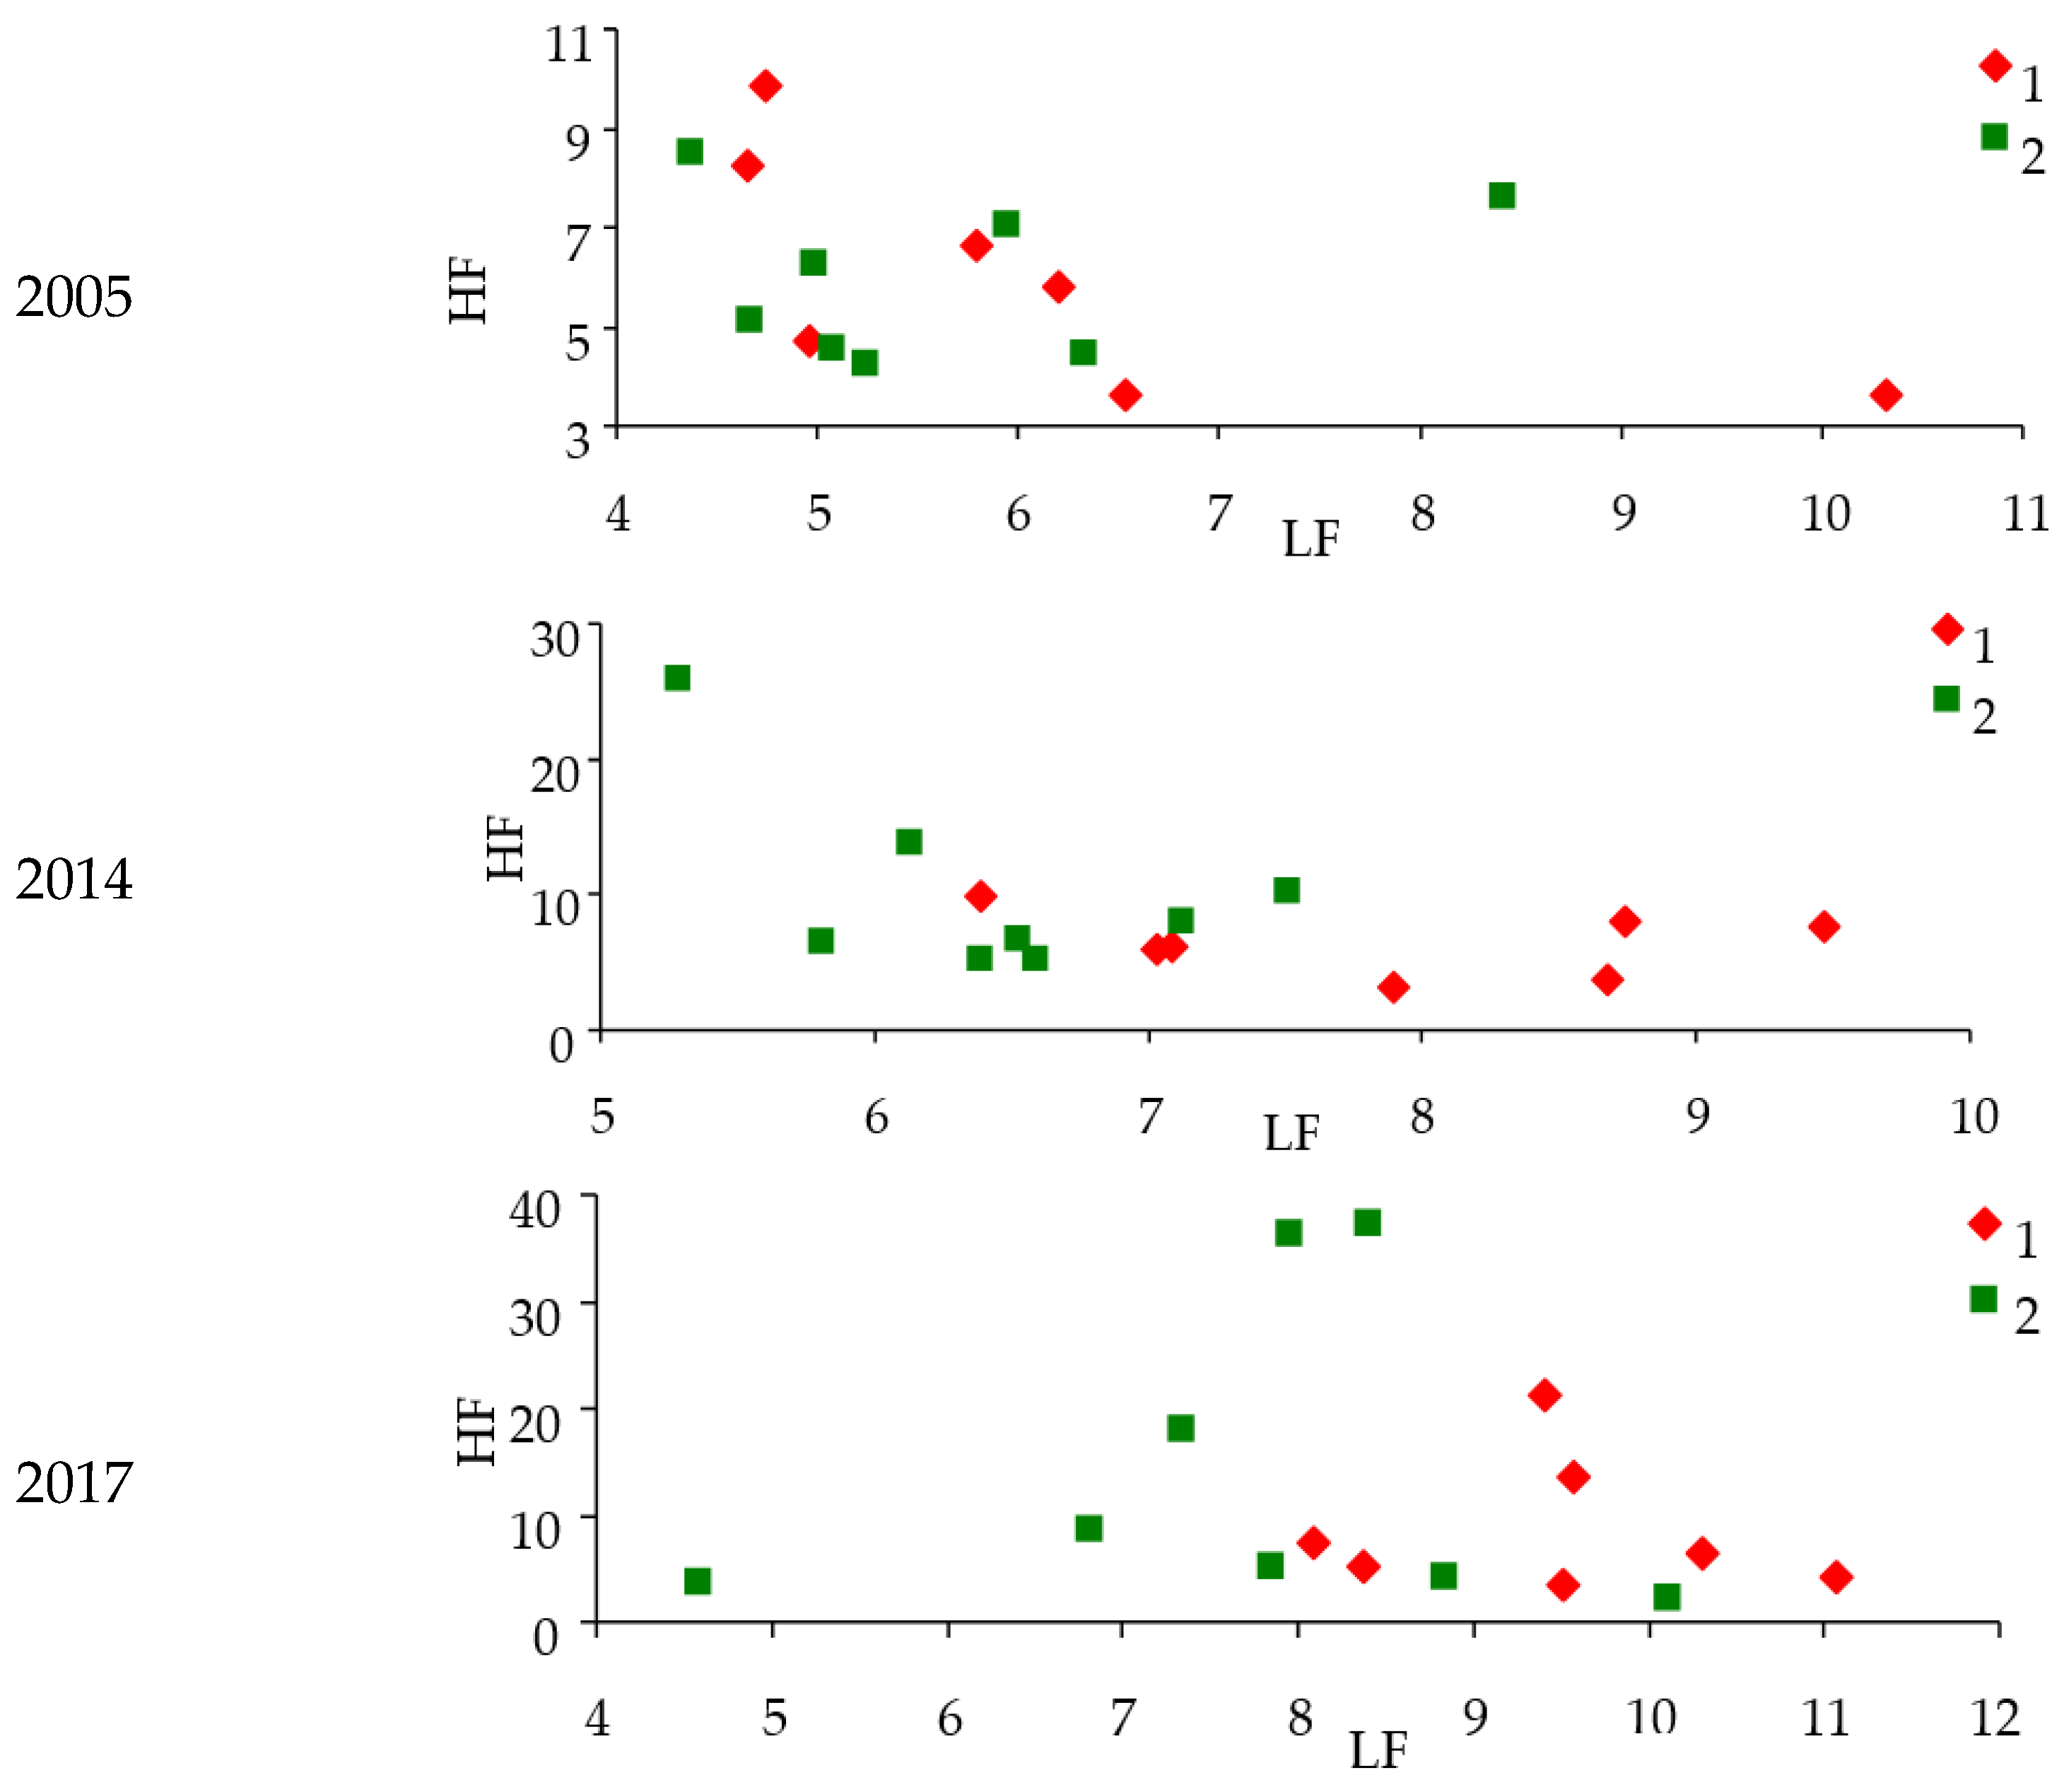
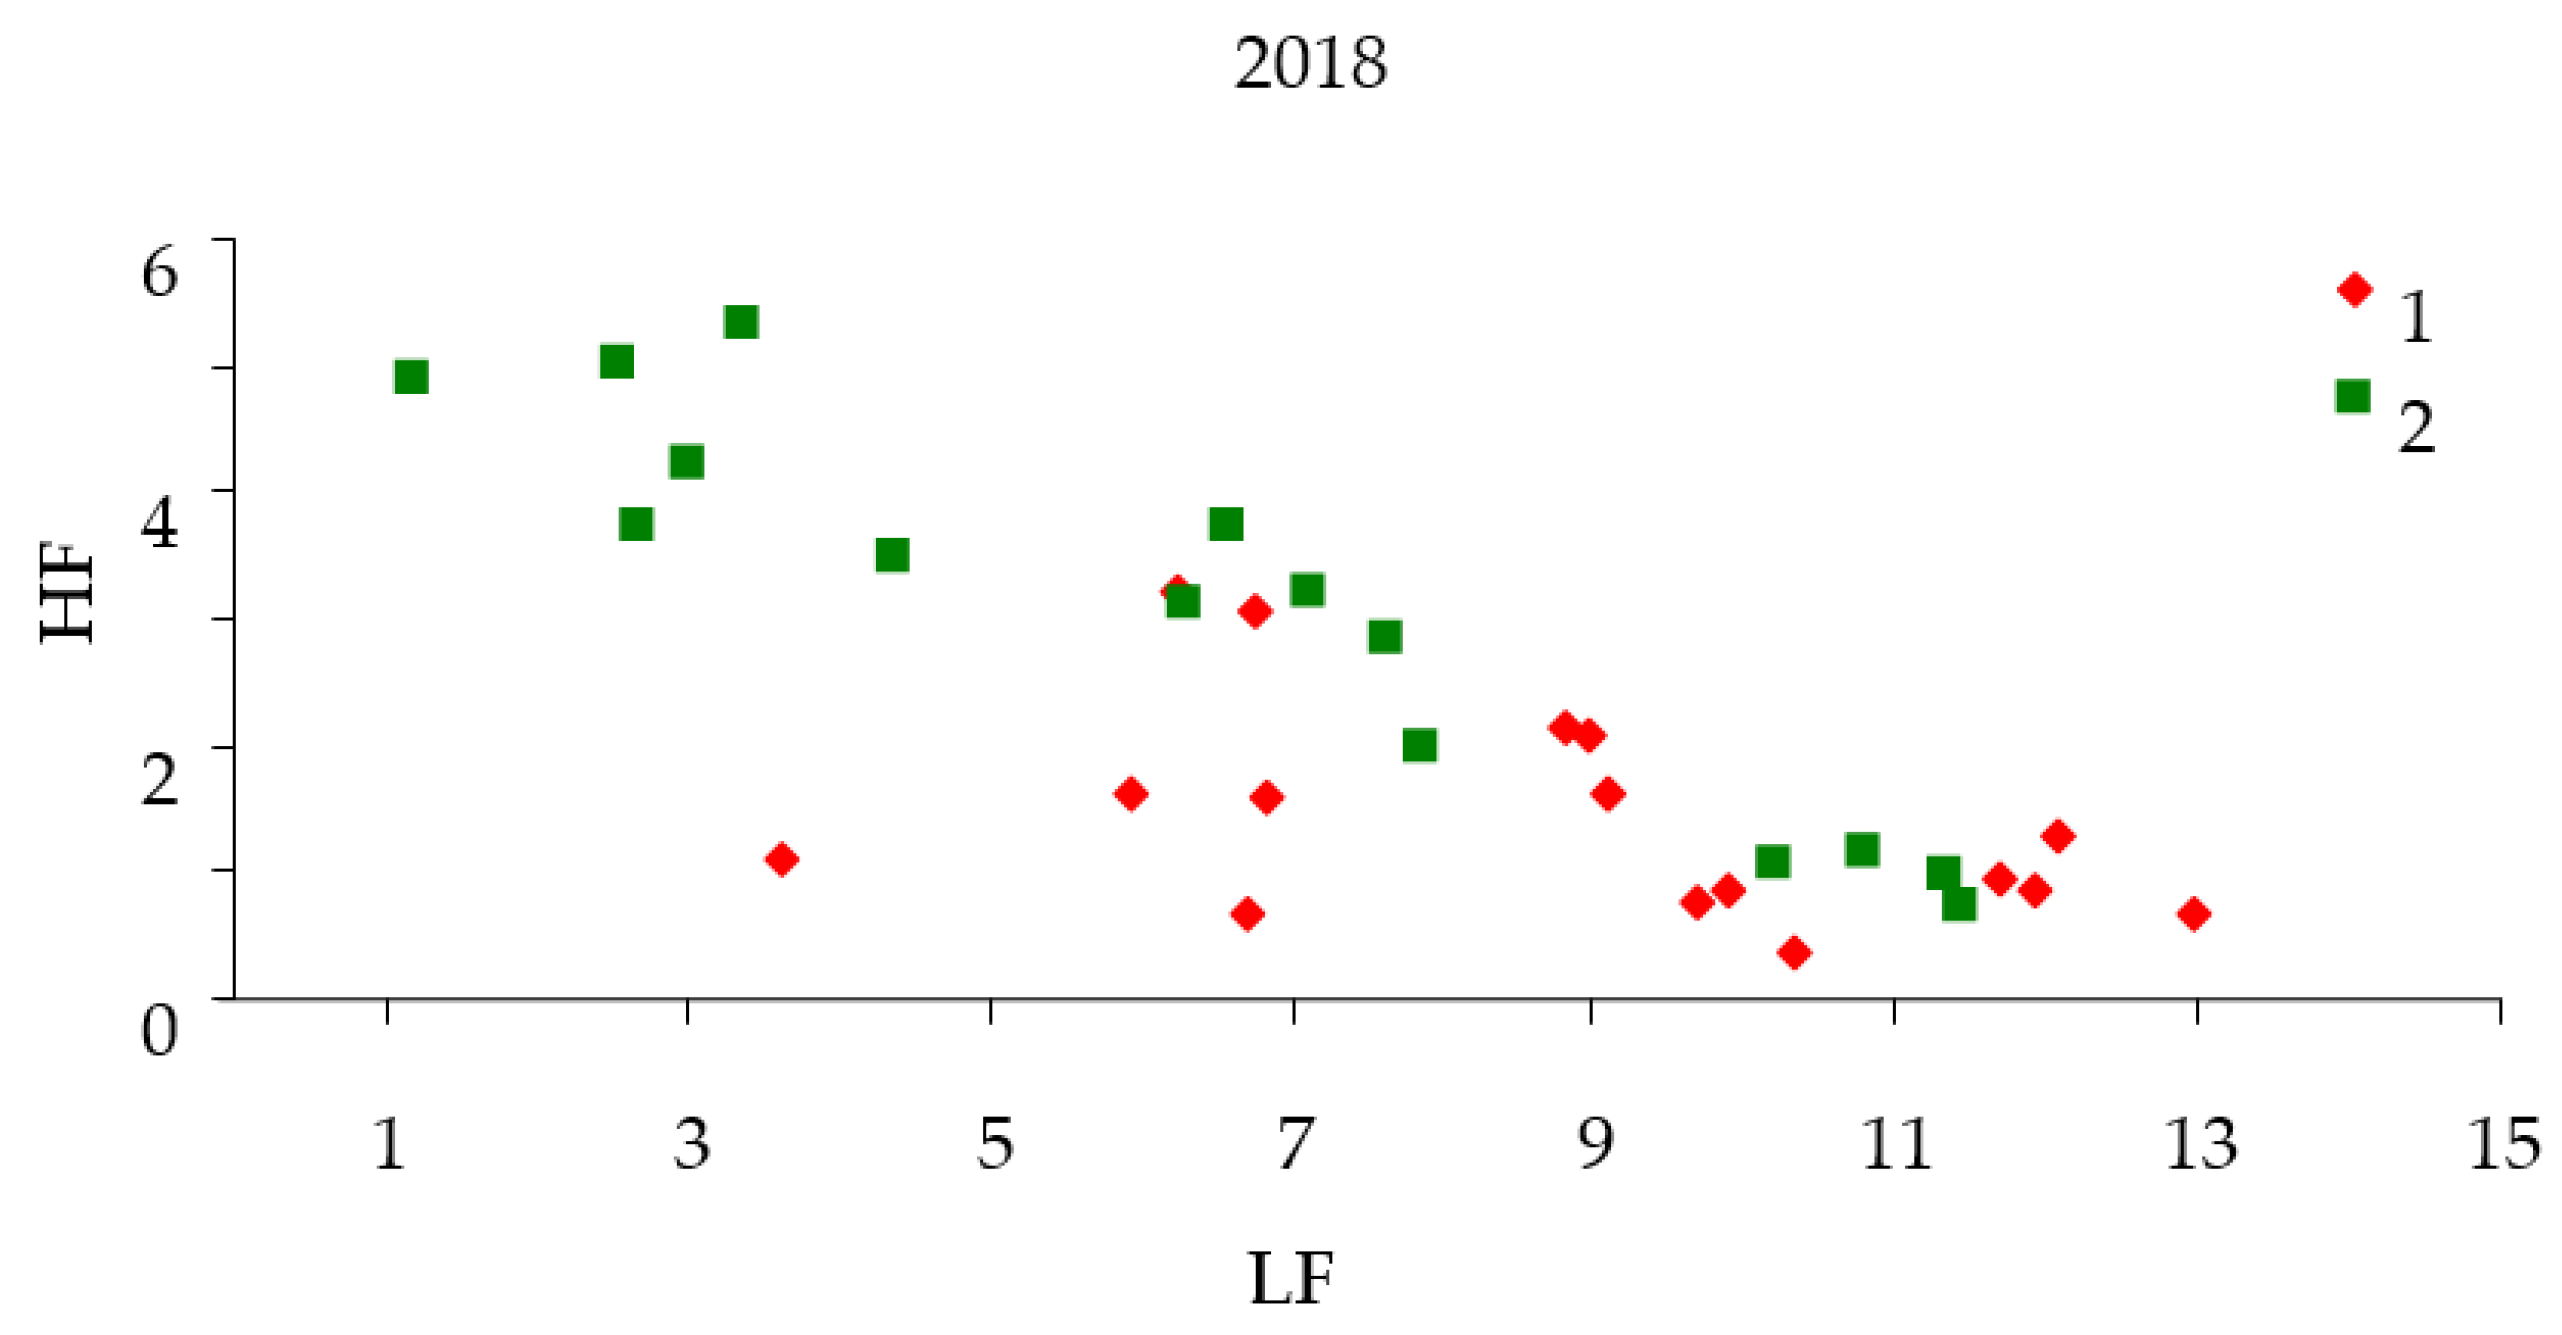
Figure 6 shows power
LF and
HF components of response functions for damaged and control stands in different years.
In 2014, two years before the start of the Siberian silkworm outbreak, the power of LF components increased, and the power of HF components in future damaged areas decreased compared to the control. These changes continue to be observed in the initial years of the Siberian silkworm outbreak (see 2017). After the development of the outbreak and trees damage in 2018 and 2019, there were further changes in the powers of response function spectra. At this moment, the power of LF and HF components for damaged areas decreased in comparison with control.
Thus, approximately two years before the outbreak, the power of the LF component increases for woodlands that will be attacked by insects compared to control. It means NDVI response to LST changes begins to lag. These differences can be used asindicators of future outbreak location.
Furthermore, with intense damage to stands by insects, the power of LF and HF components decreases. These shifts can be used as indicators of tree damage.
Differences on the plane {
LF,
HF} for stands in the outbreaks and control points were estimated by the method of linear discriminant analysis [
23]. The values of Wilks λ-test and significance of differences
p were used as indicators of difference (
Table 1).
The smaller Wilks’λ values, the more significant differences in powers of response spectral function components for outbreaks and intact control stands. As can be seen from
Table 1, between 2003 and 2012, no significant differences are observed between
LF and
HF for future locus and control stands. Differences begin to appear before the outbreak in 2013 and 2014 and characterize the loss of tree resistance to insect attacks. In 2015–2016, differences disappear and reappear at a significance level of
p < 0.05 from 2017. Most likely, this is due to the complex impact of defoliation and appearance of the lower stand’s layer on satellite images. Since 2017, a decrease in the power of indicators is associated with severe stands damage.
Similar calculations of
LF and
HF were carried out for stands in the outbreak zone of the black fir sawyer. As can be seen from
Table 1, practically for six years before the outbreak (2013), the characteristics of the response function for test plots and control differ. The
LF component of the response function in the areas before the outbreak is less than the corresponding component in the control (
Figure 7). Changes in the response function spectrum for the black fir sawyer before the outbreak differ from those for the Siberian silkmoth (
Figure 8). This is due to the slow attack of trees by stem pests in comparison with Siberian silkmoth. The difference in the landscape for the two studied species also has an effect.
After forest damage by black fir sawyer, the power of
LF components of response functions increased in comparison with control. On the contrary, the power of the
HF component decreased (
Figure 8).
4. Discussion
The analysis has shown that the proposed approach can be used to assess the ability of forest stands to resist both phyllophagous and xylophagous insects. The strength of the method is that it enables us to assess the state of almost all coniferous woodlands on the planet using archived remote sensing data. The studied forest stands have changed their state at least four years before the xylophagous outbreak (black fir sawyer) and two years before the phyllophagous outbreak (Siberian silk moth).
Of course, such remote analysis cannot replace pest counts. Changes in the state of stands are a necessary but not a sufficient condition for a start of an outbreak. However, amidst the Siberian taiga with a total area of millions of hectares, marking a zone with reduced resistance to pest attacks significantly reduces the area of counts and labor intensity. If drones or airplanes are used to obtain seasonal NDVI and LST time series instead of satellite data, then it is necessary to carry out regular observations about once a week. Such measurements are quite laborious, but in this case, it becomes possible to assess the stability of significantly smaller forest areas compared to those areas we could assess using satellite data. In addition, using high-resolution drones, weakened trees or groups of trees in a stand that are most vulnerable to insect attacks can be identified and removed early on.
It is possible, instead of measuring NDVI response to changes in the underlying LST, to use chlorophyll fluorescence measurements. However, there aren’t any long series of archival satellite data on the forest stands’ fluorescence, and thus, calculations of the response function, in this case, are difficult.
Usually, in taiga forests, outbreaks occur in stands of homogeneous species composition. The trial plots for this work were selected in just such stands. When assessing the sustainability of mixed stands, it is important to take into account that it depends on the ratio of deciduous and coniferous species. It is necessary to estimate the composition of a stand in advance, using, for example, phenological data.
We have shown a link between stands sustainability indicator and attacks of insects, but the reason for relationship change for external factor (LST) and tree crown quality (NDVI) can be different. Possible causes of such changes include disease, drought, and anthropogenic pollution. Regardless of the cause, the change in stability index is a necessary condition for damage to the stand by insects. Identifying a specific cause requires additional research.
As mentioned above, most modern works on the use of remote sensing data in forest conservation and monitoring tasks do not develop in the direction of forecasting but serve to monitor and assess the damage. The assessment of areas and intensity of damage to boreal forests is carried out [
24,
25], including data from the MODIS complex [
26,
27]. In [
28], unmanned aerial vehicles make it possible to assess the damage, increase the spatial resolution, and reduce research costs, but they do not change the fundamental approach. In [
29], remote sensing data on the territory of Siberian forests areused to study the role of environmental factors based on the seasonal variability
NDVI indices of MODIS complex, but this work also has nothing to do with forecasting problems. It seems interesting to use remote sensing data to predict the risks of bark beetle disturbance within the framework of a spatio-temporal multi-parameter model [
30]. This model includes multispectral data from the Landsat satellite. It improves the quality of the model; however, forecast accuracy of the model with a large number of tuning parameters raises questions.


