Article

Chronically Low Nutrient Concentrations in Tree Rings Are Linked to Greater Tree Vulnerability to Drought in Nothofagus dombeyi

by
Ester González de Andrés
1,*,
María Laura Suárez
2,
José Ignacio Querejeta
3 and
J. Julio Camarero
1
1
Instituto Pirenaico de Ecología (IPE-CSIC), 50192 Zaragoza, Spain
2
Instituto de Investigaciones en Biodiversidad y Medioambiente (INIBIOMA-CONICET), San Carlos de Bariloche 8400, Argentina
3
Centro de Edafología y Biología Aplicada del Segura (CEBAS-CSIC), 30100 Murcia, Spain
*
Author to whom correspondence should be addressed.
Forests 2021, 12(9), 1180; https://doi.org/10.3390/f12091180
Submission received: 29 June 2021 / Revised: 23 August 2021 / Accepted: 26 August 2021 / Published: 31 August 2021
(This article belongs to the Special Issue Stable Isotope Applications in Forest Ecosystems)

Abstract

:
Forest dieback and mortality episodes triggered by droughts are receiving increasing attention due to the projected increases in these extreme climate events. However, the role played by nutrient impairment in dieback is understudied, despite interactions among carbon-water balances and nutrition. Here, we followed a comparative analysis of long-term growth, intrinsic water-use efficiency (iWUE), oxygen isotopes (δ18O) and wood-nutrient composition patterns between living (L) and dead (D) trees of a Nothofagus dombeyi population, showing dieback in Argentina. The onset of the growth decline of D trees occurred ca. 40 years before death. These trees showed higher iWUE, pointing to higher drought stress. Their lower δ18O values, together with the uncoupling between δ18O and leaf-level processes, suggested a deeper source of water uptake for this vigor class. D trees showed a poorer nutritional status than L trees that likely amplified the dieback. This was supported by numerous positive associations of P- and K-concentrations in wood and related ratios with iWUE, δ18O and tree growth. Therefore, drought-related nutrient deterioration can significantly contribute to dieback and be an early warning signal of impending tree death.

1. Introduction

Episodes of forest dieback and tree mortality triggered by severe droughts have been reported worldwide [1], and they affected boreal [2], temperate [3], semi-arid [4] and tropical biomes [5]. The increase in temperature and vapor-pressure deficit will likely be accompanied by increased interannual variability in precipitation and/or reduced rainfall in some regions [6], leading to more frequent and severe dry spells [7,8]. These projected climatic trends have raised concerns about the fate of drought-sensitive forests under warmer and drier conditions [9].
Two main physiological processes have been proposed to explain drought-induced tree dieback: hydraulic failure (i.e., cessation of symplastic biochemical functioning and disruption of water transport due to xylem embolism), and carbon starvation (i.e., strong reduction of internal carbon pools that disrupts the maintenance of metabolism) [10,11]. Although both mechanisms are non-mutually exclusive, hydraulic failure has received stronger support across taxa, particularly in gymnosperms [12]. However, canopy dieback and tree mortality are complex phenomena in which water stress can interact with other factors, such as a deficient nutrient availability and biotic stressors [13,14].
Nutrient availability and uptake are largely controlled by soil moisture conditions. Drought decreases nutrient mineralization due to reduction in soil microbial activity and ion mobility, so reducing nutrient availability for plants [15]. The acquisition of nutrients depends on nutrient diffusion and mass flow driven by the water potential gradient created by leaf transpiration that transports nutrients from soil to roots [16]. In addition, drought kills many fine roots which play a relevant role to uptake soil nutrients [10,14]. Consequently, prolonged droughts may cause nutrient deficiencies and stoichiometric imbalances that impair important physiological processes, such as photosynthesis, growth or hydraulic function [17,18], which can result in long-term increases of tree-drought sensitivity [19]. For instance, Salazar-Tortosa et al. [20] proposed the existence of a detrimental feedback loop between reduced transpiration and nutrient uptake in species with a tight stomatal regulation under drought stress. Besides the plastic behavior of many tree species capable of shifting water uptake to deeper soil layers, subsoil or weathered bedrock during drought [21] may exacerbate the contribution of nutrient impairment to drought-induced dieback, considering the lower abundance of nutrients as soil depth increases [22]. Subsequent nutrient imbalances would unleash physiological processes leading to forest dieback.
Tree rings are a powerful tool to evaluate long-term growth trends and patterns in tree-ring width, which have been used to identify early-warning signals of dieback and tree mortality [23,24]. Yet, additional information is required to disentangle the physiological mechanisms leading to growth decline. The analysis of carbon and oxygen isotopic ratios of wood have been commonly used for this purpose [25,26]. Carbon isotope signatures in tree rings are modulated by the regulation of gas exchange during ring formation, due to the linkages between carbon-isotopic discrimination during photosynthesis (Δ13C) and the ratio between intercellular CO2 concentration (Ci) and atmospheric CO2 concentration (Ca) [27,28]. Increasing Ca and water limitation result in stronger stomatal control, leading to higher intrinsic water-use efficiency (iWUE). However, those increases in iWUE have not usually translated into enhanced tree growth [29,30]. The analysis of oxygen isotopes (δ18O) has been proposed to help discern the effects of environmental changes on stomatal conductance, since δ18O is not substantially affected by photosynthesis, but depends on leaf-level evaporative effects and the transpirational dilution of evaporatively enriched leaf water [31].
Nevertheless, the interpretation of the so-called dual-isotope approach [26] presents with some caveats. Firstly, the oxygen-isotope signatures of tree rings may reflect not only evaporative processes at the leaf level, but also variations in the δ18O of source water and exchanges in oxygen between carbohydrate pools associated with transport and xylogenesis [32,33]. For instance, Treydte et al. [34] reported stronger signals of source water than leaf enrichment on a conifer species. In fact, variability in tree-ring δ18O has been associated with species-specific patterns in seasonal water uptake [35,36] and to water uptake from deeper soil layers with increasing drought [37,38]. Secondly, this isotope-based approach focuses on carbon and water relations in the tree, albeit other potential mechanisms may contribute to forest dieback, including nutrient availability and uptake [20] and related nutritional imbalances [39,40]. Therefore, the combination of different approaches that include growth patterns, wood isotopic signals and dendrochemistry data can provide insights into the growing knowledge that links nutrient-related processes to tree mortality triggered by droughts.
Here, we focused on Nothofagus dombeyi (Mirb.) Blume, an evergreen broadleaf species inhabiting sites showing a wide range of climatic and edaphic conditions from mesic-to-cool temperate rainforests in Patagonia, South America. The patchy canopy dieback and mortality episodes of this species, at the eastern side of the Andes range (Argentina), have attracted the attention of scientists for decades [41,42,43]. High growth variability has been identified as a predisposing factor to tree mortality [42]. However, the ecophysiological basis behind such conspicuous patterns remains poorly understood (but see [44]). So, we aimed at analyzing patterns of radial growth, carbon and oxygen isotope discrimination and nutrient composition in tree rings of conspecific living and dead individuals to attain a long-term perspective of drought-induced dieback in N. dombeyi and to infer its underlying mechanisms. Our specific objectives were to assess the potential differences between tree-vigor classes regarding (1) carbon and water relations, and (2) nutrient status, and (3) to determine mechanistic linkages among them and with radial growth patterns.

2. Materials and Methods

2.1. Study Area and Species

The study area is located by the Lake Gutiérrez (41°10′35″ S, 71°24′05″ W, 850 m a.s.l.) in the Nahuel Huapi National Park, northern Patagonia, Argentina. It encompasses the dry eastern edge of the species’ distribution, where N. dombeyi co-exists with the conifer Austrocedrus chilensis in even-aged stands, established after devastating wildfires about 150–170 years ago [45]. Their diameters at breast height (DBH), range between 30 and 135 cm, with a mean value of 63.2 ± 23.0 cm. The stand density is 375 trees ha−1. The soils are Andosols, derived from layers of volcanic ash covering the glacial topography.
The climate in the study area is strongly determined by the rain–shadow effect exerted by the Andes, which leads to a precipitation gradient with decreasing rainfall eastwards [46]. Climatic data were retrieved from the nearest weather station (Bariloche Airport, 41°09′00″ S, 71°10′12″ W, 840 m a.s.l.) that covers the period 1931–2018. The mean annual temperature is 8.2 °C. January and February are the months with higher temperatures (average temperature of 14.4 °C), while July is the coldest month (average temperature of 2.4 °C). The mean annual precipitation is 860 mm, and it is seasonally distributed, with the period between May and August providing more than 60% of the annual precipitation. Identification of drought events was assessed using a multi-scalar drought index, the Standardized Precipitation Evaporation Index (SPEI) [47]. The SPEI was calculated on a six-month time scale, including the growing season (previous October–March [43]). We calculated SPEI using Bariloche climate data and the SPEI package [48] in R software [49].
Monthly δ18O of precipitation was retrieved from the Global Network of Isotopes in Precipitation (GNIP, [50]). We selected the closest station with long-term δ18O data (1967–2017), i.e., Puerto Montt, Chile (41°28′12″ S, 72°55′48″ W, 45 m a.s.l.), located 130 km away from the study area.

2.2. Field Sampling and Dendrochronological Data

We sampled 17 couples of dominant healthy living (L) and dead (D) trees (34 trees in total). Only dead trees showing evidence of being killed by climatic events and exhibiting bark or recently fallen bark were selected, in order to avoid the inclusion of old (rotten) dead trees [51]. Two cores were extracted at 1.3 m height from each tree using increment borers. The wood samples were air-dried, glued onto wooden mounts, and polished until the xylem cellular structure was visible [52]. We visually cross-dated all samples, and tree-ring width was measured to a precision of 0.001 mm, using a Velmex Measuring System (Velmex Inc. Bloomfield, NY, USA). The quality of the cross-dating was examined using the software COFECHA, which calculates moving correlations among individual tree series [53]. We followed the convention for the Southern Hemisphere, which assigns to each tree ring the date of the year in which growth started. The mortality dates of dead trees (i.e., the date of the outermost tree ring) were defined using the master chronology developed for the site [54]. DBH of each sampled tree was measured at field at the time of sampling using tapes.
Tree-ring width series were transformed to basal area increment (BAI) series since it is a two-dimensional measure that better represents the growth trend of the whole tree than one-dimensional tree-ring width [55]. We assumed concentric rings and used the following equation:
BAI = π (R2tR2t−1),
where R2t and R2t−1 are the radii corresponding to the years t and t − 1, respectively.

2.3. Tree-Ring Isotopic Composition

Carbon and oxygen isotope analysis was performed in groups of five contiguous rings for the period 1915–2018 (e.g., 1915–1919, 1920–1924, etc.) pooled by tree-vigor class level (n = 21 samples per vigor class). For that purpose, the wood radii of each tree were carefully separated using a scalpel in 5-year segments, milled and homogenized to a fine powder using a ball mill (Retsch ZM1, Haan, Germany). Stable isotope composition was measured at the Stable Isotope Facility (University of California, Davis, CA, USA). The isotopic composition of carbon (δ13C) and oxygen (δ18O) were expressed relative to Vienna Pee Dee Belemnite and Vienna Standard Mean Ocean Water standards, respectively [56]. The accuracy of the analyses (SD of working standards) was 0.05–0.21‰.
Intrinsic water-use efficiency (iWUE) was calculated from δ13C as the ratio between the photosynthetic rate (A) and the stomatal conductance rate (gS), according to the next equation [27]:
iWUE = Ca × [1 − (Ci/Ca)] × 0.625,
where Ca and Ci are CO2 concentrations in the atmosphere and the intercellular space, respectively, and 0.625 is the relation among conductance of H2O and CO2. To determine Ci, we used the following equation:
Ci = Ca [(δ13Ctree − δ13Catm + 1)/(ba)],
where δ13Ctree and δ13Catm are the tree and atmospheric C isotope compositions, respectively, a is the diffusion fractionation across the boundary layer and the stomata (+4.4‰) and b is the Rubisco enzymatic biologic fractionation (+27.0‰). Estimated values of δ13Catm were obtained from [57].

2.4. Nutrient Analyses

Xylem nutrient concentrations were measured in the same milled wood segments than isotope composition, that is, 5-year pools grouped by tree-vigor classes for the period 1915–2018. Phosphorus (P), potassium (K), calcium (Ca), manganese (Mn), magnesium (Mg), aluminum (Al) and zinc (Zn) concentrations were measured by inductively coupled plasma optical emission spectrometry (ICP-OES; Thermo Elemental Iris Intrepid II XDL, Franklin, MA, USA) after a microwave-assisted digestion with HNO2:H2O2 (4:1, v/v). Wood nitrogen (N) mass-based concentration (%) was measured with an elemental analyzer (Elementar VarioMAX N/CM, Hanau, Germany). In addition, seven meaningful molar ratios were calculated (N:P, N:K, P:Mn, K:Ca, Ca:Mn, Ca:Al, and Mg:Mn), as they have been proposed to better reflect the environmental changes than simple elemental concentrations [39,58].

2.5. Data Analyses

Trends in climatic variables, isotopes and nutrient composition were assessed using the Kendall τ statistic. Breakpoint analysis was applied to detect structural changes in BAI series corresponding to the onset of growth decline in each tree-vigor class. Then, trends were calculated for the periods before and after break point date. Differences between L and D trees regarding DBH, isotopic composition, elemental concentrations and molar ratios were assessed for the whole series using the Mann–Whitney U test. We used the Wilcoxon rank-sum test to check if the changes through time of BAI differed between tree-vigor classes.
In order to avoid spurious relationships that may arise from strong temporal dependence, we detrended BAI and isotope composition series by means of the Ensemble Empirical Mode Decomposition (EEMD) technique. EEMD is an empirical but highly efficient and adaptive method for processing non-linear and non-stationary signals [59]. This methodology has been successfully applied to ecological time series including dendrochronological [60,61], phenological [62], and nutrient content and stoichiometric ratios [63] data. The EEMD decomposes a time series into a small number of oscillatory components, from high to low frequencies, and a residual (trend) component using a spline-based iterative shifting process. Detailed description of EEMD can be found in [59,64,65]. Detrended BAI and isotopic signal series were constructed by summing the three and two first oscillatory components, respectively. Finally, we obtained mean detrended BAI chronologies of L and D trees using a bi-weight robust mean.
Climate-growth relationships were evaluated through bootstrapped correlations between monthly mean temperature and precipitation and mean detrended BAI chronologies for the period 1931–2018, which corresponds to the period with available instrumental records. We also computed correlations between detrended iWUE and δ18O and climate variables averaged in 5-year periods. The window of analysis spanned from previous April to April of the year of tree-ring formation.
We performed a non-metric multidimensional scaling (NMDS, [66]) with Euclidean dissimilarity for nutrient concentrations (N, P, K, Ca, Mn, Mg, Al and Zn) and stoichiometric ratios (N:P, N:K, P:Mn, K:Ca, Ca:Mn, Ca:Al and Mg:Mn) to obtain a multidimensional overview of the long-term nutritional status and nutrient imbalances, respectively, of the two vigor classes. Significant differences between L and D trees were tested with permutational multivariate analysis of variance (PERMANOVA, [67]). The NMDS axes were correlated with detrended iWUE and δ18O and projected into the ordination space. Additionally, relationships between detrended isotopic signals and individual nutrient concentrations and stoichiometric ratios were assessed using pairwise Spearman rank correlations (ρ).
To integrate the effect of nutrient status and isotopic signals on tree-level BAI, we fitted linear mixed-effects models (LMMs, [68]). A different LMM was fitted for each vigor class. Fixed effects were DBH, iWUE, δ18O and scores of the NMDS1 and NMDS2 of ordinations of nutrient concentrations and stoichiometric ratios. A random intercept associated with tree and a first-order autocorrelation structure were included in the models [69]. BAI was log-transformed (log (x + 1)) prior to analyses in order to achieve normality assumptions. Fixed effects were standardized prior to model fitting to enable direct comparison among coefficients of predictors. The goodness-of-fit of the models was evaluated with the coefficient of determination for GLMMs (R_GLMM2) proposed by Nakagawa et al. [70]. Marginal R2 (R_GLMM(m)2) accounts for the proportion of variance explained by the fixed effects, and conditional R2 (R_GLMM(c)2) is interpreted as the variance explained by the entire model, that is, fixed plus random effects.
We performed all statistical analyses in R (version 3.6.3, Vienna, Austria) [49]. Processing of dendrochronological data was conducted with the R package dplR [71]. Trends in temporal series and break points analysis were assessed with the R packages Kendall [72] and strucchange [73], respectively. EMMD detrending was conducted using the R-package Rlibeemd [74]. Climate-growth associations were evaluated using the treeclim package [75]. Multivariate analysis was performed with the R package vegan [76]. The R packages nlme [77] and MuMIn [78] were used to fit LMMs and calculate goodness of fit, respectively.

3. Results

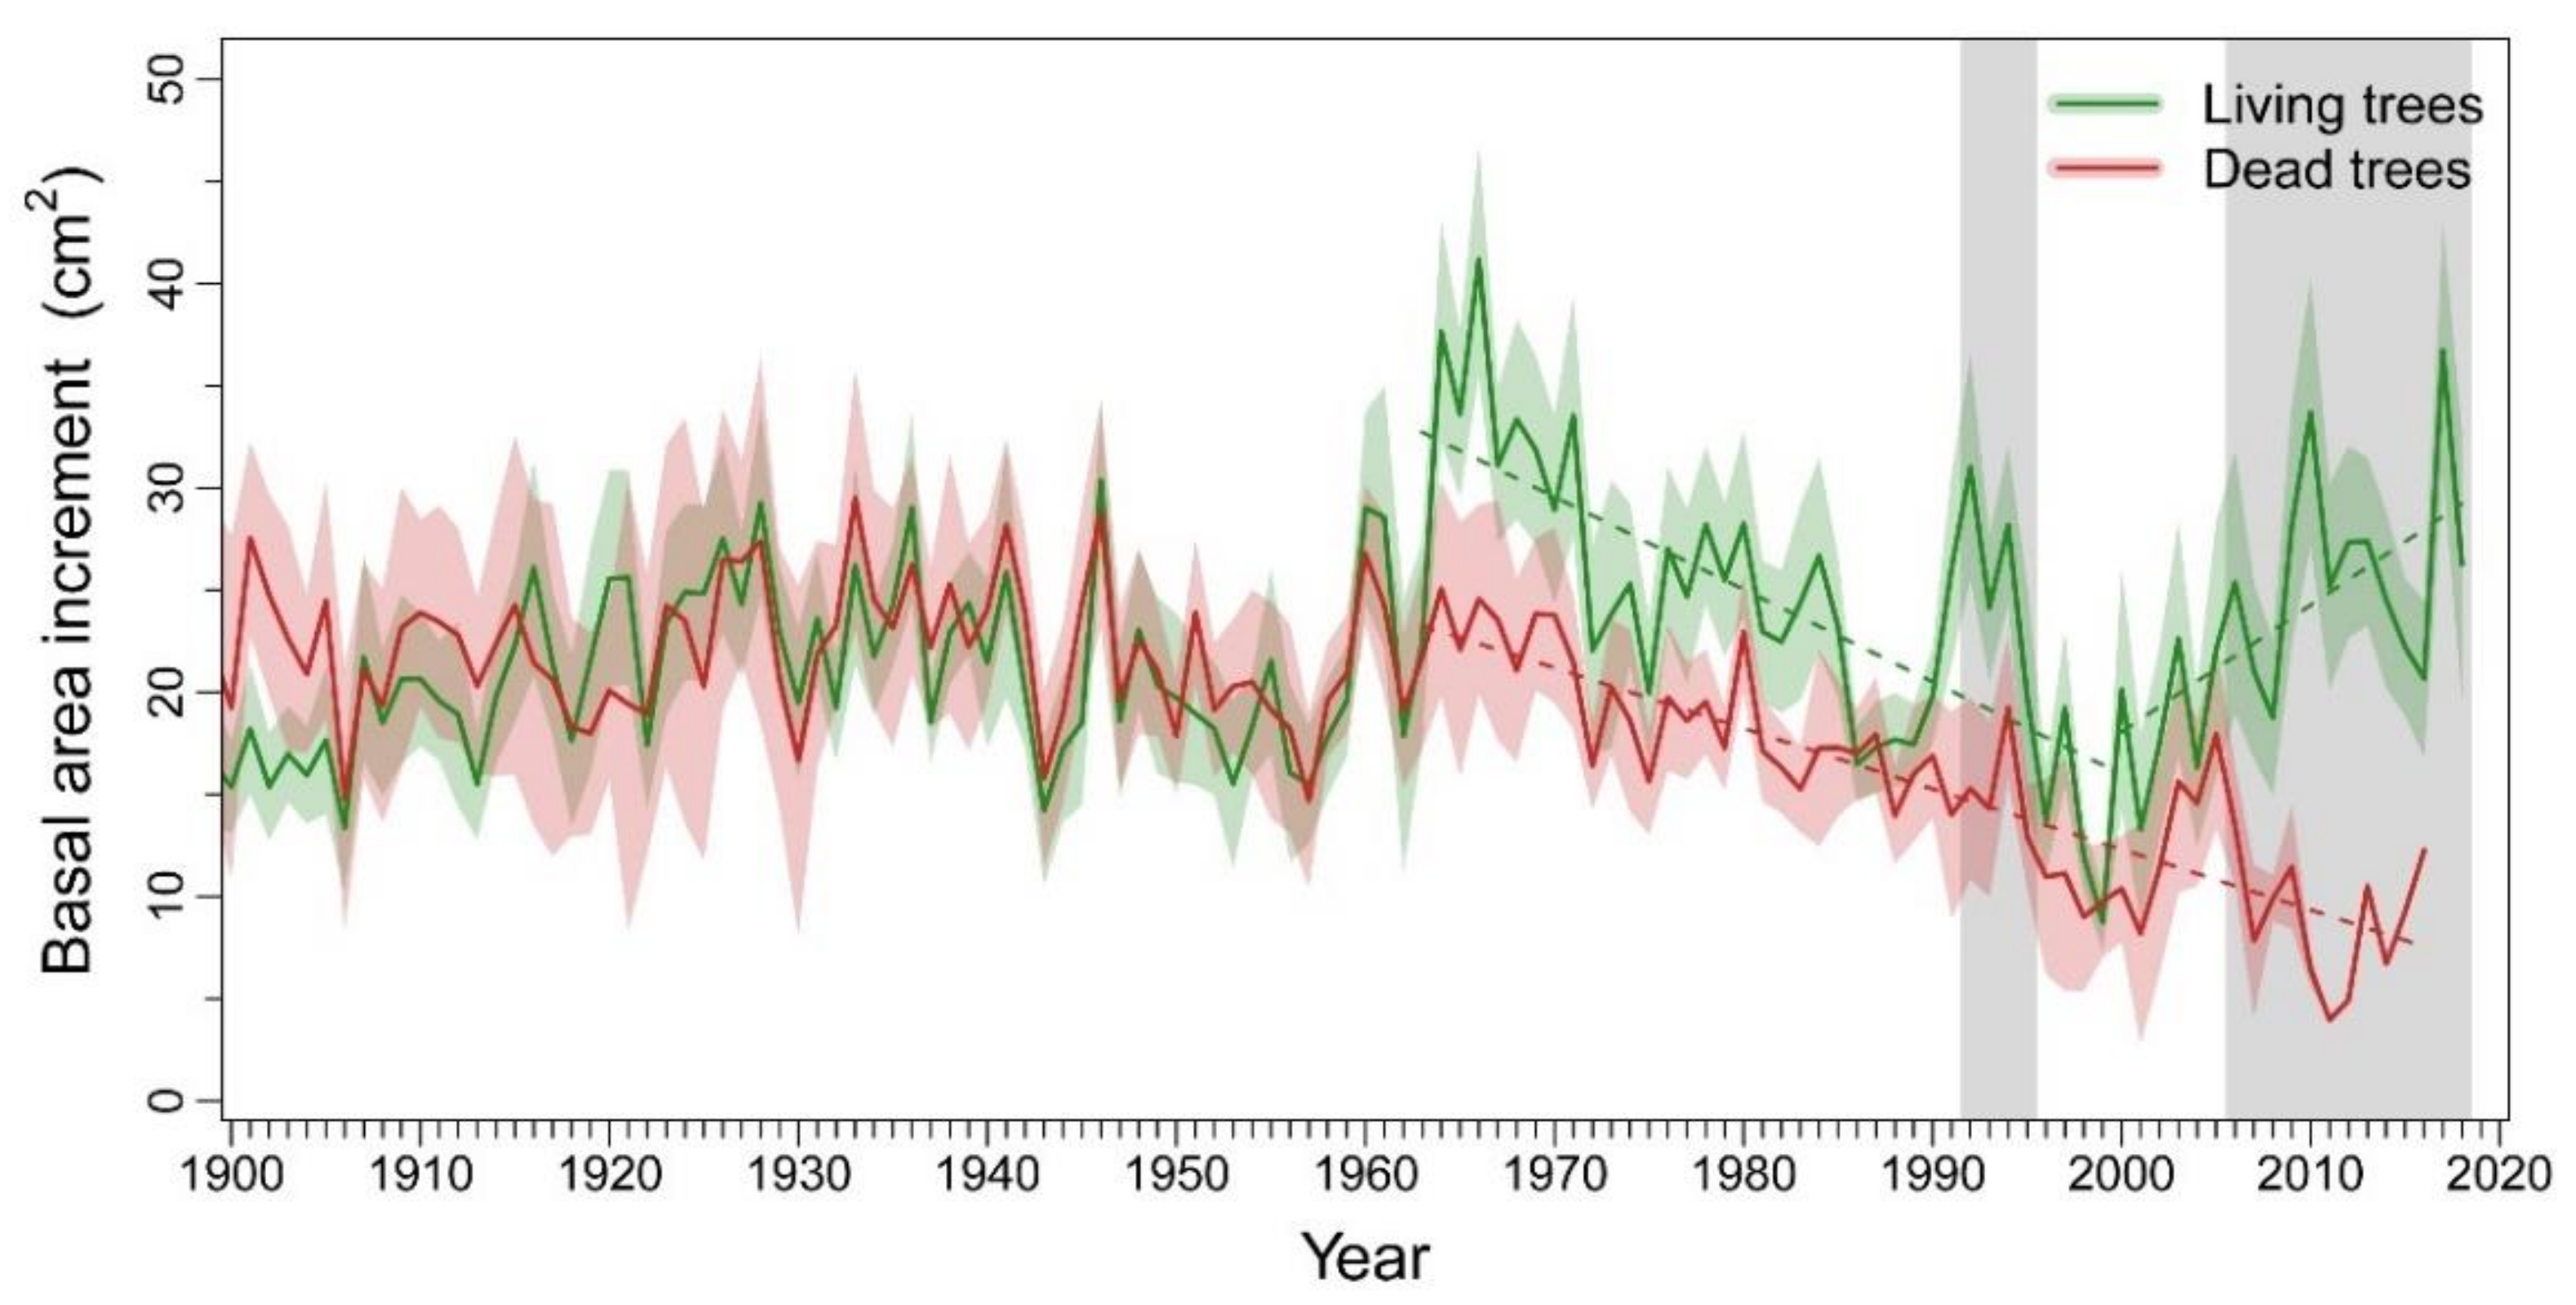
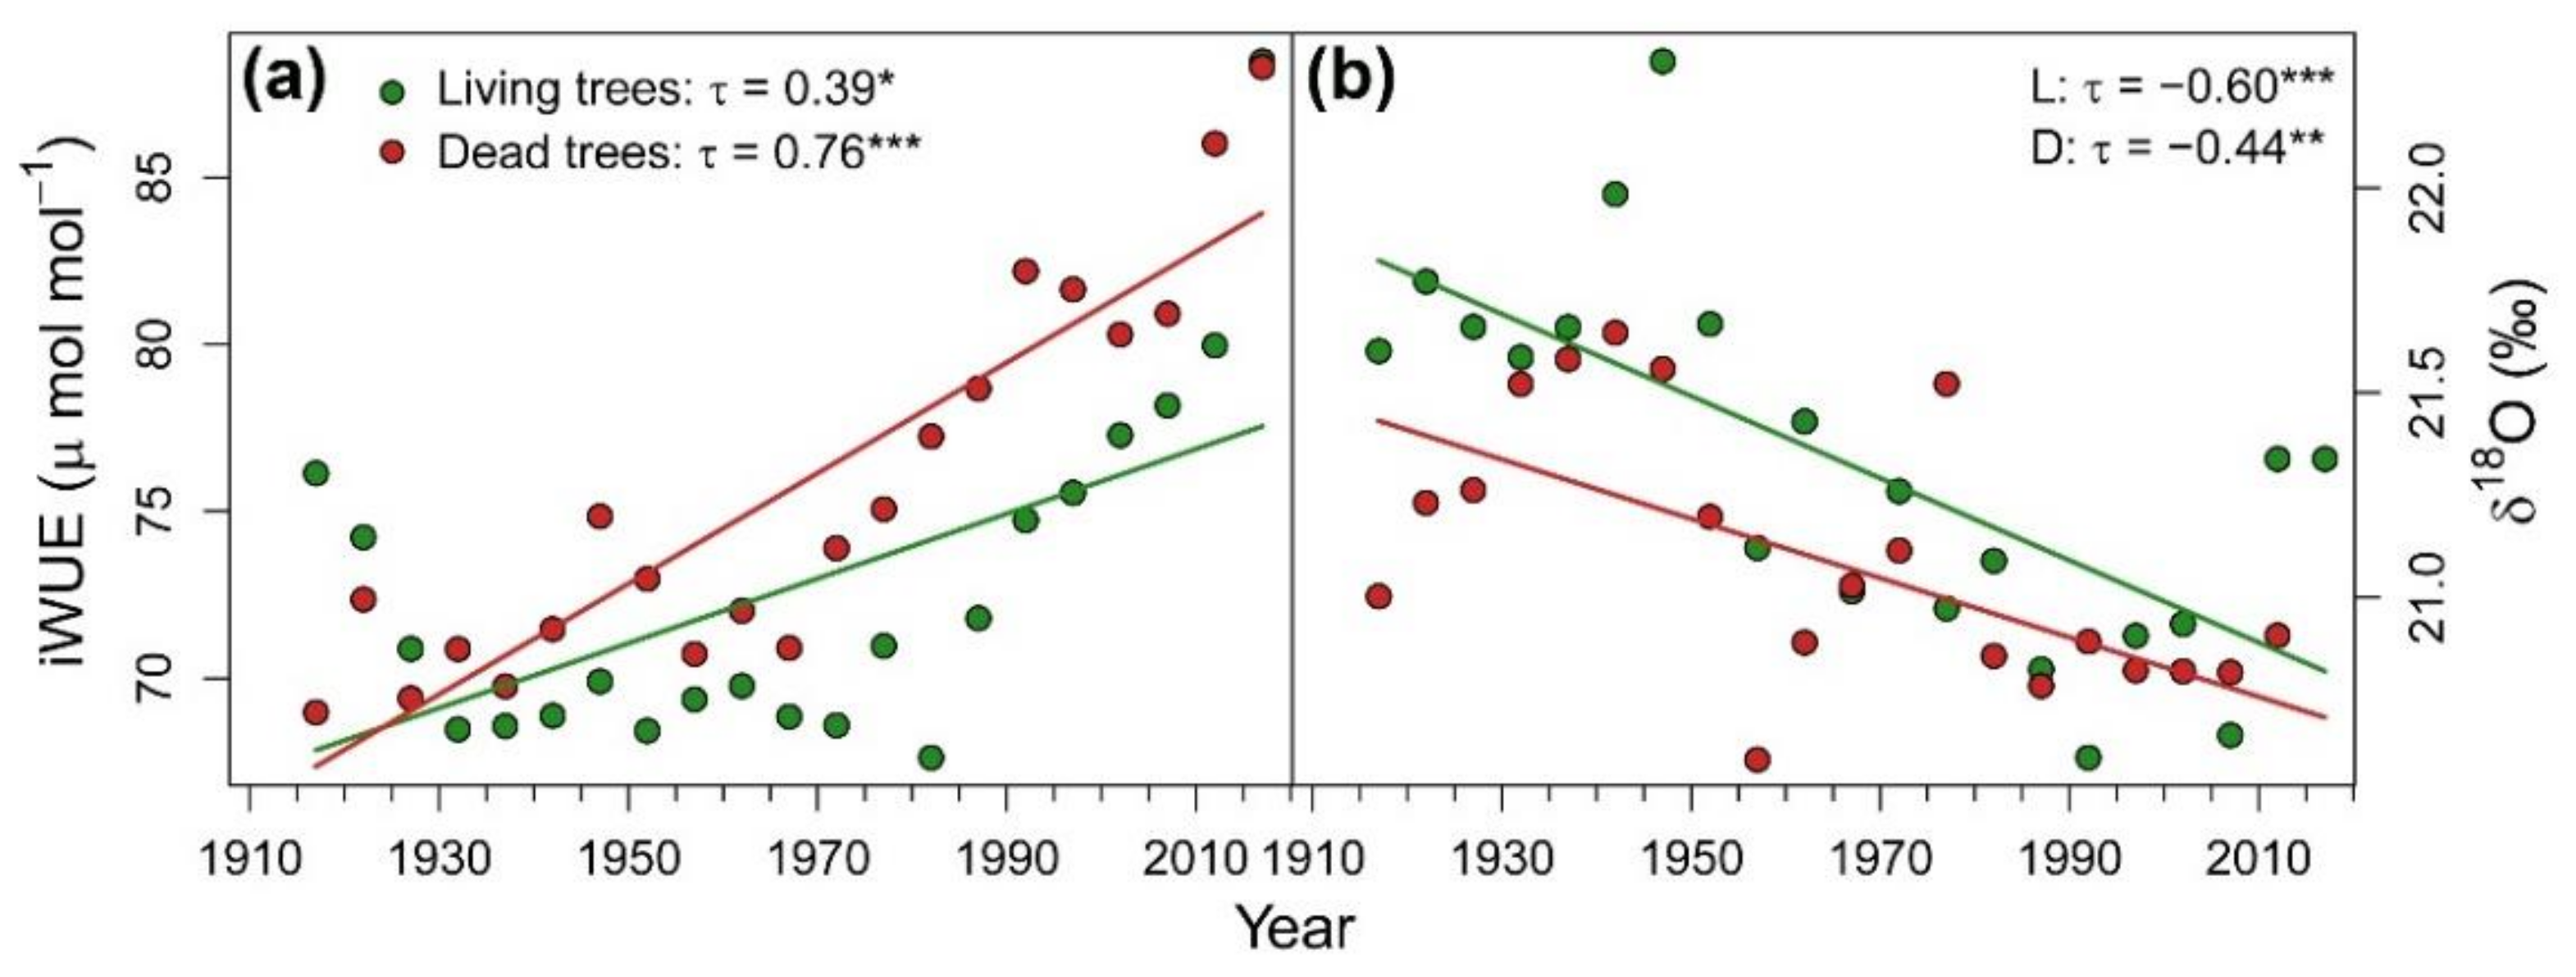
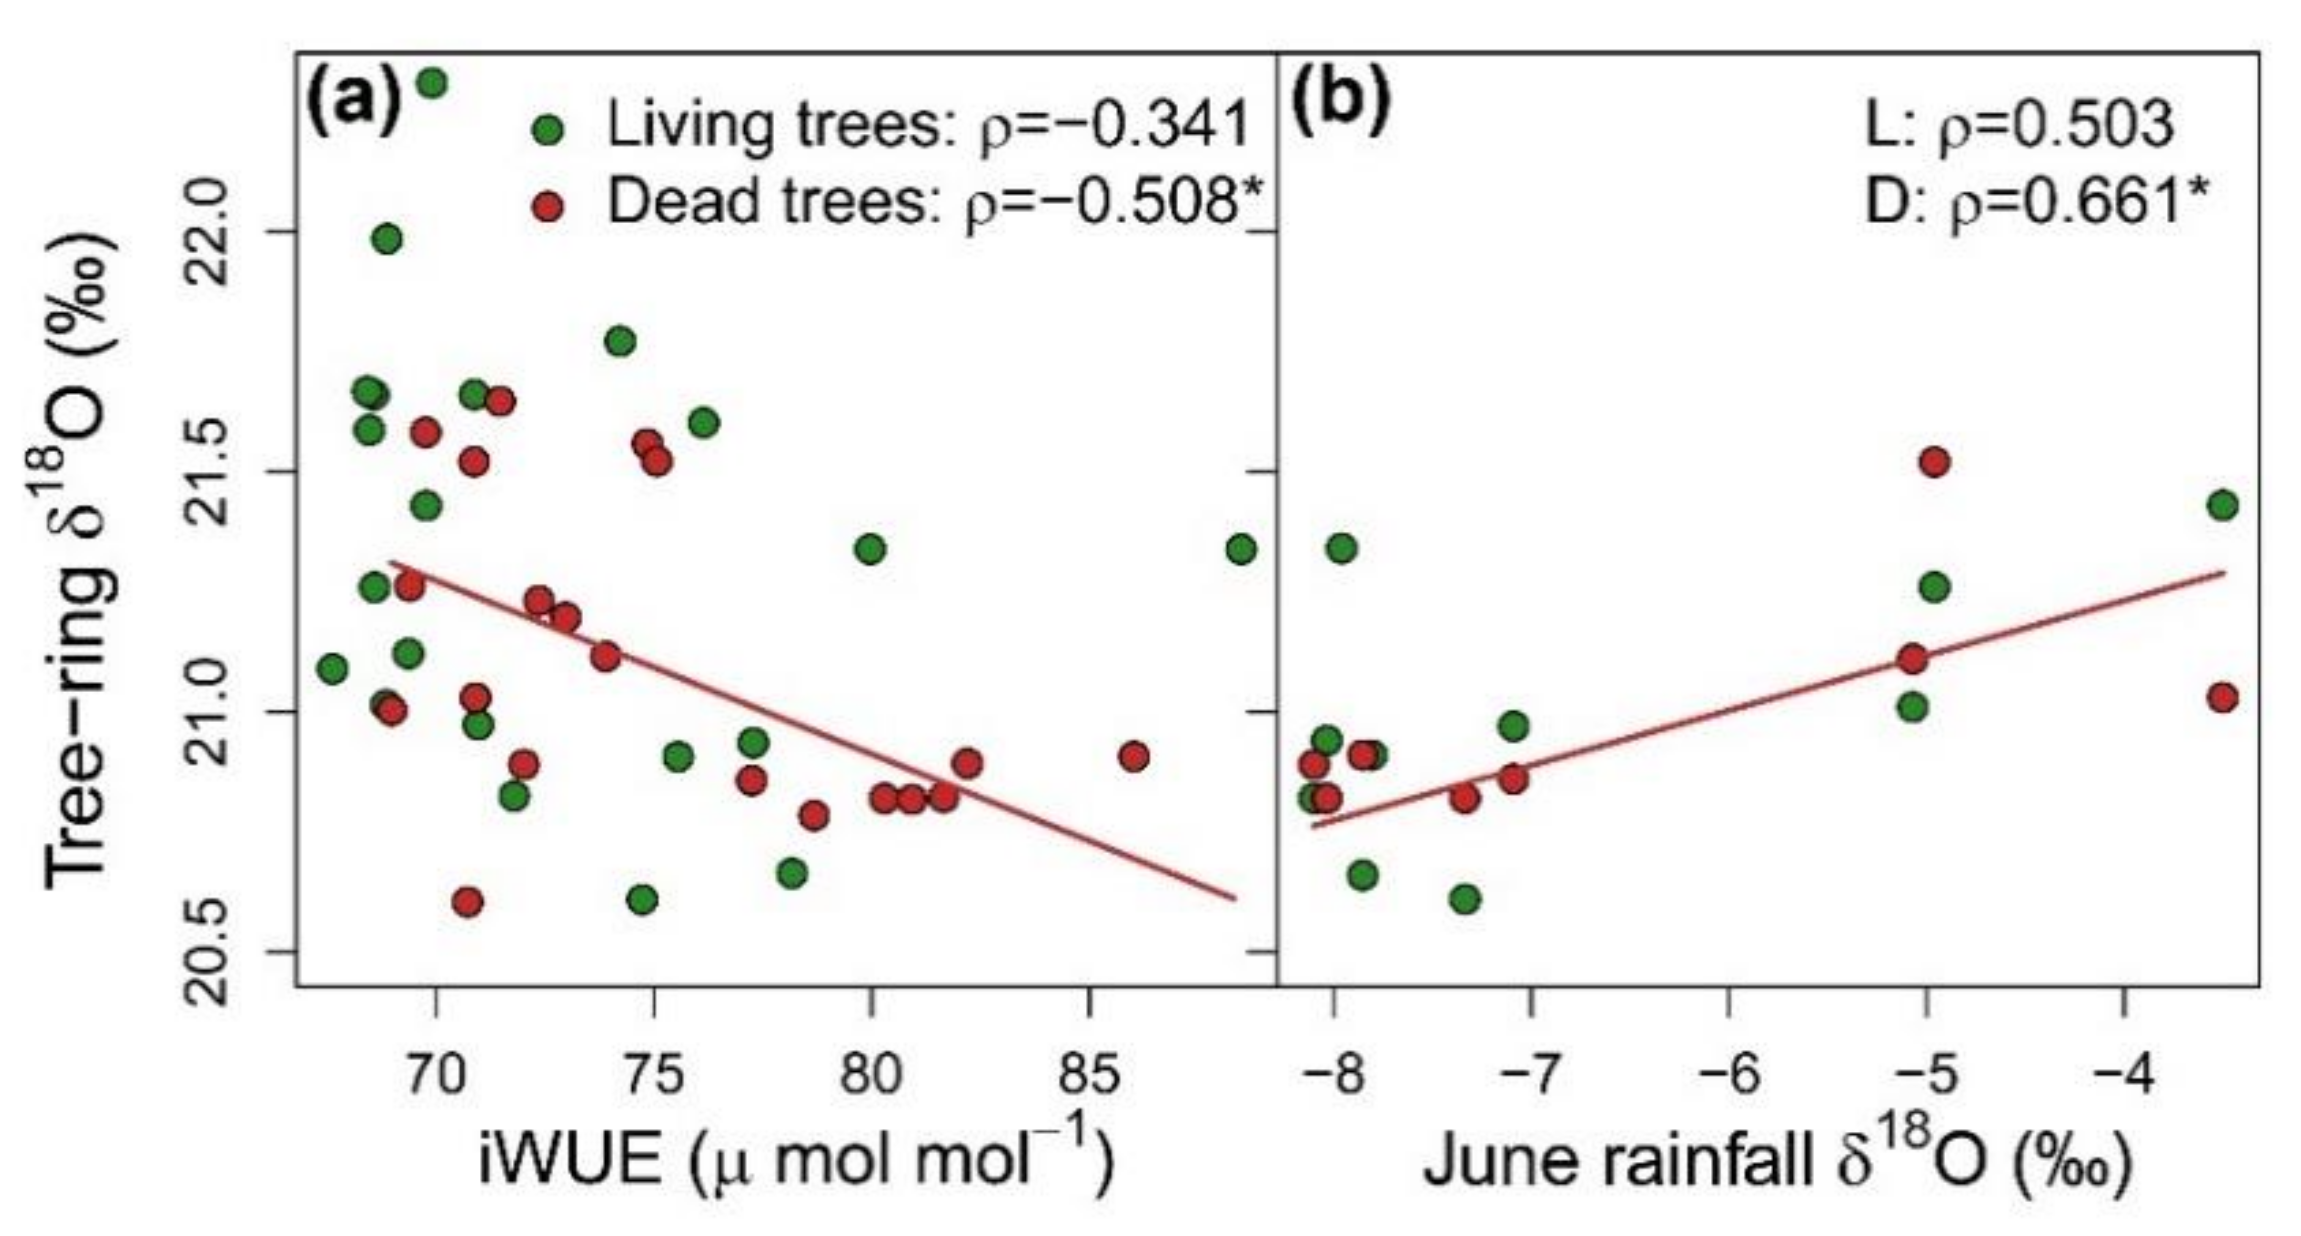
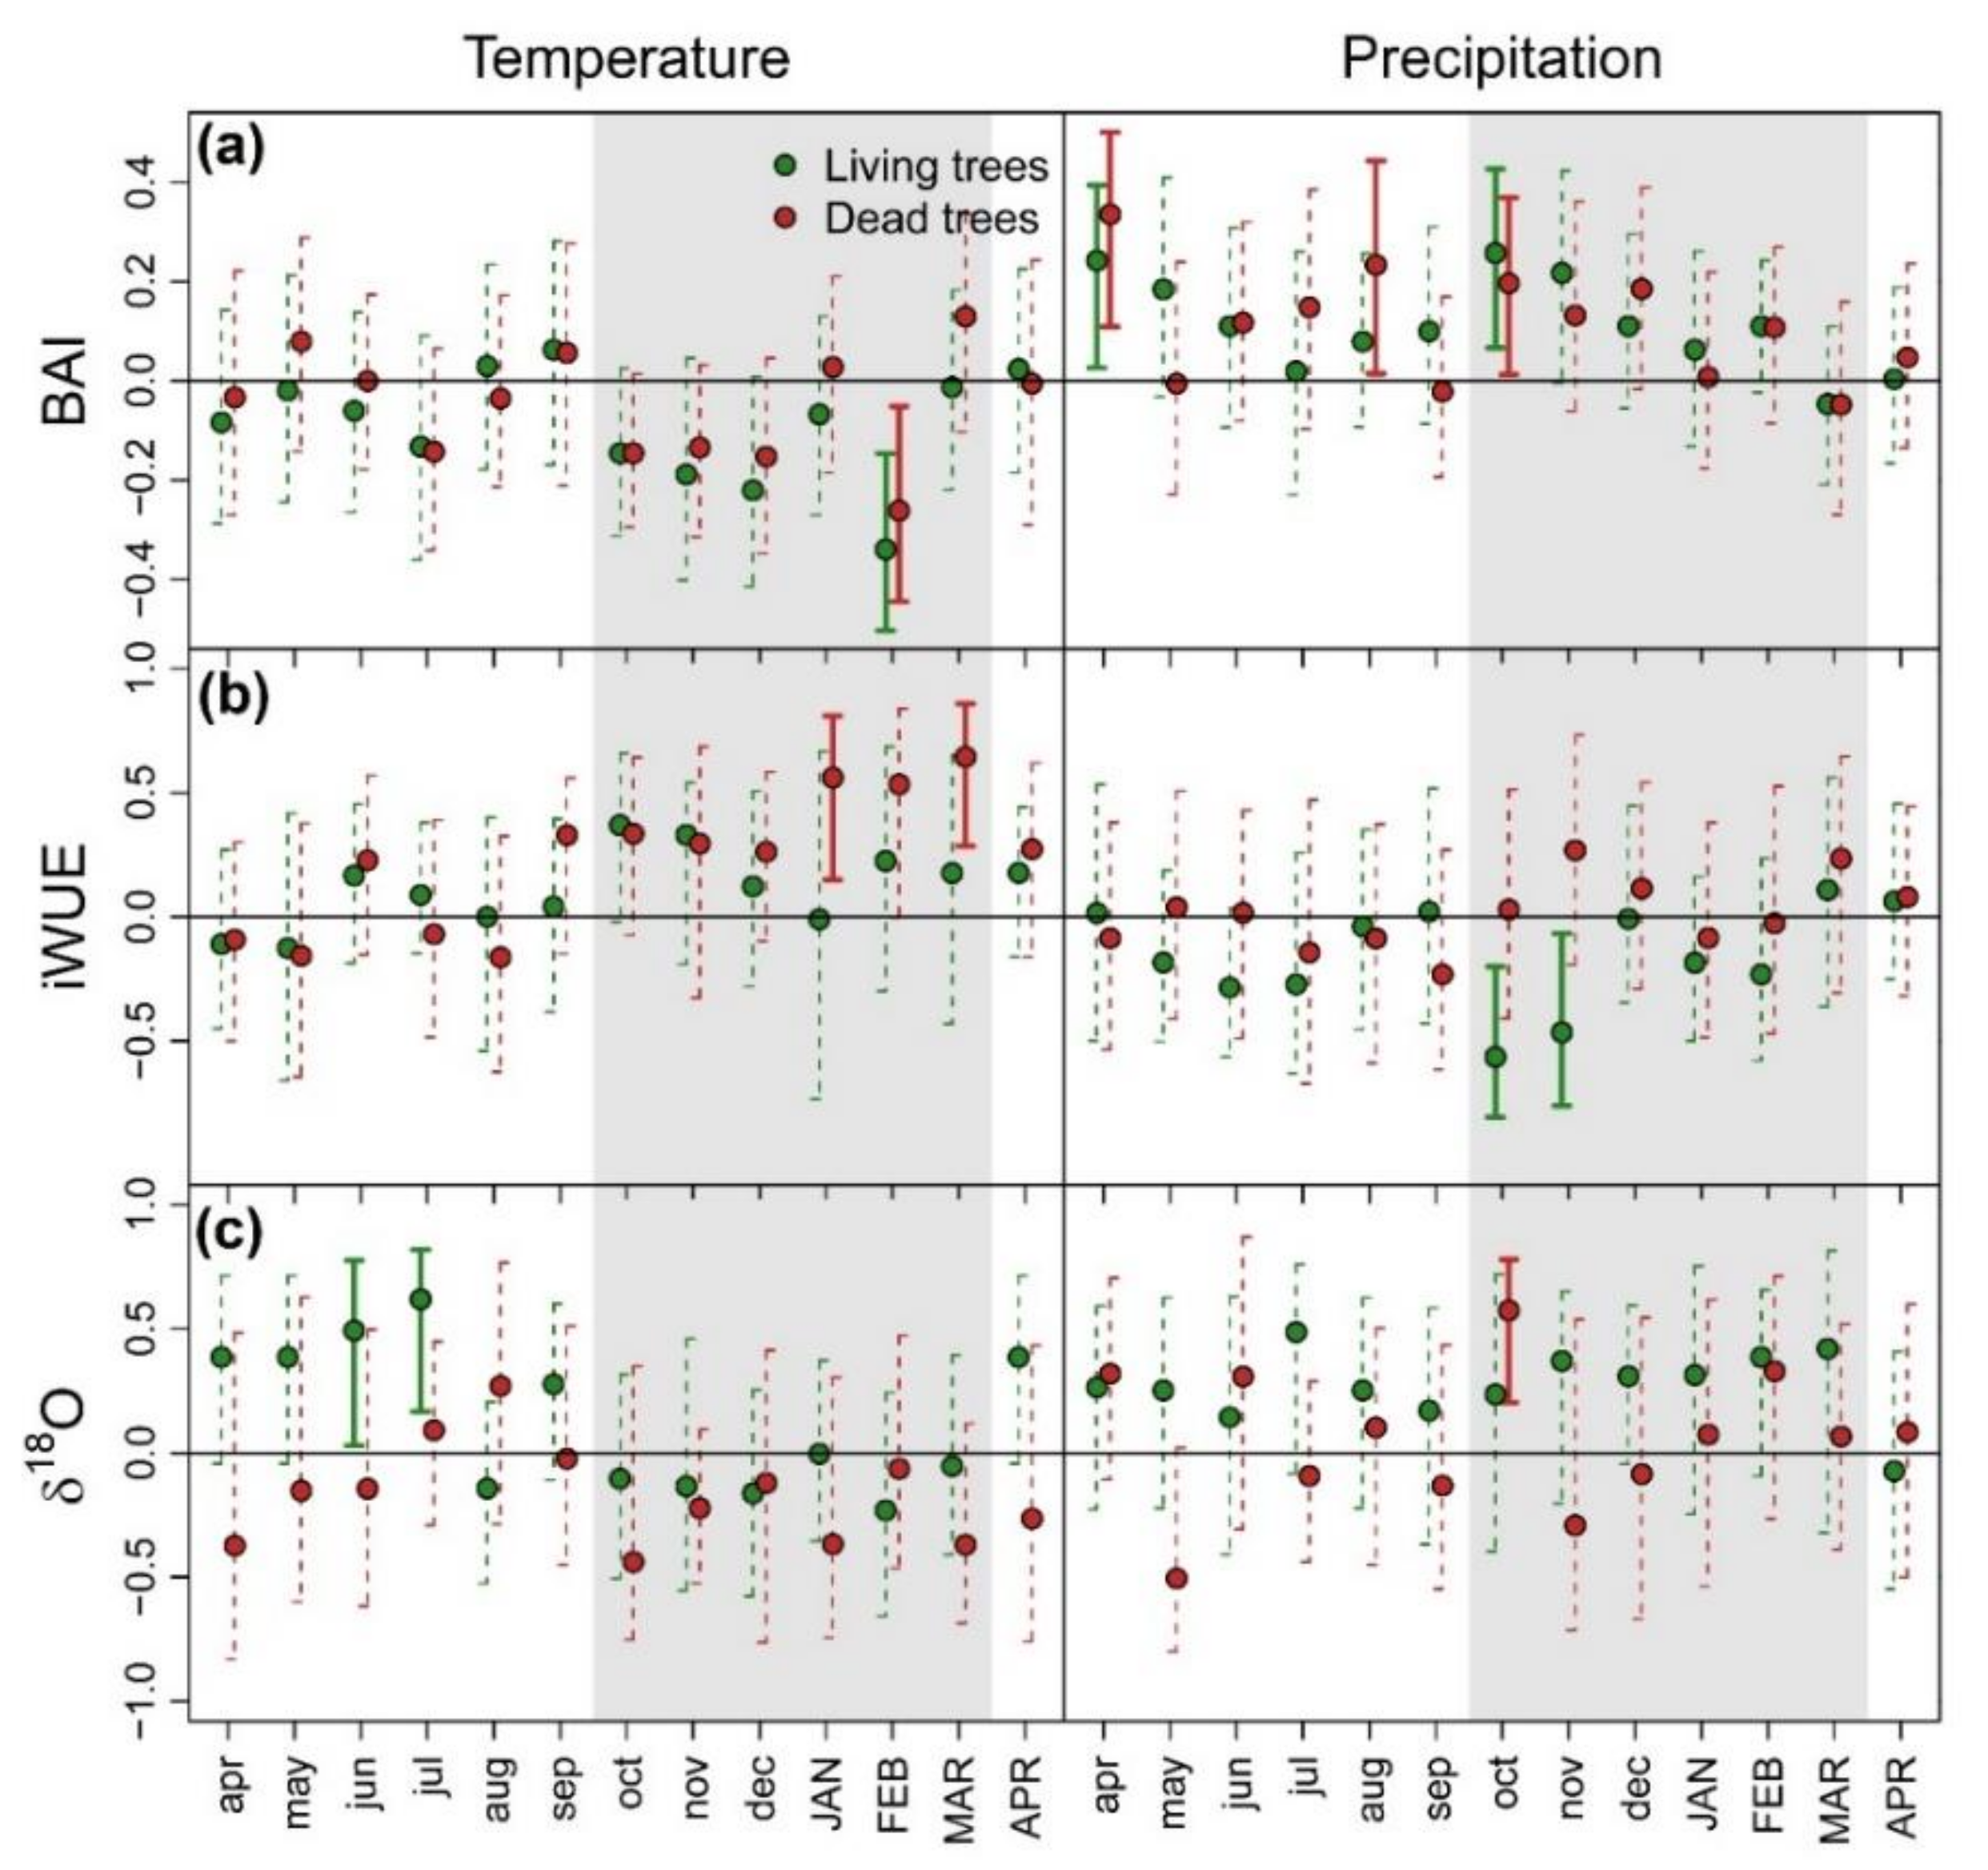
3.1. Patterns and Climate-Drivers of Growth and Tree-Ring Isotope Signature

We found significant temporal trends of increasing growing season temperature (τ = 0.275, p < 0.001) and decreasing precipitation (τ = −0.162, p = 0.026) along the 1931–2018 period (Figure A1). Extreme drought events were identified during growing seasons of 1954, 1979, 1999, 2008 and 2015–2016 (dates are referred as the end year of the growing season), based on SPEI values of the growing season below the −1.5 threshold.
We did not find significant differences in DBH between L trees (58.6 ± 9.82 cm) and D trees (55.8 ± 15.36 cm) (U = 118, p = 0.533). Mortality dates of D trees ranged from 1998 to 2016, being 1999 the most repeated year of death (n = 8 trees). Radial growth of the two tree-vigor classes ran closely until the early 1960s, when L trees displayed an increase in BAI not shown by D trees (Figure 1). Nevertheless, we found a common trend break point in both vigor classes corresponding to 1962–1963. No significant trends in BAI were found neither in L trees (τ = 0.087, p = 0.311) nor in D trees (τ = −0.069, p = 0.421) before 1963, but afterwards trends became significantly negative in both vigor classes (L trees: τ = −0.546, p < 0.001; D trees: τ = −0.692, p < 0.001). A second break point was detected in mean BAI series of L trees in 1998–1999, when the prior negative trend turned positive (τ = 0.463, p = 0.005). BAI significantly differed between vigor classes during the 1992–1995 period and from 2006 onwards.
Considering the whole period together, D trees showed significant higher iWUE (U = 317, p = 0.016) and lower δ18O (U = 120, p = 0.048) than L trees (Figure 2). Both vigor classes presented a positive temporal trend of iWUE that was slightly more pronounced in D trees. δ18O decreased along the study period in both vigor classes. iWUE and δ18O were not correlated in L trees and negatively correlated in D trees (Figure 3a), which suggests that tree-ring oxygen isotopes could reflect variability of water sources δ18O. Indeed, tree-ring δ18O of D trees was positively correlated with oxygen isotope signature of June precipitation (Figure 3b).
The correlation between EEMD detrended BAI chronologies and monthly climatic variables for 1931–2018 identified a significant negative effect of high temperatures during February (summer) on growth of both tree-vigor classes. The growth of both vigor classes positively responded to previous April and October precipitation, which corresponded to previous autumn and current spring, respectively. In addition, D trees showed a positive correlation with previous August (winter) precipitation (Figure 4a). The effects of climatic conditions on iWUE differed between vigor classes. It was positive for summer temperature in D trees and negative for spring precipitation in L trees (Figure 4b). Finally, δ18O of L trees showed significant positive correlations with previous winter temperature. Meanwhile, October precipitation had a positive effect on δ18O of D trees (Figure 4c).

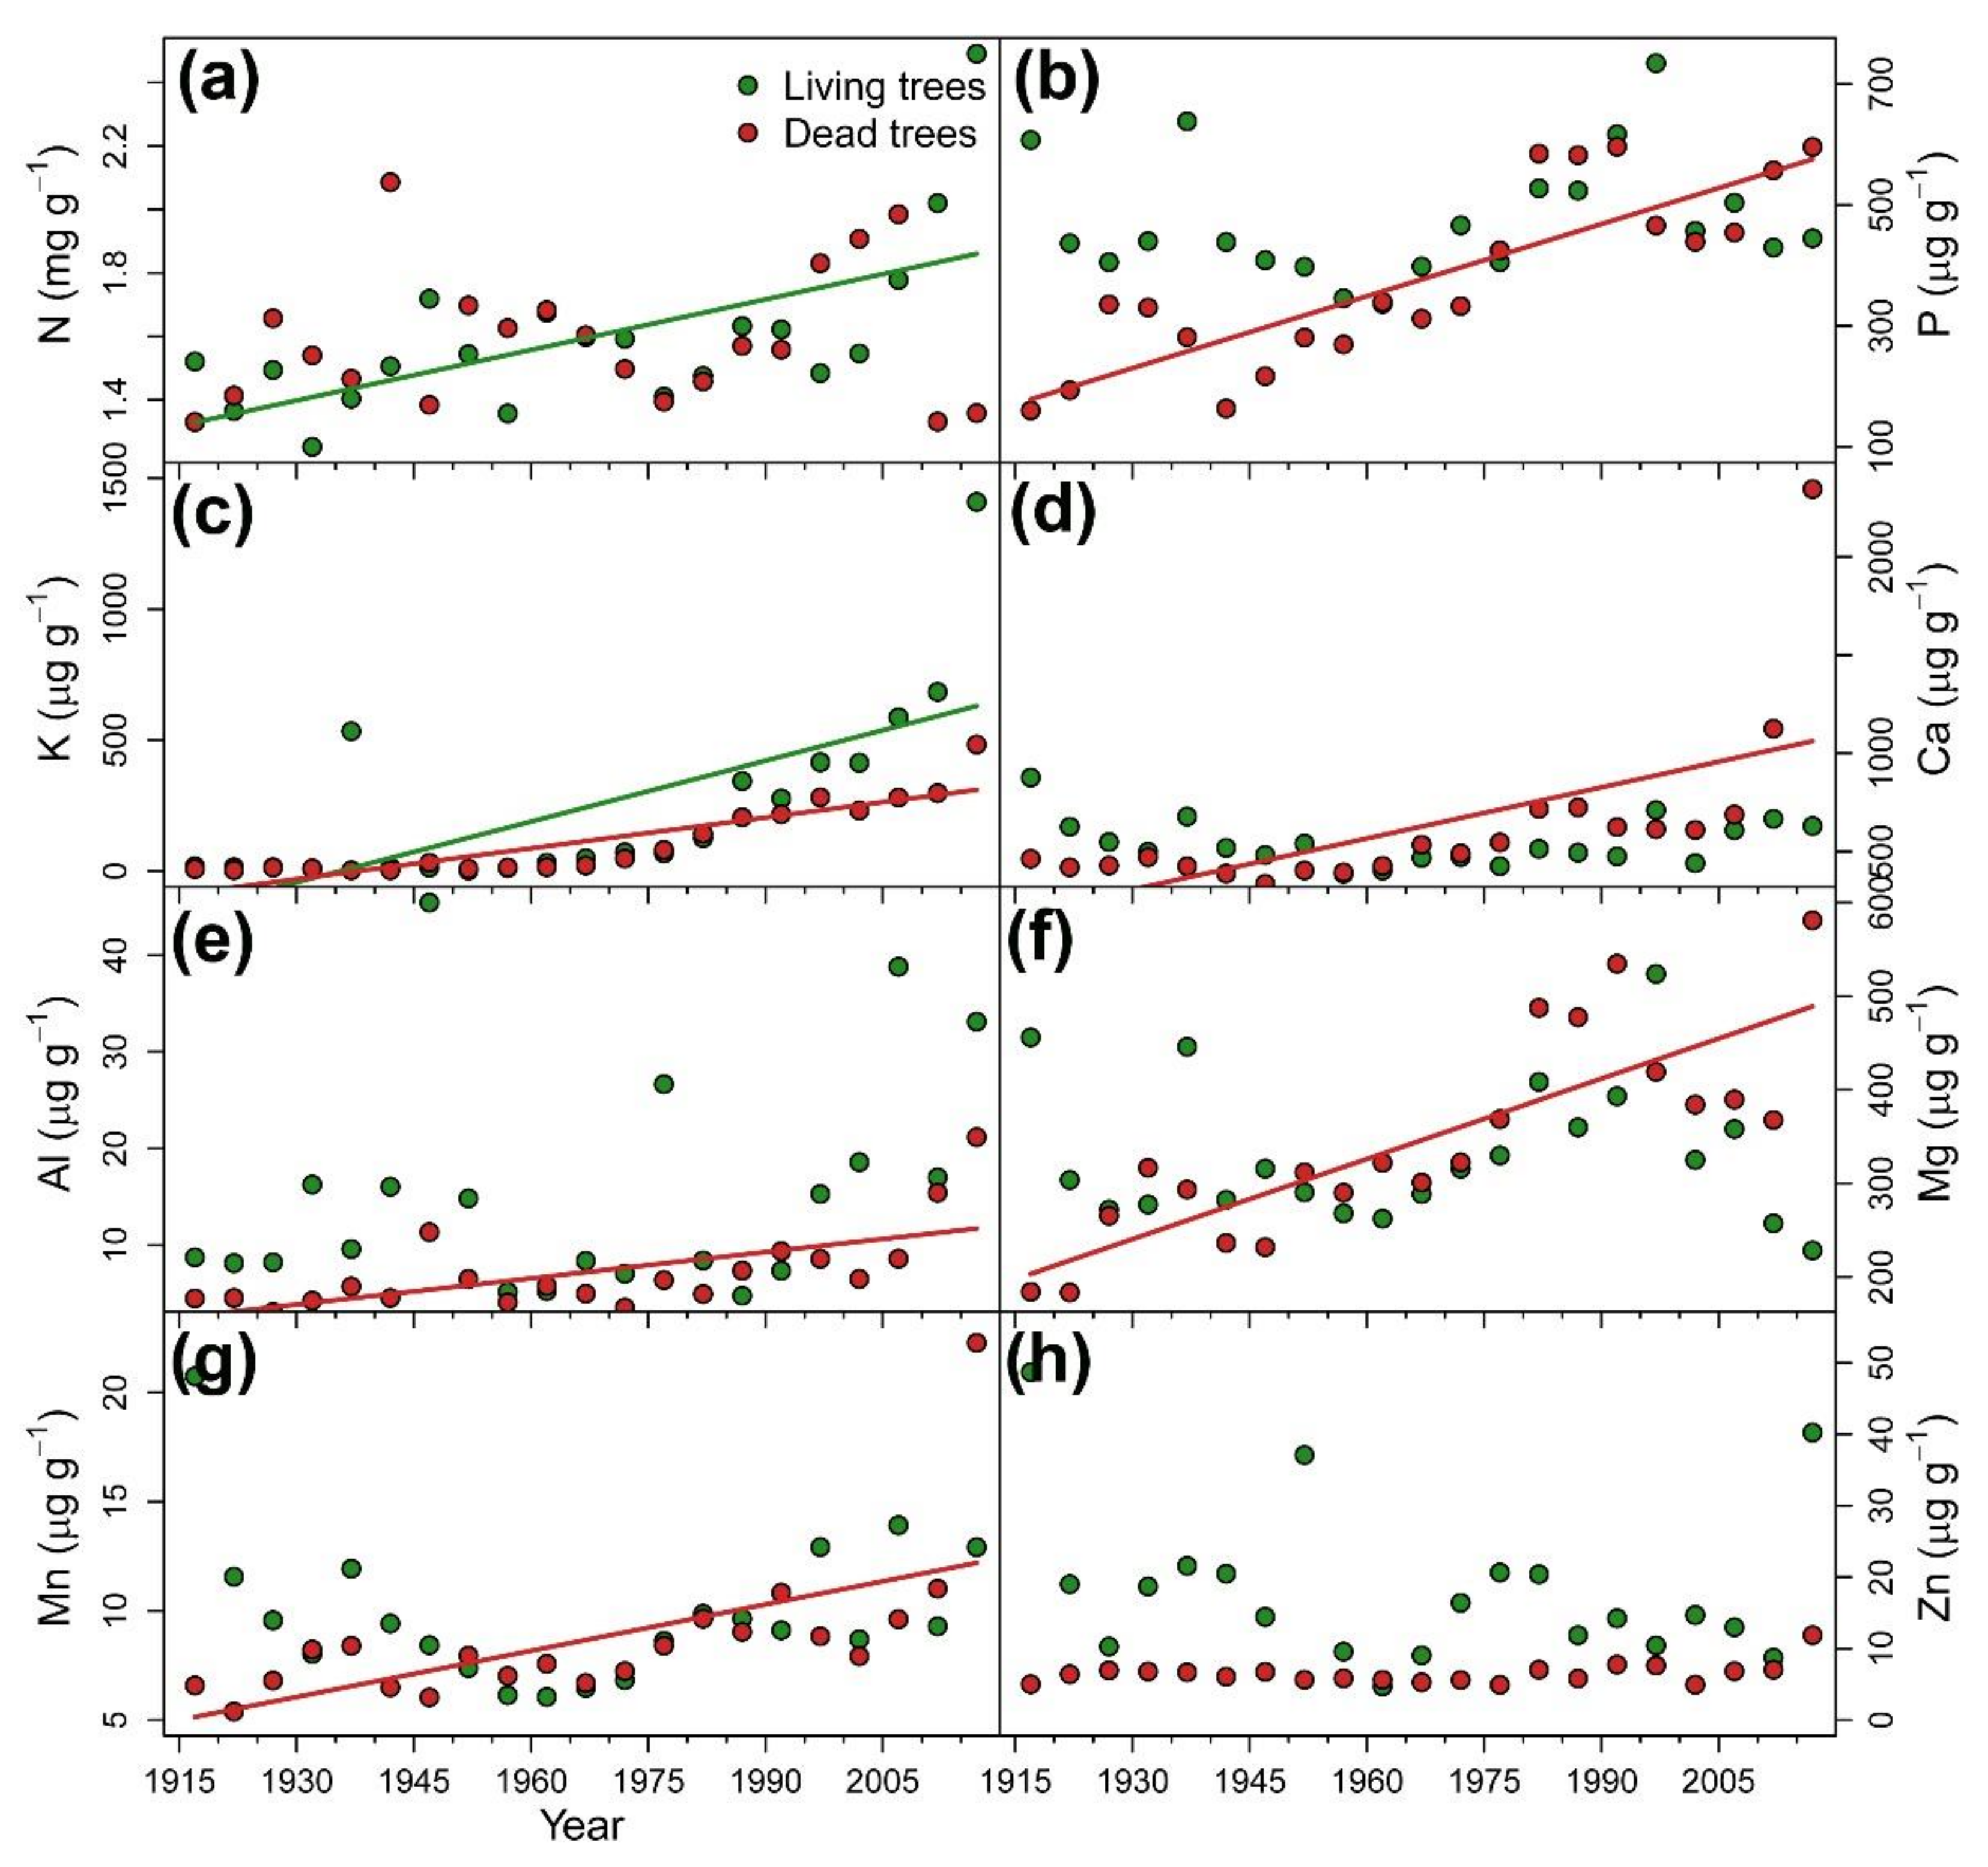
3.2. Long-Term Reconstruction of Tree Nutrient Status

Temporal evolution of nutrient concentrations in tree rings followed specific patterns according to each nutrient (Figure 5). K was the only element showing a concentration increasing along the period 1915–2018 for both tree-vigor classes. Concentrations of P, Ca, Al, Mg, and Mn showed a positive temporal trend only in D trees, whereas N increased in L trees (Table 1). In the case of stoichiometric ratios, N:K and K:Ca showed negative and positive trends, respectively, in both vigor classes. D trees showed increasing P:Mn, Ca:Mn and Mg:Mn ratios over time (Table 1).
Wood-nutrient concentrations for the whole series (1915–2018) differed between tree-vigor classes for P, Al and Zn, which showed higher values in L trees. Regarding stoichiometric ratios, we also found differences between vigor classes for N:P, Ca:Mn, Ca:Al, Mg:Mn (L trees < D trees), and P:Mn (L trees > D trees) (Table 1).
Ordination analyses helped us to characterize the nutritional status and nutrient imbalances of the target trees (Figure 6). Regarding nutrient concentrations, the first axis (NMDS1) was positively related to K, P and Al, and negatively to Ca, Mg and N. The second axis (NMDS2) encompassed most of the variability of Zn. Considering nutrient concentrations, both vigor classes significantly differed (PERMANOVA test F = 6.485, p = 0.001). In agreement with individual comparisons, L trees were associated with higher concentrations of K, P, Zn and Al, whereas D trees showed higher Ca and Mg (Figure 6a). The NMDS1 derived from the ordination of stoichiometric ratios was associated with P- and K-related ratios (K:Ca with positive loadings, N:K and N:P with negative loadings). Meanwhile, the NMDS2 mainly explained the variability of Ca-related ratios (K:Ca with positive loadings, Ca:Mn with negative loadings). We found significant differences in the ordination space of nutrient ratios between vigor classes (PERMANOVA test F = 4.628, p = 0.005). L trees scores were located towards higher values of K:Ca, and D trees showed greater N:P and Ca:Mn (Figure 6b).

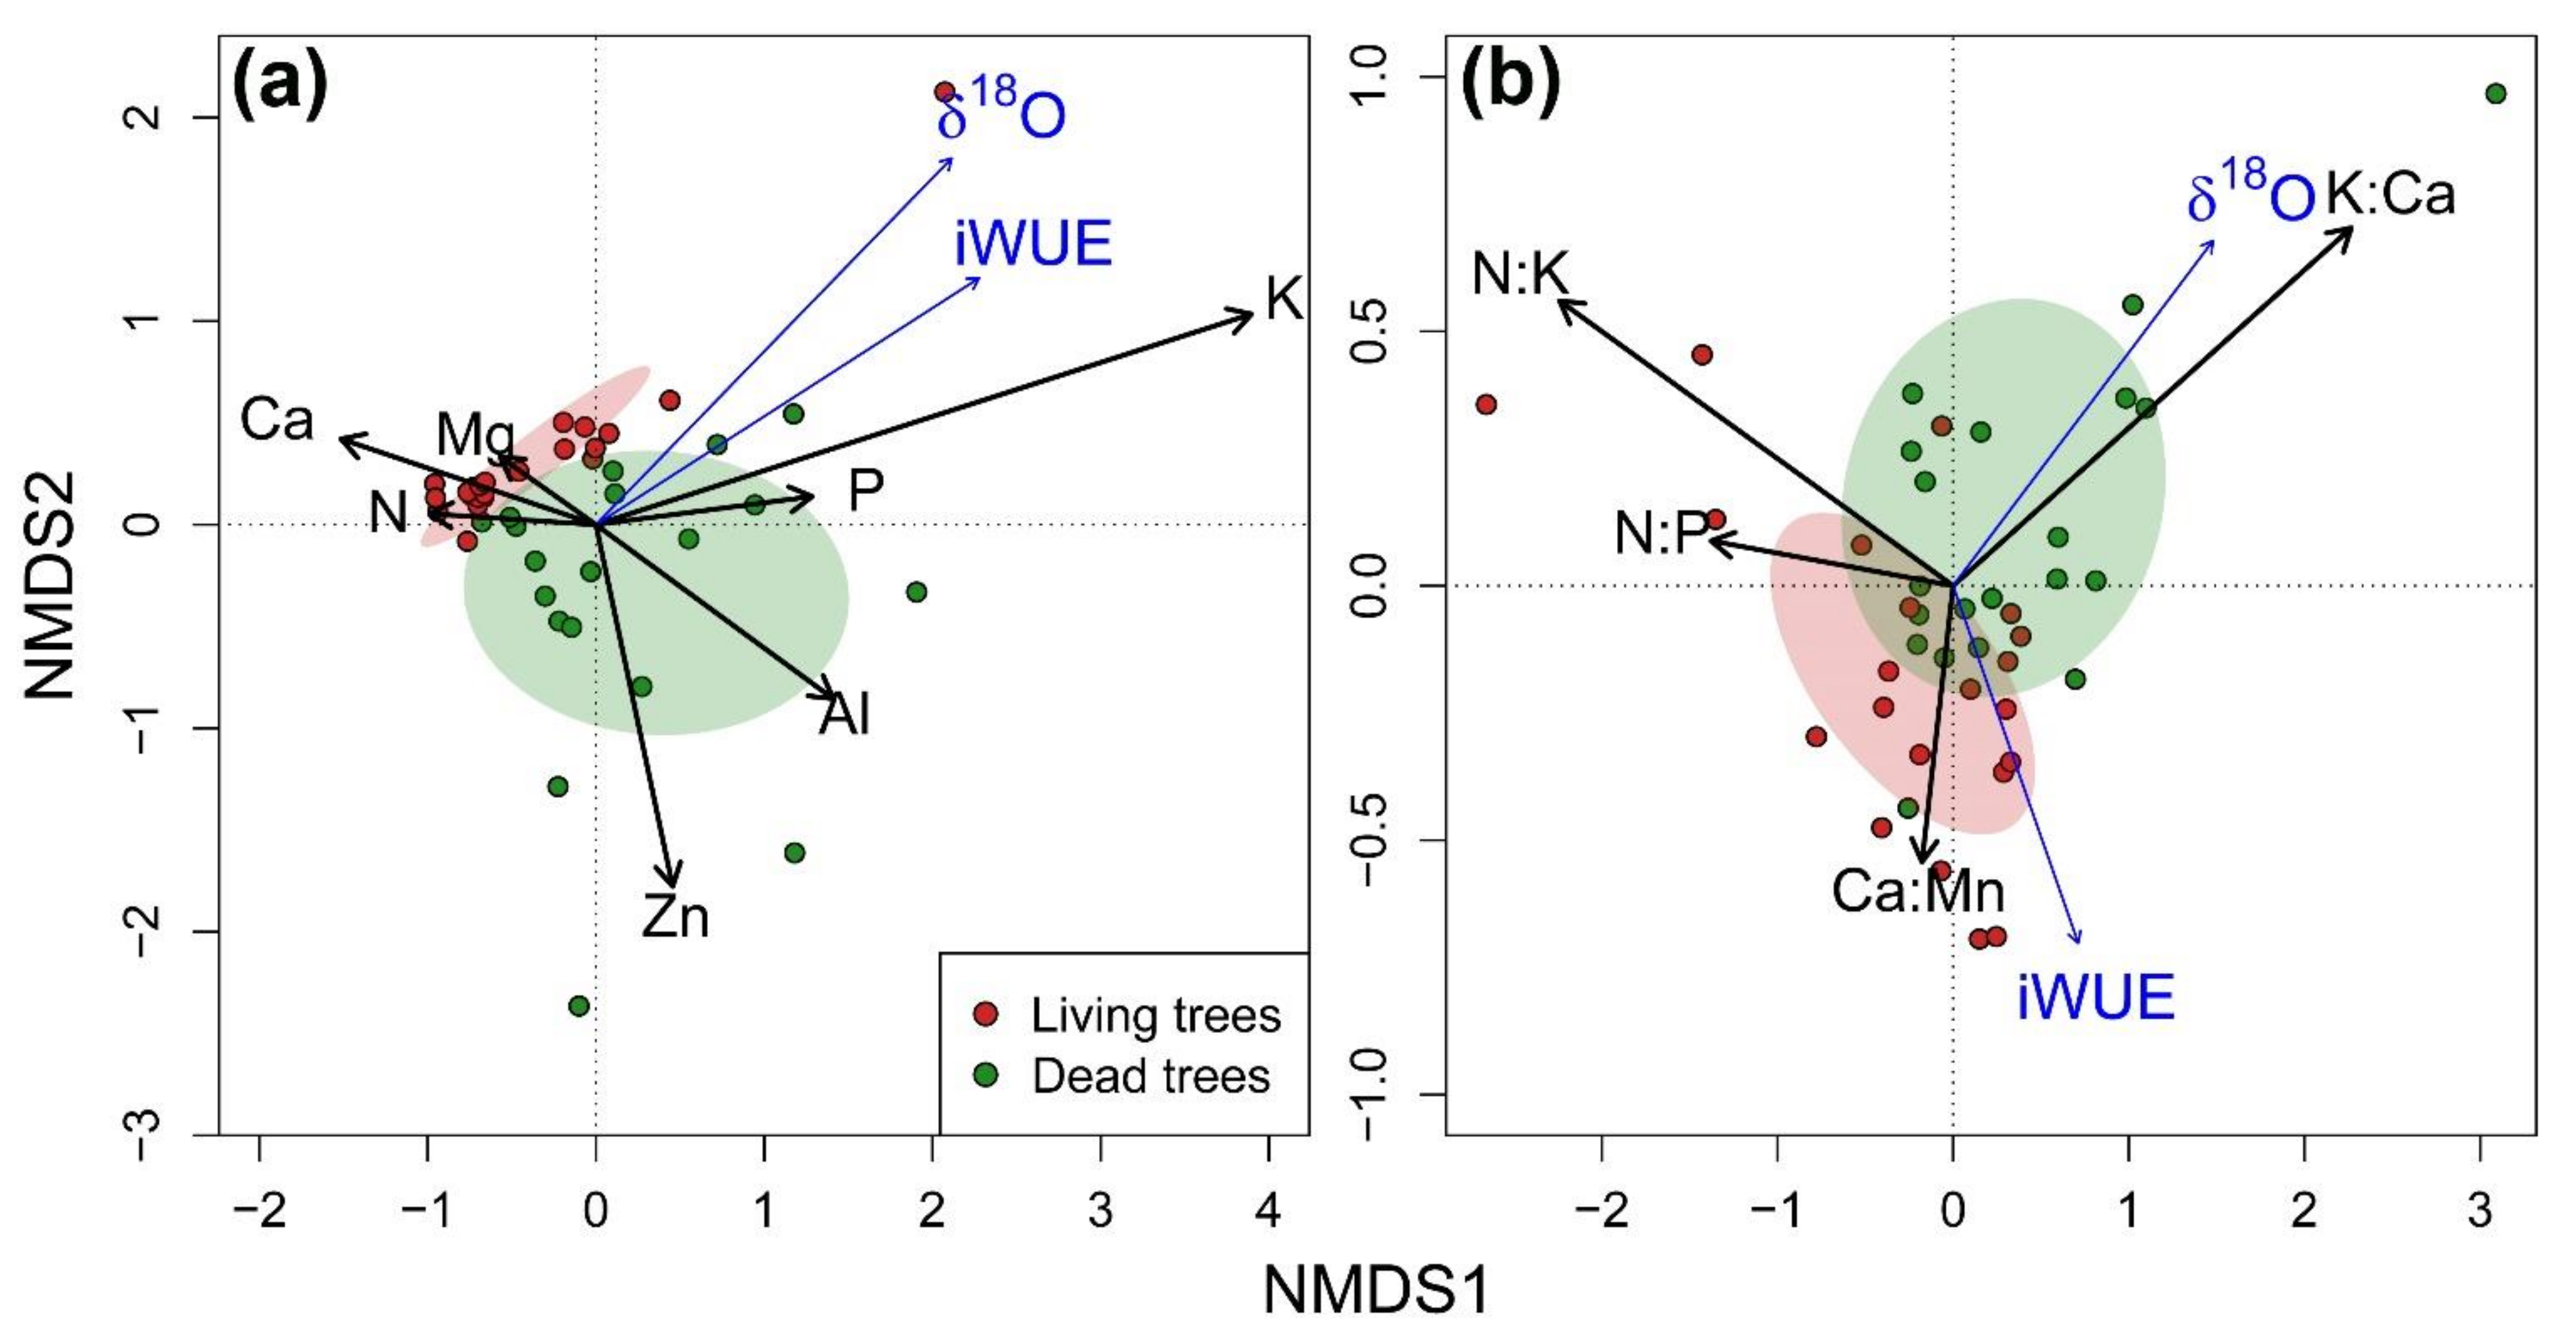
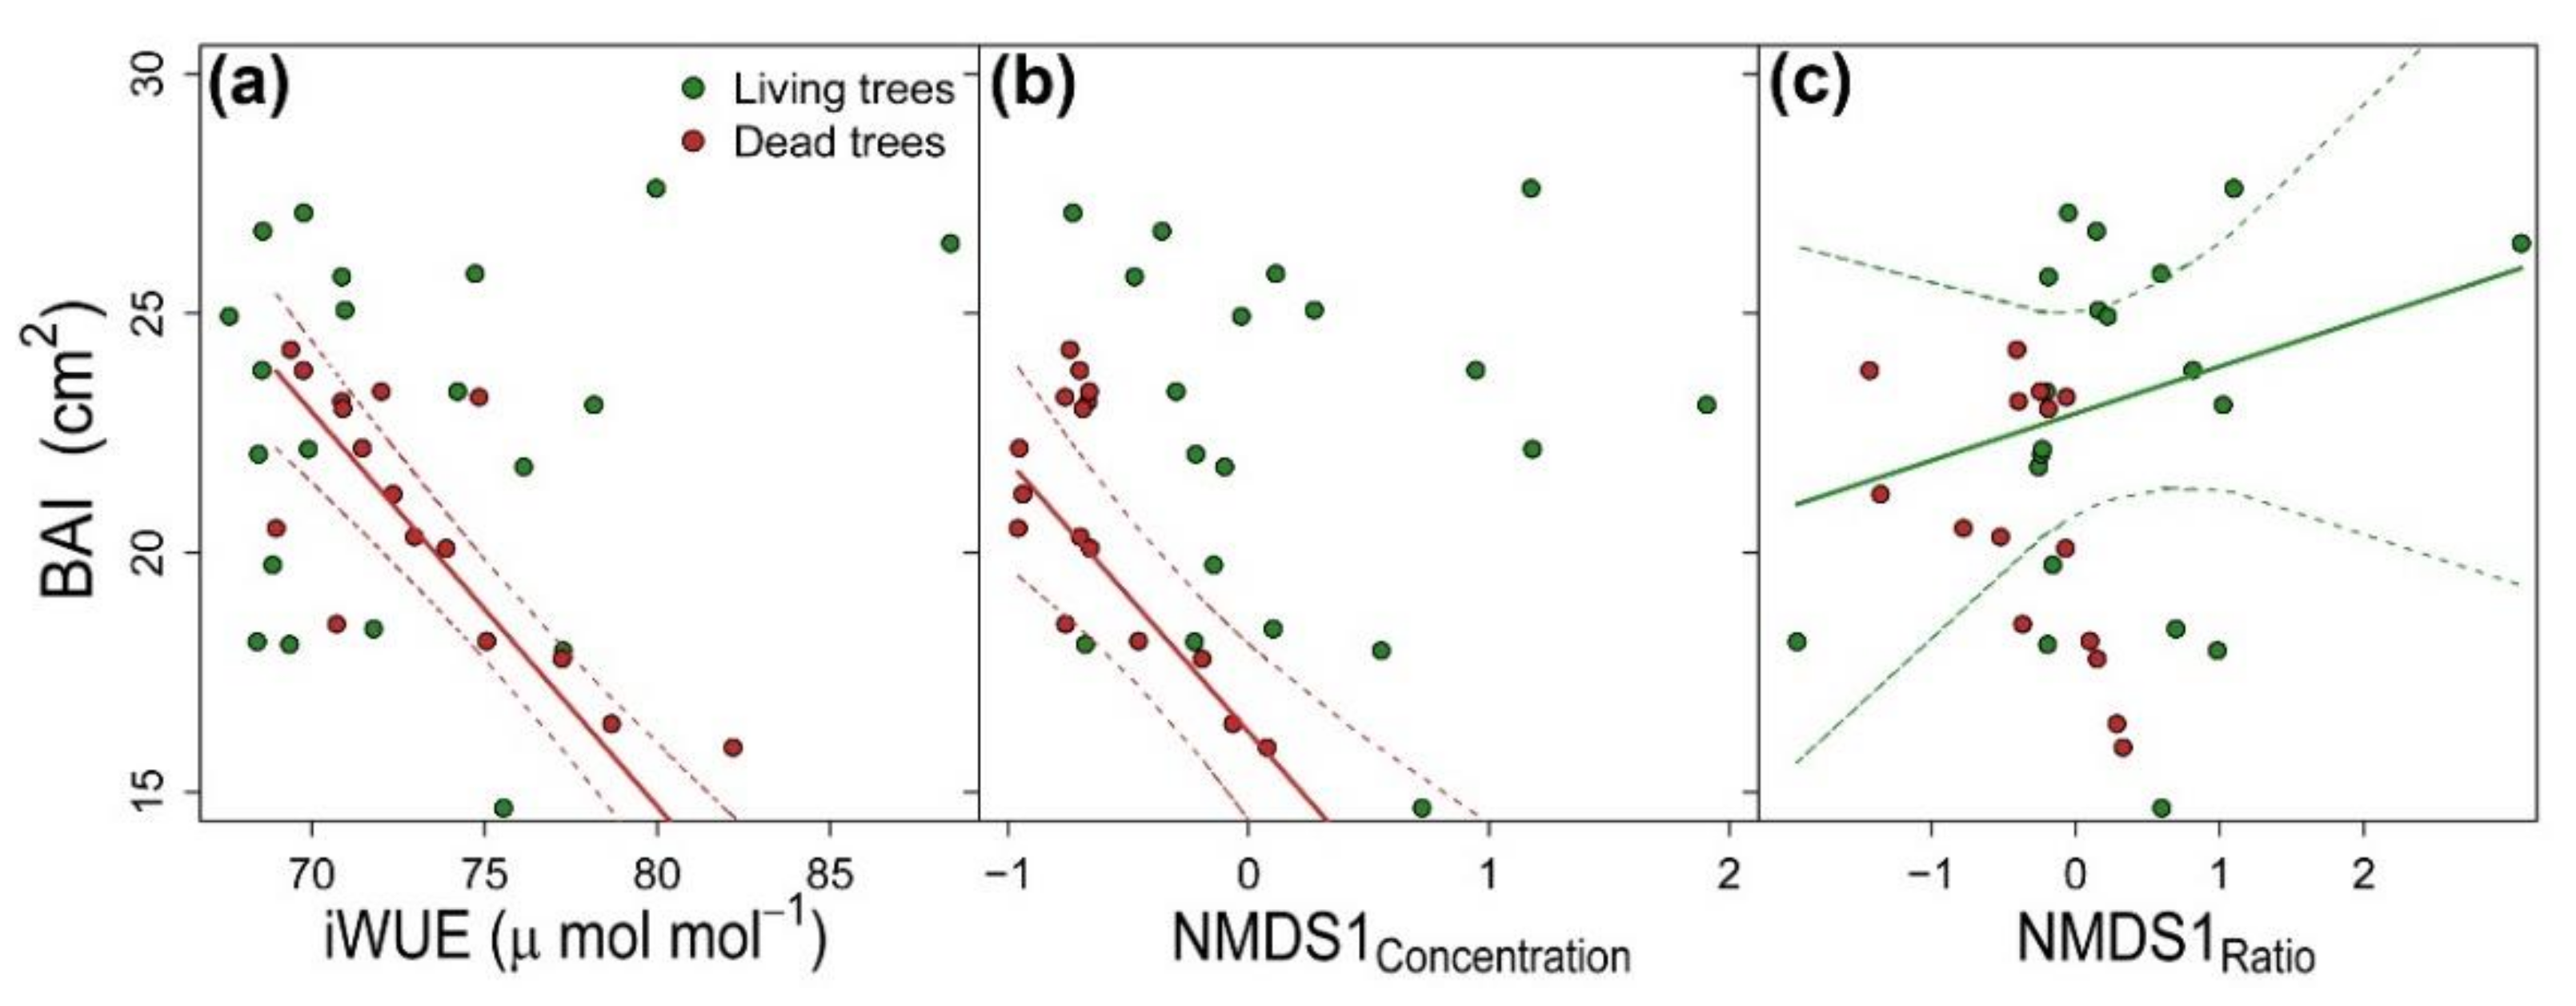
3.3. Integration of Growth, Isotopic Signals and Nutrient Status

Pairwise Spearman rank correlations between detrended isotope signatures and nutrients in tree rings revealed a lack of significant associations between iWUE and nutrient concentrations or stoichiometric ratios in L trees (Table 2). In contrast, iWUE of D trees showed a significant positive correlation with P, K, Al, Mn, and Zn concentrations and K:Ca ratio, that became negative in the case of N:P and N:K ratios. Similarly, δ18O showed a stronger response to nutrient variables in D trees than in L trees. Concentration of P, K and Mn was positively correlated with δ18O in D trees, while the correlation was negative with Ca. Both vigor classes showed significant responses to N:P ratio, although it was negative for D trees and positive (marginally significant) for L trees. Again, marginally significant correlations were found between tree-ring δ18O and N:K (negative) and K:Ca (positive) in D trees (Table 2). Therefore, our results suggest a tighter relationship between isotopic signals and nutrients in D trees since we found more frequent significant correlations in this vigor class.
We only found significant correlations between detrended isotopic signals and NMDS axes in the nutrient concentration ordination. Both iWUE (r = 0.183; p = 0.039) and δ18O (r = 0.163; p = 0.045) were positively correlated with NMDS1, so higher iWUE and δ18O values were associated to greater K, P and Al concentrations and lower Ca concentrations (Figure 6a).
The higher the DBH, the higher the radial growth of both vigor classes (Table 3). BAI of D trees responded negatively to increasing iWUE (Figure 7a), whereas δ18O did not show significant effects on BAI of any vigor class. Our results show that stoichiometric ratios showed stronger effect on growth of L trees, and that nutrient concentrations were more important for modulating growth of D trees. Higher concentrations of K, P and Al and lower concentrations of Ca (i.e., higher NMDS1 scores of nutrient concentrations ordination) resulted in reductions of growth of D trees (Figure 7b). Meanwhile, growth of L trees positively responded to increasing K:Ca ratio, whereas decreasing N:P, N:K, and Ca:Mn had a negative effect on BAI of L trees (Figure 7c).

4. Discussion

We found that D trees showed a declining growth trend after the early-1960s (Figure 1). This agrees with [42], who identified this date as the onset of dieback after analyzing these and other populations of Nothofagus dombeyi. The long-lasting growth decline prior to death has been observed as a typical response during drought-induced dieback in Nothofagus species [79], in which the cumulative effect of successive drought events reduces resilience and increases the risk of mortality [24,80]. In contrast, L trees showed a sharp increase in growth rate in the early-1960s and again in 1999. These growth releases were likely explained by reductions in competition pressure resulting from extensive mortality events of conspecific individuals triggered by severe droughts after 1962–1963 and 1998–1999 severe drought events [42].
Climate-growth relationships supported the evidence for drought sensitivity of N. dombeyi trees [45]. Growth was enhanced by wet spring and cool summer conditions, and also by wet conditions during prior autumn (Figure 4a). Contrary to other species showing distinct climate sensitivities between declining and non-declining trees due to contrasting water-use strategies (e.g., [81]), we did not find substantial differences in growth response to climatic conditions between L and D trees. In contrast, D trees showed higher iWUE (Figure 2a) and higher responsiveness to summer temperatures (Figure 4b) and steeper increases over the last decades, suggesting more severe drought stress in this tree class [82]. These results are consistent with previous studies of drought-induced dieback on broadleaf [83,84] and conifer species [85]. However, the opposite pattern has been also found [86,87], evidencing the insufficient information provided by tree-ring carbon isotopes alone to elucidate the mechanisms prompting dieback.
The relative contribution of A and gS to carbon isotope signatures of tree-rings has been commonly assessed using δ18O data [26]. However absent (L trees) or even negative (D trees) iWUE-δ18O relationships revealed the uncoupling between leaf-level processes and oxygen isotope ratios in tree-rings (Figure 3a). In addition, tree-ring δ18O of D trees was positively correlated with the δ18O of winter precipitation (Figure 3b). Caution is needed when interpreting this result, owing to the large distance and distinct climatic conditions of Puerto Montt, located in a very wet region in the Chilean Pacific. In any case, altogether this study contributes to the growing evidence supporting a predominant effect of the variability in source-water δ18O on tree-ring and leaf isotopic signals in many ecosystems [21,34,36,81,88].
The approximate water uptake depth of trees can be inferred from the δ18O signals imprinted on tree ring cellulose by the isotopic composition of their xylem water (not measured in the present study), which in turn reflects that of the soil/bedrock water sources. This interpretation is based on well-established knowledge of the steep vertical gradients in evaporative isotopic enrichment of soil water that develop in drying soils during prolonged rainless periods (with strong isotopic enrichment near the surface that exponentially decreases with depth; [89]). The lower tree-ring δ18O signature in D trees suggested their utilization of deeper water sources for water uptake (Figure 2b) since deep water pools usually show more depleted δ18O values than topsoil water due to their lower exposure to evaporative isotopic enrichment in deep layers [35]. Climate-δ18O correlations further support this hypothesis (Figure 4c). The heavier reliance of L trees on shallower soil layers is confirmed, at least in part, by the correlation of tree-ring δ18O with temperature because topsoil water is more exposed to evapotranspiration [90]. On the contrary, positive associations in D trees between tree-ring δ18O and early spring (October) rainfall amount and δ18O variations of June precipitation were consistent with extraction of water from deeper subsoil water pools, which are usually replenished in winter [91]. As the strong climate-warming trend in the study area causes enrichment in precipitation δ18O values over time [92], declining trends in tree-ring δ18O of both vigor classes may be related to increasing depth of water uptake due to reductions in topsoil-water availability over time, in line with those reported in seasonally dry Mediterranean ecosystems [37].
The exploitation of water reserves stored in deeper soil/bedrock layers by D trees may imply disadvantages in terms of nutrient availability and uptake, considering that most nutrients are more abundant in shallow soil layers [22]. This is evidenced by the frequent positive correlations in D trees between tree-ring δ18O and nutrient concentrations (Table 2). Therefore, our results fit well within the conceptual model recently put forward by Querejeta et al. [93], who postulated that heavier utilization of subsoil/bedrock water induced by topsoil desiccation leads to deterioration of vegetation mineral nutrition due to the vertical decoupling of water and nutrient availability in soil/bedrock profiles. Differences between vigor classes may arise from the location of D trees on exposed microsites and/or sites with shallow soils with low water-holding capacity, as has been proposed before for N. dombeyi [42] and Mediterranean Quercus species [86,94] undergoing dieback. Alternatively, higher drought-induced defoliation due to the total loss of leaf conductance and dehydration [44], and tighter stomatal control (higher iWUE) of D trees may reduce transpiration-driven water flux, thus impairing nutrient uptake [20]. Such divergences in foliar safety margins and stomatal response between vigor classes can lie in a genetic background and resulting physiological adjustments, in view of the dendrogenomic differences between N. dombeyi individuals inhabiting similar microenvironmental conditions but showing different degrees of crown defoliation [95].
Whatever the mechanism, lower long-term concentrations and imbalances of essential nutrients such as P, K and Zn (Table 1; Figure 5 and Figure 6) reflect poorer long-term nutritional status and the nutrient limitations of D trees. Such nutritional impairment of D trees likely exacerbated and amplified the negative effects of drought on physiological functioning and productivity and increased the risk of tree mortality [14]. Positive correlations between iWUE and P, K, and associated stoichiometric ratios in D trees (Table 2; Figure 6) indicate a strong nutrient limitation of A and/or gS, consistent with the relevant role of these nutrients on photosynthesis, transpiration and hydraulic conductance [17,18]. Tree-water transport has been found to be regulated by changes in xylem ion concentrations [96]. Taking into account the prominent role of K in the hydraulic function [97], K deficiencies probably contribute to hydraulic failure during droughts. The acquisition of nutrients would also be impaired by the mortality of fine roots and mycorrhizal fungi caused by topsoil desiccation under prolonged drought [98]. In addition, droughts have a stronger impact on the availability and uptake of nutrients with limited mobility and diffusion rates in soil (e.g., P, K and Zn), compared to the highly mobile N [20]. The reduced photosynthetic capacity of highly defoliated trees showing poorly functional leaves due to low nutrient content could foster the growth decline patterns found in D trees.
The unexpected increases of tree-ring P and K concentrations in D trees over the last decades (Figure 5) may have several explanations. The increase of K concentrations in the sapwood of L trees was much steeper than in D trees (Figure 5c). Firstly, nutrient remobilization can increase K concentrations from inner to outer rings to compensate for losses in hydraulic conductivity [97] with ongoing drought and the deterioration of nutrition. Since remobilization of nutrients has been proposed to be source-driven [99], it would reflect a greater need for nutrient remobilization from older to younger rings in the more nutrient-limited D trees. Secondly, the decreasing growth rate of D trees progressively reduced nutrient dilution effects over the last decades [100]. Thirdly, greater exudation of organic acids and carboxylates by D tree’s roots for improving mineralization and mobilization of inorganic and organic P may have also contributed to this pattern [101]. Organic acids and carboxylates exudation by roots also enhances the availability of other micronutrients such as Mn, thereby increasing its concentration in plant tissues [102] together with an accumulation of Ca [103]. This interpretation is further supported by the sharp recent increase of Ca and Mn concentrations and Ca:Mn ratio (Figure 5) and negative correlation between Ca concentration and δ18O observed in D trees (Figure 6). The elevated carbon cost of releasing organic acids and carboxylates to rhizosphere soil likely contributed to carbon depletion and loss of vitality in D trees. Nutrient imbalances regarding tree-ring Ca and Mn have been consistently related to dieback and growth decline [39,40], thus supporting the usefulness of Ca:Mn ratio as early warning of forest dieback in response to drought. However, different results between this and previous studies highlight the need for further research to fully understand the role of long-term nutrient imbalances on tree mortality.
Finally, tree growth results from the integrative effect of multiple physiological processes and environmental conditions. Although we did not find differences in DBH between vigor classes, and the BAI of both L and D trees positively responded to increasing size (Table 3). This size effect agrees with previous studies reporting the smaller size (DBH and height) of declining over non-declining trees in Quercus species experiencing drought-dieback [82,94,104]. The negative effect of iWUE on growth was observed only in D trees (Figure 7a), which supports the the greater drought-stress experienced by this vigor class. The more water-use conservative strategy of D trees could be the result of stronger reduction in soil moisture, related to lower-quality microsites that cause stomata closure to avoid hydraulic function impairment at the expense of reduced carbon uptake [105]. Meanwhile, the lack of significant effects of tree-ring δ18O on BAI can be related to the fact that it indicates variations on source-water δ18O instead of stomatal regulation, thus affecting nutrient availability and acquisition. Indeed, NMDS1 of nutrient concentrations (D trees; Figure 7b) and stoichiometric ratios (L trees; Figure 7c) showed large positive effects on tree growth. The counterintuitive negative effect of increasing K, P and Al concentrations on BAI of D trees is explained by the opposite trends that these variables experienced over the last decades, i.e., increases in P and K as a response to nutrient limitation (see explanation above) and ongoing growth decline.

5. Conclusions

This study provides insights into the underlying mechanisms that drove tree dieback and mortality of some individuals in a N. dombeyi population located at a dry edge of the species’ distribution. The growth decline of dead trees started almost 40 years before death. The higher water-use efficiency and lower oxygen isotope composition of dead trees, and the uncoupling of the latter from leaf-level processes, pointed to their increased drought stress and water uptake from deeper soil layers. Considering the vertical decoupling between water and nutrient availability in soil/bedrock layers [93], dead trees experienced a long-term deterioration of nutritional status aggravating hydraulic and growth impairment triggered by successive droughts that could have played a critical role in dieback and mortality processes. In view of the outstanding patterns in Ca and Mn concentrations and related stoichiometric ratios, they may be useful early-warning signals of drought-induced dieback and impending tree death.

Author Contributions

Conceptualization, E.G.d.A., J.I.Q. and J.J.C.; methodology, E.G.d.A., M.L.S. and J.I.Q.; software, E.G.d.A.; validation, E.G.d.A.; formal analysis, E.G.d.A.; data curation, M.L.S., J.I.Q. and J.J.C.; writing—original draft preparation, E.G.d.A.; writing—review and editing, M.L.S., J.I.Q. and J.J.C.; funding acquisition, M.L.S. and J.J.C. All authors have read and agreed to the published version of the manuscript.

Funding

This research was funded by Ministerio de Ciencia y Tecnología (Spain), grant number RTI2018-096884-B-C31, and by Agencia Nacional de Promoción Científica y Tecnológica (Argentina), projects PICT 2017-3843 and CONICET fund PIP 2017-0484.

Data Availability Statement

Data will be made available upon reasonable request to the corresponding author.

Acknowledgments

The authors are thankful to Yamila Sasal for field work assistance. We thank Michele Colangelo for his help in the laboratory.

Conflicts of Interest

The authors declare no conflict of interest.

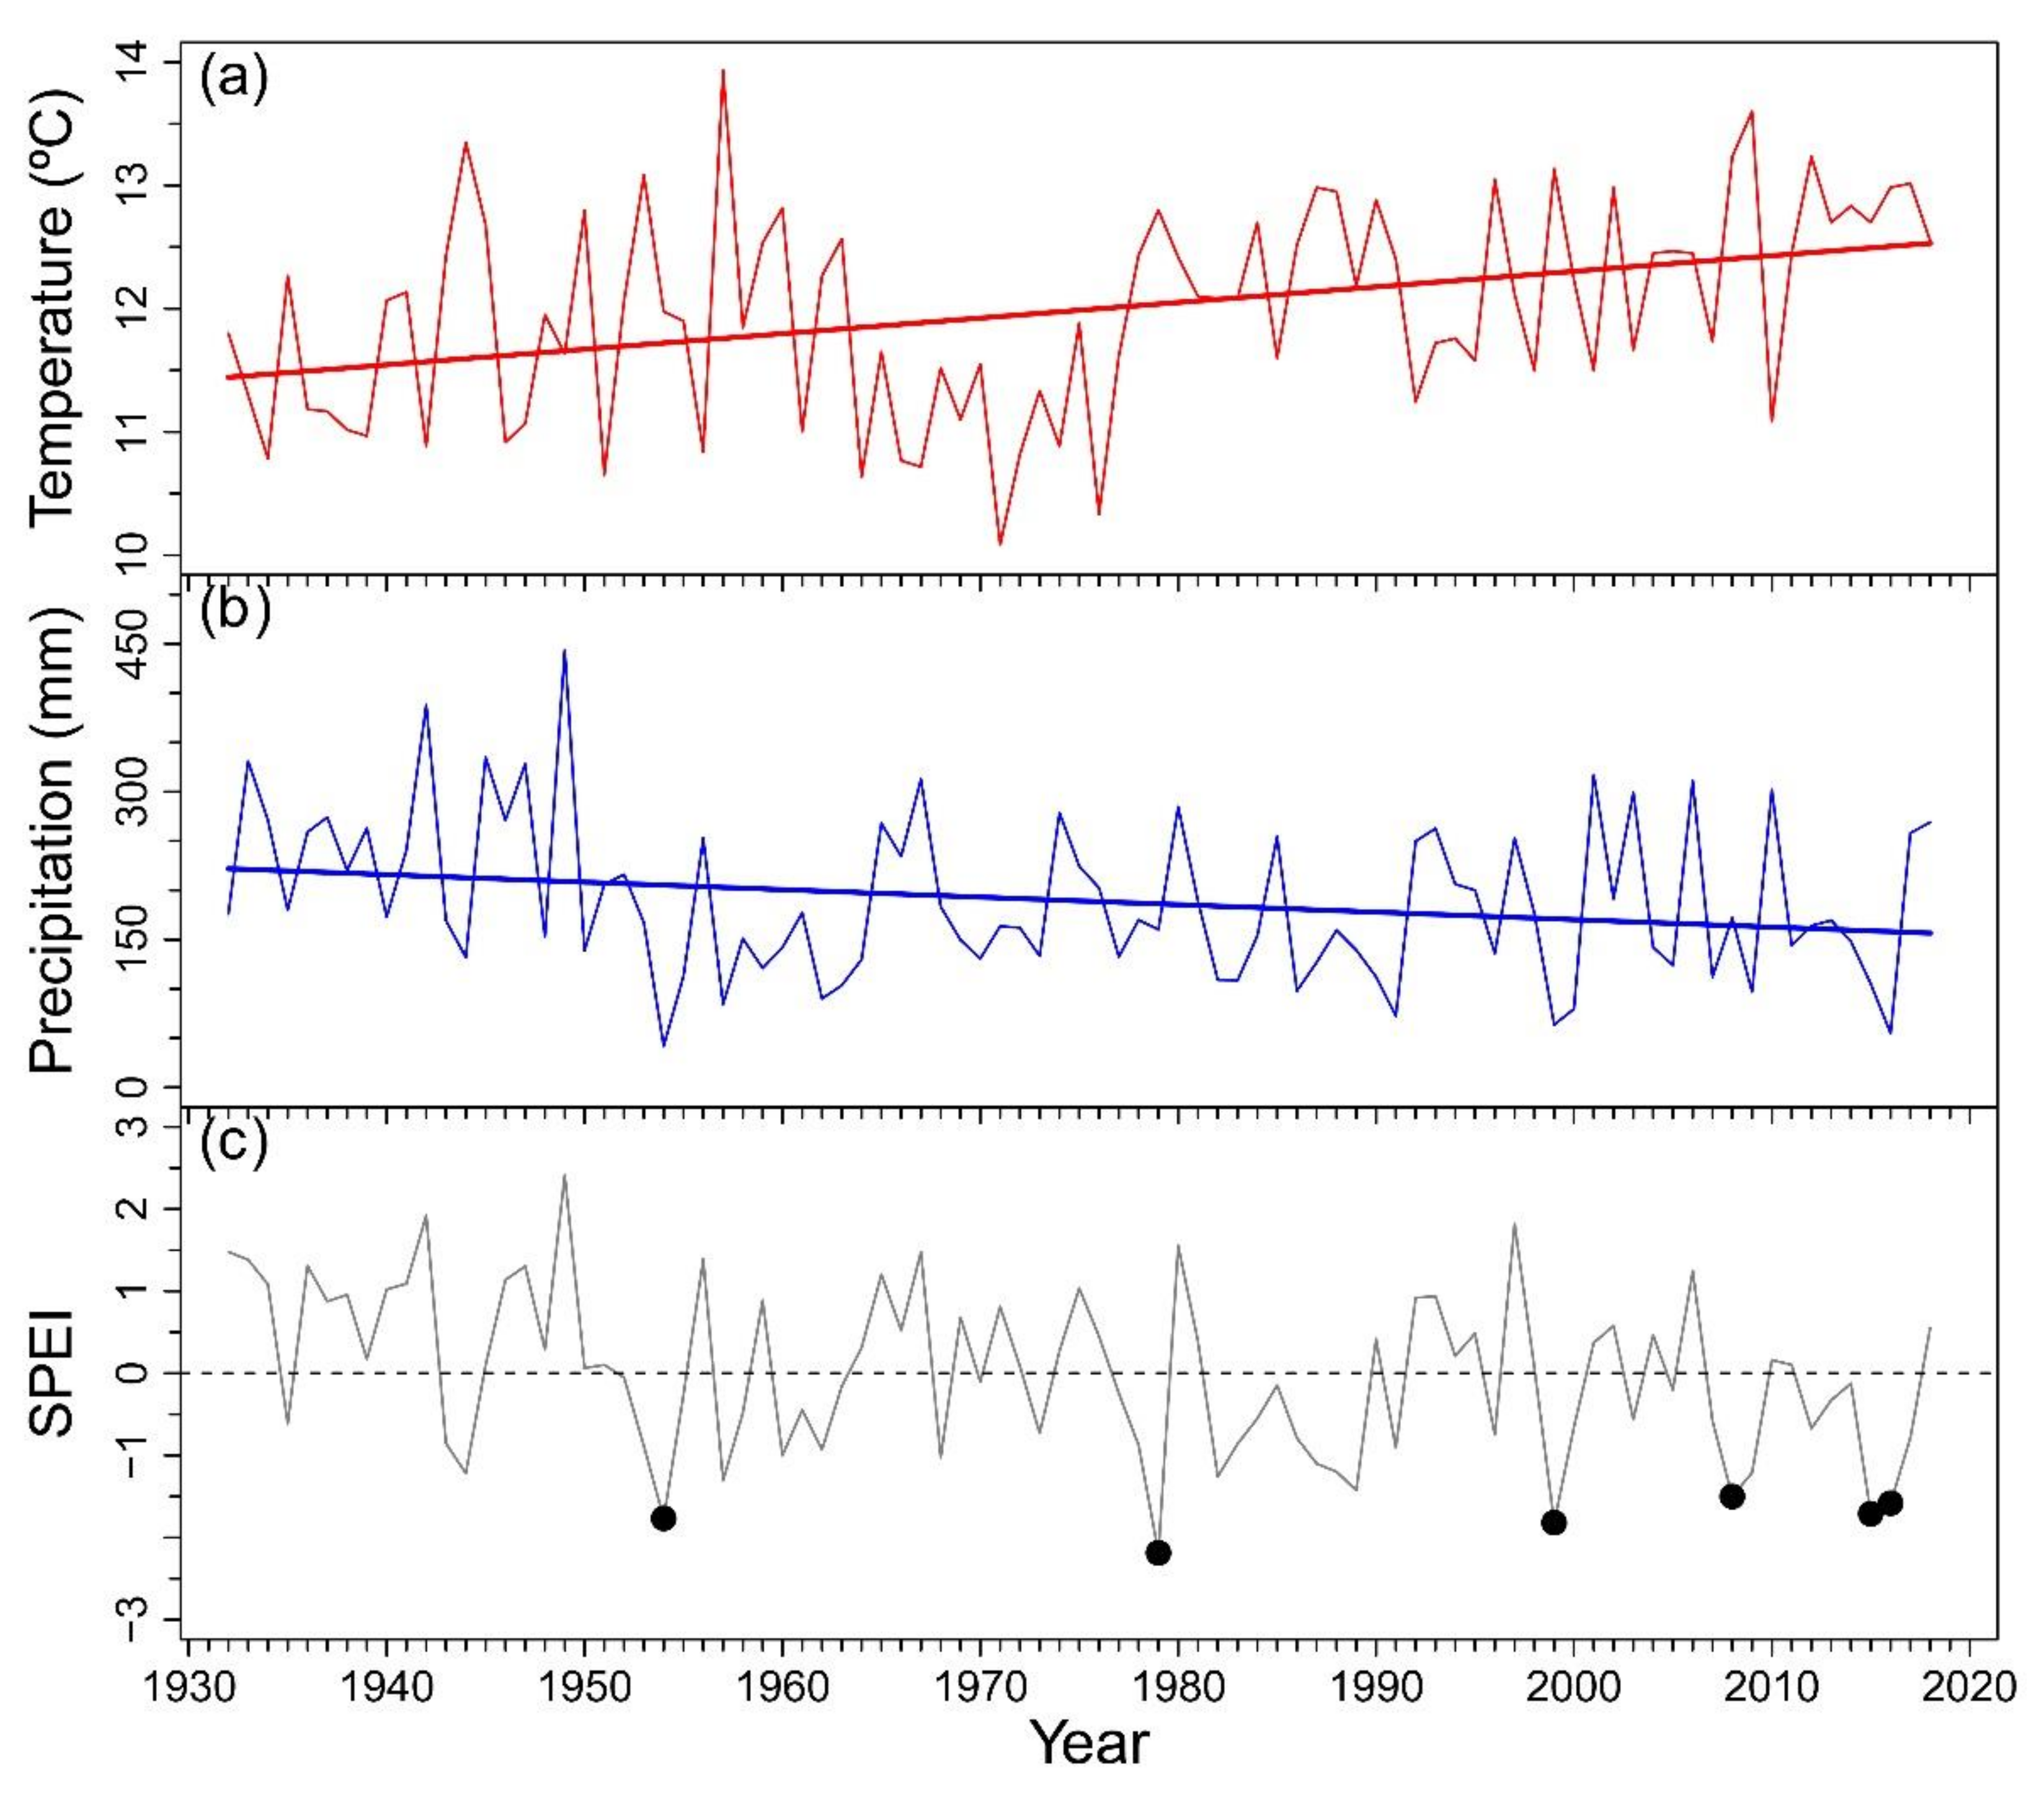
Appendix A. Climatic Trends

Figure A1. Mean temperature (a), total precipitation (b) and Standardized Precipitation Evaporation Index (SPEI) (c) of the growing season (previous October–March) calculated with data obtained from Bariloche airport weather station. In (a) and (b) straight thick lines represent significant temporal trends. In (c) black dots indicate severe drought events under the −1.5 threshold.
Forests 12 01180 g0a1

References

  1. Allen, C.D.; Macalady, A.K.; Chenchouni, H.; Bachelet, D.; McDowell, N.; Vennetier, M.; Kitzberger, T.; Rigling, A.; Breshears, D.D.; Hogg, E.H.; et al. A global overview of drought and heat-induced tree mortality reveals emerging climate change risks for forests. For. Ecol. Manag. 2010, 259, 660–684. [Google Scholar] [CrossRef] [Green Version]
  2. Kharuk, V.I.; Im, S.T.; Petrov, I.A.; Dvinskaya, M.L.; Shushpanov, A.S.; Golyukov, A.S. Climate-driven conifer mortality in Siberia. Glob. Ecol. Biogeogr. 2021, 30, 543–556. [Google Scholar] [CrossRef]
  3. van Mantgem, P.J.; Stephenson, N.L. Apparent climatically induced increase of tree mortality rates in a temperate forest. Ecol. Lett. 2007, 909–916. [Google Scholar] [CrossRef]
  4. Camarero, J.J.; Gazol, A.; Sangüesa-Barreda, G.; Cantero, A.; Sánchez-Salguero, R.; Sánchez-Miranda, A.; Granda, E.; Serra-Maluquer, X.; Ibáñez, R. Forest growth responses to drought at short- and long-term scales in Spain: Squeezing the stress memory from tree rings. Front. Ecol. Evol. 2018, 6, 1–11. [Google Scholar] [CrossRef] [Green Version]
  5. Phillips, O.L.; Aragão, L.E.O.C.; Lewis, S.L.; Fisher, J.B.; Lloyd, J.; López-gonzález, G.; Malhi, Y.; Monteagudo, A.; Peacock, J.; Quesada, C.A.; et al. Drought sensitivity of the Amazon rainforest. Science 2009, 323, 1344–1347. [Google Scholar] [CrossRef] [PubMed] [Green Version]
  6. IPCC AR5 The Physical Science Basis. Summary for Policymakers. In Climate Change 2013: The Physical Science Basis; Contribution of Working Group I to the Fifth Assessment Report of the Intergovernmental Panel on Climate Change; Cambridge University Press: Cambridge, UK, 2013. [Google Scholar]
  7. Zhou, S.; Zhang, Y.; Williams, A.P.; Gentine, P. Projected increases in intensity, frequency, and terrestrial carbon costs of compound drought and aridity events. Sci. Adv. 2019, 5, eaau5740. [Google Scholar] [CrossRef] [PubMed] [Green Version]
  8. Christidis, N.; Jones, G.S.; Stott, P.A. Dramatically increasing chance of extremely hot summers since the 2003 European heatwave. Nat. Clim. Chang. 2015, 5, 46–50. [Google Scholar] [CrossRef]
  9. Allen, C.D.; Breshears, D.D.; McDowell, N.G. On underestimation of global vulnerability to tree mortality and forest die-off from hotter drought in the Anthropocene. Ecosphere 2015, 6, art129. [Google Scholar] [CrossRef]
  10. McDowell, N.; Pockman, W.T.; Allen, C.D.; Breshears, D.D.; Cobb, N.; Kolb, T.; Plaut, J.; Sperry, J.; West, A.; Williams, D.G.; et al. Mechanisms of plant survival and mortality during drought: Why do some plants survive while others succumb to drought? New Phytol. 2008, 178, 719–739. [Google Scholar] [CrossRef] [PubMed]
  11. Anderegg, W.R.L.; Berry, J.A.; Smith, D.D.; Sperry, J.S.; Anderegg, L.D.L.; Field, C.B. The roles of hydraulic and carbon stress in a widespread climate-induced forest die-off. Proc. Natl. Acad. Sci. USA 2012, 109, 233–237. [Google Scholar] [CrossRef] [PubMed] [Green Version]
  12. Adams, H.D.; Zeppel, M.J.B.; Anderegg, W.R.L.; Hartmann, H.; Landhäusser, S.M.; Tissue, D.T.; Huxman, T.E.; Hudson, P.J.; Franz, T.E.; Allen, C.D.; et al. A multi-species synthesis of physiological mechanisms in drought-induced tree mortality. Nat. Ecol. Evol. 2017, 1, 1285–1291. [Google Scholar] [CrossRef]
  13. Anderegg, W.R.L.; Hicke, J.A.; Fisher, R.A.; Allen, C.D.; Aukema, J.; Bentz, B.; Hood, S.; Lichstein, J.W.; Macalady, A.K.; Mcdowell, N.; et al. Tree mortality from drought, insects, and their interactions in a changing climate. New Phytol. 2015, 208, 674–683. [Google Scholar] [CrossRef]
  14. Gessler, A.; Schaub, M.; McDowell, N.G. The role of nutrients in drought-induced tree mortality and recovery. New Phytol. 2017, 214, 513–520. [Google Scholar] [CrossRef] [Green Version]
  15. Kreuzwieser, J.; Gessler, A. Global climate change and tree nutrition: Influence of water availability. Tree Physiol. 2010, 30, 1221–1234. [Google Scholar] [CrossRef] [PubMed]
  16. Schlesinger, W.H.; Dietze, M.C.; Jackson, R.B.; Phillips, R.P.; Rhoades, C.C.; Rustad, L.E.; Vose, J.M. Forest biogeochemistry in response to drought. Glob. Chang. Biol. 2016, 22, 2318–2328. [Google Scholar] [CrossRef]
  17. Güsewell, S. N:P ratios in terrestrial plants: Variation and functional significance. New Phytol. 2004, 164, 243–266. [Google Scholar] [CrossRef] [PubMed]
  18. Sardans, J.; Rivas-Ubach, A.; Estiarte, M.; Ogaya, R.; Peñuelas, J. Field-simulated droughts affect elemental leaf stoichiometry in Mediterranean forests and shrublands. Acta Oecologica 2013, 50, 20–31. [Google Scholar] [CrossRef]
  19. Sardans, J.; Grau, O.; Chen, H.Y.H.; Janssens, I.A.; Ciais, P.; Piao, S.; Peñuelas, J. Changes in nutrient concentrations of leaves and roots in response to global change factors. Glob. Chang. Biol. 2017, 23, 3849–3856. [Google Scholar] [CrossRef] [PubMed]
  20. Salazar-Tortosa, D.; Castro, J.; Villar-salvador, P.; Viñegla, B.; Matías, L.; Michelsen, A.; Rubio de Casas, R.; Querejeta, J.I. The “isohydric trap”: A proposed feedback between water shortage, stomatal regulation, and nutrient acquisition drives differential growth and survival of European pines under climatic dryness. Glob. Chang. Biol. 2018, 24, 4069–4083. [Google Scholar] [CrossRef] [PubMed]
  21. Voltas, J.; Lucabaugh, D.; Chambel, M.R.; Ferrio, J.P. Intraspecific variation in the use of water sources by the circum-Mediterranean conifer Pinus halepensis. New Phytol. 2015, 208, 1031–1041. [Google Scholar] [CrossRef] [PubMed] [Green Version]
  22. Jobbágy, E.G.; Jackson, R.B. The distribution of soil nutrients with depth: Global patterns and the imprint of plants. Biogeochemistry 2001, 53, 51–77. [Google Scholar] [CrossRef]
  23. Camarero, J.J.; Gazol, A.; Sangüesa-Barreda, G.; Oliva, J.; Vicente-Serrano, S.M. To die or not to die: Early warnings of tree dieback in response to a severe drought. J. Ecol. 2015, 103, 44–57. [Google Scholar] [CrossRef] [Green Version]
  24. Cailleret, M.; Jansen, S.; Robert, E.M.R.; Desoto, L.; Aakala, T.; Antos, J.A.; Beikircher, B.; Bigler, C.; Bugmann, H.; Caccianiga, M.; et al. A synthesis of radial growth patterns preceding tree mortality. Glob. Chang. Biol. 2017, 23, 1675–1690. [Google Scholar] [CrossRef] [PubMed]
  25. McCarroll, D.; Loader, N.J. Stable isotopes in tree rings. Quat. Sci. Rev. 2004, 23, 771–801. [Google Scholar] [CrossRef]
  26. Scheidegger, Y.; Saurer, M.; Bahn, M.; Siegwolf, R. Linking stable oxygen and carbon isotopes with stomatal conductance and photosynthetic capacity: A conceptual model. Oecologia 2000, 125, 350–357. [Google Scholar] [CrossRef] [PubMed]
  27. Farquhar, G.D.; O’Leary, M.H.; Berry, J.A. On the relationship between carbon isotope discrimination and the intercellular carbon dioxide concentration in leaves. Aust. J. Plant Physiol. 1982, 9, 121–137. [Google Scholar] [CrossRef]
  28. Saurer, M.; Siegwolf, R.T.W.; Schweingruber, F.H. Carbon isotope discrimination indicates improving water-use efficiency of trees in northern Eurasia over the last 100 years. Glob. Chang. Biol. 2004, 10, 2109–2120. [Google Scholar] [CrossRef]
  29. Peñuelas, J.; Canadell, J.G.; Ogaya, R. Increased water-use efficiency during the 20th century did not translate into enhanced tree growth. Glob. Ecol. Biogeogr. 2011, 20, 597–608. [Google Scholar] [CrossRef]
  30. Camarero, J.J.; Gazol, A.; Tardif, J.C.; Conciatori, F. Attributing forest responses to global-change drivers: Limited evidence of a CO2-fertilization effect in Iberian pine growth. J. Biogeogr. 2015, 42, 2220–2233. [Google Scholar] [CrossRef] [Green Version]
  31. Gessler, A.; Löw, M.; Heerdt, C.; De Beeck, M.O.; Schumacher, J.; Grams, T.E.E.; Bahnweg, G.; Ceulemans, R.; Werner, H.; Matyssek, R.; et al. Within-canopy and ozone fumigation effects on δ13C and Δ18O in adult beech (Fagus sylvatica) trees: Relation to meteorological and gas exchange parameters. Tree Physiol. 2009, 29, 1349–1365. [Google Scholar] [CrossRef] [Green Version]
  32. Roden, J.; Siegwolf, R. Is the dual-isotope conceptual model fully operational? Tree Physiol. 2013, 32, 1179–1182. [Google Scholar] [CrossRef]
  33. Gessler, A.; Ferrio, J.P.; Hommel, R.; Treydte, K.; Werner, R.A.; Monson, R.K. Stable isotopes in tree rings: Towards a mechanistic understanding of isotope fractionation and mixing processes from the leaves to the wood. Tree Physiol. 2014, 34, 796–818. [Google Scholar] [CrossRef] [PubMed] [Green Version]
  34. Treydte, K.; Boda, S.; Pannatier, E.G.; Fonti, P.; Frank, D.; Ullrich, B.; Saurer, M.; Siegwolf, R.; Battipaglia, G.; Werner, W.; et al. Seasonal transfer of oxygen isotopes from precipitation and soil to the tree ring: Source water versus needle water enrichment. New Phytol. 2014, 202, 772–783. [Google Scholar] [CrossRef] [PubMed]
  35. Sarris, D.; Siegwolf, R.; Körner, C. Inter- and intra-annual stable carbon and oxygen isotope signals in response to drought in Mediterranean pines. Agric. For. Meteorol. 2013, 168, 59–68. [Google Scholar] [CrossRef]
  36. Shestakova, T.A.; Aguilera, M.; Ferrio, J.P.; Gutiérrez, E.; Voltas, J. Unravelling spatiotemporal tree-ring signals in Mediterranean oaks: A variance–covariance modelling approach of carbon and oxygen isotope ratios. Tree Physiol. 2014, 34, 819–838. [Google Scholar] [CrossRef]
  37. Barbeta, A.; Peñuelas, J. Increasing carbon discrimination rates and depth of water uptake favor the growth of Mediterranean evergreen trees in the ecotone with temperate deciduous forests. Glob. Chang. Biol. 2017, 23, 5054–5068. [Google Scholar] [CrossRef]
  38. Grossiord, C.; Sevanto, S.; Dawson, T.E.; Adams, H.D.; Collins, A.D.; Dickman, L.T.; Newman, B.D.; Stockton, E.A.; McDowell, N.G. Warming combined with more extreme precipitation regimes modifies the water sources used by trees. New Phytol. 2017, 213, 584–596. [Google Scholar] [CrossRef]
  39. Hevia, A.; Sánchez-Salguero, R.; Camarero, J.J.; Querejeta, J.I.; Sangüesa-Barreda, G.; Gazol, A. Long-term nutrient imbalances linked to drought-triggered forest dieback. Sci. Total Environ. 2019, 690, 1254–1267. [Google Scholar] [CrossRef]
  40. Houle, D.; Tremblay, S.; Ouimet, R. Foliar and wood chemistry of sugar maple along a gradient of soil acidity and stand health. Plant Soil 2007, 300, 173–183. [Google Scholar] [CrossRef]
  41. Veblen, T.T.; Hill, R.S.; Read, J. The Ecology and Biogeography of Nothofagus Forests; Yale University Press: London, UK, 1996. [Google Scholar]
  42. Suarez, M.L.; Ghermandi, L.; Kitzberger, T. Factors predisposing episodic drought-induced tree mortality in Nothofagus—Site, climatic sensitivity and growth trends. J. Ecol. 2004, 92, 954–966. [Google Scholar] [CrossRef]
  43. Suarez, M.L.; Kitzberger, T. Differential effects of climate variability on forest dynamics along a precipitation gradient in northern Patagonia. J. Ecol. 2010, 98, 1023–1034. [Google Scholar] [CrossRef]
  44. Scholz, F.G.; Bucci, S.J.; Goldstein, G. Strong hydraulic segmentation and leaf senescence due to dehydration may trigger die-back in Nothofagus dombeyi under severe droughts: A comparison with the co-occurring Austrocedrus chilensis. Trees Struct. Funct. 2014, 28, 1475–1487. [Google Scholar] [CrossRef]
  45. Suarez, M.L.; Villalba, R.; Mundo, I.A.; Schroeder, N. Sensitivity of Nothofagus dombeyi tree growth to climate changes along a precipitation gradient in northern Patagonia, Argentina. Trees Struct. Funct. 2015, 29, 1053–1067. [Google Scholar] [CrossRef]
  46. De Fina, A.L. El clima de la región de los bosques Andino-Patagónicos. In La Región de Los Bosques Andino-Patagónicos, Sinopsis General; Dimitri, M.J., Ed.; Instituto Nacional de Tecnología Agropecuaria: Buenos Aires, Argentina, 1972; pp. 35–58. [Google Scholar]
  47. Vicente-Serrano, S.M.; Beguería, S.; López-Moreno, J.I. A multiscalar drought index sensitive to global warming: The standardized precipitation evapotranspiration index. J. Clim. 2010, 23, 1696–1718. [Google Scholar] [CrossRef] [Green Version]
  48. Beguería, S.; Vicente-Serrano, S.M. SPEI: Calculation of the Standardised Precipitation-Evapotranspiration Index. R Package Version 1.7. 2017. Available online: https://CRAN.R-project.org/package=SPEI (accessed on 3 May 2021).
  49. R Foundation for Statistical Computing. R Core Team R: A Language and Environment for Statistical Computing; R Foundation for Statistical Computing: Vienna, Austria, 2020. [Google Scholar]
  50. IAEA/WMO Global Network of Isotopes in Precipitation. The GNIP Database. 2021. Available online: https://nucleus.iaea.org/ (accessed on 13 May 2021).
  51. Villalba, R.; Veblen, T.T. Influences of large-scale climatic variability on episodic tree mortality in northern Patagonia. Ecology 1998, 79, 2624–2640. [Google Scholar] [CrossRef]
  52. Fritts, H.C. Tree Rings and Climate; Academic Press: London, UK, 1977. [Google Scholar]
  53. Holmes, R.L. Computer-assisted quality control in tree-ring dating and measurement. Tree Ring Bull. 1983, 43, 69–78. [Google Scholar]
  54. Suarez, M.L. Tree-ring records from Nothofagus dombeyi: A preliminary chronology network in Northern Patagonia, Argentina. Dendrochronologia 2010, 28, 65–72. [Google Scholar] [CrossRef]
  55. Biondi, F.; Qeadan, F. A theory-driven approach to tree-ring standardization: Defining the biological trend from expected basal area increment. Tree Ring Res. 2008, 64, 81–96. [Google Scholar] [CrossRef] [Green Version]
  56. Sharp, Z. Principles of Stable Isotope Geochemistry; Prentice Hall: Hoboken, NJ, USA, 2005. [Google Scholar]
  57. Belmecheri, S.; Lavergne, A. Compiled records of atmospheric CO2 concentrations and stable carbon isotopes to reconstruct climate and derive plant ecophysiological indices from tree rings. Dendrochronologia 2020, 63, 125748. [Google Scholar] [CrossRef]
  58. Kuang, Y.W.; Wen, D.Z.; Zhou, G.Y.; Chu, G.W.; Sun, F.F.; Li, J. Reconstruction of soil pH by dendrochemistry of Masson pine at two forested sites in the Pearl River Delta, South China. Ann. For. Sci. 2008, 65, 804. [Google Scholar] [CrossRef] [Green Version]
  59. Huang, N.E.; Wu, Z. A review on Hilbert-Huang transform: Method and its applications. Rev. Geophys. 2008, 46, 1–23. [Google Scholar] [CrossRef] [Green Version]
  60. Guan, B.T.; Wright, W.E.; Cook, E.R. Ensemble empirical mode decomposition as an alternative for tree-ring chronology development. Tree Ring Res. 2018, 74, 28–38. [Google Scholar] [CrossRef]
  61. Lo, Y.; Blanco, J.A.; Guan, B.T. Douglas-fir radial growth in interior British Columbia can be linked to long-term oscillations in Pacific and Atlantic sea surface temperatures. Can. J. For. Res. 2017, 381, 371–381. [Google Scholar] [CrossRef]
  62. Guan, B.T. Ensemble empirical mode decomposition for analyzing phenological responses to warming. Agric. For. Meteorol. 2014, 194, 1–7. [Google Scholar] [CrossRef]
  63. González de Andrés, E.; Blanco, J.A.; Imbert, J.B.; Guan, B.T.; Lo, Y.H.; Castillo, F.J. ENSO and NAO affect long-term leaf litter dynamics and stoichiometry of Scots pine and European beech mixedwoods. Glob. Chang. Biol. 2019, 25, 3070–3090. [Google Scholar] [CrossRef] [PubMed]
  64. Huang, N.E.; Shen, Z.; Long, S.R.; Wu, M.C.; Shih, H.H.; Zheng, Q.; Yen, N.-C.; Tung, C.C.; Liu, H.H. The empirical mode decomposition and the Hilbert spectrum for nonlinear and non-stationary time series analysis. Proc. R. Soc. Lond. 1998, 454, 903–995. [Google Scholar] [CrossRef]
  65. Wu, Z.; Huang, N.E. Ensemble empirical mode decomposition: A noise-assisted data analysis method. Adv. Adapt. Data Anal. 2009, 1, 1–41. [Google Scholar] [CrossRef]
  66. Legendre, P.; Legendre, L. Numerical Ecology; Elsevier: Amsterdam, The Netherlands, 2012. [Google Scholar]
  67. Anderson, M.J. A new method for non-parametric multivariate analysis of variance. Austral Ecol. 2001, 26, 32–46. [Google Scholar]
  68. Pinheiro, J.C.; Bates, D.M. Mixed-Effects Models in S and S-PLUS; Springer: New York, NY, USA, 2000. [Google Scholar]
  69. Zuur, A.F.; Ieno, E.N.; Walker, N.J.; Saveliev, A.A.; Smith, G.M. Mixed Effects Models and Extensions in Ecology with R; Springer: New York, NY, USA, 2009. [Google Scholar]
  70. Nakagawa, S.; Johnson, P.C.D.; Schielzeth, H. The coefficient of determination R2 and intra-class correlation coefficient from generalized linear mixed-effects models revisited and expanded. J. R. Soc. Interface 2017, 14, 20170213. [Google Scholar] [CrossRef] [PubMed] [Green Version]
  71. Bunn, A.; Korpela, M.; Biondi, F.; Campelo, F.; Mérian, P.; Qeadan, F.; Zang, C. dplR: Dendrochronology Program Library in R. R Package Version 1.7.1. 2020. Available online: https://CRAN.R-project.org/package=dplR (accessed on 15 April 2021).
  72. McLeod, A.I. Kendall: Kendall Rank Correlation and Mann-Kendall Trend Test. R Package Version 2.2. 2011. Available online: https://CRAN.R-project.org/package=Kendall (accessed on 3 May 2021).
  73. Zeileis, A.; Kleiber, C.; Walter, K.; Hornik, K. Testing and dating of structural changes in practice. Comput. Stat. Data Anal. 2003, 44, 109–123. [Google Scholar] [CrossRef] [Green Version]
  74. Helske, J.; Luukko, P. _Rlibeemd: Ensemble Empirical Mode Decomposition (EEMD) and Its Complete Variant (CEEMDAN)_. R Package Version 1.4.1. 2018. Available online: https://CRAN.R-project.org/package=Rlibeemd (accessed on 10 May 2021).
  75. Zang, C.; Biondi, F. Treeclim: An R package for the numerical calibration of proxy-climate relationships. Ecography 2015, 38, 431–436. [Google Scholar] [CrossRef]
  76. Oksanen, J.; Blanchet, F.G.; Friendly, M.; Kindt, R.; Al, E. Vegan: Community Ecology Package. R Package Version 2.5-6. 2019. Available online: https://CRAN.R-project.org/package=vegan (accessed on 15 April 2021).
  77. Pinheiro, J.; Bates, D.; DebRoy, S.; Sarkar, D.; R Core Team. _nlme: Linear and Nonlinear Mixed Effects Models_. R Package Version 3.1-145. 2020. Available online: https://CRAN.R-project.org/package=nlme (accessed on 15 April 2021).
  78. Barton, K. MuMIn: Multi-Model Inference. R Package Version 1.43.15. 2019. Available online: https://CRAN.R-project.org/package=MuMIn (accessed on 15 April 2021).
  79. Rodríguez-Catón, M.; Villalba, R.; Srur, A.; Williams, A.P. Radial growth patterns associated with tree mortality in Nothofagus pumilio forest. Forests 2019, 10, 489. [Google Scholar] [CrossRef] [Green Version]
  80. DeSoto, L.; Cailleret, M.; Sterck, F.; Jansen, S.; Kramer, K.; Robert, E.M.R.; Aakala, T.; Amoroso, M.M.; Bigler, C.; Camarero, J.J.; et al. Low growth resilience to drought is related to future mortality risk in trees. Nat. Commun. 2020, 11, 1–9. [Google Scholar] [CrossRef]
  81. Querejeta, J.I.; Estrada-Medina, H.; Allen, M.F.; Jiménez-Osornio, J.J. Water source partitioning among trees growing on shallow karst soils in a seasonally dry tropical climate. Oecologia 2007, 152, 26–36. [Google Scholar] [CrossRef]
  82. Martin-Benito, D.; Anchukaitis, K.J.; Evans, M.N.; del Río, M.; Beeckman, H.; Cañellas, I. Effects of drought on xylem anatomy and water-use efficiency of two co-occurring pine species. Forests 2017, 8, 332. [Google Scholar] [CrossRef] [Green Version]
  83. Camarero, J.J.; Colangelo, M.; Gazol, A.; Azorín-molina, C. Drought and cold spells trigger dieback of temperate oak and beech forests in northern Spain. Dendrochronologia 2021, 66, 125812. [Google Scholar] [CrossRef]
  84. Sun, S.; Qiu, L.; He, C.; Li, C.; Zhang, J.; Meng, P. Drought-affected Populus simonii Carr. show lower growth and long-term increases in intrinsic water-use efficiency prior to tree mortality. Forests 2018, 9, 564. [Google Scholar] [CrossRef] [Green Version]
  85. Pellizzari, E.; Camarero, J.J.; Gazol, A.; Sangüesa-Barreda, G.; Carrer, M. Wood anatomy and carbon-isotope discrimination support long-term hydraulic deterioration as a major cause of drought-induced dieback. Glob. Chang. Biol. 2016, 22, 2125–2137. [Google Scholar] [CrossRef]
  86. Colangelo, M.; Camarero, J.J.; Battipaglia, G.; Borghetti, M.; De Micco, V.; Gentilesca, T.; Ripullone, F. A multi-proxy assessment of dieback causes in a Mediterranean oak species. Tree Physiol. 2017, 37, 617–631. [Google Scholar] [CrossRef] [PubMed] [Green Version]
  87. González de Andrés, E.; Camarero, J.J. Disentangling mechanisms of drought-induced dieback in Pinus nigra Arn. from growth and wood isotope patterns. Forests 2020, 11, 1339. [Google Scholar] [CrossRef]
  88. Ding, Y.; Nie, Y.; Chen, H.; Wang, K.; Querejeta, J.I. Water uptake depth is coordinated with leaf water potential, water-use efficiency and drought vulnerability in karst vegetation. New Phytol. 2021, 229, 1339–1353. [Google Scholar] [CrossRef] [PubMed]
  89. Allison, G.B.; Barnes, C.J.; Hughes, M.W. The distribution of deuterium and 18O in dry soils 2. Experimental. J. Hydrol. 1983, 64, 377–397. [Google Scholar] [CrossRef]
  90. Sprenger, M.; Leistert, H.; Gimbel, K.; Weiler, M. Illuminating hydrological processes at the soil-vegetation- atmosphere interface with water stable isotopes. Rev. Geophys. 2016, 54, 674–704. [Google Scholar] [CrossRef] [Green Version]
  91. Renée Brooks, J.; Barnard, H.R.; Coulombe, R.; McDonnell, J.J. Ecohydrologic separation of water between trees and streams in a Mediterranean climate. Nat. Geosci. 2010, 3, 100–104. [Google Scholar] [CrossRef]
  92. Offermann, C.; Ferrio, J.P.; Holst, J.; Grote, R.; Siegwolf, R.; Kayler, Z.; Gessler, A. The long way down—Are carbon and oxygen isotope signals in the tree ring uncoupled from canopy physiological processes? Tree Physiol. 2011, 31, 1088–1102. [Google Scholar] [CrossRef] [Green Version]
  93. Querejeta, J.I.; Ren, W.; Prieto, I. Vertical decoupling of soil nutrients and water under climate warming reduces plant cumulative nutrient uptake, water-use efficiency and productivity. New Phytol. 2021, 230, 1378–1393. [Google Scholar] [CrossRef]
  94. Camarero, J.J.; Sangüesa-Barreda, G.; Vergarechea, M. Prior height, growth, and wood anatomy differently predispose to drought-induced dieback in two Mediterranean oak speciesk. Ann. For. Sci. 2016, 73, 341–351. [Google Scholar] [CrossRef] [Green Version]
  95. Fasanella, M.; Suarez, M.L.; Hasbún, R.; Premoli, A.C. Individual-based dendrogenomic analysis of forest dieback driven by extreme droughts. Can. J. For. Res. 2021, 51, 420–432. [Google Scholar] [CrossRef]
  96. Nardini, A.; Salleo, S.; Jansen, S. More than just a vulnerable pipeline: Xylem physiology in the light of ion-mediated regulation of plant water transport. J. Exp. Bot. 2011, 62, 4701–4718. [Google Scholar] [CrossRef]
  97. Trifilò, P.; Nardini, A.; Raimondo, F.; Lo Gullo, M.A.; Salleo, S. Ion-mediated compensation for drought-induced loss of xylem hydraulic conductivity in field-growing plants of Laurus nobilis. Funct. Plant Biol. 2011, 38, 606–613. [Google Scholar] [CrossRef]
  98. León-Sánchez, L.; Nicolás, E.; Goberna, M.; Prieto, I.; Maestre, F.T.; Querejeta, J.I. Poor plant performance under simulated climate change is linked to mycorrhizal responses in a semi-arid shrubland. J. Ecol. 2018, 106, 960–976. [Google Scholar] [CrossRef]
  99. Sette, C.R.; Laclau, J.P.; Tomazello Filho, M.; Moreira, R.M.; Bouillet, J.P.; Ranger, J.; Almeida, J.C.R. Source-driven remobilizations of nutrients within stem wood in Eucalyptus grandis plantations. Trees Struct. Funct. 2013, 27, 827–839. [Google Scholar] [CrossRef]
  100. Skirycz, A.; Inzé, D. More from less: Plant growth under limited water. Curr. Opin. Biotechnol. 2010, 21, 197–203. [Google Scholar] [CrossRef]
  101. Lambers, H.; Clements, J.C.; Nelson, M.N. How aphosphorus-acquisition strategy based on carboxylate exudation powers the success and agronomic potential of lupines (Lupinus, Fabaceae). Am. J. Bot. 2013, 100, 263–288. [Google Scholar] [CrossRef] [PubMed]
  102. Lambers, H.; Hayes, P.E.; Laliberté, E.; Oliveira, R.S.; Turner, B.L. Leaf manganese accumulation and phosphorus-acquisition efficiency. Trends Plant Sci. 2015, 20, 83–90. [Google Scholar] [CrossRef] [PubMed] [Green Version]
  103. Mizuno, T.; Emori, K.; Ito, S.I. Manganese hyperaccumulation from non-contaminated soil in Chengiopanax sciadophylloides Franch. et Sav. and its correlation with calcium accumulation. Soil Sci. Plant Nutr. 2013, 59, 591–602. [Google Scholar] [CrossRef]
  104. Colangelo, M.; Camarero, J.J.; Borghetti, M.; Gazol, A.; Gentilesca, T.; Ripullone, F. Size matters a lot: Drought-affected Italian oaks are smaller and show lower growth prior to tree death. Front. Plant Sci. 2017, 8, 1–14. [Google Scholar] [CrossRef] [PubMed] [Green Version]
  105. McDowell, N.G. Mechanisms linking drought, hydraulics, carbon metabolism, and vegetation mortality. Plant Physiol. 2011, 155, 1051–1059. [Google Scholar] [CrossRef] [PubMed] [Green Version]
Figure 1. Basal area increment (BAI) of living (L; green) and dead (D; red) Nothofagus dombeyi trees. Solid lines represent the mean BAI for each tree-vigor class and shaded areas around them the standard error of the mean. Dash lines show significant (p < 0.05) trends in mean BAI before and after detected break point dates. The grey filled areas indicate the periods when BAI of L and D trees significantly (p < 0.05) differed according to Wilcoxon rank-sum tests.
Forests 12 01180 g001
Figure 2. (a) Intrinsic water-use efficiency (iWUE) and (b) oxygen isotopic ratios (δ18O) in tree rings of living trees (L; green symbols and lines) and dead trees (D; red symbols and lines) of Nothofagus dombeyi along the 1910–2018 period. Symbols represent values of five consecutive rings pooled at vigor class level and lines indicate significant trends based on the Kendall τ statistic. Kendall τ statistic and associated p-value (* p < 0.05; ** p < 0.01; *** p < 0.001) is indicated in each graph for both vigor classes.
Forests 12 01180 g002
Figure 3. Relationships between tree ring oxygen isotopic ratio (δ18O) and (a) intrinsic water-use efficiency (iWUE), and (b) rainfall δ18O in June for the period 1964–2017 in living trees (L; green symbols) and dead trees (D; red lines and symbols) of Nothofagus dombeyi. Values correspond to groups of five consecutive rings pooled at vigor-class level. Spearman ρ statistic and associated p-value (* p < 0.05) are indicated in each graph for correlations at vigor class level. Significant correlations are highlighted with lines.
Forests 12 01180 g003
Figure 4. Bootstrapped correlations between monthly mean temperature (left) and precipitation (right) and basal area increment (BAI) (a), intrinsic water-use efficiency (iWUE) (b) and oxygen isotope composition (δ18O) (c) of tree rings of living (green symbols) and dead (red symbols) Nothofagus dombeyi trees. BAI, iWUE and δ18O were detrended using ensemble empirical mode decomposition (EEMD) technique prior analysis. Error bars are 95%-confidence intervals and significant and non-significant effects are represented by solid and dash bars, respectively. Grey shaded areas indicate growing season of the year of ring formation.
Forests 12 01180 g004
Figure 5. Temporal evolution of nutrient concentration in tree-rings of living (green symbols and lines) and dead (red symbols and lines) Nothofagus dombeyi trees including: (a) nitrogen (N), (b) phosphorus (P), (c) potassium (K), (d) calcium (Ca), (e) aluminum (Al), (f) magnesium (Mg), (g) manganese (Mn), and (h) zinc (Zn). Symbols represent values of five consecutive rings pooled at vigor class level and lines indicate significant trends based on the Kendall τ statistic (see Table 1).
Forests 12 01180 g005
Figure 6. Non-metric multidimensional scaling (NMDS) biplots of nutrient concentrations (a) and stoichiometric molar ratios (b) of living (L; green symbols and areas) and dead (D; red symbols and areas) trees. Points represent the values of each group of five consecutive rings for the period 1915–2018. Shaded areas represent the centroid of the values for each tree-vigor class. Black arrows indicate loadings of nutrient concentrations (a) and molar ratios (b) in NMDS axes; those very close to the point (0,0) are not shown for the sake of clarity. The correlation between intrinsic water-use efficiency (iWUE) and oxygen isotope composition (δ18O) and NMDS axes was projected in the ordination diagram and represented with blue arrows. iWUE and δ18O were detrended using ensemble empirical mode decomposition (EEMD) technique prior analysis.
Forests 12 01180 g006
Figure 7. Relationships between basal area increment (BAI) and (a) intrinsic water-use efficiency (iWUE), (b) NMDS1 of nutrient concentration ordination and (c) NMDS1 of stoichiometric ratios ordination in living (green symbols and lines) and dead (red symbols and lines) Nothofagus dombeyi trees. Solid lines represent predicted relationships by linear mixed-effects models (see Table 3) and dash lines are 95% confidence intervals.
Forests 12 01180 g007
Table 1. Mean (± standard errors) of nutrient concentrations and molar stoichiometric ratios. Different letters indicate significant differences (p < 0.05) between living (L) and dead trees (D) according to Mann–Whitney U tests. Trends are based on the Kendall τ statistic and significance in shown with asterisks (* p < 0.05; ** p < 0.01; *** p < 0.001).
Living TreesDead Trees
Mean ± SETrendMean ± SETrend
Nutrient
concentrations
N (mg g−1)1.6 ± 0.01 a0.438 **1.6 ± 0.01 a0.076
P (µg g−1) 474.4 ± 22.19 a0.124376.9 ± 31.9 b0.638 ***
K (µg g−1)243.8 ± 75.73 a0.638 ***114.8 ± 30.09 a0.829 ***
Ca (µg g−1)546.1 ± 26.04 a−0.076627.6 ± 94.05 a0.600 ***
Al (µg g−1)15.4 ± 2.51 a0.2007.2 ± 0.94 b0.543 ***
Mg (µg g−1)331.5 ± 16.59 a0.029346.1 ± 23.56 a0.667 ***
Mn (µg g−1)9.9 ± 0.73 a0.0678.7 ± 0.75 a0.600 ***
Zn (µg g−1)18.3 ± 2.42 a−0.2006.5 ± 0.33 b0.133
Stoichiometric
ratios
N:P7.7 ± 0.43 a0.14311.0 ± 1.17 b−0.328
N:K198.2 ± 77.08 a−0.619 ***318.3 ± 94.62 b−0.790 ***
P:Mn89.3 ± 3.96 a0.11477.6 ± 4.38 b0.448 **
K:Ca0.4 ± 0.12 a0.762 ***0.2 ± 0.03 a0.733 ***
Ca:Mn78.6 ± 2.73 a−0.13394.5 ± 4.44 b0.390 *
Ca:Al34.9 ± 4.06 a−0.28662.1 ± 4.06 b−0.067
Mg:Mn79.9 ± 3.98 a0.09591.9 ± 3.51 b0.371 *
Table 2. Pairwise correlations between detrended isotopic signals (intrinsic water-use efficiency (iWUE) and oxygen isotope composition (δ18O)) and nutrient concentrations and stochiometric ratios. The Spearman ρ statistic and associated p-value (+ p < 0.1; * p < 0.05; ** p < 0.01; *** p < 0.001) is shown for pair of variables for living (L) and dead (D) trees.
iWUEδ18O
L TreesD TreesL TreesD Trees
Nutrient
concentrations
N (mg g−1)0.131−0.2320.1620.068
P (µg g−1)−0.1260.490 *−0.2650.473 *
K (µg g−1)−0.1390.548 *−0.1900.458 *
Ca (µg g−1)−0.1000.3170.347−0.432 *
Al (µg g−1)−0.0740.713 ***0.2930.311
Mg (µg g−1)−0.016−0.016−0.3210.579 *
Mn (µg g−1)0.0170.457 *0.0090.473 *
Zn (µg g−1)0.1640.576 **0.2880.144
Stoichiometric
ratios
N:P0.138−0.473 *0.362 +−0.423 *
N:K0.095−0.541 *0.213−0.394 +
P:Mn−0.1210.221−0.3210.165
K:Ca−0.1660.468 *0.2430.393 +
Ca:Mn−0.3060.329−0.140−0.351
Ca:Al0.134−0.3430.2820.034
Mg:Mn−0.029−0.029−0.3450.364
Table 3. Linear mixed-effects models (LMMs) characterizing basal area increment (BAI) at tree level. The table shows coefficient estimates ± standard errors (Coef. ± SE) and the F statistic with its associated p-value (* p < 0.05; ** p < 0.01; *** p < 0.001). Fixed effects included diameter at breast height (DBH), tree age, intrinsic water-use efficiency (iWUE), oxygen isotope ratio (δ18O) and scores of NMDS1 and NMDS2 of ordination analysis of nutrient concentration and stoichiometric ratios. The explanatory power of each model is indicated by R_GLMM(m)2 (proportion of variance explained by the fixed factors) and R_GLMM(c)2 (proportion of variance explained by the entire model) [76].
VariablesLiving TreesDead Trees
Coef. ± SEF-ValueCoef. ± SEF-Value
DBH0.350 ± 0.03872.868 ***0.499 ± 0.05078.751 ***
iWUE−0.035 ± 0.0460.763−0.117 ± 0.0603.950 *
δ18O0.051 ± 0.0382.5690.004 ± 0.0280.025
NMDS1Concentration−0.280 ± 0.1610.328−0.265 ± 0.18329.072 ***
NMDS2Concentration−0.094 ± 0.0590.2080.101 ± 0.1610.256
NMDS1Ratio0.397 ± 0.07516.830 ***0.059 ± 0.0452.991
NMDS2Ratio0.143 ± 0.0397.986 **0.016 ± 0.0360.505
R_GLMM(m)20.3190.482
R_GLMM(c)20.3870.523
Publisher’s Note: MDPI stays neutral with regard to jurisdictional claims in published maps and institutional affiliations.

