Abstract
N2-fixing species play a crucial role in mixed-plantations as they improve stand productivity. To quantify the N transfer from N2-fixing species to Eucalyptus (Eucalyptus urophylla × E. grandis) in N2-fixing species/Eucalyptus plantations, we established a pot experiment and confirmed the occurrence of this process under natural conditions. The 15N was traced in labeled species as well as in neighboring tree species after labeling, and the growth was evaluated in short-term natural trials. Our results showed that a bidirectional N transfer occurred. The amount of net N transfer was 21.8–127.0 mg N plant−1, which was equal to 1.5–21.2% of the total nitrogen (TN) that accumulated in Eucalyptus plants under pot conditions, was transferred from Dalbergia odorifera to Eucalyptus. The amount of N transferred significantly decreased with the increasing N application rate but increased with time after labeling. Compared with the results for the Eucalyptus monocrop, the soil N concentration (including NO3−-N and NH4+-N) greatly improved when D. odorifera was introduced together with Eucalyptus under both field and pot conditions. Furthermore, the results under field conditions were consistent with the results of the pot experiment. The dry matter (DM) yield (14.5–16.4%) and the N content (5.1–9.6%) in Eucalyptus increased when mixed together with D. odorifera, but the N content in and DM yield of D. odorifera slightly decreased. It is concluded that the N transfer between Eucalyptus and D. odorifera is a much more important dynamic process than previously recognized, and Eucalyptus and legume intercropping is a successful management practice because N transfer provides a significant amount of N required for Eucalyptus productivity.
1. Introduction
Symbiotic nitrogen (N) fixation plays a key role in local and global N cycling [1]. The resulting N is important and may represent a substantial source of N input in legume/non-legume intercropping/systems [2,3,4]. Through symbiotic N fixation, legumes increase the amount of soil N [5] and subsequently transfer N resources to non-legumes, resulting in biomass increase [6,7]. In intercropping systems, N transfer has the potential to increase the N content and improve the productivity of neighboring non-legumes [8]. However, an improved understanding of the underlying mechanisms and factors that govern N transfer is needed to determine potential areas for improving yield in intercropping systems.
N transfer from legumes to non-legumes can occur through various pathways. Non-legumes can receive N via (1) the uptake of mineralized N by neighboring plants following leguminous root decomposition, (2) the uptake of soluble N-containing exudates released from legumes and (3) N transfer may occur from legumes directly via common mycorrhizal networks (CMNs) [9,10]. Although the use of different 15N-based techniques has greatly facilitated investigations of N transfer pathways between adjacent leguminous and non-leguminous plants [9,10], reliable quantification of this complex process is difficult [11]. The amount of N transferred from N-fixing leguminous species to non-leguminous species has been found to range from 3.3–72.0% of legume N [6,12,13,14], such as from faba bean to wheat [15], from peanut to rice [16] or from Acacia mangium to Eucalyptus [17]. However, the relative importance of N transfer depends to a great extent on the plant species, N management practices, and methods used to determine N resources. While N transfer may occur through interactions between plants of different species or the same species [11], all plants can lose different types of N-containing compounds through their own detritus, leaves, and root secretions [13,18,19,20]. Some studies have reported that bidirectional N transfer can occur between non-legumes and legumes in intercropping systems [12,21,22], with legumes being the recipient of N from non-legumes. Schimel and Hättenschwiler further confirmed that net N transfer was more strongly dependent on plant N status than on tree species [23]. For example, N transfer between legumes and non-legumes by 9.93%, 5.65% and 4.22% mainly relied on the N status [16]. In addition, for timber species, there is evidence that legume-derived N is transferred to neighboring non-leguminous trees, such as Eucalyptus, in plantation systems [3,6,24], resulting in stimulating the nodulation and N2 fixation of legumes [25].
Species in the Eucalyptus genus are among the most widely used in the global commercial timber industry in tropical and subtropical regions worldwide, including China [26]. Compared with Eucalyptus monocrop plantations, mixed-species plantations of Eucalyptus and N2-fixing legumes may be an alternative option [27]. Often, the primary objective of using N2-fixing species in mixed Eucalyptus systems is to increase the N available to the Eucalyptus species [2]. Such mixed-species plantations are more sustainable, as they have the potential to improve the soil nutrient cycle [28,29,30] and increase productivity [31,32,33,34] while maintaining soil fertility. Although many studies have proposed the use of this N transfer pathway from legumes to neighboring Eucalyptus trees as a silvicultural technique for improving Eucalyptus productivity [3,6,24], there is little evidence that N transfer occurs from Eucalyptus to N2-fixing species in mixed plantation systems [22]. Therefore, studies quantifying the bidirectional N transfer and the associated effect on the biomass productivity of Eucalyptus are highly important for the sustainable development of these valuable plantation systems.
In this study, 15N-labeled urea was applied to the leaves of the N2-fixing species Dalbergia odorifera (D. odorifera) or Eucalyptus urophylla × E. grandis (Eucalyptus) (1) to quantify the short-term interspecific N transfer between D. odorifera and Eucalyptus and determine the net direction of N transfer in an intercropping system and (2) to analyze the effects of the amount of N transferred on Eucalyptus growth. However, the evaluation of N transfer with the same method in natural areas may be difficult, and the N transfer cannot be verified with leaf labeling under field conditions. Therefore, a field experiment was conducted in monocultures and mixed plantations of Eucalyptus and D. odorifera to analyze the trends in the biomass and N content and to evaluate the influence of species mixing on Eucalyptus and D. odorifera productivity.
2. Materials and Methods
2.1. Study Site and Experimental Layout
2.1.1. Pot Experiment
Three pot experiments (A, B and C) were carried out on 18 May 2017 at the same experimental site used by Yao et al. [24] and were performed in accordance with a completely randomized block (four blocks in total) design with four treatments for N fertilizer at different application rates (0, 3, 6, and 12 g CO(14NH2)2 pot−1). Seven days after planting, N fertilizer was dissolved in 500 mL water and applied to the soil when we observed that the seedlings surviving and displaying new root growth. Four replicates were included in each treatment, and every replicate corresponds to a block with 15 pots.
The soil used in the three experiments was taken from a Pinus massoniana forest at the Liang Fengjiang Experimental Station, Guangxi, China, and the soil chemical properties before the experiment are presented in Table 1. The soil had a clay loam texture, classified as red soil in Chinese soil classification, and the soil pH of soil sample solutions (1:2.5 soil:water (w/v) ratio) was measured. The total nitrogen (TN), nitrate nitrogen (NO3−-N) and ammonia nitrogen (NH4+-N) in the soil were determined using a continuous-flow chemical analyzer (AA3); the soil organic carbon (SOC), total phosphorus (TP), available phosphorus (AP), available potassium, calcium (Ca) and magnesium (Mg) contents were determined via inductively coupled plasma spectroscopy, as described by Arnesen [35]. Twenty-five kg of air-dried soil was put into each pot and mixed together with perlite at a ratio of 25:1 (w/w) to maintain water permeability.

Table 1.
Soil chemical properties before the planting of D. odorifera and Eucalyptus.
The bidirectional N transfer in the D. odorifera/Eucalyptus intercropping system was studied in two separate experiments (A and B). In experiments A and B, a 15N-labeled urea solution was applied to the leaves of either D. odorifera or Eucalyptus one week after N application. Experiment C was identical to the first two experiments except that the plants received no foliar application of the 15N-labeled urea solution (control (CK) experiment; see Supplementary Figure S1).
Experiment A: D. odorifera Foliar 15N Labeling
In this experiment, three-month-old E. urophylla × grandis and 1-year-old D. odorifera trees were potted in a pot with a diameter of 50 cm and a depth of 45 cm on 18 May 2017 (Figure 1). The experimental placement of pots followed Yao et al. [24]. On 3 June 2017, a 0.125 mol/L solution of 15N-labeled urea with 10.32 atom% 15N (15N was provided by the Shanghai Stable Isotope Engineering Research Center, Shanghai, China) was first used to label the surface of the D. odorifera leaves under different N fertilizer application rates. To prevent contamination of the soil and neighboring Eucalyptus, we following steps were taken: first, we used polyvinyl chloride (PVC) cylinders (height of approximately 80 cm) that were open at both ends to enclose the D. odorifera canopy; second, the soil surface was covered with two layers of plastic film to prevent 15N contamination of the soil from runoff of the 15N-labeled solution during foliar application, and a 1.5-cm-thick barrier consisting of a sponge with two layers of filter paper above the plastic film was used to absorb leachates, as described by Shen and Chu [16] and Meng et al. [36]; third, 10 mL of 15N-labeled urea was sprayed onto the leaves as described by McNeill et al. [37], and afterward, the leaves were immediately covered with sealable polythene bags until the next day to avoid 15N contamination of the associated Eucalyptus plant. All the 15N-labeling processes were strictly controlled as described above to ensure that there was no 15N contamination of the soil or associated Eucalyptus leaves. Two additional labeling applications with 10 mL of 15N-labeled urea were performed on 9 and 15 June 2017. The N transferred from D. odorifera to the associated Eucalyptus was calculated from the amount of 15N detected and TN accumulated in Eucalyptus in the intercropping system.
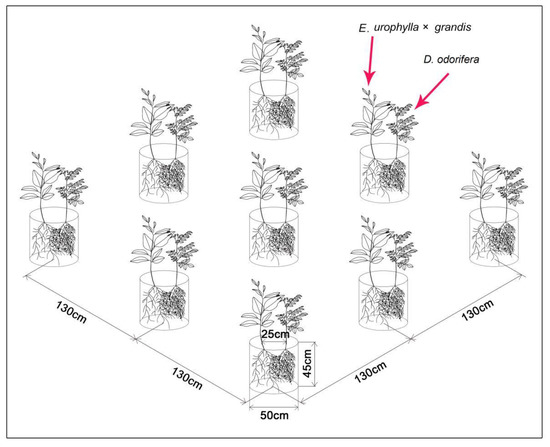
Figure 1.
Diagram of E. urophylla × grandis and D. odorifera. Note: In each pot, the plant on the left is E. urophylla × grandis, and the plant on the right is D. odorifera.
Experiment B: Eucalyptus Foliar 15N Labeling
The growing conditions in this experiment were similar to those in experiment A; i.e., three N fertilizer application rates (no N and 3, 6, and 12 g pot−1) were added to the soil of the intercropping system. On 3, 9 and 15 June 2017, the leaves of the Eucalyptus plants were then treated with 10 mL of 0.75% (m/m) solution of 15N every time in the same manner as the D. odorifera leaves were, such that Eucalyptus was the donor plant and D. odorifera was the receiver plant.
Experiment C: Unlabeling Experiment
Two planting systems, i.e., intercropping and monoculture, were set up here and were used to compare the dry matter (DM) yield of and N accumulation in the two species between the intercropping systems and monocropping systems under different N levels. The growing conditions of this experiment were identical to those of experiments A and B except that the plants received no foliar application of 15N-labeled urea solution.
2.1.2. Field Experiment: DM Yield of and N Content in Plants and Soil N Concentration Analysis
The study site was located at the Experimental Center of Tropical Forestry, Chinese Academy of Forestry (22°07′ N, 106°93′ E), Pingxiang city, Guangxi Zhuang Autonomous Region, China. The mean annual precipitation is approximately 1400 mm; the rainfall occurs mostly from April to September; the mean annual temperature is approximately 21 °C. The soils were formed from granite, classified as red soil in the -Chinese soil classification system, equivalent to oxisol in United States Department of Agriculture (USDA) Soil Taxonomy [38]. The soil has a pH of 4.74 and has the following nutrient contents: TN, 1.13 g kg−1; AN, 54.33 mg kg−1; TP, 0.45 g kg−1; and AP, 5.79 mg kg−1. The determination method was the same as that used for the pot experiment.
Three-month-old Eucalyptus and 1-year-old D. odorifera seedlings were selected as test materials and planted in February 2015, and the initial establishment of the three treatments was completed in the same year. The treatments (36 plots in total) were 100E (a Eucalyptus monocrop), 100D (a D. odorifera monocrop) and 50E:50D (a 1:1 ratio of Eucalyptus and D. odorifera, with the trees of each species planted alternately in each row). The plants of each species were planted in an alternating pattern with a spacing of 2 m in each row and 2.5 m between rows, giving rise to a total planting density of 2000 trees ha−1. In March 2018, an experimental plantation was established in accordance with a completely randomized block design with three replicates. Four N fertilizer treatments and three blocks were established to compare the monospecific and mixed-species stands of D. odorifera and Eucalyptus in March 2018. The N treatments consisted of no N (N0) or the addition of 70 kg N (CO(NH2)2) ha−1 (N70), 140 kg urea ha−1 (N140), and 210 kg urea ha−1 (N210), which was equal to 32.7, 65.4 and 98.1 kg N ha−1 to the soil, respectively.
2.2. Sampling, Measurements and Laboratory Procedures
2.2.1. Pot Experiment
Ten trees were harvested 90, 135 and 180 days after the 15N labeling, and trees from the pot experiments (A, B and C) were separated into Eucalyptus and D. odorifera. The roots of the two species were separated by hand on the basis of their different colors and textures. As many of the roots were collected as possible, with the exception of a few decaying and unidentifiable fine roots. The roots were then washed carefully with a gel tip dropper with a small amount of ultrapure water after soil removal. Soil samples were collected from the middle part of the pots for analysis after planting, and on the same day, the plants were harvested. The harvested materials were dried at 65 °C until a constant dry weight was reached. The dried plant material was ground in a ball mill (<0.1 mm), and the soil samples (experiments A, B and C) were also ground in a separate ball mill (<0.2 mm), avoiding any cross-contamination of samples. The TN and N from ammonium-nitrogen (NH4+-N) and nitrate-nitrogen (NO3−-N) of the plants and soil were determined separately via a continuous-flow chemical analyzer (AA3) [39].
The 15N atom% values were determined (in the samples from experiments A and B) via a mass spectrometer (SN09072D, Homotopic, Thermo Fisher Scientific, Germany). All 15N enrichments were corrected for the background level before the amount of N transferred from the donor to the receiver was calculated. Before labeling was performed, samples were used to measure the atom% 15N background values (15N value before labeling) of the leaves, stems and roots of the two species. The excess amount of 15N of the leaves, stems and roots of the receiver and donor plants were calculated via Equation (1) as follows [9,40,41]:
where atom% 15Nlabeled is the atom% 15N of a labeled sample after 90, 135 and 180 days, and atom% 15Nunlabeled is the atom% 15N before labeling, and TN is (N concentration) × biomass. The total 15N amount in a whole plant was calculated by summing the amount of 15N of the roots, stems and leaves. The underlying assumption of Equation (1) is that the 15N in the plants at harvest was the same as at “time zero” under unlabeled treatments.
The percentage of the total nitrogen transferred from the donor to the receiver (% NT) was estimated by Equation (3) as follows [16]:
The amount of N (mg plant−1) transferred from the donor was calculated as follows [42]:
where Ntransfer is the unidirectional net transfer from D. odorifera (the 15N donor plant) to Eucalyptus (the 15N receiver plant) and vice versa. Notably, the net Ntransfer could be estimated from paired treatments of foliar-labeled legumes and non-legumes according to the different Ntransfer values between D. odorifera and Eucalyptus.
The proportion of N in the receiver derived from the transfer (% NDFT) was calculated according to the following equation [16]:
where Ndonor is TN of D. odorifera, and Nreciever is TN of Eucalyptus.
2.2.2. Field Experiment
Three trees of both Eucalyptus and D. odorifera were harvested from each plot on 19 March 2019. According to Monsic’s stratified clip method [42], the aboveground biomass (AGB) of the stem of trees was divided into 2-meter sections and measured, and each tree was separated into roots, stems, bark, branches and leaves, and their fresh weights were determined. Afterward, 500 g of each component was carefully preserved in the laboratory. The harvested material was dried at 65 °C until a constant weight was reached. The dried material was subsequently ground in a ball mill (<0.1 mm), and the DM of the above- and belowground organs was calculated according to the allometric equations described by Magalhães and Seifert [43]. The TN concentration of each plant was also determined via a continuous-flow chemical analyzer (AA3), and the N content of each plant compartment was calculated as the product of N from the DM yield and TN concentration.
On 19 March 2019, after one year of N application treatment, five soil samples were randomly collected from each plot at a depth of 0–20 cm and uniformly mixed into a composite sample. The corer was wiped clean of obvious soil particles with a paper towel when sampling different plots, and the composite soil samples were divided into two portions. One portion was passed through a 2 millimeter (2 mm) sieve to remove visible stones, soil organisms, roots and other plant material and was stored at 4 °C for analysis of NH4+-N and NO3−-N contents. The other portion was air-dried at room temperature, sieved through a 0.2-mm screen, and then used to analyze the TN content. The TN, NH4+-N, and NO3−-N contents in the soil were also determined via a continuous-flow chemical analyzer (AA3) (the N concentrations of the plants are shown in Supplementary Table S1).
2.3. Statistical Analysis
In both experiments, statistical analyses were performed using SPSS 20.0 software (SPSS Inc., Chicago, IL, USA). For the pot experiment, differences in DM yield of and N content in both species, soil N concentration, atom % 15N and N transfer (%) between the two plantation systems (monoculture vs. intercropping) were assessed by one-way ANOVA with Tukey’s post hoc test at p < 0.05. Interactions between independent variables were analyzed by two- and three-way ANOVA. Data are reported as means ± standard error (n = 4). We also used t-tests to evaluate the differences in DM yield or N content of both species between intercropping and monoculture systems, with N level as a fixed factor. The Pearson correlation between the soil N concentration and the amount of N transferred were assessed via Pearson correlation coefficients.
For the field experiment, differences in N content and DM yield of both species and the soil N concentration under three N treatments were assessed by one-way ANOVA with Tukey’s post hoc test at p < 0.05. Interactions between independent variables were analyzed by two-way ANOVA. Data are reported as means ± standard error (n = 3). The significance level was α = 0.05.
3. Results
3.1. Pot Experiment
3.1.1. DM Yields (Experiment C)
The N level, growth duration and planting system, as well as their interactions, significantly affected Eucalyptus and D. odorifera DM yields (see Supplementary Table S2). The DM yield of Intercropped Eucalyptus was significantly higher than of the monocropped Eucalyptus at 135 and 180 days (p < 0.05). In addition, the DM yield of Eucalyptus increased with increasing N fertilizer application (Figure 2a–c). In contrast, the DM of D. odorifera was lower in the intercropping system than in the monocropping system, which was significant in the later stages (Figure 2d–f). Nevertheless, the DM yield of D. odorifera was significantly lower under N3 than under N2, except in the intercropping system at 180 days. The DM yield of the stems was greater than that of the leaves and roots of both tree species.
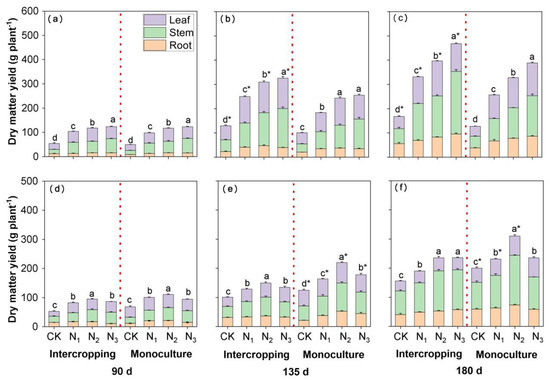
Figure 2.
The effects of N application and the planting system on DM accumulation in intercropped and monocropped E. urophylla × grandis (a–c) and D. odorifera (d–f) plants. CK indicates plants without N application, and N1, N2, and N3 correspond to N fertilizer application rates of 3, 6, and 12 g urea (CO(14NH2)2) pot−1, respectively. The different lowercase letters above the bars indicate significant differences (p < 0.05) in whole-plant DM accumulation among the N treatments within each planting system. * indicates a significant difference (p < 0.05) in E. urophylla × grandis or D. odorifera between intercropped and monocropped plants. Error bars indicate ± SE (n = 4).
3.1.2. Plant N (Experiment C)
The N content in Eucalyptus and D. odorifera was significantly affected by the N level, growth duration and planting system, and the N level × planting system, time × planting system and N level × planting system interactions significantly influenced the N content in both species (Supplementary Table S3). The N content in all the plant parts and in the whole plants of both species increased with increasing N application, the trend of which was the same as that for DM yield (Figure 3). Nevertheless, there were differences in N content between the two species. The N content in Eucalyptus was significantly greater (by 7.6–97.3%) under intercropping conditions than under monocropping conditions, but it was 0.5–13.2% lower in D. odorifera. Moreover, the N content in the leaves of Eucalyptus was always the greatest among all plant parts measured except in the intercropping system at 180 days (Figure 3a–c). The N content in the leaves of D. odorifera was the greatest on days 90 and 135 (Figure 3d,e), whereas the N content in stems was greater than that in the leaves and roots on day 180 (Figure 3f).
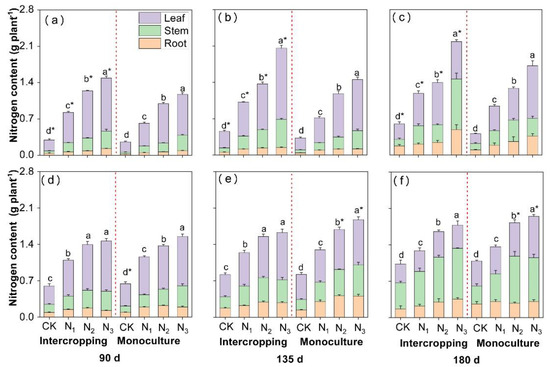
Figure 3.
The effects of N application and the planting system on N accumulation in intercropped and monocropped E. urophylla × grandis (a–c) and D. odorifera (d–f). CK indicates plants without N application, and N1, N2, and N3 correspond to N fertilizer application rates of 3, 6, and 12 g urea (CO(14NH2)2) pot−1, respectively. The different lowercase letters above the bars indicate significant differences (p < 0.05) in whole-plant N accumulation among the N treatments within each planting system. * indicates a significant difference (p < 0.05) in E. urophylla × grandis or D. odorifera between intercropped and monocropped plants. Error bars indicate ± SE (n = 4).
3.1.3. N Transfer between Eucalyptus and D. odorifera (Experiment A and B)
The excess atom% 15N mean values in Eucalyptus prior to labelling were 0.360, 0.352 and 0.388 in the root, stem and leave, respectively, which was slightly higher than those of D. odorifera with 0.343, 0.350 and 0.357, respectively (Supplementary Table S4). The atom% 15N values of Eucalyptus (with 0.332.82%) were greater than those of D. odorifera (with 0.027–0.064%) when the Eucalyptus trees were labeled with 15N (Figure 4) and vice-versa (Figure 5). The excess atom% 15N value of Eucalyptus significantly decreased with increasing N fertilizer application (p < 0.05) (Figure 4a–c). For D. odorifera, the atom% 15N of the stems and roots under N3 was significantly lower than that under CK and N1 on day 90, but the excess atom% 15N of the leaves under the N application treatment was greater than that under the CK treatment (Figure 4d). In particular, on days 135 and 180, there was no significant difference between the leaves (Figure 4e,f). The excess atom% 15N of both plant species significantly decreased with increasing N fertilizer application, and the D. odorifera leaves under different treatments had a greater excess atom% 15N than did roots (mean values by 54.89–155.29%) and stems (by 11.29–114.18%) when D. odorifera was the 15N donor to Eucalyptus (Figure 5d–f). In addition, the excess atom% 15N of Eucalyptus decreased over time, regardless of whether Eucalyptus or D. odorifera was the 15N donor. The atom% 15N was greater in Eucalyptus donors than in D. odorifera donors and was greater in Eucalyptus receivers than in D. odorifera receivers under all the N treatments.
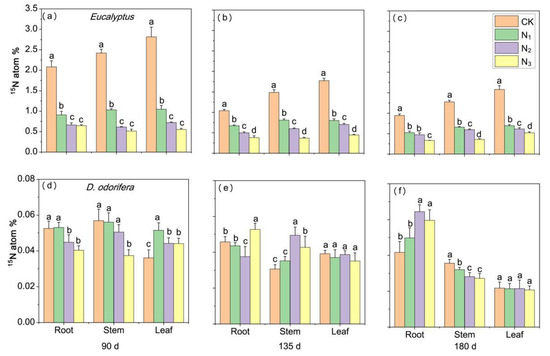
Figure 4.
Atom% 15N in excess in plant components of both species in pots where Eucalyptus was labeled at different N levels (i.e., E. urophylla × grandis as the 15N donor and D. odorifera as the receiver plant), where atom% 15N is the difference between atom% 15N90, 135 180 days after labeling and atom% 15Nbefore labeled. Panels (a–c) show the atom% 15N of E. urophylla × grandis, and panels (d–f) show the atom% 15N of D. odorifera. CK indicates plants without N application, and N1, N2 and N3 correspond to N fertilizer application rates of 3, 6 and 12 g urea (CO(14NH2)2) pot−1, respectively. The different lowercase letters above the bars indicate significant differences among N treatments (p < 0.05). Error bars indicate ± SE (n = 4).
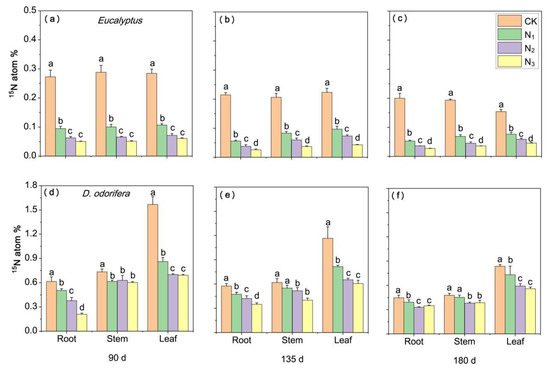
Figure 5.
Atom% 15N in excess in plant components of both species in pots where D. odorifera was labeled at different N levels, where atom% 15N is the difference between atom% 15N90, 135 180 days after labeling and atom% 15Nbefore labeled. Panels (a–c) show the atom% 15N of E. urophylla × grandis, and panels (d–f) show the atom% 15N of D. odorifera. CK indicates plants without N application, and N1, N2 and N3 correspond to N fertilizer application rates of 3, 6 and 12 g urea (CO(14NH2)2) pot−1, respectively. The different lowercase letters above the bars indicate significant differences among N treatments (p < 0.05). Error bars indicate ± SE (n = 4).
Nitrogen transfer was observed in the Eucalyptus/D. odorifera system at all N application rates. The NT% ranged from 3.2–7.1% when Eucalyptus was the 15N donor and significantly increased with N application. In addition, the NT% under N1 was significantly lower than that under N2 and N3 (Figure 6a). In contrast, the NT% ranged from 8.6–14.6% and significantly decreased with increasing N application when D. odorifera was the 15N donor (Figure 6b). The N level, growth duration and their interactions had significant effects on the NT% regardless of whether D. odorifera or Eucalyptus was used as the donor (Supplementary Table S5).
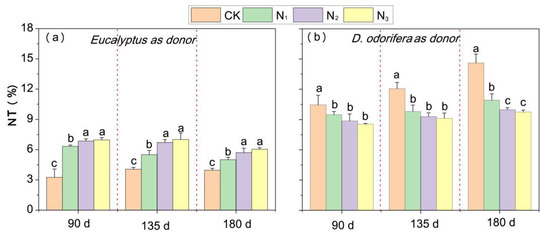
Figure 6.
The bidirectional N transfer between D. odorifera and E. urophylla × grandis in an intercropping system with different percentages of N transfer (% NT) from N fertilizer application: (a) E. urophylla × grandis as the 15N donor (i.e., % NT is the unidirectional transfer from E. urophylla × grandis to D. odorifera); (b) D. odorifera as the 15N donor (i.e., % NT is the unidirectional transfer from D. odorifera to E. urophylla × grandis). CK indicates plants without N application, and N1, N2, and N3 correspond to N fertilizer application rates of 3, 6, and 12 g urea (CO(14NH2)2) pot−1, respectively. PN×T indicates the N level × time interaction. The different lowercase letters above the bars indicate significant differences (p < 0.05) in N transfer percentage among the N treatments. Error bars indicate ± SE (n = 4).
3.1.4. N Transfer Amount (Experiment A and B)
The two-way ANOVA showed that both the N level and the growth duration, as well as the N level × time interaction, significantly affected the NDFT% and the amount of N transferred (Table 2). The amount of N transferred from D. odorifera to Eucalyptus (62.1–173.5 mg plant−1) was greater than that transferred from Eucalyptus to D. odorifera (9.6–140.4 mg plant−1). Therefore, the net N transfer was from D. odorifera to Eucalyptus and increased over time; the mean values ranged from 20.8–52.5 mg plant−1, 23.1–80.3 mg plant−1 and 41.8–127.0 mg plant−1 under different the N levels at 90, 135 and 180 days, respectively. The net amount of N transferred significantly decreased with increasing N application (p < 0.05), except for N1 at 90 days. The NDFT% in Eucalyptus plants ranged from 1.5–21.2% and significantly decreased with the N application rate on days 135 and 180 but tended to slightly increase with time (Table 2).
Table 2.
The mean values of the net amount of N transferred and the percentage of TN content (NDFT (%)) in Eucalyptus plants as a result of N level, time, and their interaction.
3.1.5. Soil N Concentration and Its Relationship with N Transfer (Experiment A and B)
The concentrations of soil TN (Figure 7a–c), NH4+-N (Figure 7d–f) and NO3−-N (Figure 7g–i) in the monocrop D. odorifera were the greatest (mean values with 0.81–1.34 g kg−1 TN, 12.10–26.18 mg kg−1 NH4+-N and 3.84–10.81 mg kg−1 NO3−-N concentration), while the lowest values were obtained in the monocropped Eucalyptus (with 0.61–1.10 g kg−1 TN, 11.45–24.56 mg kg−1 NH4+-N and 3.57–5.24 mg kg−1 NO3−-N concentration). Under the Eucalyptus and D. odorifera intercropping and monocropping systems, the TN and NH4+-N concentrations under the N3 treatment were significantly greater than those under the CK treatment, except for monocropped D. odorifera at 180 days. The NO3−-N concentrations under the N3 treatment were significantly greater than those under the other treatments at 90 days (p < 0.05). Overall, the concentrations of soil TN, NH4+-N and NO3−-N under the intercropping and monocropping systems increased with increasing N fertilizer rate; particular, those under the N3 treatment were significantly greater than those under the other treatments at 90 and 135 days. The soil N concentrations were significantly affected by the N level, growth duration and planting system. Moreover, the N level × planting system and time × planting system interactions significantly influenced the NH4+-N concentration, whereas the N-NO3− concentration was significantly affected only by the N level × planting system and time × N level interactions (Supplementary Table S6).
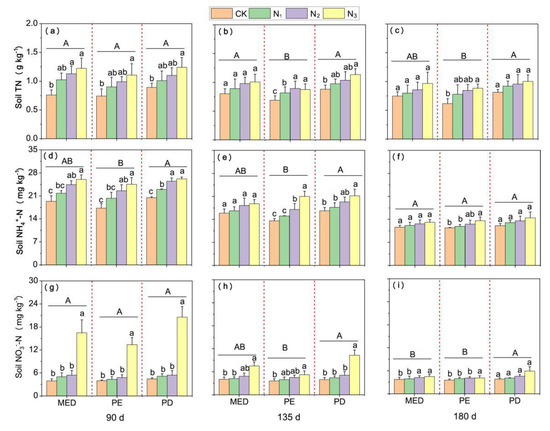
Figure 7.
Concentrations of TN (a–c), N-NH4+ (d–f) and N-NO3− (g–i) in the soil at days 90, 135 and 180. The different lowercase letters above the bars indicate significant differences (p < 0.05) in concentrations of TN, NH4+-N and NO3−-N in the soil among the N treatments. MP = E. urophylla × grandis mixed together with D. odorifera plantations; PE = pure E. urophylla × grandis plantations; PD = pure D. odorifera plantations. The different capital letters on the straight lines indicate significant differences in the concentrations of TN, NH4+-N and NO3−-N in the soil among planting systems (p < 0.05). CK indicates plants without N application, and N1, N2 and N3 correspond to N fertilizer application rates of 3, 6 and 12 g urea (CO(14NH2)2) pot−1, respectively. Error bars indicate ± SE (n = 4).
The net amount of N transferred was significantly negatively correlated with the soil N concentration. The net amount of N transferred had a weaker correlation with the concentration of N-NO3− (R2 = 0.17; Figure 8b) and the concentration of TN (R2 = 0.35; Figure 8a) but was more strongly correlated with the concentration of N-NH4+ (R2 = 0.43; Figure 8c).
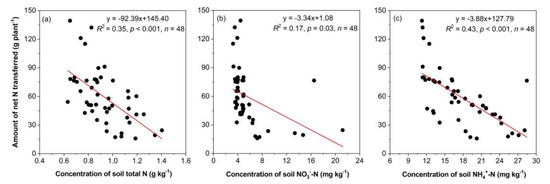
Figure 8.
Correlations between the net amount of N transferred and the concentration of total soil N (a), nitrate nitrogen (NO3−-N) (b) and ammonium nitrogen (NH4+-N) (c). The y-axis represents the unidirectional transfer per pot, which was from D. odorifera to E. urophylla × grandis.
3.2. Field Experiment
3.2.1. DM Yield and Plant N Content
The DM yield and N content of Eucalyptus were significantly greater by 5.1–9.6% and 14.5–16.4% than those in monoculture (p < 0.05) (Figure 9a,c). In contrast, the DM yield of and N content in D. odorifera were slightly lower in the mixed plantations than in the pure plantations, albeit statistically insignificant (Figure 9b,d). However, the total biomass of monoculture Eucalyptus (the equivalent of 79.17–87.50 t ha−1) was greater than that of the mixed plantations (43.99–54.02 t ha−1) and monoculture D. odorifera (2.88–4.22 t ha−1). Additionally, the DM yield of and N content in both plant species increased significantly under the N140 and N210 treatments compared with the CK treatment, and for both plant species in pure plantations, the DM yield under the N70 treatment was also significantly greater than that under the CK treatment. Although the N level and planting system significantly affected the DM yield and N content of both species, their interactions had no significant effect (Supplementary Table S7).
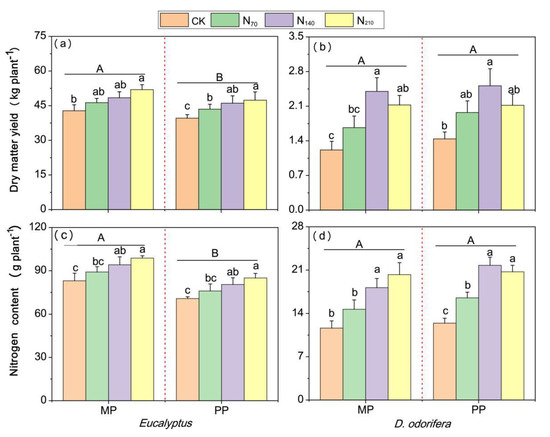
Figure 9.
The effects of N application and planting system on the DM yield of and N content in mixed and pure E. urophylla × grandis and D. odorifera plants. CK indicates control plants without N application; N70, N140 and N210 correspond to N fertilizer application rates of 70, 140 and 210 kg urea (CO(14NH2)2) ha−1, respectively. (a,b) represent the DM yield of E. urophylla × grandis and D. odorifera, respectively. (c,d) represent the N content of E. urophylla × grandis and D. odorifera, respectively MP = E. urophylla × grandis mixed together with D. odorifera plantations; PP = pure plantations. The different lowercase letters above the bars indicate significant differences (p < 0.05) in whole-plant DM accumulation among N treatments within each planting system. The different capital letters on the straight lines indicate significant differences in E. urophylla × grandis or D. odorifera between mixed and pure plantations (p < 0.05). There was no significant N level × planting system interaction effect on the DM yield of or N content in either species. Error bars indicate ± SE (n = 3).
3.2.2. Soil N Concentration
The soil N concentration results were also consistent with the results of the pot experiments; i.e., the concentrations of soil TN, N-NH4+ and N-NO3− in the D. odorifera monocrop were greatest, while the lowest values were observed in the Eucalyptus monocrop (Table 3). Compared with the values in the Eucalyptus monocropping system, the concentrations of soil TN, N-NH4+ and N-NO3− in the intercropping system were 3.5–9.1%, 14.6–33.5% and 6.5–50.1% greater, respectively, but the values were 19.3–26.5%, 2.2–23.1% and 17.5–30.7% lower, respectively, than those in the D. odorifera monocropping system (Table 3). Moreover, the soil N-NH4+ concentration in the D. odorifera monocrop was significantly greater than that in other plantations except under the N210 treatment in the mixed plantation. Although two-way ANOVA showed that both the N level and the planting system significantly affected all the tested soil N concentrations, the N level × planting system interaction did not significantly affect the soil N concentrations (Table 3).
Table 3.
The mean values of TN, NH4+-N and NO3−-N concentration in the soil as a result of planting system (P-S), N level (N) and their interaction after 4 years under field conditions.
4. Discussion
4.1. Bidirectional N Transfer Occurs in Mixed Systems, and Net N Transfer Occurs from D. Odorifera to Eucalyptus
The N transfer process may provide a significant amount of the N requirements of trees close to legumes, and investigating this process could lead to an improved understanding of N cycling driven by interactions between plants [6,10]. Significant 15N enrichment was already detectable in unlabeled species in our experiment after leaf labeling of neighboring plants, which showed that N transfer in the intercropping system between Eucalyptus and D. odorifera occurred in the short term. Direct and indirect routes can account for the belowground N transfer observed between trees [11]. First, short-term belowground N transfer may occur directly via CMNs [44], and these CMNs can be formed by arbuscular mycorrhizal fungi (AMF) [45] or ectomycorrhizal fungi [22]. The roots of both species can be colonized by ectomycorrhizal fungi and may potentially form CMNs [46], promoting the occurrence of N transfer. Second, excreted N from roots, which is rapidly produced after 15N is applied to leaves [20,47], can be rapidly taken up by neighboring plants. It should be emphasized that the percentage of 15N that was transferred from D. odorifera to Eucalyptus trees in our study ranged from 8.6–14.6% depending on N supply, which is higher than the N transfer range of 6.5–9.6% from D. odorifera to Eucalyptus observed with 15N dilutions in the soil [24]. The explanation for it could be our calculation method of %NT (Equation (2)) in the study; the result may be an overestimation of NT % over the course of the experiment due to part of exuded N remaining in soil even over time periods of several months and not being fully absorbed by neighboring plants [9,47]. Although we have not determined the N exudation in this study, previous studies have frequently found that non-leguminous plants absorption of N exuded by leguminous plants was relatively low [47].
Our results show that the net transferred N was from D. odorifera to Eucalyptus was consistent with previous studies. There are two possible reasons for it, and one is that the N transfer via CMNs and flow from the more N-sufficient plant to the less N-sufficient one [20]. Indeed, our results showed that the N concentration was greater in D. odorifera plants than in Eucalyptus plants (Table S1), resulting in the N transferred being greater from D. odorifera to Eucalyptus than from Eucalyptus to D. odorifera, which is consistent with findings of previous reports [6,23]. The other potential reason could be that leguminous plants with a low C:N ratio can release more N via root decay than those with a high C:N ratio, which suggests that legume root exudates potentially are a good source of N to adjacent plants, either directly absorbed or after rapid recycling via soil microbial organisms [47], thus increasing the amount of N transferred from leguminous species to non-leguminous species [14]. Overall, although bidirectional N transfer was verified between Eucalyptus and D. odorifera, the net transferred N was still from legumes plants to Eucalyptus.
4.2. Soil N Concentration and the Growth Duration of Plants Are the Main Factors Affecting N Transfer
Chalk et al. pointed out that N transfer depended on the soil N status and the number of labeled urea applications, and transfer from leguminous to non-leguminous plants improved when the soil available N content was low [9]. Oliveira et al. suggested that higher rates of belowground transfer of N from leguminous plants to Eucalyptus trees in non-fertilized than in fertilized mixed-species stands [17]. Our results were also consistent with this finding. The net amount of N transferred in the N application treatments was lower than that under the CK treatment suggested that N transfer decreased with increasing soil N application. In addition, soil ammonium and nitrate are responsible for driving changes in the 15N content of plants in space and time [10], thereby affecting N transfer in legume/non-legume intercropping systems. Eucalyptus seems to be more sensitive to N in the form of ammonium than other N forms [4]. This finding is consistent with the observation that the growth of many forest plant species is greatest when ammonium is supplied [48]. He et al. suggested that N transfer was greater from Casuarina to Eucalyptus when N was supplied as 15NH4+-N rather than 15NO3−-N [22]. In agreement with previous studies, our results suggest the relationship between ammonia N concentrations and N transfer is greater than that between nitrate N concentrations (Figure 8b,c). N transfer observed in this study was affected by the soil N concentration, especially the N-NH4+ concentration, confirming the findings on N transfer by He et al. [22].
The growth advantage associated with mixed cropping systems increases over time for non-leguminous plants [49], and the amount of N transferred is affected by time [6]. The proportion of transferred N in Eucalyptus (% Ndft) increased throughout this experiment, probably as a result of an increase in N exudation with tree growth (Table 2). Previous studies have found that the amount of N transferred between leguminous and non-leguminous plants was shown to be greater at 79 days than at 50 days [21]. A similar time-dependent growth advantage was also confirmed in a study by Paula et al. [6]. Our results were consistent with these previous studies: the net amount of N transferred increased from 20.8 to 127.0 mg plant−1 with time, probably due to the continuous absorption of N exudation by D. odorifera over time periods of several months [24]. This relationship may explain the increasing growth advantage of Eucalyptus, i.e., that caused by enhanced N transfer. Additionally, the amount of N transferred from leguminous plants increased with time, as outlined by Chalk et al. [9], increasing the N content in non-leguminous plants. Importantly, two-way ANOVAs showed that the NT % was significantly affected by N application, growth time and their interactions regardless of whether Eucalyptus or D. odorifera was the 15N donor (Table S5). Therefore, we suggested that soil N concentration and growth duration were key factors affecting N transfer in our study.
4.3. Competition Increasing the Growth of Eucalyptus but Limiting That of D. odorifera
Previous studies have shown that establishing commercial Eucalyptus plantations on poor soils leads to a high loss of N after wood harvesting, and the introduction of leguminous species appears to be a promising strategy to increase the N content of Eucalyptus [49]. In our study, compared with that in Eucalyptus in monocrops, the biomass and N content in Eucalyptus in mixed plantations significantly increased under the field and pot conditions suggesting that the improvement in productivity may be due to N transfer from the legume [6,50], which were consistent with other studies [6,8,49]. Another crucial reason is that leguminous plants can rely heavily on fixed N, which can represent 10% to nearly 100% of the N used by the leguminous plant [51]. Thus, more soil N may be available to non-leguminous plants before the fixed N is cycled and transferred to the non-leguminous plants. D. odorifera can obtain N through symbiotic N2 fixation, while Eucalyptus may obtain a more than the proportional share of soil inorganic N due to a high competitive ability to take up this N, which was proved in our preliminary study [24]. Namely, Eucalyptus was the dominant species taking up more amounts of N from soil in the intercropping system, which decreased the soil N concentration compared with the D. odorifera monoculture [52]. Therefore, biological N fixation by D. odorifera in the intercropping system was improved, and N sparing was increased, suggesting that increased Eucalyptus growth is not only the result of N transfer but also N sparing.
Studies have shown that positive and negative effects between species in terms of N absorption coexist in various systems [53] or promote the growth of both N-fixing species and Eucalyptus in mixed-species plantations [54]. Our results from both experiments are consistent with those of Hong et al. [52]; i.e., the positive effects improved the growth of Eucalyptus, but the growth of and N content in D. odorifera were limited in the mixed system. One explanation for these findings is the competition of Eucalyptus was greater than that of D. odorifera [24], and increased competition for light, soil water and nutrition contributed to the decreased growth of D. odorifera in the mixture. Another reason is related to N transfer; Eucalyptus benefits from transferred N and has a positive effect in mixed systems. In addition, root symbiotic relationships and root exudate allelochemicals are commonly involved in root interactions [55,56]. Some species contain unique allelochemicals in their exudates to inhibit neighboring plants [57]. Xia et al. showed that broadleaf species chemically mediate the growth of neighboring plants (Chinese fir) through root exudates [58]. Eucalyptus has been widely studied for its high allelochemical content, such as phenolic acids [59]. For example, Liu et al. suggested that three phenolic acids were isolated from the roots of Eucalyptus, and they would decrease the Albizia jjulibrissin plant growth [60]. Therefore, they also may inhibit biomass growth of D. odorifera in our study, but further studies are needed to test whether D. odorifera biomass would be inhibited by phenolic acids of Eucalyptus. Importantly, the total biomass of the Eucalyptus monoculture plantations was greater than that of the mixed plantations and D. odorifera monoculture plantations under different N levels. Compared with pure Eucalyptus plantations, although the soil N concentration was increased (Table 3), the total productivity in the mixture decreased in a short time. Therefore, suggesting that the mixed plantations of D. odorifera and Eucalyptus should be maintained as long-term silvicultural systems with sustainable management. Additionally, to solve the problem of wood shortage, we suggested that the proportion of Eucalyptus and D. odorifera with 67% and 33% probably more scientific and reasonable reflect the current management in commercial plantations than previously recognized.
4.4. N Transfer Probably Occurs but Differs between Natural Areas and Commercial Areas
N transfer was studied via seedlings in a greenhouse, which might yield substantially different findings compared with those of field experiments because of differences in growing conditions. The main reason for this was to avoid loss of N due to rain; our pot experiment was conducted in the greenhouse. However, we confirmed the substantial bidirectional transfer of N occurred between the litters using experiments under field conditions, which showed the net transfer of N from high-N to low-N litter [13]. This is consistent with results obtained by Godoi et al., in which it was found that the N leaf concentration correlated positively with the N in the Eucalyptus litter under field conditions [61]. This result suggested that transferred N in Eucalyptus (% Ndft) would be increased in the field due to the increase the absorption N from the leguminous plants’ litter, while litter and microbes had smaller effects on N transfer in our experiment compared with those in natural and commercial areas [13,62]. In addition, more N may be absorbed from the soil during the growth process in natural and commercial areas than in pot experiments because of differences in growth duration, as demonstrated by experiments on Eucalyptus and casuarina (Casuarina cunninghamiana), where the % NT after one year was double that at six months [22].
Although the increasing N content and biomass of Eucalyptus benefited from N transfer under field conditions, the NT % was probably lower than in the pots because N was mainly released belowground close to the N2-fixing trees [6]. First, different trees can exert effects through belowground chemical interactions, where the root exudates of neighbors influence root placement patterns [58], and there may be different root placement patterns and distances between the pot and field experiments. For example, the 15N values in young Eucalyptus leaves and roots were shown to decrease with increasing distance from labeled Acacia trees [6]. Second, for the plantations, the moderate reduction in stand density of forests was beneficial to the growth of trees and maintaining soil nutrients and soil water, which helps to achieve sustainable management in the long run [63]. Therefore, the distance between different trees under the field conditions was greater than that under the pot conditions, resulting in a lower NT % in the natural areas than that in the pot experiment. For example, the % NT values in the pot conditions for D. odorifera transferring N to its hemiparasite (Santalum album) (68–72%) with nodulation treatment [14] or D. odorifera transferring N to Eucalyptus (6.5–9.6%) [24] were greater than those determined for Acacia trees transferring N to Eucalyptus (3.33%) within approximately 6.2 m of each other [6].
5. Conclusions
Under pot conditions, a foliar 15N labeling approach was used for the first time to detect the bidirectional N transfer in seedlings of Eucalyptus and an N2-fixing species, D. odorifera, and our study demonstrated the feasibility of detecting the bidirectional N transfer between woody plant species in pot experiments via the foliar 15N labeling approach. The findings suggested that the net N transfer occurred from D. odorifera to Eucalyptus and was affected by the N application rate and growth duration. Transferred N is an important N source and increases the productivity of Eucalyptus, particularly when the soil already has low N concentrations (at most, 127.0 mg plant−1 N, which was 21.2% of the TN accumulated in Eucalyptus plants). Further studies on the possible benefits of the N transfer from D. odorifera to Eucalyptus in the field are warranted to evaluate the long-term influence on Eucalyptus productivity and to provide evidence for the sustainable development of Eucalyptus and N-fixing species in mixed forests.
Supplementary Materials
The following are available online at https://www.mdpi.com/article/10.3390/f12091171/s1, Figure S1: Flow diagram of 15N-labeled experiment, Table S1: The N concentration of Eucalyptus and D. odorifera under different N application rate and planting system at 90, 135 and 180 days. Table S2: The F statistic and p values for nitrogen levels (N), time (T) and planting systems (P-S) ANOVA effects on the dry matter yield of Eucalyputs urophylla × grandis and D. odorifera. Table S3: The F statistic and p Values for nitrogen levels (N), time (T) and planting systems (P-S) ANOVA effects on the N content of Eucalyputs urophylla × grandis and D. odorifera. Table S4: The mean of atom % 15N (standard error) in plants compartments of D. odorifera and Eucalyptus before 15N labeling (15N abundance values). Table S5: The F statistic and p values for nitrogen levels (N) and time (T) ANOVA effects on N transfer. Table S6: The F statistic and p values for nitrogen levels (N), time (T) and planting systems (P-S) ANOVA effects on soil TN, NH4+-N and NO3−-N concentration under the pot conditions. Table S7: The F statistic and p values for Nitrogen levels (N) and planting system (P-S) ANOVA effects on dry matter yield under field conditions.
Author Contributions
S.Y. (Shaoming Ye), X.Y. and M.Y. designed the experiments; X.Y. and L.L. carried out the experiments; X.Y. and S.Y. (Sufang Yu) analyzed the experimental results; X.Y., S.W. and L.L. analyzed the data and developed the analytical tools; and X.Y., S.Y. (Shaoming Ye) and U.M.G. wrote and edited the manuscript. All authors have read and agreed to the published version of the manuscript.
Funding
This research was funded by the National Natural Science Foundation of China, grant number 31460196) and the Innovation Project of Guangxi Graduate Education, grant number YCBZ2018012.
Institutional Review Board Statement
Not applicable.
Informed Consent Statement
Not applicable.
Data Availability Statement
Not applicable.
Acknowledgments
All those who contributed towards the article who do not meet the criteria for authorship, including anyone who provided professional writing services or materials are acknowledged. The authors are grateful to Junfei Xiong and Zhi Nong at the Chinese Academy of Forestry, Guangxi, China, for collecting the soils and harvesting and measuring the plants in the field. We thank the American Journal Experts (www.aje.cn, on 29 April 2021) for their linguistic assistance during the preparation of this manuscript.
Conflicts of Interest
None of the authors have any competing interests.
References
- Pons, T.L.; Perreijn, K.; Kessel, C.V.; Werger, M. Symbiotic nitrogen fixation in a tropical rainforest: 15N natural abundance measurements supported by experimental isotopic enrichment. New Phytol. 2007, 173, 154–167. [Google Scholar] [CrossRef]
- Forrester, D.I.; Bauhus, J.; Cowie, A.L.; Vanclay, J.K. Mixed-species plantations of Eucalyptus with nitrogen-fixing trees: A review. Forest Ecol. Manag. 2006, 233, 211–230. [Google Scholar] [CrossRef] [Green Version]
- Carranca, C.; Madeira, M.; Torres, M.O. N2 fixation by two lupine species under different soil management systems: Transfer of fixed N2 from legume to intercropped Eucalyptus. Rev. Ciências Agrárias 2013, 36, 71–83. [Google Scholar]
- Tchichelle, S.V.; Epron, D.; Mialoundama, F.; Koutika, L.S.; Harmand, J.M.; Bouillet, J.P.; Mareschal, L. Differences in nitrogen cycling and soil mineralisation between a eucalypt plantation and a mixed eucalypt and Acacia mangium plantation on a sandy tropical soil. South For. 2017, 79, 1–8. [Google Scholar] [CrossRef] [Green Version]
- Forrester, D.I. The spatial and temporal dynamics of species interactions in mixed-species forests: From pattern to process. For. Ecol. Manag. 2014, 312, 282–292. [Google Scholar] [CrossRef]
- Paula, R.R.; Bouillet, J.-P.; Trivelin, P.C.O.; Zeller, B.; Gonçalves, J.L.M.; Nouvellon, Y.; Bouvet, J.-M.; Plassard, C.; Laclau, J.-P. Evidence of short-term belowground transfer of nitrogen from Acacia mangium to Eucalyptus grandis trees in a tropical planted forest. Soil Biol. Biochem. 2015, 91, 99–108. [Google Scholar] [CrossRef] [Green Version]
- Iannetta, P.P.M.; Young, M.; Bachinger, J.; Bergkvist, G.; Doltra, J.; Lopez-Bellido, R.J.; Monti, M.; Pappa, V.A.; Reckling, M.; Topp, C.; et al. A Comparative Nitrogen Balance and Productivity Analysis of Legume and Non-legume Supported Cropping Systems: The Potential Role of Biological Nitrogen Fixation. Front. Plant Sci. 2016, 7, 1700. [Google Scholar] [CrossRef] [Green Version]
- Epron, D.; Nouvellon, Y.; Mareschal, L.; Moreira, R.; Bouillet, J.P. Partitioning of net primary production in Eucalyptus and Acacia stands and in mixed-species plantations: Two case-studies in contrasting tropical environments. For. Ecol. Manag. 2013, 301, 102–111. [Google Scholar] [CrossRef]
- Chalk, P.M.; Peoples, M.B.; McNeill, A.M.; Boddey, R.M.; Unkovich, M.J.; Gardener, M.J.; Silva, C.F.; Chen, D. Methodologies for estimating nitrogen transfer between legumes and companion species in agro-ecosystems: A review of 15N-enriched techniques. Soil Biol. Biochem. 2014, 73, 10–21. [Google Scholar] [CrossRef]
- Peoples, M.B.; Chalk, P.M.; Unkovich, M.J.; Boddey, R.M. Can differences in 15N natural abundance be used to quantify the transfer of nitrogen from legumes to neighbouring non-legume plant species? Soil Biol. Biochem. 2015, 87, 97–109. [Google Scholar] [CrossRef]
- Høgh-Jensen, H. The Nitrogen Transfer Between Plants: An Important but Difficult Flux to Quantify. Plant Soil 2006, 282, 1–5. [Google Scholar] [CrossRef]
- He, X.; Critchley, C.; Bledsoe, N.C. Reciprocal N (15NH4+ or 15NO3−) transfer between non N2-Fixing Eucalyptus maculata and N2-Fixing Casuarina cunninghamiana Linked by the Ectomycorrhizal Fungus Pisolithus sp. New Phytol. 2004, 163, 629–640. [Google Scholar] [CrossRef]
- Berglund, S.L.; Gren, G.I.; Ekblad, A. Carbon and nitrogen transfer in leaf litter mixtures. Soil Biol. Biochem. 2013, 57, 348. [Google Scholar] [CrossRef]
- Lu, J.K.; Kang, L.H.; Sprent, J.I.; Xu, D.P.; He, X.H. Two-way transfer of nitrogen between Dalbergia odorifera and its hemiparasite Santalum album is enhanced when the host is effectively nodulated and fixing nitrogen. Tree Physiol. 2013, 33, 464–474. [Google Scholar] [CrossRef] [Green Version]
- Xiao, Y.; Li, L.; Zhang, F. Effect of root contact on interspecific competition and N transfer between wheat and fababean using direct and indirect 15N techniques. Plant Soil 2004, 262, 45–54. [Google Scholar] [CrossRef]
- Shen, Q.R.; Chu, G.X. Bi-directional nitrogen transfer in an intercropping system of peanut with rice cultivated in aerobic soil. Biol. Fert. Soils 2004, 40, 81–87. [Google Scholar] [CrossRef]
- Oliveira, I.R.; Bordron, B.; Laclau, J.-P.; Paula, R.R.; Ferraz, A.V.F.; Gonçalves, J.L.M.; Maire, G.; Bouillet, J.-P. Nutrient deficiency enhances the rate of short-term belowground transfer of nitrogen from Acacia mangium to Eucalyptus trees in mixed-species plantations. For. Ecol. Manag. 2021, 491, 119192. [Google Scholar] [CrossRef]
- He, X.; Bledsoe, C.S.; Zasoski, R.J.; Southworth, D.; Horwath, W.R. Rapid nitrogen transfer from ectomycorrhizal pines to adjacent ectomycorrhizal and arbuscular mycorrhizal plants in a California oak woodland. New Phytol. 2006, 170, 143–151. [Google Scholar] [CrossRef]
- He, X.; Xu, M.; Qiu, G.Y.; Zhou, J. Use of 15N stable isotope to quantify N transfer between mycorrhizal plants. J. Plant Ecol. 2009, 2, 107–118. [Google Scholar] [CrossRef] [Green Version]
- Gasser, M.; Hammelehle, A.; Oberson, A.; Frossard, E.; Mayer, J. Quantitative evidence of overestimated rhizodeposition using 15N leaf-labelling. Soil Biol. Biochem. 2015, 85, 10–20. [Google Scholar] [CrossRef]
- Tomm, G.O.; Kessel, C.V.; Slinkard, A.E. Bi-directional transfer of nitrogen between alfalfa and bromegrass: Short and long term evidence. Plant Soil 1994, 164, 77–86. [Google Scholar] [CrossRef]
- He, X.; Critchley, C.; Ng, H.; Bledsoe, C. Nodulated N2-fixing Casuarina cunninghamiana is the sink for net N transfer from non-N2-fixing Eucalyptus maculata via an ectomycorrhizal fungus Pisolithus sp. using 15NH4+ or 15NO3− supplied as ammonium nitrate. New Phytol. 2005, 167, 897–912. [Google Scholar] [CrossRef]
- Schimel, J.P.; Hättenschwiler, S. Nitrogen transfer between decomposing leaves of different N status. Soil Biol. Biochem. 2007, 39, 1428–1436. [Google Scholar] [CrossRef]
- Yao, X.Y.; Li, Y.F.; Liao, L.N.; Sun, G.; Wang, H.X.; Ye, S.M. Enhancement of nutrient absorption and interspecific nitrogen transfer in a Eucalyptus urophylla × eucalyptus grandis and Dalbergia odorifera mixed plantation. For. Ecol. Manag. 2019, 449, 117465. [Google Scholar] [CrossRef]
- Paula, R.R.; Bouillet, J.P.; Goncalves, J.L.D.M.; Trivelin, P.C.; Balieiro, F.D.C.; Nouvellon, Y.; Oliveira, J.D.C.; Júnior, J.C.D.D.; Bordron, B.; Laclau, J.P. Nitrogen fixation rate of Acacia mangium Wild at mid rotation in Brazil is higher in mixed plantations with Eucalyptus grandis Hill ex Maiden than in monocultures. Ann. For. Sci. 2018, 75, 14. [Google Scholar] [CrossRef] [Green Version]
- Zhao, B.C.; Xu, J.D.; Chen, B.Y.; Cao, X.F.; Yuan, T.Q.; Wang, S.F. Selective precipitation and characterization of lignin-carbohydrate complexes (LCCs) from Eucalyptus. Planta 2018, 247, 1077–1087. [Google Scholar] [CrossRef]
- Piotto, D. A meta-analysis comparing tree growth in monocultures and mixed plantations. For. Ecol. Manag. 2008, 255, 781–786. [Google Scholar] [CrossRef]
- Resh, S.C.; Binkley, D.; Parrotta, J.A. Greater soil carbon sequestration under nitrogen-fixing trees compared with Eucalyptus species. Ecosystems 2002, 5, 217–231. [Google Scholar] [CrossRef]
- Binkley, D.; Senock, R.; Bird, S.; Cole, T.G. Twenty years of stand development in pure and mixed stands of Eucalyptus saligna and nitrogen-fixing Facaltaria moluccana. For. Ecol. Manag. 2003, 182, 93–102. [Google Scholar] [CrossRef]
- Bini, D.; Santos, C.A.D.; Bouillet, J.P.; Goncalves, J.L.M.; Cardoso, E.J.B.N. Eucalyptus grandis and Acacia mangium in monoculture and intercropped plantations: Evolution of soil and litter microbial and chemical attributes during early stages of plant development. Appl. Soil Ecol. 2013, 63, 57–66. [Google Scholar] [CrossRef]
- Forrester, D.I.; Bauhus, J.; Cowie, A.L. On the success and failure of mixed-species tree plantations: Lessons learned from a model system of Eucalyptus globulus and Acacia mearnsii. For. Ecol. Manag. 2005, 209, 147–155. [Google Scholar] [CrossRef]
- Laclau, J.-P.; Bouillet, J.-P.; Gonçalves, J.L.M.; Silva, E.; Jourdan, C.; Cunha, M.; Moreira, M.; Saint-André, L.; Maquère, V.; Nouvellon, Y.; et al. Mixed-species plantations of Acacia mangium and Eucalyptus grandis in Brazil 2: Nitrogen accumulation in the stands and N2 biological fixation. For. Ecol. Manag. 2008, 255, 3918–4393. [Google Scholar] [CrossRef]
- Jourdan, C.; Silva, E.; Goncalves, J.L.; Ranger, J.; Moreira, M.R.; Laclau, J.P. Fine root production and turnover in Brazilian Eucalyptus plantations under contrasting nitrogen fertilization regimes. For. Ecol. Manag. 2008, 256, 396–404. [Google Scholar] [CrossRef]
- Voigtlaender, M.; Laclau, J.P.; Gonçalves, J.L.M.; Piccolo, M.D.C.; Moreira, M.Z.; Nouvellon, Y.; Ranger, J.; Bouillet, J.P. Introducing Acacia mangium trees in Eucalyptus grandis plantations: Consequences for soil organic matter stocks and nitrogen mineralization. Plant Soil 2012, 352, 99–111. [Google Scholar] [CrossRef]
- Arnesen, A. Effect of Fluoride Pollution on pH and Solubility of Al, Fe, Ca, Mg, K and Organic Matter in Soil from Årdal (Western Norway). Water Air Soil Poll. 1998, 103, 375–388. [Google Scholar] [CrossRef]
- Meng, L.; Zhang, A.; Wang, F.; Han, X.; Wang, D.; Li, S. Arbuscular mycorrhizal fungi and rhizobium facilitate nitrogen uptake and transfer in soybean/maize intercropping system. Front. Plant Sci. 2015, 6, 339. [Google Scholar] [CrossRef] [PubMed] [Green Version]
- McNeill, A.M.; Zhu, C.; Fillery, I.R.P. Use of in situ 15N-labelling to estimate the total below-ground nitrogen of pasture legumes in intact soil-plant systems. Aust. J. Agric. Res. 1997, 48, 295–304. [Google Scholar] [CrossRef]
- Huang, X.; Liu, S.; You, Y.; Wen, Y.G.; Wang, H.; Wang, J.X. Microbial community and associated enzymes activity influence soil carbon chemical composition in Eucalyptus urophylla plantation with mixing N2-fixing species in subtropical China. Plant Soil 2017, 414, 199–212. [Google Scholar] [CrossRef]
- Bremner, J.M.; Mulvaney, C. Nitrogen-total. In Methods of Soil Analysis; Spark, D.L., Ed.; Soil Science of America, Inc.; American Society of Agronomy: Madison, WI, USA, 1996; pp. 1085–1122. [Google Scholar]
- Chalk, P.M.; Smith, C.J. Estimating nitrogen transfer by foliar 15N-labelling in legume—Non-legume associations. Biol. Fert. Soils 1997, 24, 239–242. [Google Scholar] [CrossRef]
- Fernandez, M.; Malagoli, P.; Vernay, A.; Améglio, T.; Balandier, P. Below-ground nitrogen transfer from oak seedlings facilitates Molinia growth: 15N pulse-chase labelling. Plant Soil 2020, 449, 343–356. [Google Scholar] [CrossRef]
- You, Y.; Huang, X.; Zhu, H.; Liu, S.; Liang, H.; Wen, Y.; Wang, H.; Cai, D.; Ye, D. Positive interactions between Pinus massoniana and Castanopsis hystrix species in the uneven-aged mixed plantations can produce more ecosystem carbon in subtropical China. For. Ecol. Manag. 2018, 410, 193–200. [Google Scholar] [CrossRef]
- Magalhães, T.M.; Seifert, T. Tree component biomass expansion factors and root-to-shoot ratio of Lebombo ironwood: Measurement uncertainty. Carbon Bal. Manag. 2015, 10, 9. [Google Scholar] [CrossRef] [Green Version]
- He, Y.; Cornelissen, J.; Wang, P.; Dong, M.; Ou, J. Nitrogen transfer from one plant to another depends on plant biomass production between conspecific and heterospecific species via a common arbuscular mycorrhizal network. Environ. Sci. Pollut. Res. 2019, 26, 8828–8837. [Google Scholar] [CrossRef]
- Montesinos-Navarro, A.; Segarra-Moragues, J.G.; Valiente-Banuet, A.; Verdú, M. Plant facilitation occurs between species differing in their associated arbuscular mycorrhizal fungi. New Phytol. 2012, 196, 835–844. [Google Scholar] [CrossRef] [Green Version]
- Ducousso, M.; Duponnois, R.; Thoen, D.; Prin, Y. Diversity of ectomycorrhizal fungi associated with Eucalyptus in Africa and Madagascar. J. For. Res. 2012, 2012, 450715. [Google Scholar] [CrossRef] [Green Version]
- Jalonen, R.; Nygen, P.; Sierra, J. Transfer of nitrogen from a tropical legume tree to an associated fodder grass via root exudation and common mycelial networkspce. Plant Cell Environ. 2009, 32, 1366–1372. [Google Scholar] [CrossRef]
- Eiter, H.M. Effect of nitrogen nutrition upon sugar content and dry weight of juvenile lodgepole pine and white spruce. Can. J. For. Res. 1972, 2, 434–440. [Google Scholar] [CrossRef]
- Bouillet, J.P.; Laclau, J.P.; José Leonardo de Moraes, G.; Voigtlaender, M.; Nouvellon, Y. Eucalyptus and Acacia tree growth over entire rotation in single- and mixed-species plantations across five sites in Brazil and Congo. For. Ecol. Manag. 2013, 301, 89–101. [Google Scholar] [CrossRef]
- Yao, X.Y.; Liao, L.N.; Huang, Y.Z.; Fan, G.; Yang, M.; Ye, S.M. The physiological and molecular mechanisms of N transfer in Eucalyptus and Dalbergia odorifera intercropping systems using root proteomics. BMC Plant Biol. 2021, 21, 201. [Google Scholar] [CrossRef] [PubMed]
- May, B.M.; Attiwill, P.M. Nitrogen-fixation by Acacia dealbata and changes in soil properties 5 years after mechanical disturbance or slash-burning following timber harvest. For. Ecol. Manag. 2003, 181, 339–355. [Google Scholar] [CrossRef]
- Tchichelle, S.V.; Mareschal, L.; Koutika, L.S.; Epron, D. Biomass production, nitrogen accumulation and symbiotic nitrogen fixation in a mixed-species plantation of eucalypt and acacia on a nutrient-poor tropical soil. For. Ecol. Manag. 2017, 403, 103–111. [Google Scholar] [CrossRef]
- Hong, J.; Ma, X.; Zhang, X.; Wang, X. Nitrogen uptake pattern of herbaceous plants: Coping strategies in altered neighbor species. Biol. Fertil. Soils 2017, 53, 729–735. [Google Scholar] [CrossRef]
- Madeira, A.C.; Madeira, M.; Fabião, A.; Marques, P.; Carneiro, M. Impact of harvest residues, fertilisers and N-fixing plants on growth and nutritional status of young Eucalyptus globulus plantations, under Mediterranean conditions. Eur. J. For. Res. 2010, 129, 591–601. [Google Scholar] [CrossRef]
- Schmid, C.; Bauer, S.; Bartelheimer, M. Should I stay or should I go? Roots segregate in response to competition intensity. Plant Soil 2015, 391, 283–291. [Google Scholar] [CrossRef]
- Guo, Q.; Yan, L.; Korpelainen, H.; Niinemets, L.; Li, C. Plant-plant interactions and N fertilization shape soil bacterial and fungal communities. Soil Biol. Biochem. 2019, 128, 127–138. [Google Scholar] [CrossRef]
- Rasmann, S.; Turlings, T.C. Root signals that mediate mutualistic interactions in the rhizosphere. Curr. Opin. Plant Biol. 2016, 32, 62–68. [Google Scholar] [CrossRef] [PubMed] [Green Version]
- Xia, Z.C.; Yu, L.; He, Y.; Korpelainen, H.; Li, C. Broadleaf trees mediate chemically the growth of Chinese fir through root exudates. Biol. Fert. Soils 2019, 55, 737–749. [Google Scholar] [CrossRef] [Green Version]
- Luís, A.; Duarte, A.; Gominho, J.; Domingues, F.; Duarte, A.P. Chemical composition, antioxidant, antibacterial and anti-quorum sensing activities of Eucalyptus globulus and Eucalyptus radiate essential oils. Ind. Crop Prod. 2016, 79, 274–282. [Google Scholar] [CrossRef]
- Liu, S.; Qin, F.; Yu, S. Eucalyptus urophylla root-associated fungi can counteract the negative influence of phenolic acid allelochemicals. Appl. Soil Ecol. 2018, 127, 1–7. [Google Scholar] [CrossRef]
- Godoi, N.M.I.; Araújo, S.N.D.S.; Buzetti, S.; Gazola, R.D.N.; Celestrino, T.D.S.; Silva, A.C.D.; Nogueira, T.A.R.; Teixeira Filho, M.C.M. Soil Chemical Attributes, Biometric Characteristics, and Concentrations of N and P in Leaves and Litter Affected by Fertilization and the Number of Sprouts per the Eucalyptus L’Hér. Strain in the Brazilian Cerrado. Forests 2018, 9, 290. [Google Scholar] [CrossRef] [Green Version]
- Lummer, D.; Scheu, S.; Butenschoen, O. Connecting litter quality, microbial community and nitrogen transfer mechanisms in decomposing litter mixtures. Oikos 2012, 121, 1649–1655. [Google Scholar] [CrossRef]
- Shu, W.; Lu, L.; Li, H.; Nong, Y.; He, R.; Chen, H.; Huang, B. Effects of Pinus massoniana plantation stand density on understory vegetation and soil properties. Acta Ecol. Sinca 2021, 41, 4521–4530. [Google Scholar] [CrossRef]
Publisher’s Note: MDPI stays neutral with regard to jurisdictional claims in published maps and institutional affiliations. |
© 2021 by the authors. Licensee MDPI, Basel, Switzerland. This article is an open access article distributed under the terms and conditions of the Creative Commons Attribution (CC BY) license (https://creativecommons.org/licenses/by/4.0/).