Article

Complete Chloroplast Genome Sequence of Fortunella venosa (Champ. ex Benth.) C.C.Huang (Rutaceae): Comparative Analysis, Phylogenetic Relationships, and Robust Support for Its Status as an Independent Species

1
College of Life Sciences, Hunan Normal University, Changsha 410081, China
2
Key Laboratory of Plant Germplasm Enhancement and Specialty Agriculture, Wuhan Botanical Garden, Chinese Academy of Sciences, Wuhan 430074, China
3
University of Chinese Academy of Sciences, Beijing 100049, China
*
Authors to whom correspondence should be addressed.
Forests 2021, 12(8), 996; https://doi.org/10.3390/f12080996
Submission received: 30 June 2021 / Revised: 23 July 2021 / Accepted: 24 July 2021 / Published: 27 July 2021
(This article belongs to the Section Genetics and Molecular Biology)

Abstract

:
Fortunella venosa (Rutaceae) is an endangered species endemic to China and its taxonomic status has been controversial. The genus Fortunella contains a variety of important economic plants with high value in food, medicine, and ornamental. However, the placement of Genus Fortunella into Genus Citrus has led to controversy on its taxonomy and Systematics. In this present research, the Chloroplast genome of F. venosa was sequenced using the second-generation sequencing, and its structure and phylogenetic relationship analyzed. The results showed that the Chloroplast genome size of F. venosa was 160,265 bp, with a typical angiosperm four-part ring structure containing a large single copy region (LSC) (87,597 bp), a small single copy region (SSC) (18,732 bp), and a pair of inverted repeat regions (IRa\IRb) (26,968 bp each). There are 134 predicted genes in Chloroplast genome, including 89 protein-coding genes, 8 rRNAs, and 37 tRNAs. The GC-content of the whole Chloroplast genome was 43%, with the IR regions having a higher GC content than the LSC and the SSC regions. There were no rearrangements present in the Chloroplast genome; however, the IR regions showed obvious contraction and expansion. A total of 108 simple sequence repeats (SSRs) were present in the entire chloroplast genome and the nucleotide polymorphism was high in LSC and SSC. In addition, there is a preference for codon usage with the non-coding regions being more conserved than the coding regions. Phylogenetic analysis showed that species of Fortunella are nested in the genus of Citrus and the independent species status of F. venosa is supported robustly, which is significantly different from F. japonica. These findings will help in the development of DNA barcodes that can be useful in the study of the systematics and evolution of the genus Fortunella and the family Rutaceae.

1. Introduction

The origin of the Chloroplast (cp) can be traced back to more than one billion years ago as a result of Cyanobacterium endosymbiosis [1,2,3]. It is an organelle commonly found in the cytoplasmic matrix that is useful in the process of photosynthesis hence sustaining life on Earth [4,5]. The Chloroplast (cp) is a semi-autonomous organelle having its own genetic material, but some of its proteins are encoded in the nuclear genome [6]. The Chloroplast (cp) genome of angiosperms is mostly double-stranded circular structure containing four parts: a large single copy (LSC) region, a small single copy (SSC) region and a pair of inverted repeats (IRa/IRb) regions with the same sequence in opposite directions [7,8]. The first complete chloroplast genome to be sequenced was that of Nicotiana tabacum [9]. In higher plants, the plastome size is relatively smaller in size ranging between 120 and 180 kb in most terrestrial plants, and having highly conserved sequences that encodes approximately 110–130 genes [6,9,10]. These genes are involved in various functions including replication, translation and photosynthesis. In angiosperms, the plastome is maternally inherited. However, about 20% of the sequences may be inherited from patrilineage or from both parents [11,12]. Compared to nuclear genome, the plastome is relatively conserved and stable, with no recombination and low nucleotide substitutions. Therefore, Plastomes are very informative and valuable sources of genetic markers for molecular systematics and phylogenetic analysis [5,13,14]. Some genes have been used for DNA barcoding studies in plants, e.g rbcL, matK, and ycf1 [15,16]. In recent years, with the rapid development of sequencing technology and its affordability, more plastomes have been sequenced successfully [17,18,19,20,21]. Hence, chloroplast genomes have become a new and valuable tool for phylogenomic studies.
Fortunella venosa (Champ. ex Benth.) C.C.Huang is a perennial evergreen shrub in the flowering plant family Rutaceae. This species is endemic to China with its distribution area slightly overlapping to north with the tetraploid species F. hindsii (Champ. ex Hook.) Swingle. Its distribution range is relatively narrow occurring in Nanping (Fujian), Yongfeng (Jiangxi), and recently found in Ningyuan, Chaling, Guidong, and other counties in Hunan province [22,23]. Due to climate change and anthropogenic activities, the wild population of F. venosa is decreasing rapidly [24]. It was listed as an endangered species in the China Species Red List (vol.1 Red list) [25].
The genus Fortunella was described by Swingle in 1915, and currently there are six described species [26,27]. Flora Reipublicae Popularis Sinicae recorded five species and a few hybrids from China, F. venosa is one of them [22]. In the Flora of China (English edition), Fortunella was incorporated into the genus Citrus [28] and F. hindsii (Champ. ex Benth.) Swingle, F. japonica (Thunb.) Swingle, F. margarita (Lour.) Swingle, F. venosa (Champ. ex Hook.) C.C.Huang were treated as synonyms of C. japonica Thunb. Hence, the taxonomy and phylogeny of the genus is complex and controversial. In addition, due to the great number of varieties and easy hybridization of Citrus plants, the taxonomy of the genus and its phylogenetic relationships with Citrus L. has always been a concern for the taxonomists [26,29,30,31].
Members of Fortunella have high value in food, medicine and ornamental [24]. The introduction and cultivation of Fortunella species in different regions and the various types of highly hybrid germplasm resources has made it difficult to identify F. venosa [32]. A complete chloroplast genome sequencing will be helpful to solve the uncertainty of the taxonomic status among species. Currently, only the complete Chloroplast genome of F. japonica (GenBank accession no.: MN495932) has been sequenced and reported among the species in the genus Fortunella. Hence, in this study the initial complete Chloroplast genome of F. venosa was sequenced and reported, and a method for assembling, splicing and analysis of the complete Chloroplast genome of F. venosa was proposed. Furthermore, the Chloroplast genome of F. venosa was compared with other nine Rutaceae species from the NCBI database. Codon usage, repeat sequences, selection pressure, and phylogenetic relationships were analyzed. Sequencing of F. venosa plastome not only provides a theoretical basis for the phylogenetic relationship and its related taxonomic issues, but also provides an important foundation for the conservation and sustainable utilization of F. venosa resources.

2. Materials and Methods

2.1. Material Acquisition and Chloroplast Genome Sequencing

The plant materials were collected from Zhuzhou prefecture, Hunan province (Co-ordinates: 26°47′00.69″ N, 113°29′38.59″ E), China, on 9 April 2019. The fresh young leaves were collected and immediately placed in sealed bags and dried with silica gel. The voucher specimen (K.M. Liu, T. Wang 772949) was deposited in the Herbarium of Hunan Normal University (HNNU). Genomic DNA was extracted from 0.5 g of dried plant leaves with the conventional cetyltrimethylammonium bromide (CTAB) method [33], and sequenced using the second-generation sequencing platform illumina of the Novogene Company in Beijing, China.

2.2. Assembly of the Genome

The original quality of the sequences was evaluated using the FastQCv0.11.7 software [34]. Assembly was done using GetOrganellev1.6.22d [35] with default parameters. The GetOrganelle software is an advanced tool that provides a large number of scripts and libraries of Whole Genome Sequencing (WGS) read data, manipulating and disentangling assembly graphs, and generating reliable organelle genomes, accompanied by labeled assembly graphs for user-friendly manual completion and correction. Using the GetOrganelle software, we first filtered the plastid reads, then performed a de novo assembly, purified the assembly, and finally generated the complete Chloroplast genome [36,37,38]. Redundant sequences were then removed for subsequent genomic analysis. The final assembly map was visualized using Bandage [39] to identify automatically generated plastid genomes.

2.3. Annotation of the Genome

The assembled complete Chloroplast genome was annotated using the Plastid Genome Annotator (PGA) [40] and Strawberry Perl, using Amborella trichopoda (GenBank accession number: GCA_U000471905.1) as the initial reference. The published genomes of Citrus maxima (MN782007) and C. limon (MT880608) of the family Rutaceae were used as control for further annotation confirmation. Annotation tool in Geneious was used to manually correct and supplement problematic annotations. The whole Chloroplast genome circular map was drawn by using Organelle Genome Draw (OGDRAW) online software [41,42].

2.4. Repeat Sequence and Codon Usage

Dispersed repeats (forward, reverse, complementary, palindromic repeat sequences) in the complete Chloroplast genome sequence was analyzed using the REPuter online program (https://bibiserv.cebitec.uni-bielefeld.de/reputer, accessed on 7 April 2021). Parameters were set to minimum repeat length of 30 bp, and the similarity between repeats was >90% [43]. Tandem repeats were detected using the Tandem Repeats Finder online tool (https://tandem.bu.edu/trf/trf.html, accessed on 7 April 2021) with parameters set to system default values [44]. Presently, there are nine complete Chloroplast genome sequences of the family Rutaceae available in the GenBank database including Fortunella japonica (MN495932), Citrus aurantifolia (KJ865401), C. aurantium (MT702983), C. hongheensis (MT880607), C. cavaleriei (MT880606), C. limon (MT880608), C. maxima (MN782007), C. medica (MT106673), and C. sinensis (DQ864733). Microsatellite identification tool (MISA) [45], was used to detect the simple sequence repeats (SSRs) in the Chloroplast genome sequences of F. venosa and the 9-individual species mentioned above. The parameters were set as follows: no less than 10 mononucleotides repeat units, no less than 5 dinucleotide repeat units, no less than 4 trinucleotide multiple units, and no more than 3 tetranucleotides, pentanucleotides, and hexanucleotides repeat units [46]. The type, quantity and distribution pattern of SSRs were compared and analyzed. The CDS region was extracted from the plastome sequence using the geneious software, and all the CDS were connected using a web tool sequence operation toolbox (http://www.detaibio.com/sms2/index.html, accessed on 7 April 2021) [47]. The MEGA6 software was used to determine relative synonymous codon usage (RSCU) within the Chloroplast genome [48].

2.5. Comparative Genome Analysis and Sequence Divergence

Using Fortunella venosa as a reference, the divergence within the ten Chloroplast genomes was analyzed using mVISTA tool [49,50]. The species sequences used included F. venosa and 9 other Rutaceae species; F. japonica (MN495932), Citrus aurantifolia (KJ865401), C. aurantium (MT702983), C. hongheensis (MT880607), C. cavaleriei (MT880606), C. limon (MT880608), C. maxima (MN782007), C. medica (MT106673), C. sinensis (DQ864733). To analyze the rearrangements and inversions within the boundary region of F. venosa, an insertion program Mauve in Geneious8 (Biomatcrs Ltd. Auckland, New Zealand) was used. The IRscope (IRscope.shinyapps.io/Chloroplot/) [51] software was used to analyze the expansion and contraction of IR boundary of the 10-representative species, and compared the differences within the IR boundaries. DnaSP v.5.0 [52] software was used to calculate nucleotide polymorphism (Pi), with the parameter set as follows: window length of 600 bp and the distance between each site (step size) was 200 bp. This was used to construct a polymorphic site line chart, and find fragments with high polymorphism among the Chloroplast genomes.

2.6. Adaptive Evolution and Substitution Rate

In order to analyze the rate of evolutionary changes in the Chloroplast genome of Fortunella venosa, the CDS sequence was extracted using geneious with Citrus aurantifolia as reference. The protein-coding sequences of the 10 Rutaceae species were extracted using PhyloSuite [53], MAFFT to automatically remove the stop codon. PhyloSuite was used to construct the maximum likelihood phylogenetic tree. GTR was selected as the best-fit model, and no outgroup was specified.1000 Bootstraps were performed to construct the phylogenetic unrooted tree. The PAML file and Newick file are imported into EasyCodeML for selective pressure analysis. Using the PAML v4.7 package of the EasyCodeML software [54,55], the positive selection pressure, non-synonymous (DN) and synonymous (DS) substitution rates, and their ratio (ω = DN/DS) of 10 Rutaceae species Plastomes were evaluated. The site-specific model in the software (M0 vs. M3, M1a vs. M2a, M7a vs. M8, and M8a vs. M8) were compared. In order to evaluate the adaptive evolution of Chloroplast genes, the computational likelihood ratio test (LRT) and ω were used to analyze the selection pressure of protein-coding genes in 10 plants.

2.7. Phylogeny

To determine the phylogenetic position and relationship of Fortunella venosa, a phylogenetic tree was reconstructed using 28 other species Chloroplast genome sequences downloaded from NCBI database with Melia azedarach Linn. as the outgroup. The outgroup was chosen according to the current APGIV system of classification (http://www.mobot.org/MOBOT/research/APweb/, accessed on 24 July 2021) and the tree of life phylogeny (https://treeoflife.kew.org/tree-of-life, accessed on 24 July 2021). These 28 Chloroplast genome sequences include Fortunella (2 species), Citrus (9 species), Zanthoxylum (11 species), Glycosmis (2 species), Micromelum (1 species), Clausena (1 species), Murraya (1 species), and Melia (1 species), the detailed information summarized in File S1. Using the MAFFT integrated in PhyloSuite [53], the sequences were aligned. ModelFinder was used to find the best-fit model for the phylogenetic tree reconstruction, and for Maximum Likelihood (ML) analysis 1000 repeated bootstrap tests were performed. Based on the construction of the phylogenetic tree of the entire Chloroplast genome, the phylogenetic tree was constructed with protein coding genes (CDS) to prove its accuracy. A CDS tree was constructed using ML, PhyML and BI methods with 76 shared genes within the 28 species. Geneious was used to extract the CDS sequence, and then concatenated using PhyloSuite. The sequences were aligned using MAFFT, and Model Finder was used to find the best-fit model both in the BI and the IQ tree phylogeny. The total length of the CDS alignment data set was 22,688 amino acids. The reconstructed tree was visualized using FigTree version 1.4.4 [56].

3. Results

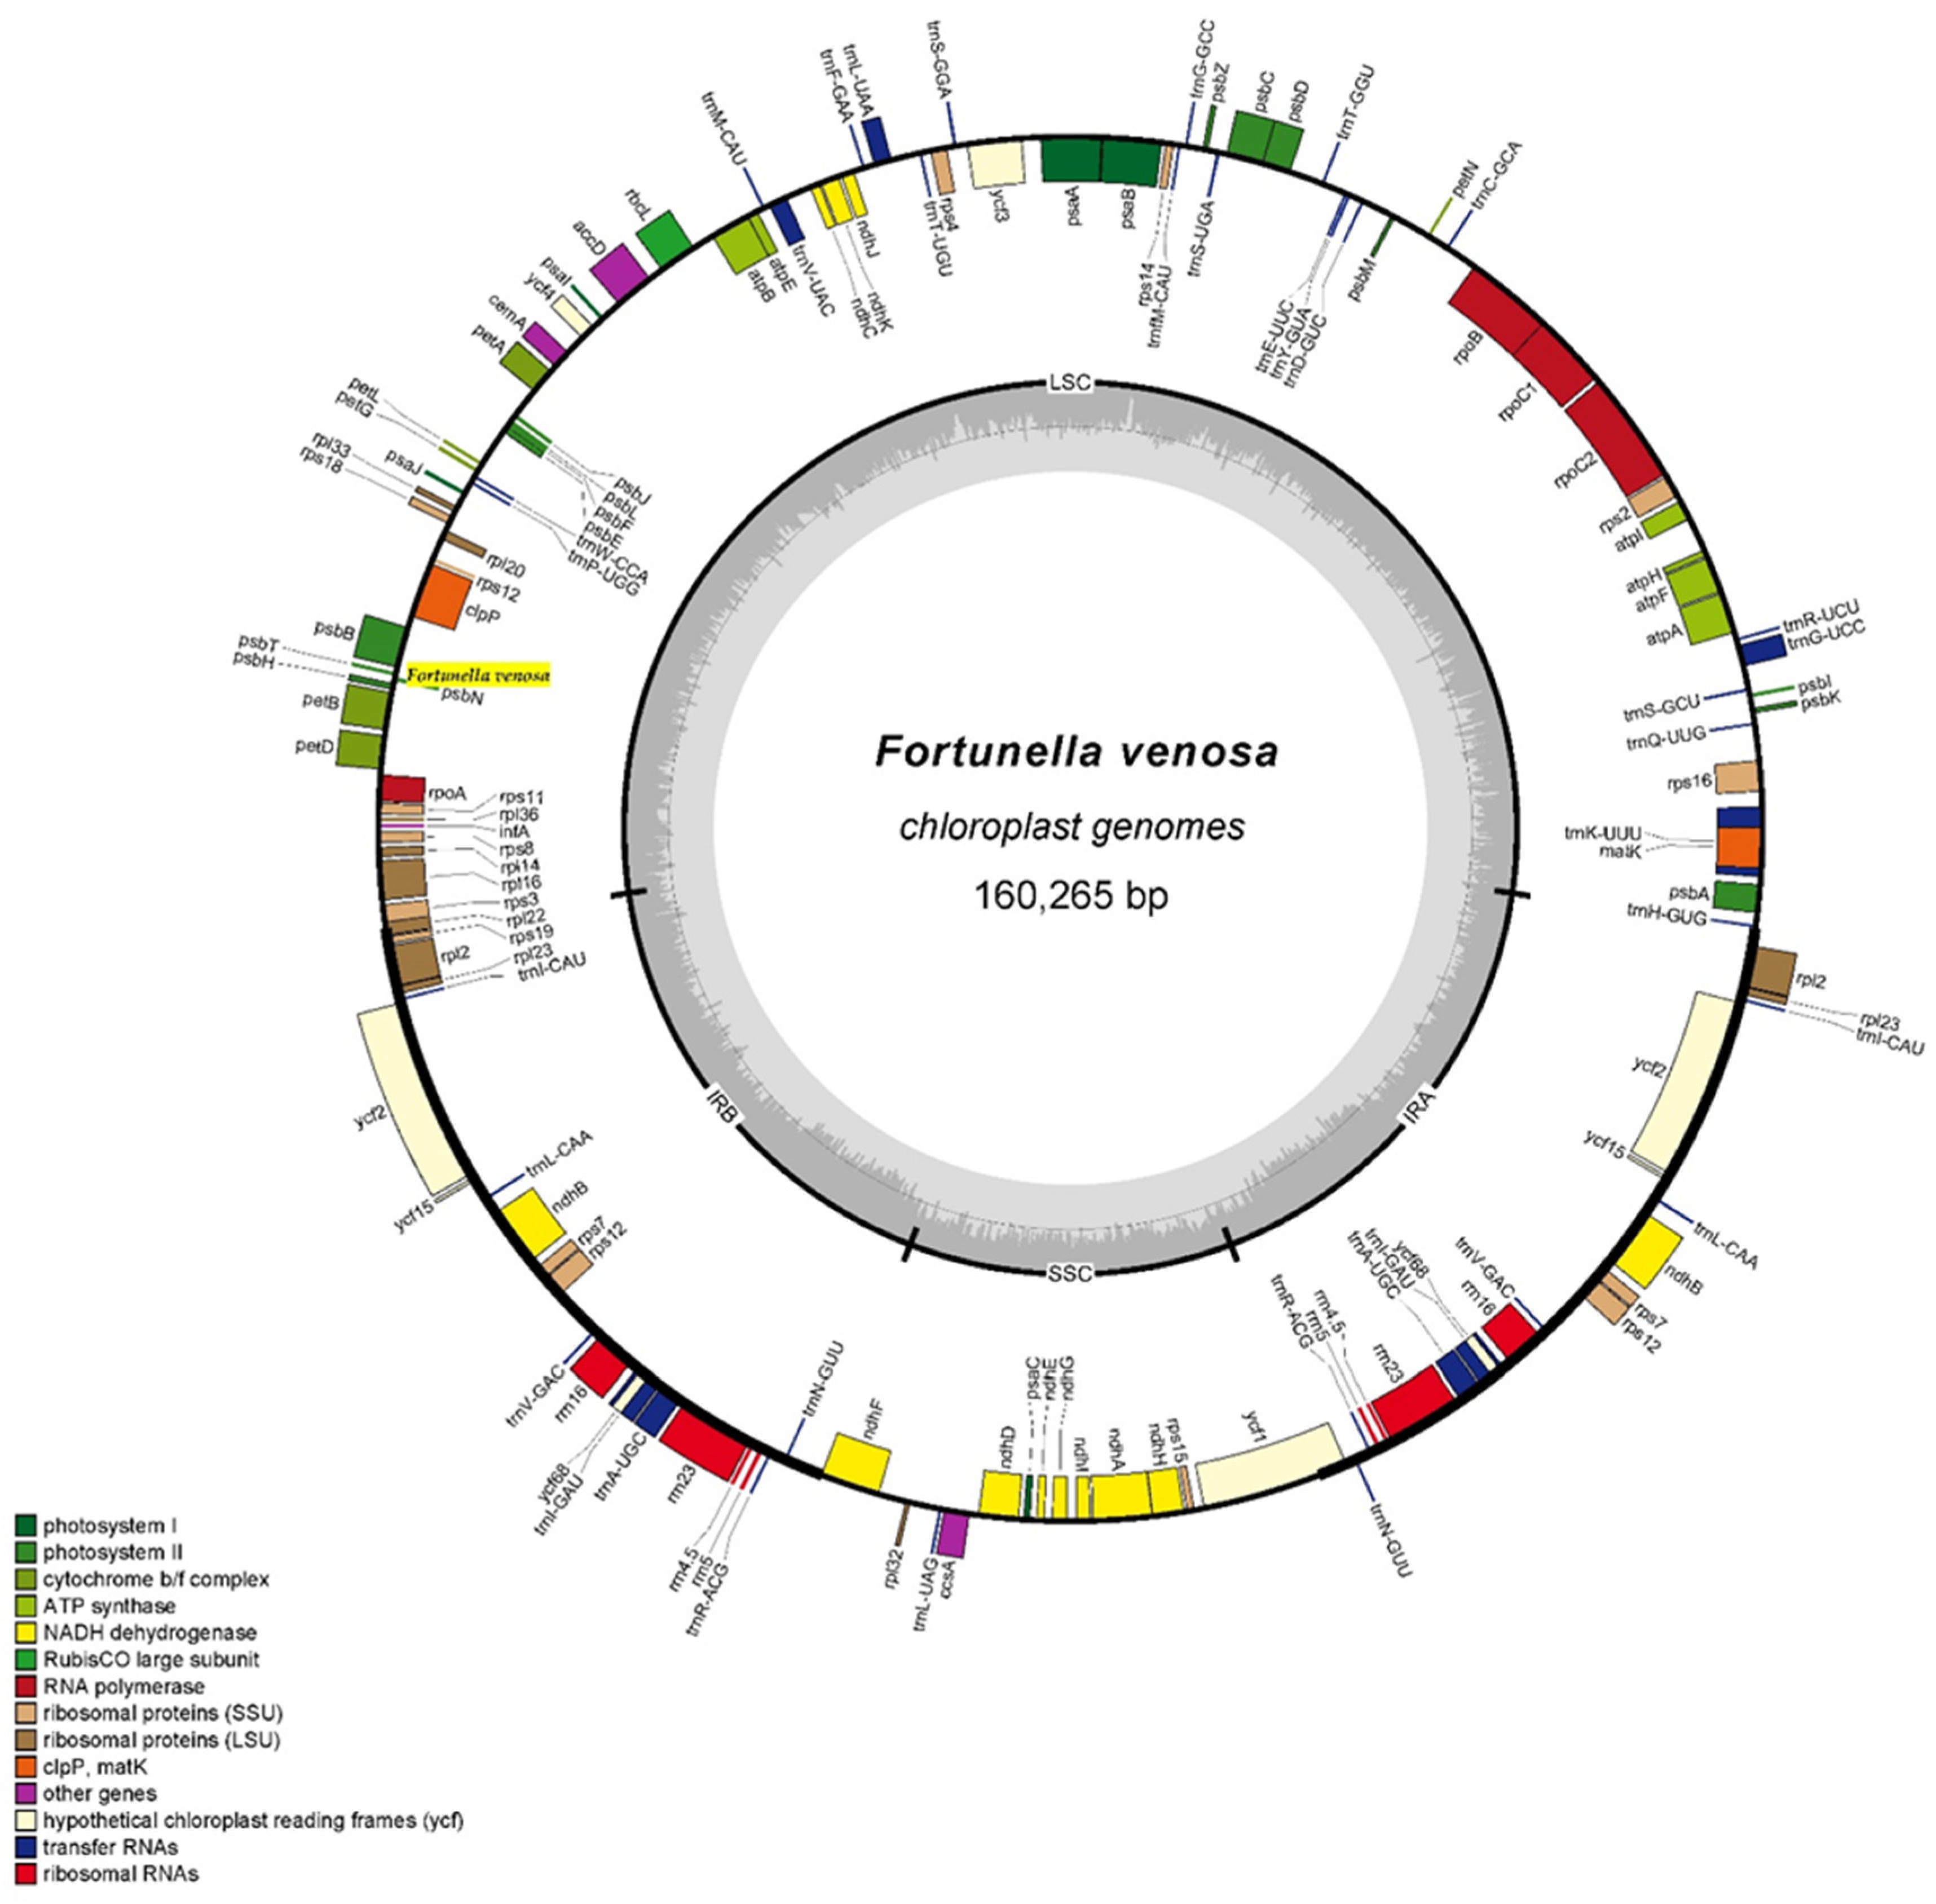
3.1. Analysis of Chloroplast Genome Structure

A genome paired-end sequencing obtained a total of 8,768,734 reads of 150 bp in length were obtained from Chloroplast genome sequencing, of which 3,244,455 bp reads were used for chloroplast genome assembly, accounting for 37% of the total. The base coverage reads used to assemble the Chloroplast genome was 793.65 times. The chloroplast genome of Fortunella venosa (GenBank accession No. MZ457935) has been submitted to the GenBank of the National Center for Biotechnology Information (NCBI). The complete chloroplast genome of Fortunella venosa had a size of 160,265 bp. The plastome of F. venosa is a typical circular four-part structure consisting of a large single copy region (LSC, 87,597 bp), a small single copy region (SSC, 18,732 bp) and two inverted repeat regions (IRa and IRb, 26,968 bp each) (Figure 1 and Table 1). A total of 134 functional genes, including 89 protein-coding genes (CDS), 8 ribosomal RNA (rRNA) genes, and 37 transfer RNA (tRNA) genes, were detected in F. venosa cpDNA (Table 1). The LSC region consists of 62 CDS, and 22 tRNAs, whereas, the SSC region is composed of 12 CDS and 1 tRNA. The IR regions is composed of 18 CDS, 14 tRNA and 8rRNA (Figure 1). The total GC-content of the F. venosa chloroplast genome was 38.4%. The IR region had the highest GC content (43.0%), while the LSC and SSC had 36.7% and 33.2%, respectively. The total length of the protein-coding region, tRNA and rRNA were 79,983 bp, 2792 bp, and 9044 bp, respectively, accounting for 49.9%, 1.7%, and 5.6% of the total length of the chloroplast genome. There were 21 genes duplicated in the IR region with two copies, including 10 protein coding genes (rpl22, rps19, rpl2, rpl23, ycf2, ycf15, nbhB, rps7, rps12, ycf68), seven tRNA genes (trnI-CAU, trnL-CAA, trnV-GAC, trnI-GAU, trnA-UGC, trnR-ACG, and trnN-GUU), and four rRNA genes (rrn16, rrn23, rrn4.5, and rrn5). There were 17 genes with introns, 15 genes had one intron (rps16, trnG-UCC, atpF, rpoC1, trnL-UAA, trnV-UAC, petB, petD, rpl16, trnI-GAU, trnA-UGC, ndhA, trnA-UGC, trnI-GAU, rps12, ndhB, rpl2) while two genes (ycf3, clpP) had two introns. Chloroplasts have maintained an autonomous genome that encodes important proteins required for their photosynthesis and different housekeeping functions. According to the function of genes, they can be divided into four categories, as shown in Table 2. There is a variation in the Chloroplast genomes of different species in terms of length, GC content and even the evolutionary rates. The comparison of Chloroplast genomes of ten species of Rutaceae is shown in Table 1.

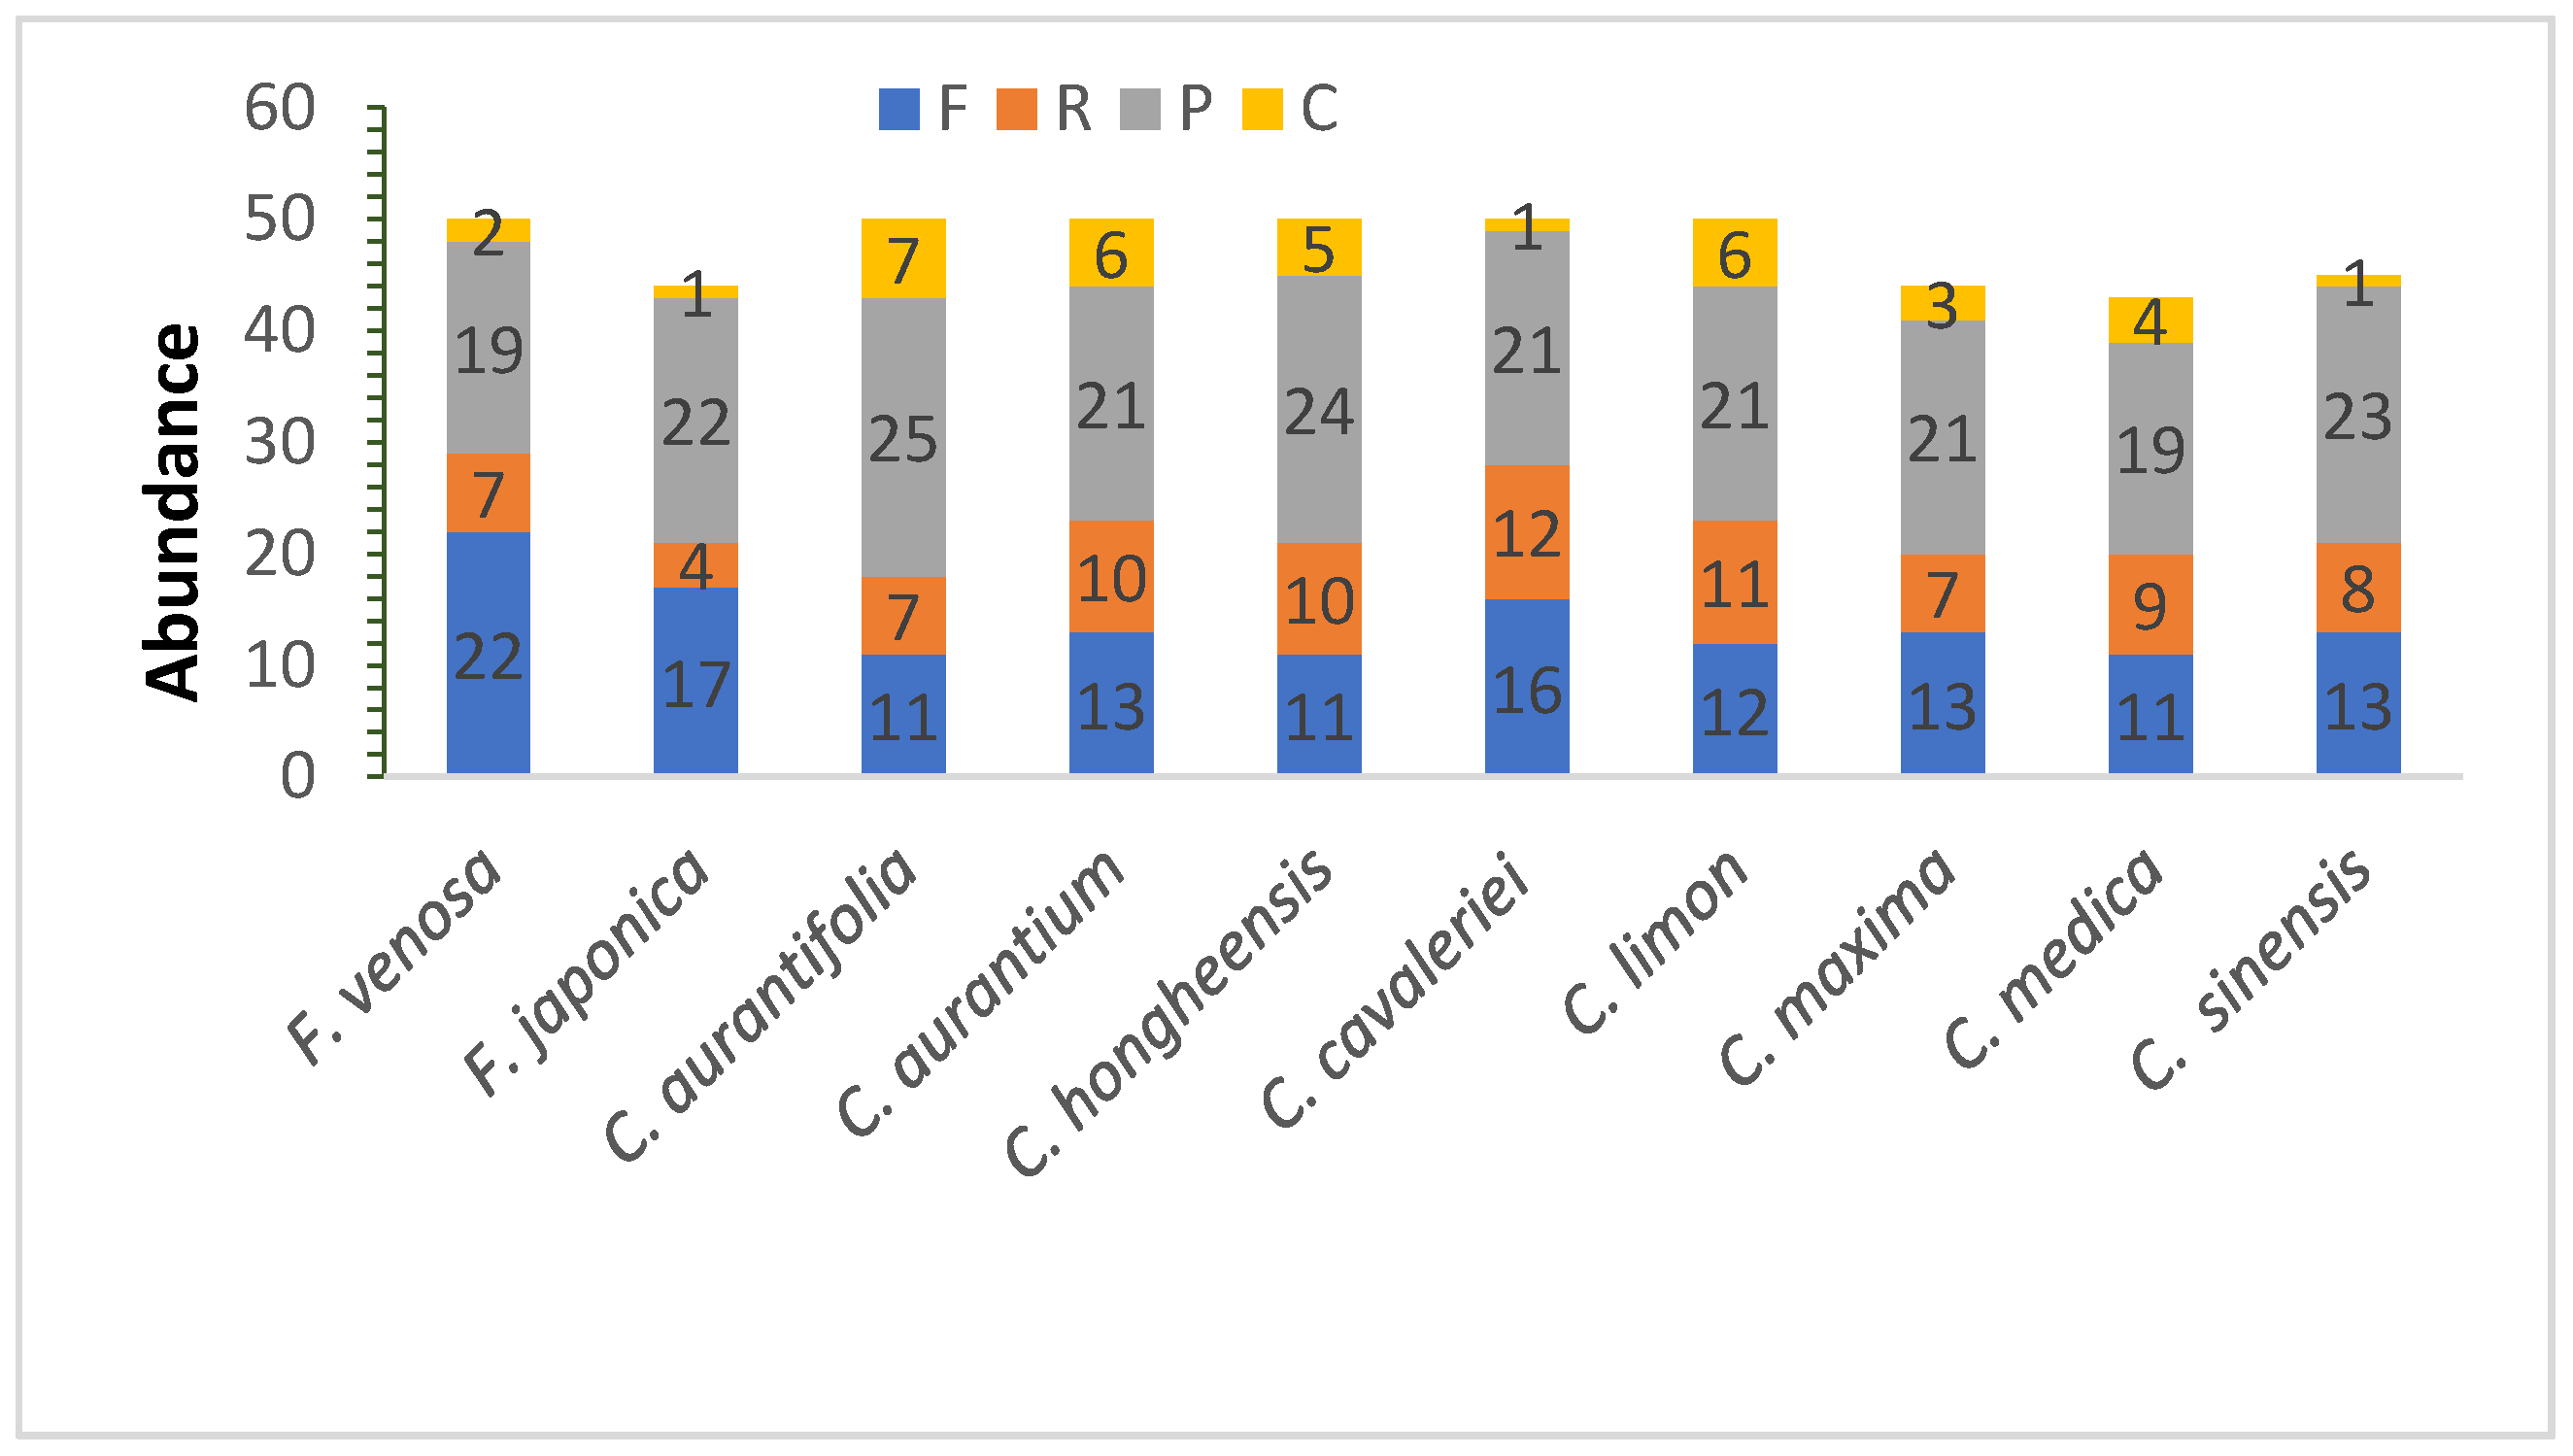
3.2. Repeat Sequence Analysis
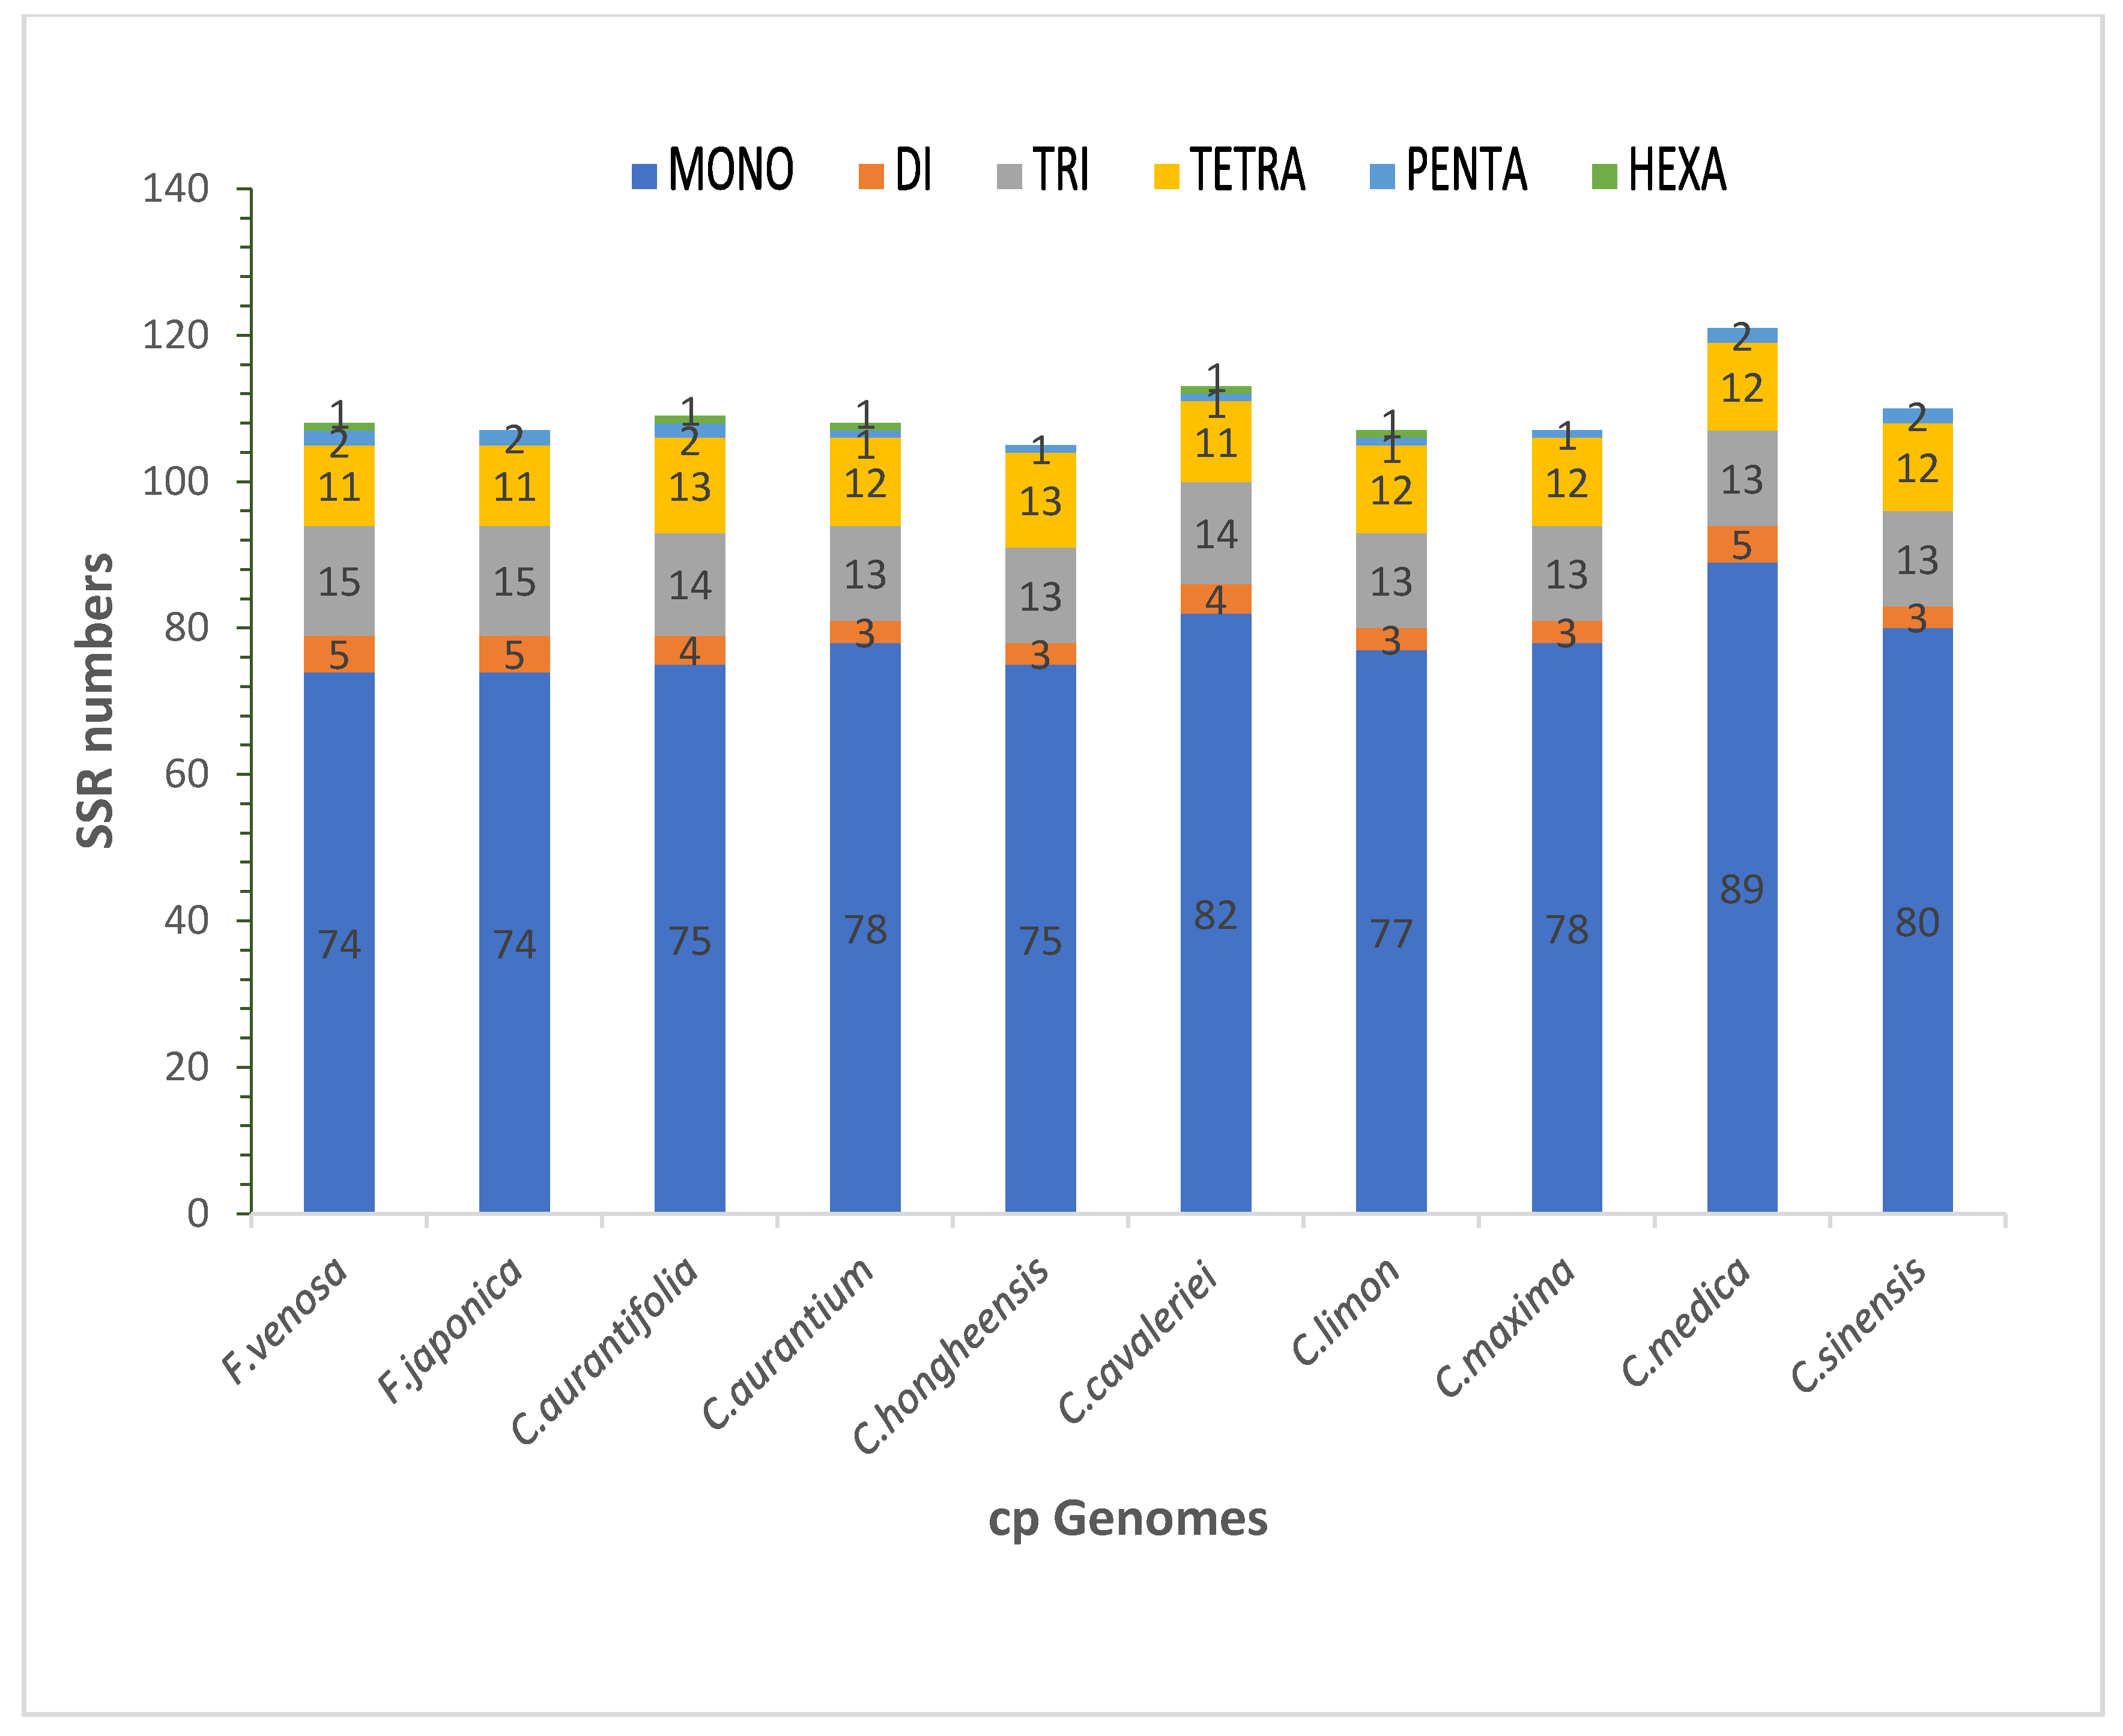
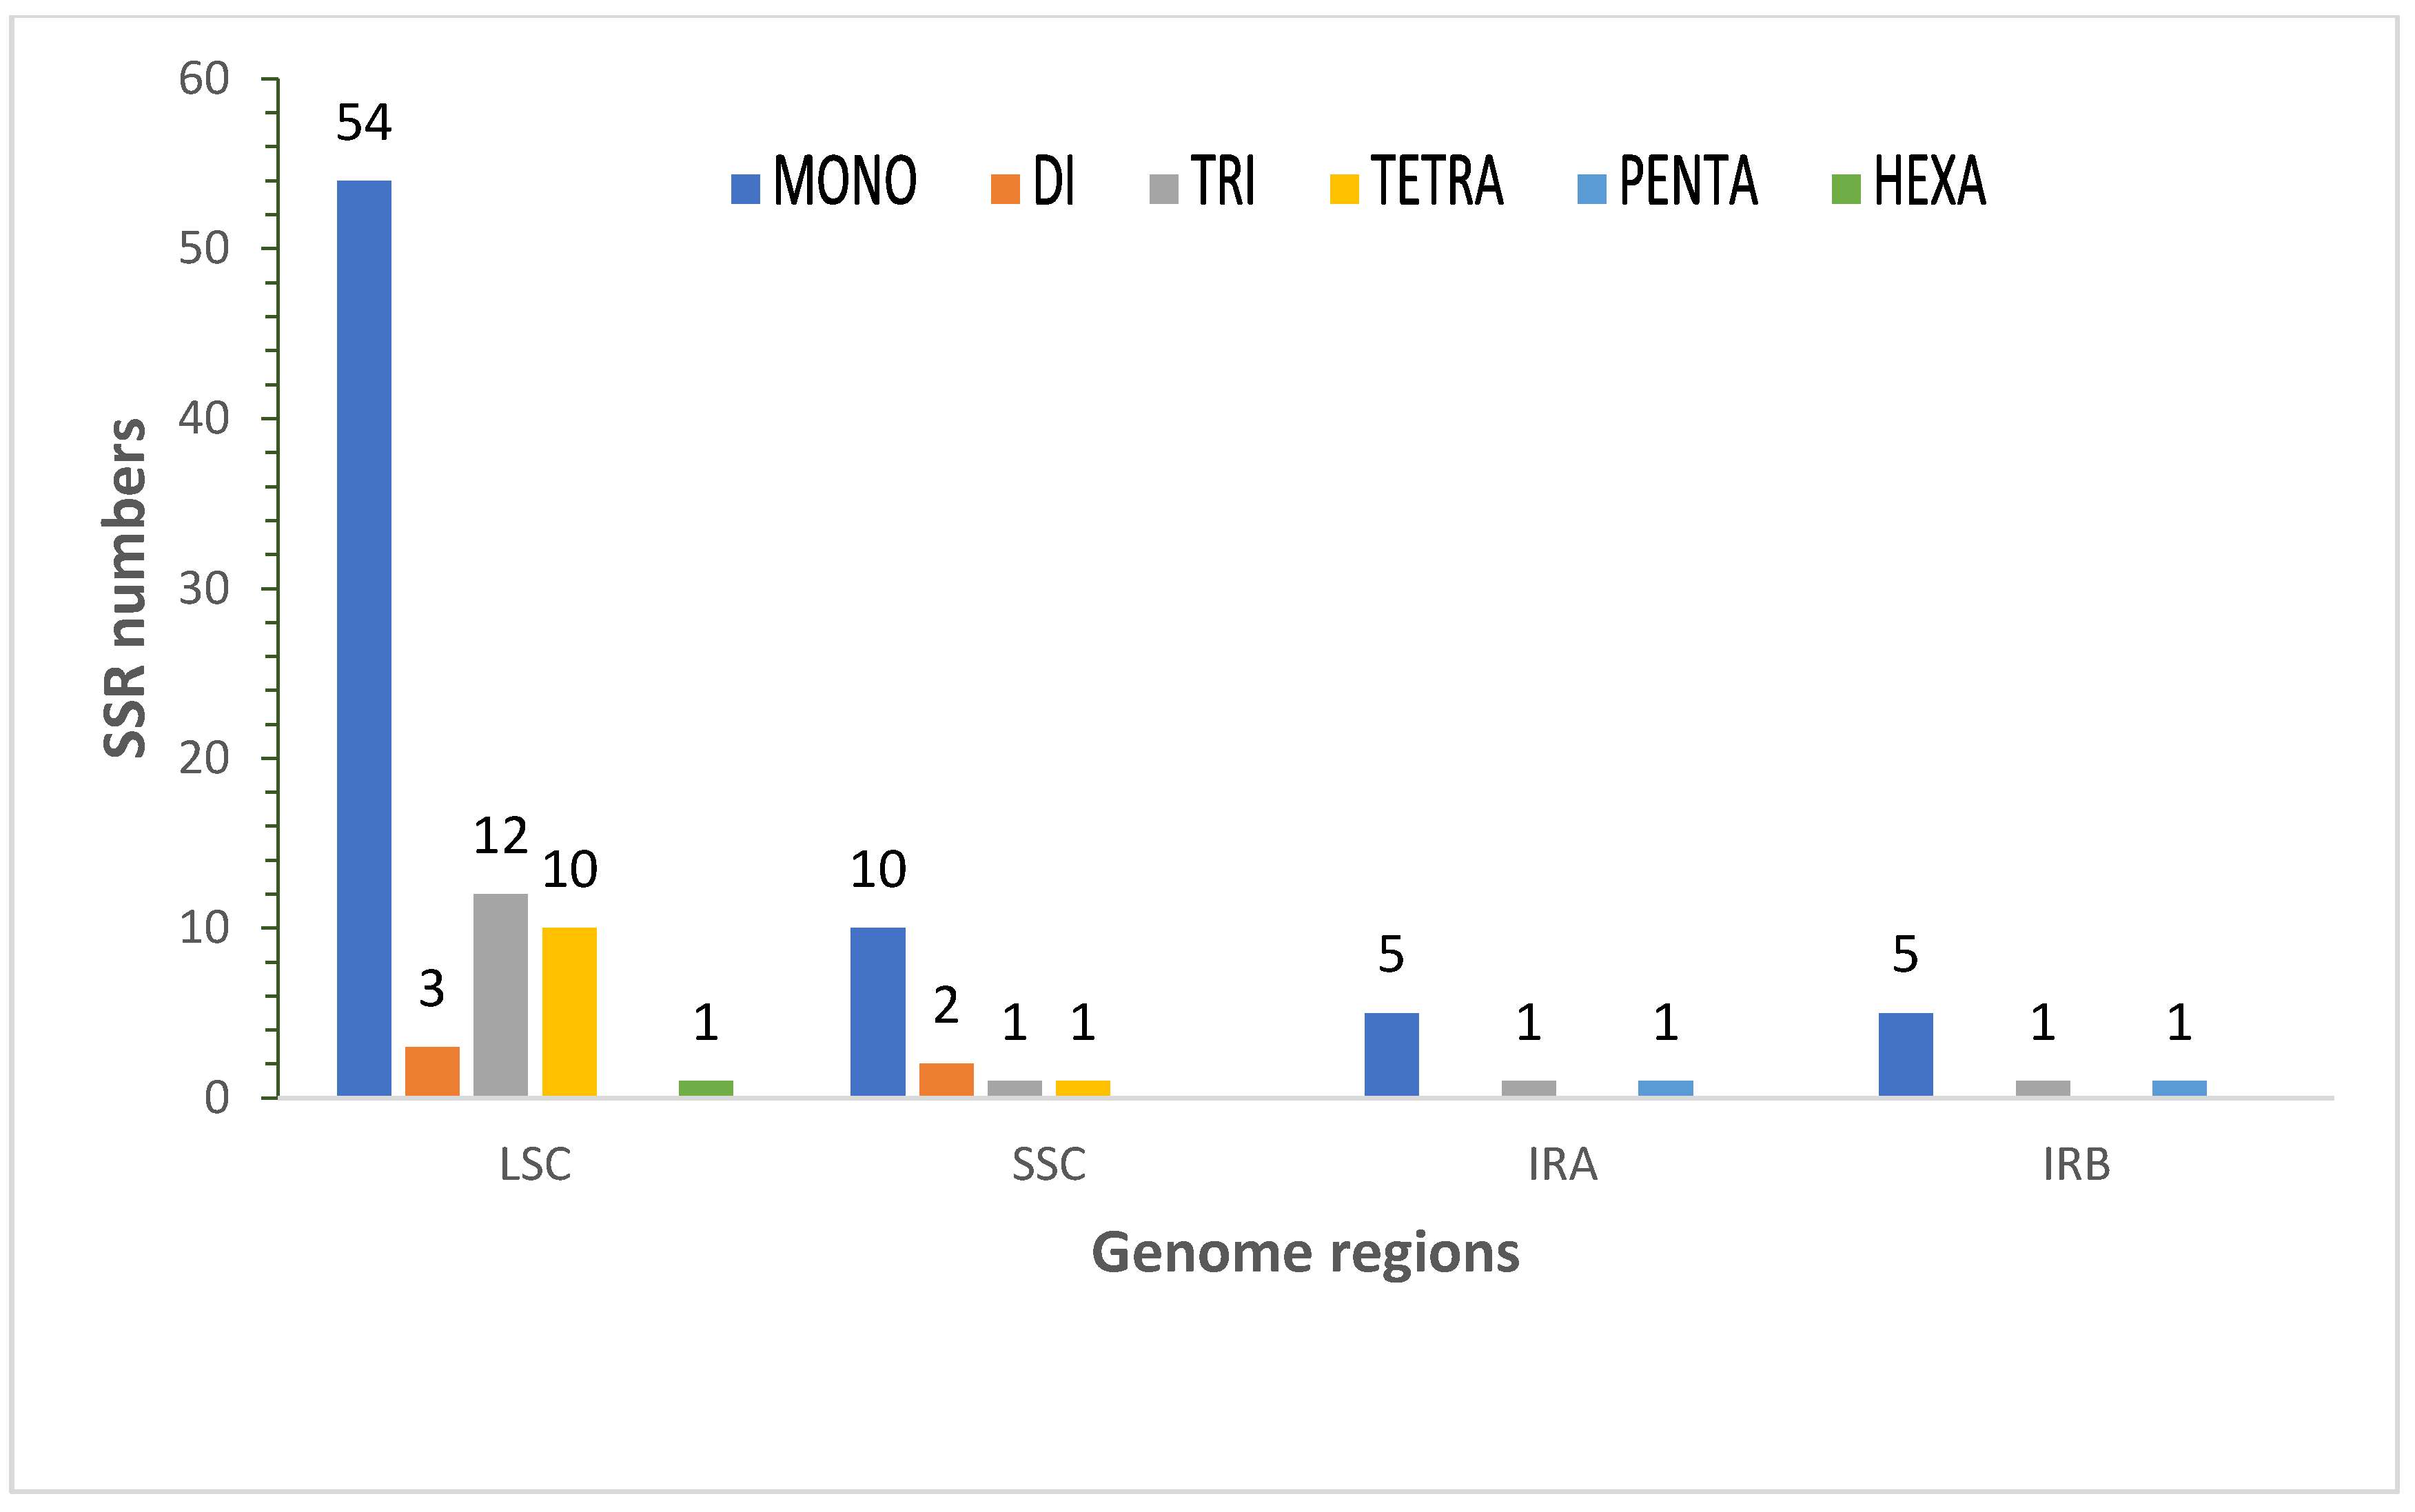
A total of 50 long repetitive sequences were detected in the Chloroplast genome of Fortunella venosa by REPuter, including 22 forward repeats (F), 7 reverse repeats (R), 19 palindromic repeats (P), and two complementary repeats (C). Forward repeats were the most abundant, followed by the palindromic repeats within all the species. The least abundant repeats were complementary repeats (Figure 2). Most of the repeat sites were located in the non-coding region of LSC, and some of them were located in rpoB, psaB, trnV-UAC, trnS-GCU, and trnL-UUA. Six repeat sites were located in the IR region and two in the SSC region. Analysis of the experimental data showed that most of the repeat sequences were 30–40 bp in length, with the longest being a palindrome repeat sequence with 54 bp. This repeat sequence was located between trnH-GUG and psbA section in the LSC region.
A total of 37 tandem repeats were detected by Tandem Repeats Finder, three repeats of which were longer than 30 bp in length and the others were between 1 bp and 26 bp. 20 repeat units reported mismatches and 10 had indels.

3.3. SSR Analysis

In this study, a total of 108 SSR loci were detected in the Chloroplast genome of Fortunella venosa. Among them, 74 were mononucleotides, five were dinucleotides, 15 were trinucleotide, 11 were tetranucleotide, two were pentanucleotides, and one was hexanucleotide (Figure 3). Most of these SSR loci were distributed in the Chloroplast genome, accounting for 74.1% of LSC region. The results are basically consistent with those of the other nine species (Figure 4 and Figure 5). Furthermore, 88.9% of the 108 SSRs were located in the non-coding region, and 11.1% of the rest in the coding region were located in the LSC region.

3.4. Codon Usage Analysis

A total of 89 CDS of the chloroplast genome of Fortunella venosa were used to estimate the relative frequency of synonymous codon usage. A total of 26,699 codons were detected, out of which 2844 (10.65%) encoded leucine and 315 (1.18%) encoded cysteine, which were the most and the least abundant amino acids in the Chloroplast genome of F. venosa, respectively. The most used codon was AUU (1071) encoding isoleucine and least used codon was AUG (1) that encoding methionine. From the analysis of the frequency of synonymous codon usage (RSCU) in the plastome, the codon usage was biased, among which 30 amino acids had a RSCU > 1. Three amino acids, methionine (AUG), serine (UCC), and tryptophan (UGG) do not have codon usage bias (RSCU = 1.00). Among the three stop codons, the use of the stop codon was biased towards UAA (RSCU > 1.00). The relative synonymous codon usage of F. venosa is shown in (Table 3).

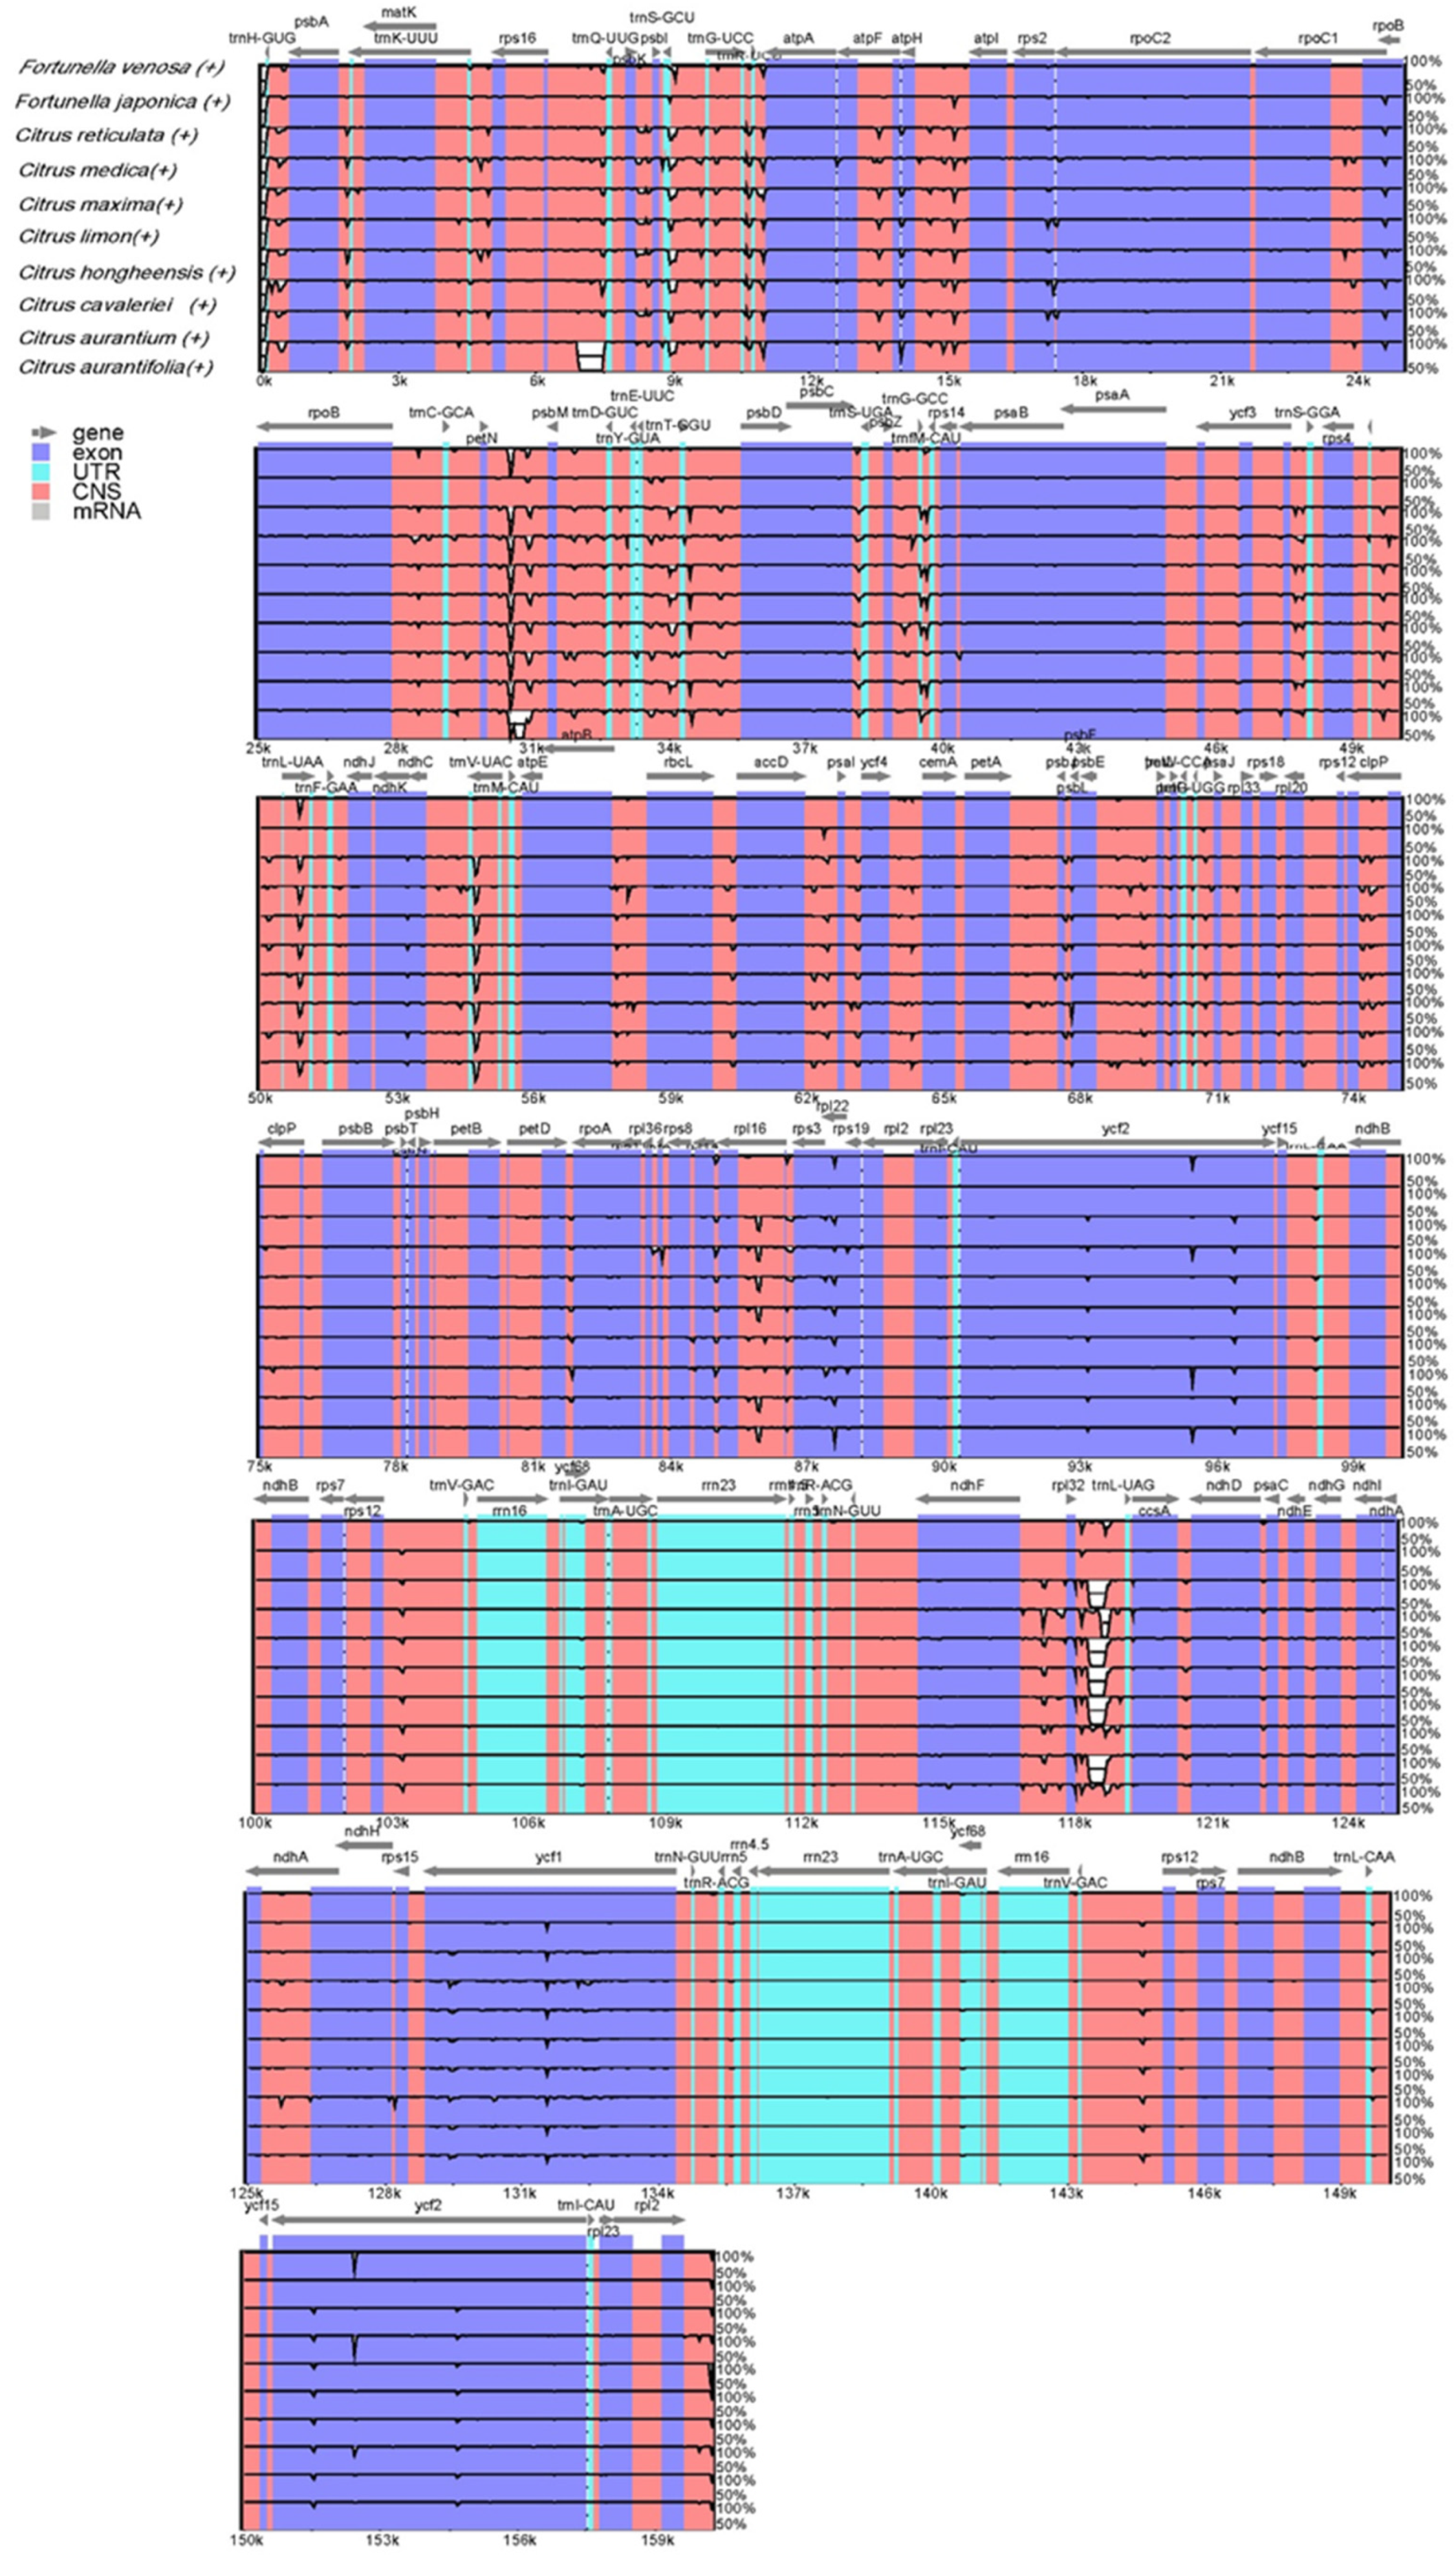
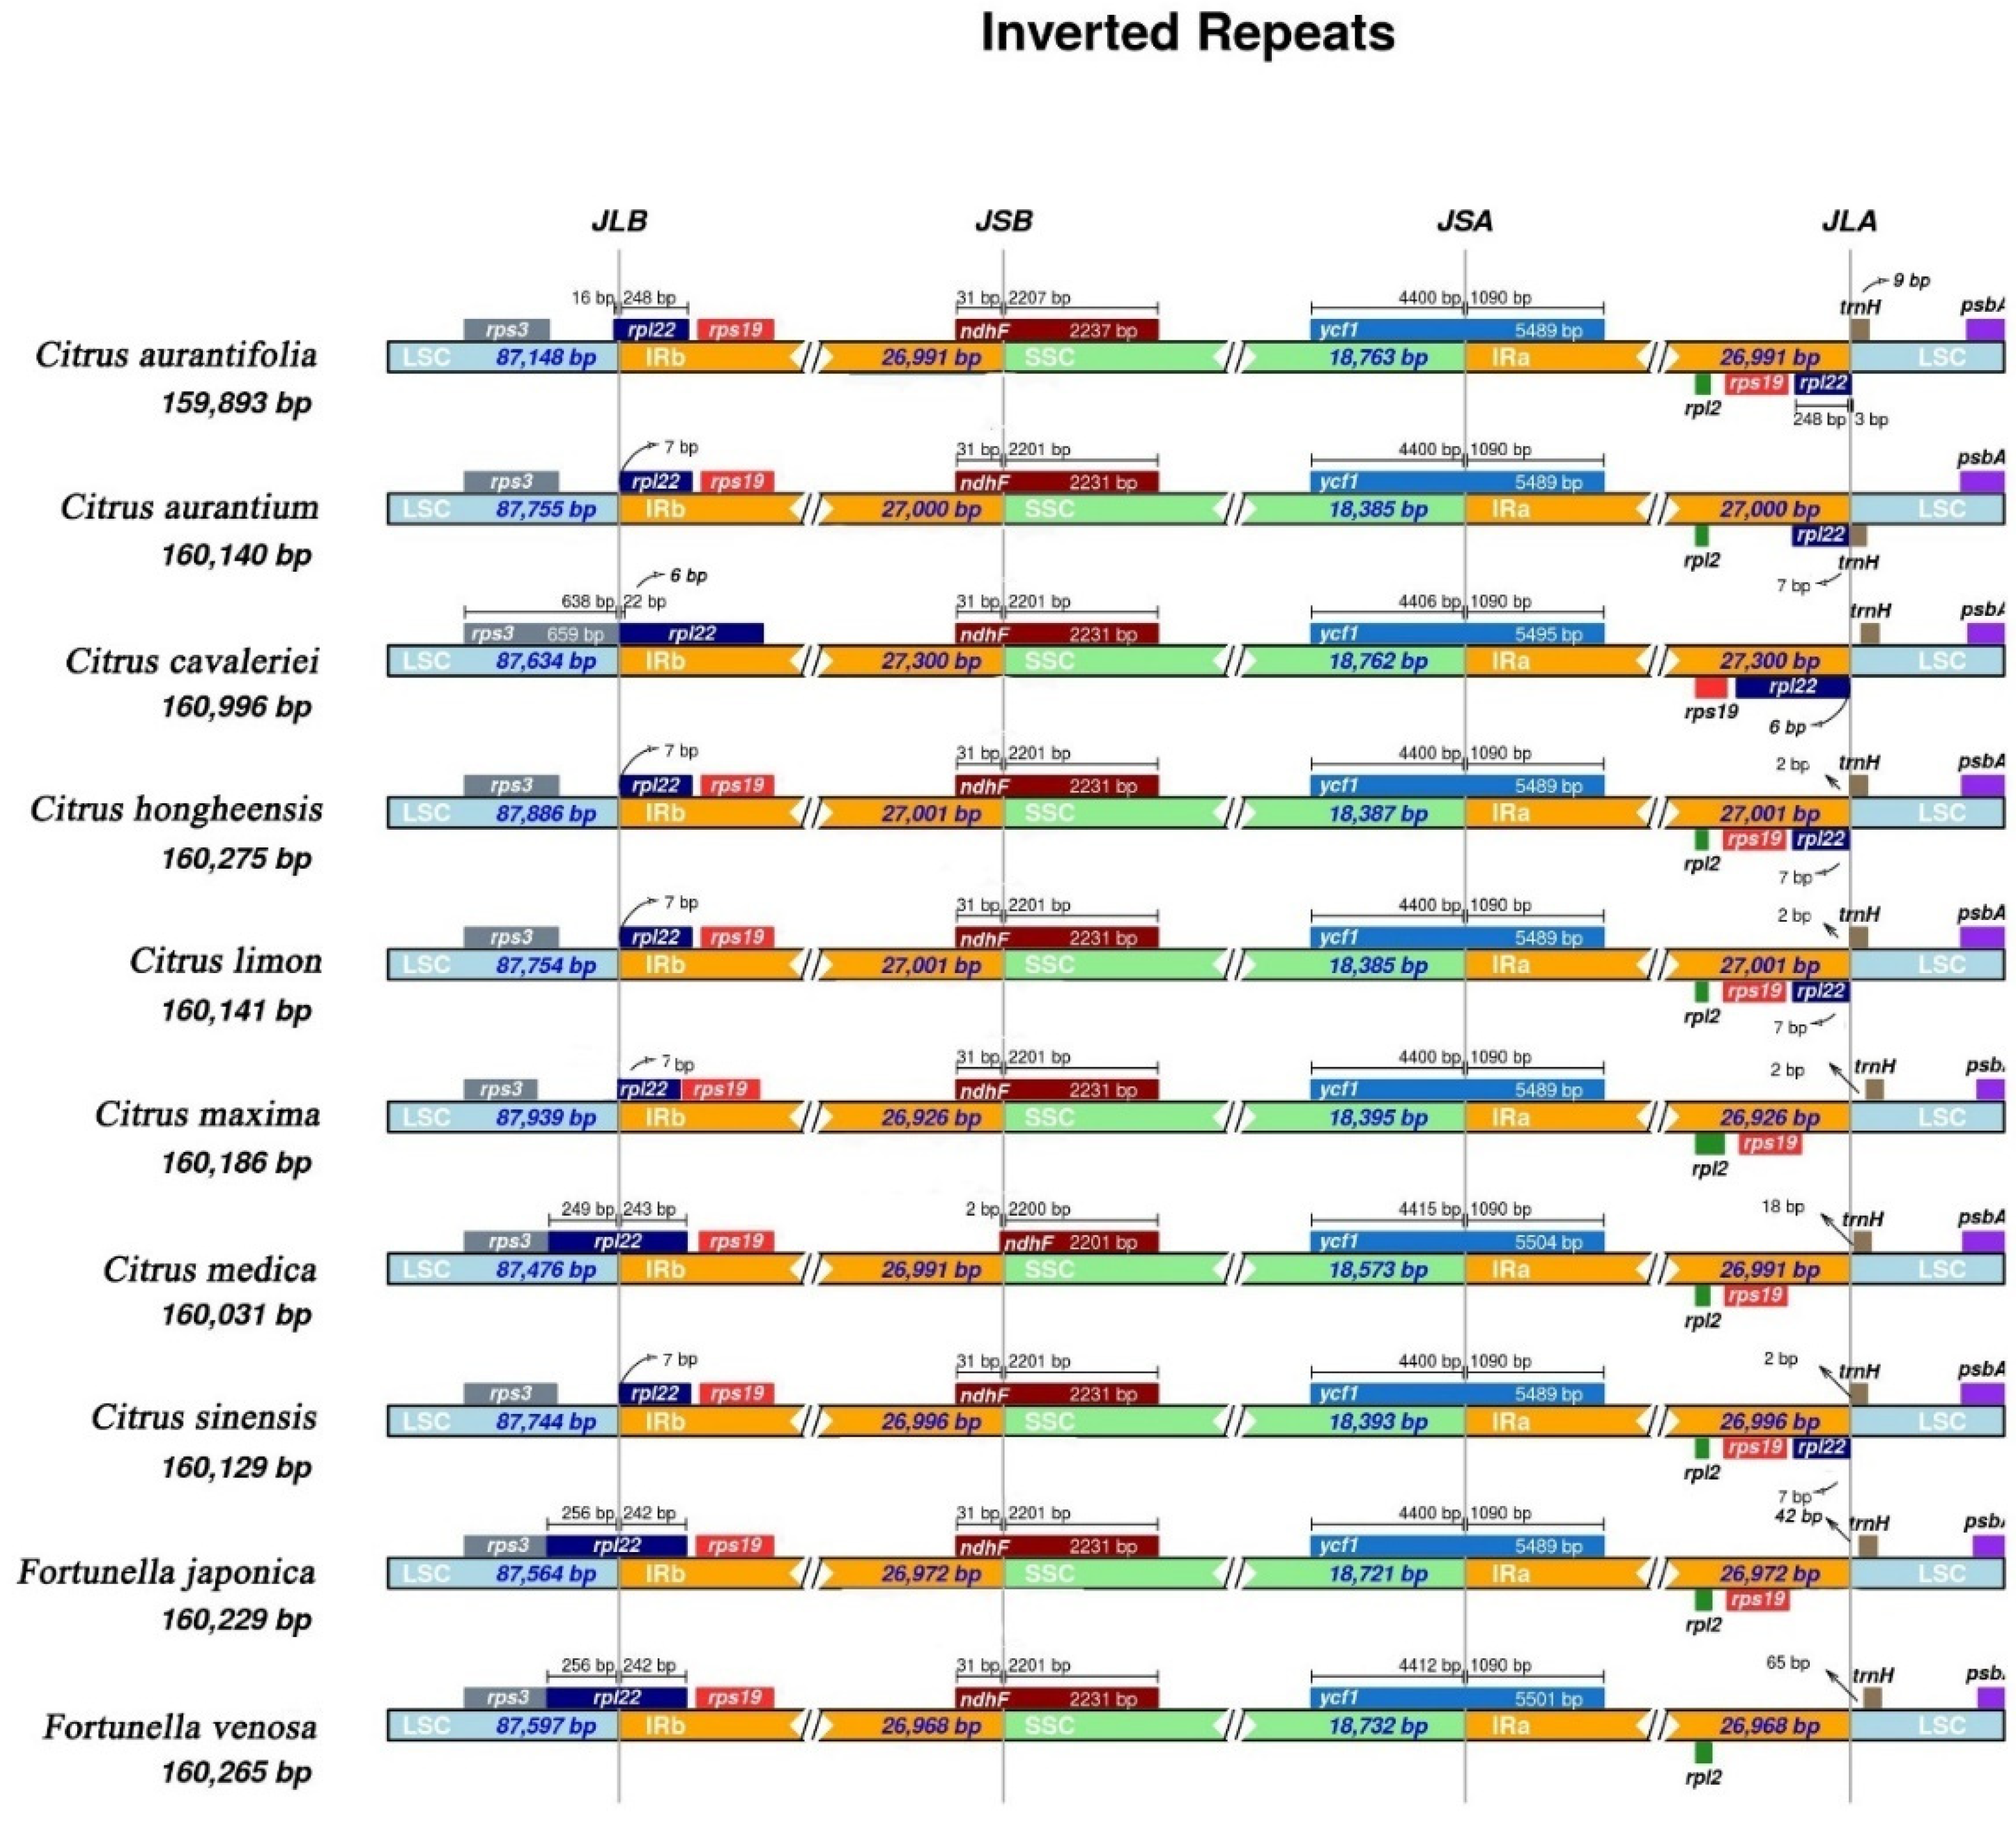
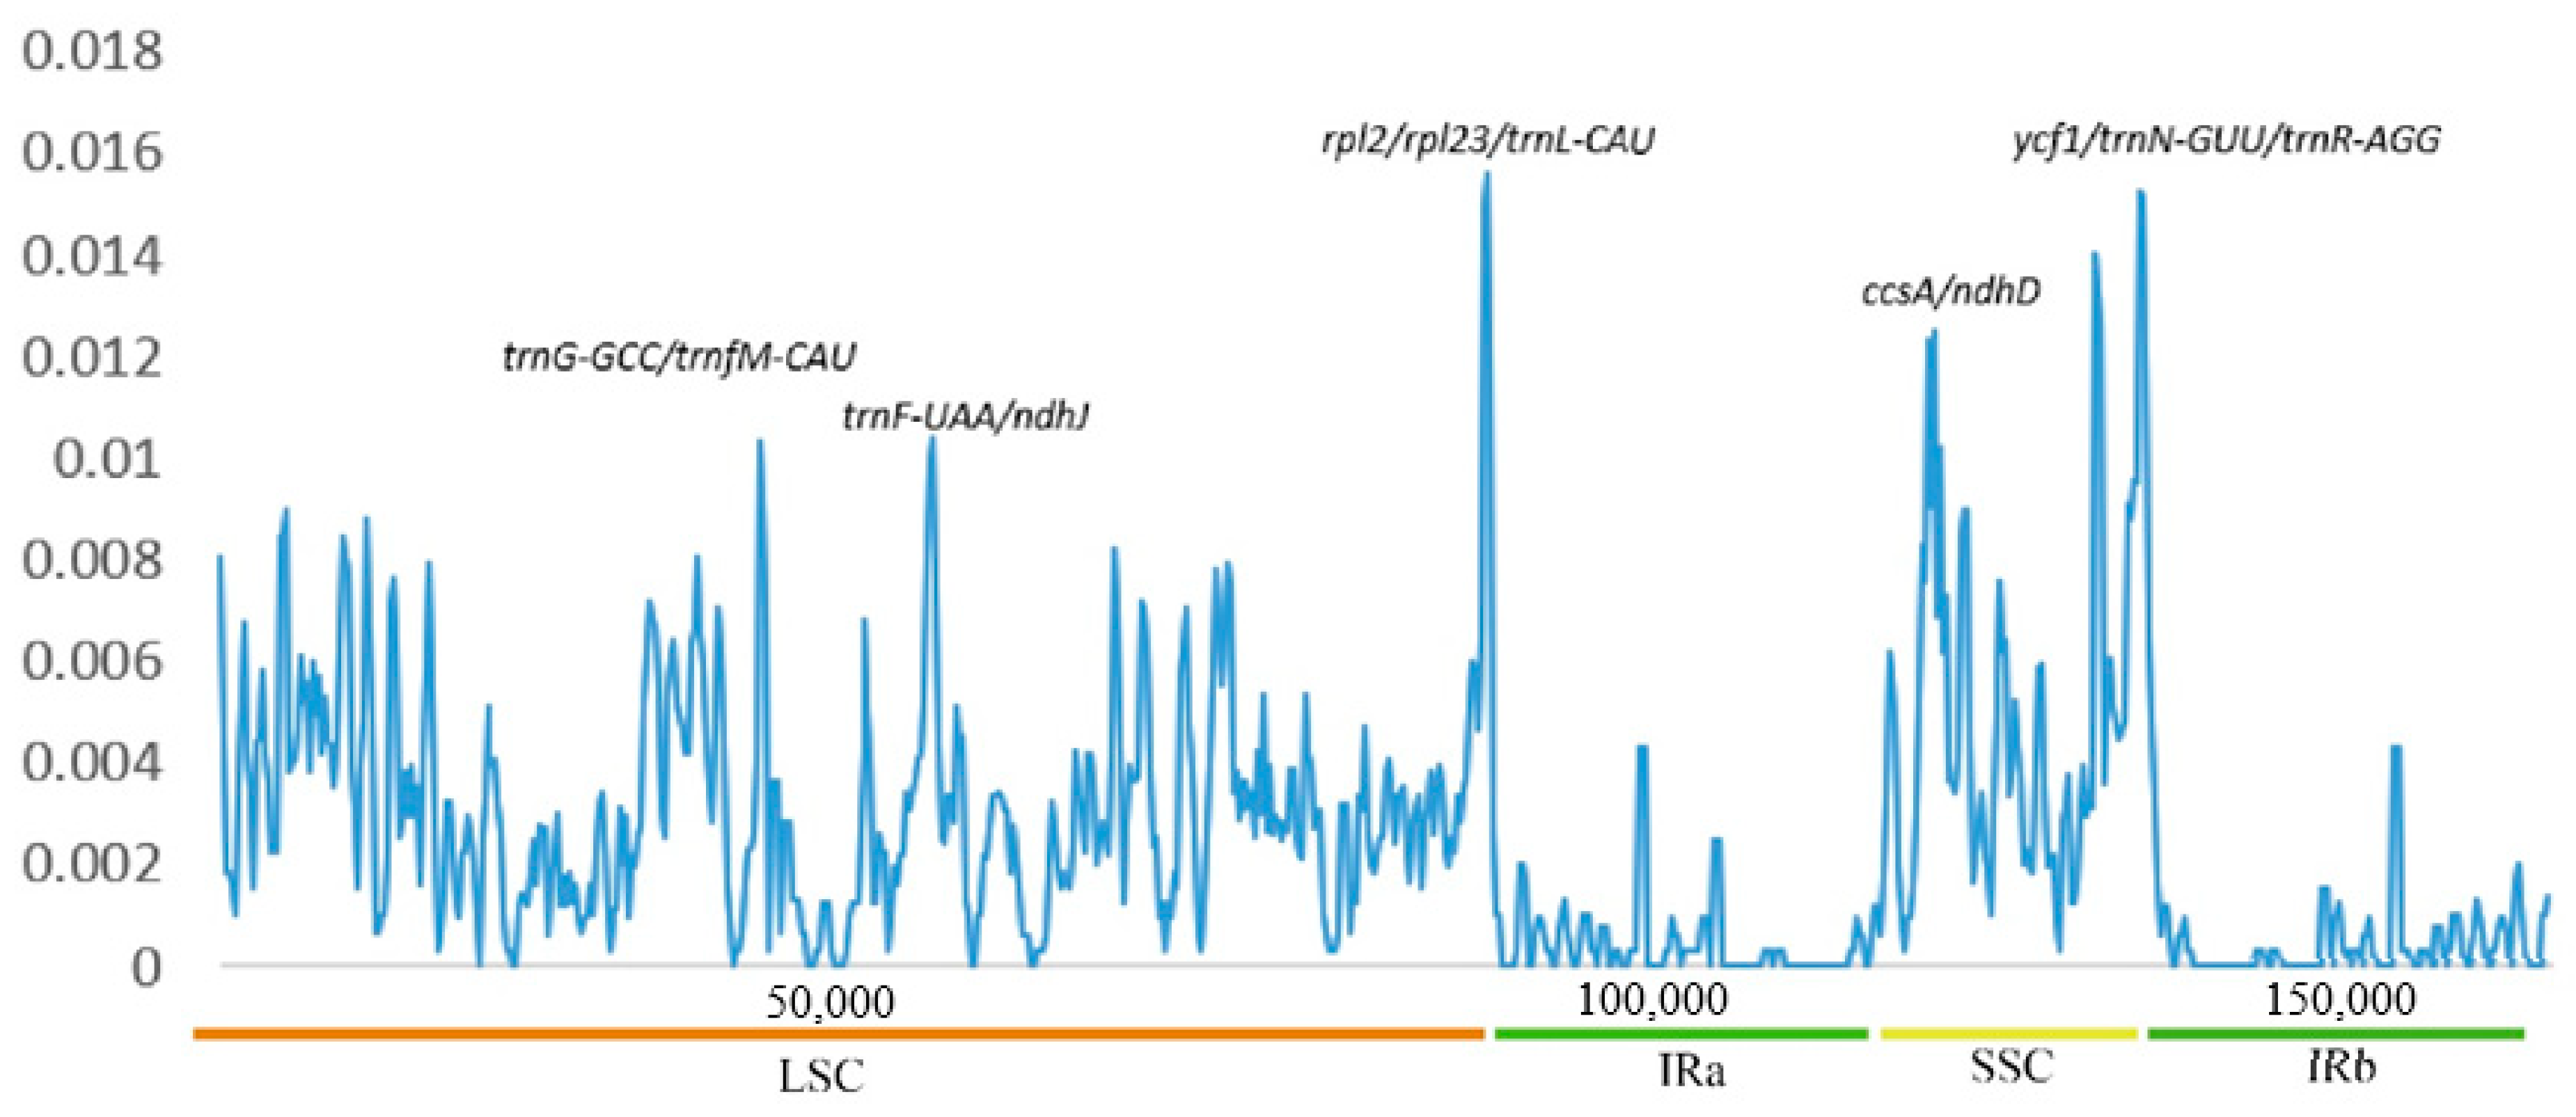
3.5. Comparative Genome and Sequence Divergence Analysis

In general, the sequence sizes of these species are similar, ranging from 159,893 bp to 160,996 bp in length. As shown in Figure 6, the sequence similarity is very high, indicating that the Chloroplast genome is highly conserved having translocation and inversion of the genes (See File S2). In the 10 Plastomes, the IR regions were more conserved than LSC and SSC regions. Similarly, the coding regions were more conserved than non-coding regions. The regions that are relatively variable in non-coding section include; trnA(GUG)-psbA psbL-trnG(UGG), petN-psbM, psbE-trnM(CAU), trnL(UAA)-trnF(GAA), ndhC-trnV(UAC). These regions may have rapid nucleotide substitution at the species level, indicating that molecular markers have potential application value in phylogenetic analysis and plant identification (Figure 6).
In this study, the results showed that although Chloroplast genomes are generally conserved in length and genetic structure, they still show significant differences in the IR/SC boundary region (Figure 7). All genes at the border include rps3, rpl22, ndhF, ycf1, trnH. The expansion and contraction of the border region was analyzed for the 10 species. For example, the position of rpl22 gene in Citrus aurantium, C. cavaleriei, C. hongheensis, C. limon, and C. sinensis is located in the IRb region with a distance of 7 bp, 6 bp, 7 bp, 7 bp, and 7 bp from the boundary, respectively. The rpl22 in the other species spans the LSC and IRb regions, and the situation of rpl22 at the boundary of LSC and IRa is also different, the rpl22 gene is missing in C. maxima, C. medica, and Fortunella venosa. The gene ndhF located at the border between IRb and SSC is only 2 bp and 2200 bp in C. medica, and the rest are 31 bp and 2201 bp. The gene trnH located on the border of IRa and LSC is located on LSC but the length from the border varies from 2–65 bp. Ycf1 was lost at the boundary of IRb and SSC in C. medica and F. venosa, and ndhF crossed the boundary of LSC and IRb, but only 2 bp was located at IRb in C. medica, the rest was 31 bp. The length of ycf1 at the boundary between SSC and IRa is 5490 bp to 5505 bp. These results indicate that there is a contraction and expansion of IR region, which can be used for the study of species-specific gene loci.
The results of Dnaspv.5.0 showed that the regions with high nucleotide polymorphism were the LSC and SSC regions, which was basically consistent with the results of mVISTA (Figure 7). The highly polymorphic loci were trnG-GCC, trnfM-UAA, ndhJ, rpl2, rpl23, trnL-CAU, ccsA, ndhD, ycf1, trnN-GUU, and trnR-AGG. The highest value of Pi was 0.01563, recorded by the genes rpl2 and rpl23. The Pi value was more than 0.01, As shown in (Figure 8). Data on specific nucleotide polymorphisms are provided in File S3.

3.6. Adaptive Evolution Analysis

The dN/dS value can be used to measure the evolution rate of a specific gene [57]. This is the ratio of synonymous substitution rate (dS) to nonsynonymous substitution rate (dN) (ω = dN/dS). In the selection pressure analysis, when ω > l, it shows a positive selection, while, when ω = l, it is a neutral selection; if ω < 1, it is a purifying selection. In this study, we found that the model M7 vs. M8 is the most suitable model by EasyCodeML detection. A total of 344 positive selection sites were detected in 79 CDSs of the ten species (see File S4). Among them, the Naive Empirical Bayes (NEB) detected 54 genes loci, encoding 15 genes of selection pressure, accounting for 18. 99% of the total number of genes. The largest number of loci was rpoC2 with 27. Bayes Empirical Bayes (BEB) detected 290 positive selection sites, which encode the selection pressure of 53 genes, respectively accounting for 67.09% of the total number of genes, and rpoC2 has the most loci with 57. In NEB, photosynthesis-related genes ndhI (2) and self-replicating genes rpoC2 (8), rps2 (1), and rps18 (1) had p > 0.99%. In BEB, photosynthesis-related genes ndhB (1), ndhI (2), psbZ (1) and self-replicating genes rpoC2 (8), rps18 (1), rps19 (1), rps2 (1) had p > 0.99%. is shown in (Table 4). The results showed that the 10 species were under strong positive selection pressure, the nucleotide substitution rate was faster, and they showed strong adaptive variation to their environment.

3.7. Phylogenetic Analysis

The CDS phylogenetic tree results are shown in (Figure 9), Zanthoxylum was clustered into one branch. Glycosmis, Micromelum, Clausena, and Murraya showed a close relationship and hence formed single clade. Fortunella venosa and F. japonica were clustered together and showed a close relationship to genus Citrus. The two species were found to be closely related. They both show that genus Fortunella and genus Citrus are closely related. The results of the whole Chloroplast genome tree are shown in (Figure 10). In the phylogenetic tree reconstructed using the complete chloroplast genome, more than 95% of the branches have a support value of 100% which supports a close relationship among the species. However, one Citrus branch has a support value of 55.6% and its phylogenetic status needs to be further studied, which are basically consistent with the phylogenetic relationship constructed from CDS (Figure 9).
The Chloroplast genome sequence provides an important resource for phylogenetic research. In order to get a more detailed phylogenetic conclusion, more complete Chloroplast genomes of Fortunella are needed. As a highly primitive group of this genus, the complete Chloroplast genome characteristics of F. venosa is indispensable, which will be subsequently used for Citrus taxa phylogenetic study.

4. Discussion

In this study, we analyzed the complete chloroplast genome of Fortunella venosa and performed a comparative study with 10 Rutaceae species. The Chloroplast genome of Fortunella venosa is a circular structure with a size of 160,265 bp, which is similar to the size of other related species reported [58,59]. All the 10 complete chloroplast genomes of the Rutaceae species displayed attributes that is similar to other angiosperm Chloroplast genomes, with quadripartite structure including the LSC, SSC, and a pair of inverted repeats (IRa and IRb). Although there were no genomic rearrangements with gene order highly conserved, there were differences in the Chloroplast genomes ranging from 160,229 bp–160,265 bp in genus Fortunella, and 159,893–160, 996 bp in genus Citrus, hence suggesting some small genetic differences within the genomes. Previous studies have reported that loss of genes [60], variations in the inverted repeat regions [61], and the intergenic spacer region variation [62] are the three fundamental causes of the variations in the chloroplast genome sizes in plants. Additionally, the chloroplast gene length has also been associated with the genome size [63].
Repetitive sequences play an important role in genome rearrangement and are very helpful for phylogenetic studies [64]. In addition, analysis of various chloroplast genomes has shown that repetitive sequences are essential for the study of indels and substitutions [65]. All the ten Rutaceae species had reverse, compliment, forward and Palindromic repeats which varied in number among all the species. From the analysis, the number of repeats found within the chloroplast genomes indicate that Fortunella venosa and F. japonica are more similar than to the rest of the Citrus species. Studies have linked sequence variations and genome rearrangements to slipped-strand mispairing and improper recombination of the repeat sequences [66]. On the other hand, Simple Sequence Repeats (SSRs), also known as microsatellite sequences, are repeated DNA sequences, widely distributed in the whole Chloroplast genome, having lengths of about 1–6 bp [67]. The inheritance of cpDNA in higher plants is mostly maternal, and the structure of cpDNA is relatively conserved and simple, hence cpDNA SSR is widely used as molecular markers, variety identification and other molecular studies [68]. For example, SSR analysis is important for DNA markers used for population genetic and evolutionary studies [69,70,71]. In this study, we analyzed the SSRs in the Chloroplast genomes. Six categories of perfect SSRs (mono-, di-, tri-, tetra-, penta-, and hexa-nucleotide repeats) were detected in the Chloroplast genome of these ten species. In recent years, more evidence shows that the repetitive structure of genomic DNA is essential, not only important in plant molecular research [72], but also widely used in the study of population genetics of species [73,74,75]. SSR has the advantages of high mutation rate, site specificity and multiple alleles [76,77], which can be used for genetic diversity analysis [78,79].
The relative frequency of synonymous codon usage (RSCU) values in Chloroplast genomes have been shown to be as a result of mutation and selection [80,81], which are crucial in the study of the evolution of organisms. RSCU > 1 indicates a preference for the codon, RSCU < 1 indicates a low usage of the codon, and RSCU = 1 indicates no preference for the codon [82]. The codon usage was biased, among which 30 amino acids have RSCU >1. Three amino acids, methionine (AUG), serine (UCC), and tryptophan (UGG) do not have codon usage bias (RSCU = 1.00). Among the three stop codons, the use of the stop codon was biased towards UAA (RSCU > 1.00). This is basically consistent with the reports of other Chloroplast genomes in Rutaceae [58,59].
Comparative analysis in the 10 Plastomes showed that the IR regions were more conserved than LSC and SSC regions. Similarly, the coding regions were more conserved than non-coding regions. This is a common phenomenon in most angiosperms [83]. There is a variability in the size, position at the boundary regions among the species especially for genes such as rpl22, ndhF, and ycf1. This changes in the sizes and positions of the genes cause changes in the size of the genome, hence comparatively, there is a variation in length and number of genes as shown among the species. Expansion and contraction at the borders of the IR regions are considered important in the Chloroplast genome size and play a vital role in its evolution [84]. Nucleotide diversity among the 10 species of Rutaceae genomes was calculated, indicating that the average nucleotide diversity is 0.00252 (Supplementary File S4). This was comparatively higher as compared to the previous studies that compared the species level and the interspecific nucleotide diversity [85]. Most of the nucleotide diversity sites occurred in the LSC and SSC regions, with the highest peaks being rpl2/rpl23/trnL-CAU (0.016) and ycf1/trnN-GUU/trnR-AGG (0.015). This shows that there are low levels of nucleotide diversity throughout the chloroplast genome.
The genus Fortunella includes four species of the “kumquats” from eastern Asia (China, Hong Kong, and Malay Peninsula). It is traditionally separated from Citrus by quantitative characters, 3–7 (versus 8–18) locules in the ovary with two (vs. 4–12) ovules per locule, and by smaller fruits. In other vegetative, floral, and fruit characters, Fortunella is quite similar to Citrus, including the polyadelphous androecium (character 4) with numerous stamens cohering in bundles, a character more commonly found in Citrus subgenus Citrus. The results of this study (Figure 9 and Figure 10) indicate that Fortunella Swingle and Citrus L. are closely related, but do not support the incorporation of F. venosa into C. japonica. The complete chloroplast genomes have been shown to provide informative sites for resolving phylogenetic relationships of plants, and have been examined as well to be effective in the ability of differentiation in lower taxonomic levels [86]. The ML, BI, PhyML tree showed a very high level of support in our study. This study shows that F. venosa should be an independent species, which is significantly different from F. japonica in terms of morphology (habitat, leaf type, fruit size, etc.). F. venosa is a small shrub, usually no more than 1 m tall (the shortest mature plant is 0.28 m high); the leaves are single leaves (the joints of the petiole and the leaf are not joint); the leaves are usually small, 2–4 (−7) cm long, 1–2 cm wide, wedge-shaped base; petiole short, 1–3 (−5) mm long; flower solitary leaf axils, petals 3–5 mm long; ovary 2–3 compartments; fruit spherical or elliptical, diameter 6–8 mm, Orange-red when mature. On the other hand, F. japonica is a small tree or tree with a height of 2 to 8.5 m, and the main stem is usually slender; the leaf is a single leaflet with joints between the petiole and the leaf; the leaf is larger, 4–9 cm long, 1.5–3.5 cm wide, and a wide wedge-shaped base; The petiole is obviously longer, 6–10 (−15) mm long; the flower is single or 2–3 clusters with leaf axils, the petals are 6–8 mm long; the ovary is 4–6 compartments; the fruit is larger, spherical, 1.5–2.5 cm in diameter, Orange-yellow to orange-red when cooked (Figure 11). Due to the significant morphological difference between F. venosa and F. japonica, it is easy to distinguish the two in the wild. The molecular results obtained in this study provide strong support for the independent systematics status of F. venosa. In this paper, we still use F. japonica and F. venosa as the scientific names according to the Flora of China for better discussion. In addition, none of the research results done so far based on morphology, palynology and molecular biology supports the incorporation of F. venosa into C. japonica, showing that the two species are independent.

5. Conclusions

This paper reports the first complete Chloroplast genome sequence of Fortunella venosa. It provides a more detailed and complete information, laying a foundation for the identification of species in the genus Fortunella and the analysis of genetic differences at the individual level. In Rutaceae, Fortunella is phylogenetically related to Citrus, but the inter-species relationship is complicated. This study confirmed that the molecular phylogeny supports F. venosa as an independent species. Hence the Chloroplast genome proves an important basis for the study of systematic classification. In order to better solve the problem of systematic classification in Fortunella, we need to get more cpDNA sequence information of Fortunella. Furthermore, the variations among chloroplast genomes of both Fortunella and Citrus species provide a mechanism of distinguishing the species for future studies. The study of chloroplast genes is of great significance in revealing the mechanism and metabolic regulation of plant photosynthesis. At the same time, the in-depth study of the chloroplast genome helps understand the mutual regulation between the nuclear genome and the chloroplast genome, and the chloroplast as a semi-autonomous organelle is conducive to energy conversion research.

Supplementary Materials

Rearrangement and reversal, https://www.mdpi.com/article/10.3390/f12080996/s1, File S1: Nucleotide Polymorphisms, File S2: Selection Pressure Analysis, File S3: Phylogenetic Analysis Sequences and Accession Numbers, File S4.

Author Contributions

The collection of experimental materials was completed by T.W., R.-P.K., X.-L.L. and X.-H.W. Data analysis by T.W.; preparations for drafting the manuscript and diagrams were completed by T.W., X.-Z.C. and K.-M.L. The revision and manuscript editing were completed by T.W., K.-M.L., X.-Z.C., V.O.W. and G.-W.H. Proofreading of the English manuscript was completed by T.W., K.-M.L., X.-Z.C., V.O.W. and G.-W.H. Resources were provided by K.-M.L., G.-W.H. and X.-Z.C. The funds were provided by K.-M.L. and G.-W.H. All authors have read and agreed to the published version of the manuscript.

Funding

This work was supported by grants from the National Science and Technology Basic Resources Survey Project (2019FY101800), Investigation of Forest Tree Germplasm Resources in Hunan Province (Xiangcainongzhi (2015) 91), and International Partnership Program of Chinese Academy of Sciences (151853KYSB20190027).

Institutional Review Board Statement

Not applicable.

Informed Consent Statement

Not applicable.

Data Availability Statement

Not applicable.

Acknowledgments

We sincerely thank Hunan forestry bureau, Hainan forestry bureau, Chaling County Agriculture Bureau, Guidong County natural resources bureau, Rucheng County Forestry Bureau and other units, and relevant personnel for their strong support and help. Thanks to Ying Tan for revising the English version of this article and making valuable comments on the manuscript. Thanks to Yi-Yan Cong, Jing Tian, Liu Zhou, Qin-You Zhang, Cun-Zhong Huang and others for their assistance in field investigation and material collection. Thanks to Shuai Peng, Jia-Xin Yang, Xiang Dong, and Shi-Xiong Ding from Wuhan Botanical Garden, Chinese Academy of Sciences for their guidance in experiment and data analysis. Thanks to Hui-Juan Shu for her help in data processing. We also thank Hunan Province Key Laboratory of Crop Sterile Germplasm Resource Innovation and Application for their help.

Conflicts of Interest

The authors declare no conflict of interest.

References

  1. Brocks, J.J.; Logan, G.A.; Buick, R.; Summons, R.E. Archean molecular fossils and the early rise of eukaryotes. Science 1999, 285, 1033–1036. [Google Scholar] [CrossRef] [Green Version]
  2. Kostianovsky, M. Evolutionary origin of eukaryotic cells. Ultrastruct. Pathol. 2000, 24, 59–66. [Google Scholar] [CrossRef] [PubMed]
  3. Embley, T.M.; Martin, W. Eukaryotic evolution, changes and challenges. Nature 2006, 440, 623–630. [Google Scholar] [CrossRef] [PubMed]
  4. Xing, S.C.; Clarke, J.L. Process in chloroplast genome analysis. Prog. Biochem. Biophys. 2008, 35, 21–28. [Google Scholar]
  5. Daniell, H.; Lin, C.S.; Yu, M.; Chang, W.J. Chloroplast genomes: Diversity, evolution, and applications in genetic engineering. Genome Biol. 2016, 17, 134. [Google Scholar] [CrossRef] [PubMed] [Green Version]
  6. Ravi, V.; Khurana, J.P.; Tyagi, A.K.; Khurana, P. An update on chloroplast genomes. Plant Syst. Evol. 2008, 271, 101–122. [Google Scholar] [CrossRef]
  7. Wang, L.; Dong, W.P.; Zhou, S.L. Structural mutations and reorganizations in chloroplast genomes of flowering plants. Acta Bot. Boreali-Occident. Sin. 2012, 32, 1282–1288. [Google Scholar]
  8. Zhang, T.; Fang, Y.; Wang, X.; Deng, X.; Zhang, X.; Hu, S.; Yu, J. The complete chloroplast and mitochondrial genome sequences of Boea hygrometrica: Insights into the evolution of plant organellar genomes. PLoS ONE 2012, 7, e30531. [Google Scholar] [CrossRef] [PubMed] [Green Version]
  9. Shinozaki, K.; Ohme, M.; Tanaka, M.; Wakasugi, T.; Hayashida, N.; Matsubayashi, T.; Zaita, N.; Chunwongse, J.; Obokata, J.; Yamaguchi-Shinozaki, K.; et al. The complete nucleotide sequence of the tobacco chloroplast genome: Its gene organization and expression. EMBO J. 1986, 5, 2043–2049. [Google Scholar] [CrossRef]
  10. Liu, L.X.; Li, R.; Worth, J.R.P.; Li, X.; Li, P.; Cameron, K.M.; Fu, C.X. The complete chloroplast genome of Chinese bayberry (Morella rubra, Myricaceae): Implications for understanding the evolution of Fagales. Front. Plant Sci. 2017, 8, 968. [Google Scholar] [CrossRef]
  11. McCauley, D.E.; Stevens, J.E.; Peroni, P.A.; Raveill, J.A. The spatial distribution of chloroplast DNA and allozyme polymorphisms within a population of Silene alba (Caryophyllaceae). Am. J. Bot. 1996, 83, 727–731. [Google Scholar] [CrossRef]
  12. Small, R.L.; Cronn, R.C.; Wendel, J.F. Use of nuclear genes for phylogeny reconstruction in plants. Aust. Syst. Bot. 2004, 17, 145–170. [Google Scholar] [CrossRef]
  13. Korpelainen, H. The evolutionary processes of mitochondrial and chloroplast genomes differ from those of nuclear genomes. Naturwissenschaften 2004, 91, 505–518. [Google Scholar] [CrossRef]
  14. Shaw, J.; Lickey, E.B.; Beck, J.T.; Farmer, S.B.; Liu, W.; Miller, J.; Siripun, K.C.; Winder, C.T.; Schilling, E.E.; Small, R.L. The tortoise and the hare II: Relative utility of 21 noncoding chloroplast DNA sequences for phylogenetic analysis. Am. J. Bot. 2005, 92, 142–166. [Google Scholar] [CrossRef] [Green Version]
  15. Hollingsworth, P.M.; Graham, S.W.; Little, D.P. Choosing and using a plant DNA barcode. PLoS ONE 2011, 6, e19254. [Google Scholar] [CrossRef] [PubMed]
  16. Dong, W.P.; Xu, C.; Li, C.H.; Sun, J.H.; Zuo, Y.J.; Shi, S.; Cheng, T.; Guo, J.J.; Zhou, S.L. ycf1, the most promising plastid DNA barcode of land plants. Sci. Rep. 2015, 5, 8348. [Google Scholar] [CrossRef] [PubMed] [Green Version]
  17. Guo, H.-J.; Liu, J.-S.; Luo, L.; Wei, X.P.; Zhang, J.; Qi, Y.-D.-; Zhang, B.-G.; Liu, H.-T.; Xiao, P.-G. Complete chloroplast genome sequences of Schisandra chinensis: Genome structure, comparative analysis, and phylogenetic relationship of basal angiosperms. Sci. China Life Sci. 2017, 11, 1286–1290. [Google Scholar] [CrossRef]
  18. Wang, S.; Yang, C.P.; Zhao, X.Y.; Chen, S.; Qu, G.Z. Complete chloroplast genome sequence of Betula platyphylla: Gene organization, RNA editing, and comparative and phylogenetic analyses. BMC Genom. 2018, 19, 950. [Google Scholar] [CrossRef] [Green Version]
  19. Rono, P.C.; Dong, X.; Yang, J.X.; Mutie, F.M.; Oulo, M.A.; Malombe, I.; Kirika, P.M.; Hu, G.W.; Wang, Q.F. Initial Complete Chloroplast Genomes of Alchemilla (Rosaceae): Comparative Analysis and Phylogenetic Relationships. Front. Genet. 2020, 11, 1390. [Google Scholar] [CrossRef]
  20. Zhou, H.; Gao, X.; Woeste, K.; Zhao, P.; Zhang, S. Comparative Analysis of the Complete Chloroplast Genomes of Four Chestnut Species (Castanea). Forests 2021, 12, 861. [Google Scholar] [CrossRef]
  21. Wanga, V.O.; Dong, X.; Oulo, M.A.; Mkala, E.M.; Wang, Q.F. Complete chloroplast genomes of Acanthochlamys bracteata (china) and Xerophyta (Africa) (Velloziaceae): Comparative genomics and phylogenomic placement. Front. Plant Sci. 2021, 12, 691833. [Google Scholar] [CrossRef] [PubMed]
  22. Huang, C.-J. Flora Reipublicae Popularis Sinicae; Science Press: Beijing, China, 1997; Volume 43, Part 2; pp. 169–175. [Google Scholar]
  23. Liu, R.-L. Fortunella venosa (Champ. ex Benth.) Huang. South China For. Sci. 2014, 42, 2. [Google Scholar]
  24. Huang, X.-Z.; Lei, Y.; Chen, X.-M.; Wei, X.-X.; Lu, X.-K.; Ye, X.; Zheng, H.-Z. Investigation and Analysis of Wild Fortunella hindsii and Fortunella venosa Resources in Fujian. J. Plant Genet. Resour. 2010, 11, 509–513. [Google Scholar]
  25. Wang, S.; Xie, Y. China Species Red List; Higher Education Press: Beijing, China, 2004; Volume 1, p. 346. [Google Scholar]
  26. Yasuda, K.; Yahata, M.; Kunitake, H. Phylogeny and Classification of Kumquats (Fortunella spp.) Inferred from CMA Karyotype Composition. Hortic. J. 2016, 85, 115–121. [Google Scholar] [CrossRef]
  27. Tanaka, T. Revisio Aurantiacearum—I. Bull. Société Bot. Fr. 1928, 75, 708–715. [Google Scholar] [CrossRef]
  28. Zhang, D.; Hartley, T.G.; Mabberley, D.J. Flora of China; Wu, C.-Y., Raven, P.H., Hong, D.-Y., Eds.; Science Press: Beijing, China; Missouri Botanical Garden Press: St. Louis, MI, USA, 2008; Volume 11, pp. 92–93. [Google Scholar]
  29. Araújo, E.F.D.; Queiroz, L.P.D.; Machado, M.A. What is Citrus? Taxonomic implications from a study of cp-DNA evolution in the tribe Citreae (Rutaceae subfamily Aurantioideae). Org. Divers. Evol. 2003, 3, 55–62. [Google Scholar]
  30. Khalvashi, N.; Memarne, G. Morphological peculiarities of the genus Fortunella swingle and perspectives of its application. Mod. Phytomorphology 2014, 6, 221–224. [Google Scholar]
  31. Xu, S.-R.; Zhang, Y.-Y.; Liu, F.; Tian, N.; Pan, D.-M.; Bei, X.-J.; Cheng, C.-Z. Characterization of the complete chloroplast genome of the Hongkong kumquat (Fortunella hindsii Swingle). Mitochondrial. Dna. Part B 2019, 4, 2612–2613. [Google Scholar] [CrossRef] [Green Version]
  32. Wu, X.-X.; Tang, Y.; Deng, C.-L. Progress on study of Citrus palynology. South China Fruits 2017, 46, 148–153. [Google Scholar]
  33. Doyle, J.J.; Doyle, J.L. A rapid DNA isolation procedure for small quantities of fresh leaf tissue. Phytochem. Bull. 1987, 19, 11–15. [Google Scholar]
  34. Andrews, S. FastQC: A Quality Control Tool for High Throughput Sequence Data. 2013. Available online: https://www.bioinformatics.babraham.ac.uk/projects/fastqc/ (accessed on 7 April 2021).
  35. Jin, J.-J.; Yu, W.-B.; Yang, J.-B.; Song, Y.; dePamphilis, C.W.; Yi, T.-S.; Li, D.-Z. GetOrganelle: A fast and versatile toolkit for accurate de novo assembly of organelle genomes. Genome Biol. 2020, 21, 241. [Google Scholar] [CrossRef]
  36. Camacho, C.; Coulouris, G.; Avagyan, V.; Ning, M.; Papadopoulos, J.; Bealer, K.; Madden, T.L. BLAST+: Architecture and applications. BMC Bioinform. 2009, 10, 421. [Google Scholar] [CrossRef] [PubMed] [Green Version]
  37. Bankevich, A.; Nurk, S.; Antipov, D.; Gurevich, A.A.; Dvorkin, M.; Kulikov, A.S.; Lesin, V.M.; Nikolenko, S.I.; Pham, S.; Prjibelski, A.D.; et al. SPAdes: A new genome assembly algorithm and its applications to single-cell sequencing. J. Comput. Biol 2012, 19, 455–477. [Google Scholar] [CrossRef] [PubMed] [Green Version]
  38. Langmead, B.; Salzberg, S.L. Fast gapped-read alignment with Bowtie 2. Nat. Methods 2012, 9, 357–359. [Google Scholar] [CrossRef] [PubMed] [Green Version]
  39. Wick, R.R.; Schultz, M.B.; Zobel, J.; Holt, K.E. Bandage: Interactive visualization of de novo genome assemblies: Figure 1. Bioinformatics 2015, 31, 3350–3352. [Google Scholar] [CrossRef] [Green Version]
  40. Qu, X.-J.; Moore, M.J.; Li, D.-Z.; Yi, T.-S. PGA: A software package for rapid, accurate, and flexible batch annotation of Plastomes. Plant Methods 2019, 15, 50. [Google Scholar] [CrossRef] [Green Version]
  41. Lohse, M.; Drechsel, O.; Bock, R. OrganellarGenomeDRAW(OGDRAW): A tool for the easy generation of high-quality custom graphical maps of plastid and mitochondrial genomes. Curr. Genet. 2007, 52, 267–274. [Google Scholar] [CrossRef] [PubMed]
  42. Lohse, M.; Drechsel, O.; Kahlau, S.; Bock, R. OrganellarGenomeDRAW—A suite of tools for generating physical maps of plastid and mitochondrial genomes and visualizing expression data sets. Nucleic Acids Res. 2013, 41, W575–W581. [Google Scholar] [CrossRef]
  43. Kurtz, S.; Choudhuri, J.V.; Ohlebusch, E.; Schleiermacher, C.; Stoye, J.; Giegerich, R. REPuter: The manifold applications of repeat analysis on a genomic scale. Nucleic Acids Res. 2001, 29, 4633–4642. [Google Scholar] [CrossRef] [PubMed] [Green Version]
  44. Benson, G. Tandem repeats finder: A program to analyze DNA sequences. Nucleic Acids Res. 1999, 27, 573–580. [Google Scholar] [CrossRef] [Green Version]
  45. Thiel, T.; Michalek, W.; Varshney, R.; Graner, A. Exploiting EST databases for the development and characterization of gene-derived SSR-markers in barley (Hordeum vulgare L.). Theor. Appl. Genet. 2003, 106, 411–422. [Google Scholar] [CrossRef]
  46. Beier, S.; Thiel, T.; Munch, T.; Scholz, U.; Mascher, M. MISA-web: A web server for microsatellite prediction. Bioinformatics 2017, 33, 2583–2585. [Google Scholar] [CrossRef] [PubMed] [Green Version]
  47. Stothard, P. The Sequence Manipulation Suite: JavaScript programs for analyzing and formatting protein and DNA sequences. Biotechniques 2000, 28, 1102–1104. [Google Scholar] [CrossRef] [PubMed] [Green Version]
  48. Tamura, K.; Stecher, G.; Peterson, D.; Filipskj, A.; Kumar, S. MEGA6: Molecular evolutionary genetics analysis version 6.0. Mol. Biol. Evol. 2013, 30, 2725–2729. [Google Scholar] [CrossRef] [Green Version]
  49. Mayor, C.; Brudno, M.; Schwartz, J.R.; Poliakov, A.; Rubin, E.M.; Frazer, K.A.; Pachter, L.S.; Dubchak, I. VISTA: Visualizing global DNA sequence alignments of arbitrary length. Bioinformatics 2000, 16, 1046–1047. [Google Scholar] [CrossRef] [Green Version]
  50. Frazer, K.A.; Pachter, L.; Poliakov, A.; Rubin, E.M.; Dubchak, I. VISTA: Computational tools for comparative genomics. Nucleic Acids Res. 2004, 32, W273–W279. [Google Scholar] [CrossRef]
  51. Amiryousefi, A.; Hyvönen, J.; Poczai, P. IRscope: An online program to visualize the junction sites of chloroplast genomes. Bioinformatics 2018, 34, 3030–3031. [Google Scholar] [CrossRef]
  52. Librado, P.; Rozas, J. DnaSP v5: A software for comprehensive analysis of DNA polymorphism data. Bioinformatics 2009, 25, 1451–1452. [Google Scholar] [CrossRef] [PubMed] [Green Version]
  53. Zhang, D.; Gao, F.-L.; Jakovlić, I.; Zou, H.; Zhang, J.; Li, W.X.; Wang, G.T. PhyloSuite: An integrated and scalable desktop platform for streamlined molecular sequence data management and evolutionary phylogenetics studies. Mol. Ecol. Resour. 2020, 20, 348–355. [Google Scholar] [CrossRef] [PubMed]
  54. Yang, Z.-H. PAML 4: Phylogenetic analysis by maximum likelihood. Mol. Biol. Evol 2007, 24, 1586–1591. [Google Scholar] [CrossRef] [Green Version]
  55. Gao, F.-L.; Chen, C.-J.; Arab, D.A.; Du, Z.-G.; He, Y.-H.; Ho, S.Y.W. EasyCodeML: A visual tool for analysis of selection using CodeML. Ecol. Evol. 2019, 9, 3891–3898. [Google Scholar] [CrossRef] [PubMed] [Green Version]
  56. Rambaut, A. FigTree v1.4.4. Institute of Evolutionary Biology; University of Edinburgh: Edinburgh, UK, 2018. [Google Scholar]
  57. Buschiazzo, E.; Ritland, C.; Bohlmann, J.; Ritland, K. Slow but not low: Genomic comparisons reveal slower evolutionary rate and higher dN/dS in conifers compared to angiosperms. BMC Evol. Biol. 2012, 12, 8. [Google Scholar] [CrossRef] [PubMed] [Green Version]
  58. Su, H.-J.; Hogenhout, S.A.; Al-Sadi, A.M.; Kuo, C.-H. Complete Chloroplast Genome Sequence of Omani Lime (Citrus aurantiifolia) and Comparative Analysis within the Rosids. PLoS ONE 2014, 9, e113049. [Google Scholar] [CrossRef] [PubMed] [Green Version]
  59. Bausher, M.G.; Singh, N.D.; Lee, S.B.; Jansen, R.K.; Daniell, H. The complete chloroplast genome sequence of Citrus sinensis (L.) Osbeck var ‘Ridge Pineapple’: Organization and phylogenetic relationships to other angiosperms. BMC Plant Biol. 2006, 6, 21. [Google Scholar] [CrossRef] [Green Version]
  60. Ni, Z.-X.; Ye, Y.-J.; Bai, T.-D.; Xu, M.; Xu, L.-A. Complete Chloroplast Genome of Pinus massoniana (Pinaceae): Gene Rearrangements, Loss of ndh Genes, and Short Inverted Repeats Contraction, Expansion. Molecules 2017, 22, 1528. [Google Scholar] [CrossRef] [PubMed] [Green Version]
  61. Liu, Y.; Qamar, M.T.; Feng, J.-W.; Ding, Y.-D.; Wang, S.; Wu, G.-Z.; Ke, L.-J.; Xu, Q.; Chen, L.-L. Comparative analysis of miniature inverted–repeat transposable elements (MITEs) and long terminal repeat (LTR) retrotransposons in six Citrus species. BMC Plant Biol. 2019, 19, 140. [Google Scholar] [CrossRef] [PubMed]
  62. Kanamoto, H.; Yoshimura, H.; Tomizawa, K.-I.; Kitajima, S.; Ujihara, T.; Matsuda, Y.; Sugimura, Y. Sequence variation in the rbcL-accD region in the chloroplast genome of Moraceae. Plant Biotechnol. 2005, 22, 231. [Google Scholar]
  63. Zheng, X.-M.; Wang, J.-R.; Feng, L.; Liu, S.; Pang, H.-B.; Qi, L.; Li, J.; Sun, Y.; Qiao, W.-H.; Zhang, L.-F.; et al. Inferring the evolutionary mechanism of the chloroplast genome size by comparing whole-chloroplast genome sequences in seed plants. Sci. Rep. 2017, 7, 1555. [Google Scholar]
  64. Cavalier-Smith, T. Chloroplast evolution: Secondary symbiogenesis and multiple losses. Curr. Biol. 2002, 12, R62–R64. [Google Scholar] [CrossRef] [Green Version]
  65. Yi, X.; Gao, L.; Wang, B.; Su, Y.J.; Wang, T. The complete chloroplast genome sequence of Cephalotaxus oliveri (Cephalotaxaceae): Evolutionary comparison of Cephalotaxus chloroplast DNAs and insights into the loss of inverted repeat copies in gymnosperms. Genome Biol. Evol. 2013, 5, 688–698. [Google Scholar] [CrossRef] [Green Version]
  66. Levinson, G.; Gutman, G.A. Slipped-strand mispairing: A major mechanism for DNA sequence evolution. Mol. Biol. Evol. 1987, 4, 203–221. [Google Scholar]
  67. Cheng, Y.-J.; Guo, W.-W.; Deng, X.-X. cpSSR: A New Tool to Analyze Chloroplast Genome of Citrus Somatic Hybrids. J. Integr. Plant Biol. 2003, 45, 906–909. [Google Scholar]
  68. Wang, H.-K.; Lou, X.-M.; Zhang, Z. Application in germplasm resource research using chloroplast simple sequence repeat. MPB 2006, S1, 92–98. [Google Scholar]
  69. Zhou, S.; Dong, W.; Chen, X.; Zhang, X.; Wen, J.; Schneider, H. How many species of bracken (Pteridium) are there? Assessing the Chinese brackens using molecular evidence. Taxon 2014, 63, 509–521. [Google Scholar] [CrossRef]
  70. Qi, W.-C.; Lin, F.; Liu, Y.-H.; Huang, B.-Q.; Cheng, J.-H.; Zhang, W.; Zhao, H. High-throughput development of simple sequence repeat markers for genetic diversity research in Crambe abyssinica. BMC Plant Biol. 2016, 16, 139. [Google Scholar] [CrossRef] [PubMed] [Green Version]
  71. Yu, J.; Komivi, D.; Wang, L.; Zhang, Y.; Wei, X.; Liao, B.; Zhang, X. PMDBase: A database for studying microsatellite DNA and marker development in plants. Nucleic Acids Res. 2017, 45, D1046–D1053. [Google Scholar] [CrossRef] [Green Version]
  72. Chai, S.-F.; Chen, Z.-G.; Hong, C.-X. Construction and Optimization of ISSR Reaction System of Medicinal Rutaceae Plants. J. Anhui Agric. Sci. 2008, 36, 14433–14435. [Google Scholar]
  73. Powell, W.; Morgante, M.; McDevitt, R.; Vendramin, G.G.; Rafalski, J.A. Polymorphic simple sequence repeats regions in chloroplast genomes: Applications to the population genetics of Pines. Proc. Natl. Acad. Sci. USA 1995, 92, 7759–7763. [Google Scholar] [CrossRef] [PubMed] [Green Version]
  74. Shapiro, J.A.; Sternberg, R. von. Why repetitive DNA is essential to genome function. Biol. Rev. Camb. Philos. Soc. 2005, 80, 227–250. [Google Scholar] [CrossRef] [Green Version]
  75. Axel, C.; Romain, K.; Julien, M. The 3D folding of metazoan genomes correlates with the association of similar repetitive elements. Nucleic Acids Res. 2016, 44, 245–255. [Google Scholar]
  76. Kuang, D.-Y.; Wu, H.; Wang, Y.-L.; Gao, L.-M.; Zhang, S.-Z.; Lu, L. Complete chloroplast genome sequence of Magnolia kwangsiensis (Magnoliaceae): Implication for DNA barcoding and population genetics. Genome 2011, 54, 663–673. [Google Scholar] [CrossRef] [Green Version]
  77. Asaf, S.; Khan, A.L.; Khan, M.A.; Waqas, M.; Kang, S.-M.; Yun, B.-W.; Lee, I.J. Chloroplast genomes of Arabidopsis halleri ssp. gemmifera and Arabidopsis lyrata ssp. petraea: Structures and comparative analysis. Sci. Rep. 2017, 7, 7556. [Google Scholar] [CrossRef] [Green Version]
  78. Yu, X.; Tan, W.; Zhang, H.; Gao, H.; Wang, W.; Tian, X. Complete Chloroplast Genomes of Ampelopsis humulifolia and Ampelopsis japonica: Molecular Structure, Comparative Analysis, and Phylogenetic Analysis. Plants 2019, 8, 410. [Google Scholar] [CrossRef] [PubMed] [Green Version]
  79. Huang, J.; Yu, Y.; Liu, Y.-M.; Xie, D.-F.; He, X.-J.; Zhou, S.-D. Comparative Chloroplast Genomics of Fritillaria (Liliaceae), Inferences for Phylogenetic Relationships between Fritillaria and Lilium and Plastome Evolution. Plants 2020, 9, 133. [Google Scholar] [CrossRef] [PubMed] [Green Version]
  80. Morton, B.R. The role of context-dependent mutations in generating compositional and codon usage bias in grass chloroplast DNA. J. Mol. Evol. 2003, 56, 616–629. [Google Scholar] [CrossRef] [PubMed]
  81. Wang, L.; Xing, H.; Yuan, Y.; Wang, X.; Muhammad, S.; Tao, J.; Wei, F.; Zhang, G.; Song, X.; Sun, X. Genome- wide analysis of codon usage bias in four sequenced cotton species. PLoS ONE 2018, 13, e0194372. [Google Scholar] [CrossRef] [Green Version]
  82. Sharp, P.M.; Li, W.-H. The codon adaptation index-a measure of directional synonymous codon usage bias, and its potential applications. Nucleic Acids Res. 1987, 15, 1281–1295. [Google Scholar] [CrossRef] [Green Version]
  83. Jose, C.C.; Roberto, A.; Victoria, I.; Javier, T.; Manuel, T.; Joaquin, D. A Phylogenetic Analysis of 34 Chloroplast Genomes Elucidates the Relationships between Wild and Domestic Species within the Genus Citrus. Mol. Biol. Evol. 2015, 32, 2015–2035. [Google Scholar]
  84. Wang, W.-C.; Chen, S.-Y.; Zhang, X.-Z. Whole-Genome Comparison Reveals Divergent IR Borders and Mutation Hotspots in Chloroplast Genomes of Herbaceous Bamboos (Bambusoideae: Olyreae). Molecules 2018, 23, 1537. [Google Scholar] [CrossRef] [Green Version]
  85. Li, D.-M.; Ye, Y.-J.; Xu, Y.-C.; Liu, J.-M.; Zhu, G.-F. Complete chloroplast genomes of Zingiber montanum and Zingiber zerumbet: Genome structure, comparative and phylogenetic analyses. PLoS ONE 2020, 15, e0236590. [Google Scholar] [CrossRef]
  86. Wu, J.-W.; Liu, F.; Tian, N.; Liu, J.-P.; Shi, X.-B.; Bei, X.-J.; Cheng, C.-Z. Characterization of the complete chloroplast genome of Fortunella Crassifolia Swingle and phylogenetic relationships. Mitochondrial DNA Part B 2019, 4, 3538–3539. [Google Scholar] [CrossRef] [PubMed] [Green Version]
Figure 1. Gene map of the Fortunella venosa chloroplast genome. Genes drawn inside the circle are transcribed clockwise, and those outside are transcribed counterclockwise. Genes belonging to different functional groups are color coded. The darker gray color in the inner circle corresponds to the GC content, and the lighter gray color corresponds to the AT content.
Forests 12 00996 g001
Figure 2. Comparison of repeated sequences in ten Rutaceae chloroplast genomes (Type and abundance of long repetitive sequences). Note: C represents complementary repeats, F represents Forward repeats, R represents reverse repeats, P represents palindromic repeats.
Forests 12 00996 g002
Figure 3. Analysis of SSRs in Fortunella venosa chloroplast genomes. (Type and abundance of SSRs).
Forests 12 00996 g003
Figure 4. Analysis of SSRs in ten Rutaceae chloroplast genomes. (The number of different SSRs detected in 10 genomes). The Mono-, Di-, Tri-, Tetra-, Penta-, and Hexa- represents the nucleotide motifs of the SSRs present in the 10 species genome.
Forests 12 00996 g004
Figure 5. Analysis of SSRs in Fortunella venosa chloroplast genomes (frequency of identified SSRs in LSC, SSC, and IR regions). The Mono-, Di-, Tri-, Tetra-, Penta-, and Hexa- represents the nucleotide motifs of the SSRs present in the F. venosa genome.
Forests 12 00996 g005
Figure 6. DNA sequence comparison of the ten species of Rutaceae. VISTA-based identity plot showing sequence identity among ten Rutaceae species using Fortunella venosa as a reference.
Forests 12 00996 g006
Figure 7. Comparison of border distances between adjacent genes and junctions of LSC, SSC, and two IR regions among chloroplast genomes of the ten Rutaceae species. Boxes above or below the main line indicate the adjacent border genes. The figure is not to scale with regard to sequence length and only shows relative changes at or near IR/SC borders.
Forests 12 00996 g007
Figure 8. Nucleotide diversity of different regions of Rutaceae chloroplast genome (horizontal axis represents the midpoint of the window, and vertical axis represents the nucleotide diversity of the window Pi).
Forests 12 00996 g008
Figure 9. Phylogenetic tree generation using 76 CDS common in 27 Rutaceae species. Melia azedarach were used as outgroups. The numbers above the branch represent bootstrap support value for BI/ML/PhyML methods, where the asterisk signifies maximum support value of 100 in IQ and 1 BI. Blank branches signify 100% support value.
Forests 12 00996 g009
Figure 10. Phylogenetic trees based on BI of Rutaceae species based on whole chloroplast genome sequences, with one species from family Melia used as outgroup. The Bayesian inference (BI) tree with posterior probabilities values on the branches.
Forests 12 00996 g010
Figure 11. Main morphological forms of Fortunella japonica and F. venosa. (A). F. japonica; (B). F. venosa. 1. Plants and habitats; 2. Branches; 3. Leaves; 4. Flowers; 5. Fruit branches; 6. Fruits and fruits cross-cut.
Forests 12 00996 g011
Table 1. Summary of complete chloroplast genomes for ten Rutaceae species.
Species/TaxaFortunella venosaFortunella japonicaCitrus aurantifoliaCitrus aurantiumCitrus hongheensisCitrus cavalerieiCitrus limonCitrus maximaCitrus medicaCitrus sinensis
Accession
number
MZ457935MN495932KJ865401MT702983MT880607MT880606MT880608MN782007MT106673DQ864733
Total Number of Genes134135138132135135135125134134
GenomeTotal GC content (%)38.438.438.438.538.538.538.538.538.438.5
Total Length(bp)160,265160,229159,893160,140160,275160,996160,141160,186160,031160,129
CDSnumber89909387898989888989
Length(bp)79,98380,56881,36380,09779,50980,09779,50979,97180,37079,971
GC (%)38.938.83938.838.938.838.938.83938.8
tRNAnumber37373737373737373737
Length(bp)2790279228022793279227922792280028022802
GC (%)53.353.353.353.353.453.353.453.353.253.3
rRNA number8888888888
Length(bp)9044904890489044904890509048904690489048
GC (%)55.755.755.755.755.755.755.755.755.755.7
Table 2. Genes present and functional gene category in F. venosa chloroplast genome.
Category Group of GenesName of Genes
Self-replicationRibosomal protein (LSU) * rpl2, rpl14, * rpl16, rpl20, rpl22, rpl23, rpl33, rpl32, rpl36
Ribosomal proteins (SSU) rps2, rps3, rps4, rps7, rps8, rps11, * rps12, rps14, rps15, * rps16, rps18, rps19
DNA-dependent RNA polymeraserpoA, rpoB, * rpoC1, rpoC2
rRNA genesrrn4.5, rrn5, rrn16, rrn23
tRNA genes* trnA-UGC, trnC-GCA, trnD-GUC, trnE-UUC, trnF-GAA, trnfM-CAU,
trnG-GCC, * trnG-UCC, trnH-GUG, trnI-CAU, * trnI-GAU, trnK-UUU,
trnL-CAA, * trnL-UAA, trnL-UAG, trnM-CAU, trnN-GUU, trnP-UGG,
trnQ-UUG, trnR-ACG, trnR-UCU, trnS-GCU, trnS-GGA, trnS-UGA, trnT-GGU,
trnT-UGU, trnV-GAC, * trnV-UAC, trnW-CCA, trnY-GUA
PhotosynthesisPhotosystem I psaA, psaB, psaC, psaI, psaJ
Photosystem IIpsbA, psbB, psbC, psbD, psbE, psbF, psbH, psbI, psbJ, psbK, psbL, psbM,
psbN, psbT, psbZ
NADPH dehydrogenase* ndhA, * ndhB, ndhC, ndhD, ndhE, ndhF, ndhG, ndhH, ndhI, ndhJ, ndhK
ATP synthase atpA, atpB, atpE, * atpF, atpH, atpI
Cytochrome c-type synthesispetA, * petB, * petD, petG, petL, petN
RubiscorbcL
Other genes Maturase matK
Cytochrome c-type synthesisccsA
Carbon metabolismcemA
Fatty acid synthesisaccD
Transfer initiation factor infA
Proteolysis** clpP
unknownConserved open reading framesycf1, ycf2, ** ycf3, ycf4, ycf68, ycf15
* Genes have one intron. ** Genes have two introns.
Table 3. Analysis of relative synonymous codon usage (RSCU)in Fortunella venosa chloroplast genome.
CodonCountRSCUCodonCountRSCUCodonCountRSCUCodonCountRSCU
UUU(F)9751.27UCU(S)5511.6UAU(Y)7741.59UGU(C)2331.48
UUC(F)5560.73UCC(S)3431UAC(Y)1970.41UGC(C)820.52
UUA(L)8321.76UCA(S)3841.12UAA (*)511.72UGA (*)150.51
UUG(L)5861.24UCG(S)2430.71UAG (*)230.78UGG(W)4551
CUU(L)5901.24CCU(P)4071.45CAU(H)4611.43CGU(R)3211.15
CUC(L)2220.47CCC(P)2430.87CAC(H)1830.57CGC(R)1310.47
CUA(L)3950.83CCA(P)3211.14CAA(Q)7061.53CGA(R)3861.38
CUG(L)2190.46CCG(P)1520.54CAG(Q)2150.47CGG(R)1530.55
AUU(I)10711.47ACU(T)5281.56AAU(N)9611.51AGU(S)3981.16
AUC(I)4610.63ACC(T)2640.78AAC(N)3130.49AGC(S)1470.43
AUA(I)6510.89ACA(T)3911.16AAA(K)10411.47AGA(R)4931.77
AUG(M)6321ACG(T)1680.5AAG(K)3710.53AGG(R)1890.68
GUU(V)5271.45GCU(A)6261.71GAU(D)8481.58GGU(G)5521.2
GUC(V)1810.5GCC(A)2480.68GAC(D)2260.42GGC(G)1980.43
GUA(V)5361.48GCA(A)3901.07GAA(E)10161.47GGA(G)6981.52
GUG(V)2090.58GCG(A)2000.55GAG(E)3660.53GGG(G)3940.86
* represents the stop codons.
Table 4. Positively selected sites detected in the chloroplast genome of Rutaceae based of Bayes empirical Bayes (BEB) method.
Gene NameM8
Selected SitesPr (w > 1)
ndhB4084R0.990 **
ndhI6657M1.000 **
6658S1.000 **
psbZ11729L0.990 **
rpoC216680Y0.999 **
16682C0.999 **
16683I0.999 **
16703T0.998 **
16705R0.991 **
16706A0.998 **
16714G0.998 **
16725Y0.997 **
rps1817492N0.999 **
rps1917529A0.990 **
rps217766Y1.000 **
** p < 0.01.
Publisher’s Note: MDPI stays neutral with regard to jurisdictional claims in published maps and institutional affiliations.

