Article

A Stand-Level Comparison of Carbon and Nitrogen Distribution in an Exotic Japanese Cedar Plantation and a Natural Oak Stand

1
Department of Forest Resources, Gyeongsang National University, Jinju 52725, Korea
2
Forest Biomaterials Research Center, National Institute of Forest Science, Jinju 52817, Korea
*
Author to whom correspondence should be addressed.
Forests 2021, 12(8), 963; https://doi.org/10.3390/f12080963
Submission received: 11 May 2021 / Revised: 18 July 2021 / Accepted: 20 July 2021 / Published: 21 July 2021
(This article belongs to the Special Issue Carbon and Nutrient Accumulation and Decomposition in Forests)

Abstract

:
This study compared carbon (C) and nitrogen (N) distribution at a stand level in an exotic Japanese cedar (Cryptomeria japonica D. Don) plantation and a natural Serrata oak (Quercus serrata Murray) stand growing under similar site conditions in South Korea. The aboveground biomass (stems, branches, and leaves) of 20 trees (10 of each species), the forest floor, and the mineral soils to a depth of 30 cm were sampled to determine C and N concentrations. Except in branches, C concentrations were significantly higher (p < 0.05) in the Japanese cedar plantation than in the Serrata oak stand, whereas N concentrations, except in the stem bark, were significantly lower in the Japanese cedar plantation. Reforestation with an exotic coniferous species significantly increased the C stocks in the aboveground biomass and the N stocks in the forest floor and mineral soils compared with a natural oak stand. The N stocks in the aboveground biomass were dependent on either the N concentrations or the C stocks in the tree components, whereas soil C and N stocks were negatively related to soil fertility parameters such as C/N ratio. Although it is uncertain which factors are responsible for the difference in aboveground C and soil N stocks following the establishment of Japanese cedar plantations on former natural Serrata oak stands, tree replacement may have an impact on C and N allocation within different forest compartments.

1. Introduction

Quantitative evaluation of carbon (C) and nitrogen (N) stocks in forests is important because of the role of C sequestration in mitigating global climate change and sustainable forest productivity. Consequently, estimates of C and N stocks in forests have been made at global, national, regional, landscape, and stand scales [1,2,3,4,5]. The role of C and N stocks in forests is likely to vary on a stand scale because nutrient conversion rates and allocation mechanisms differ between tree species [1,6,7]. Several studies have reported the influence of tree species on the possible factors driving C and N stocks in trees, forest floor, and mineral soils [1,3,7]. The variability in C/N ratio, C, and N stocks at a stand scale can be closely linked with tree species composition as both above- and belowground litter inputs may differ by the tree species planted within the same site [3,6]. For instance, C in soil organic matter is the energy source of microbes involved in N transformation such as N mineralization and immobilization processes, which seem to be dependent on tree species [6]. Thus, the C cycle is tightly connected to the N cycle in forest stands [6]. However, it is uncertain which factors are responsible for the differences in soil C and N stocks on a stand scale. In addition, other factors such as tree biomass, site conditions, and forest management practices can result in variation of C and N stocks on a stand scale [2,4,8].
Carbon and N stocks in forests can change after plantation establishment on natural forest sites [9,10]. For example, the total ecosystem C stocks in plants and soils using a meta-analysis approach were found to be 28% lower in plantations than in natural forests [11]. This difference can be attributed to greater net primary production, litterfall, fine root, higher rates of soil respiration, soil C concentration, and more soil available N nutrients in natural forests than in the plantations [11]. However, why plantations sequester less C and N is unclear, although it is known that the conversion of secondary forests to plantations has resulted in a soil fertility decline in subtropical regions [11].
Japanese cedar (Cryptomeria japonica D. Don) which was introduced from Japan in the early 1900s, is an important exotic coniferous tree species that has been used for reforestation in South Korea over the last forty years [5]. Japanese cedar plantations in South Korea are generally established on foot slopes or valley bottoms with good moisture and fertility. The growth in terms of both diameter and height in Japanese cedar between exotic planting tree species was better than that in Japanese cypress (Chamaecyparis obtuse S. et Z.) grown under similar site conditions [12]. Thus, Japanese cedar is a potentially important timber resource in this country. Natural broadleaved Serrata oak (Quercus serrata Murray) is one of the dominant types of oak. The total area and stand volume examined in 2015 were 14,000 ha and 4,850,000 m3 for Japanese cedar and 38,000 ha and 4,783,000 m3 for Serrata oak, respectively [5].
Although many studies have investigated the effect of forest type on C and N stocks [4,8,13], major uncertainties at a stand level remain about the effect on C and N stocks after regeneration of exotic coniferous trees from natural broadleaved forests. Such conversions of natural broadleaved forests into coniferous plantations have been increasing worldwide over the past half-century [14]. In addition, the Korea Forestry Service has presented its plans to plant three billion trees over the next 30 years as a part of the forestry sector plan to achieve carbon neutrality by 2050. Korean red pine and other native trees with low carbon absorption capacity might have been replaced by other exotic tree species during these periods [15].
The objective of this study was (1) to compare the C and N distribution in the aboveground tree biomass, forest floor, and mineral soils of an exotic coniferous plantation and a natural oak stand growing under similar site conditions, (2) to evaluate factors (C and N concentration, and C/N ratio) related to in C and N stocks after the plantation establishment.

2. Materials and Methods

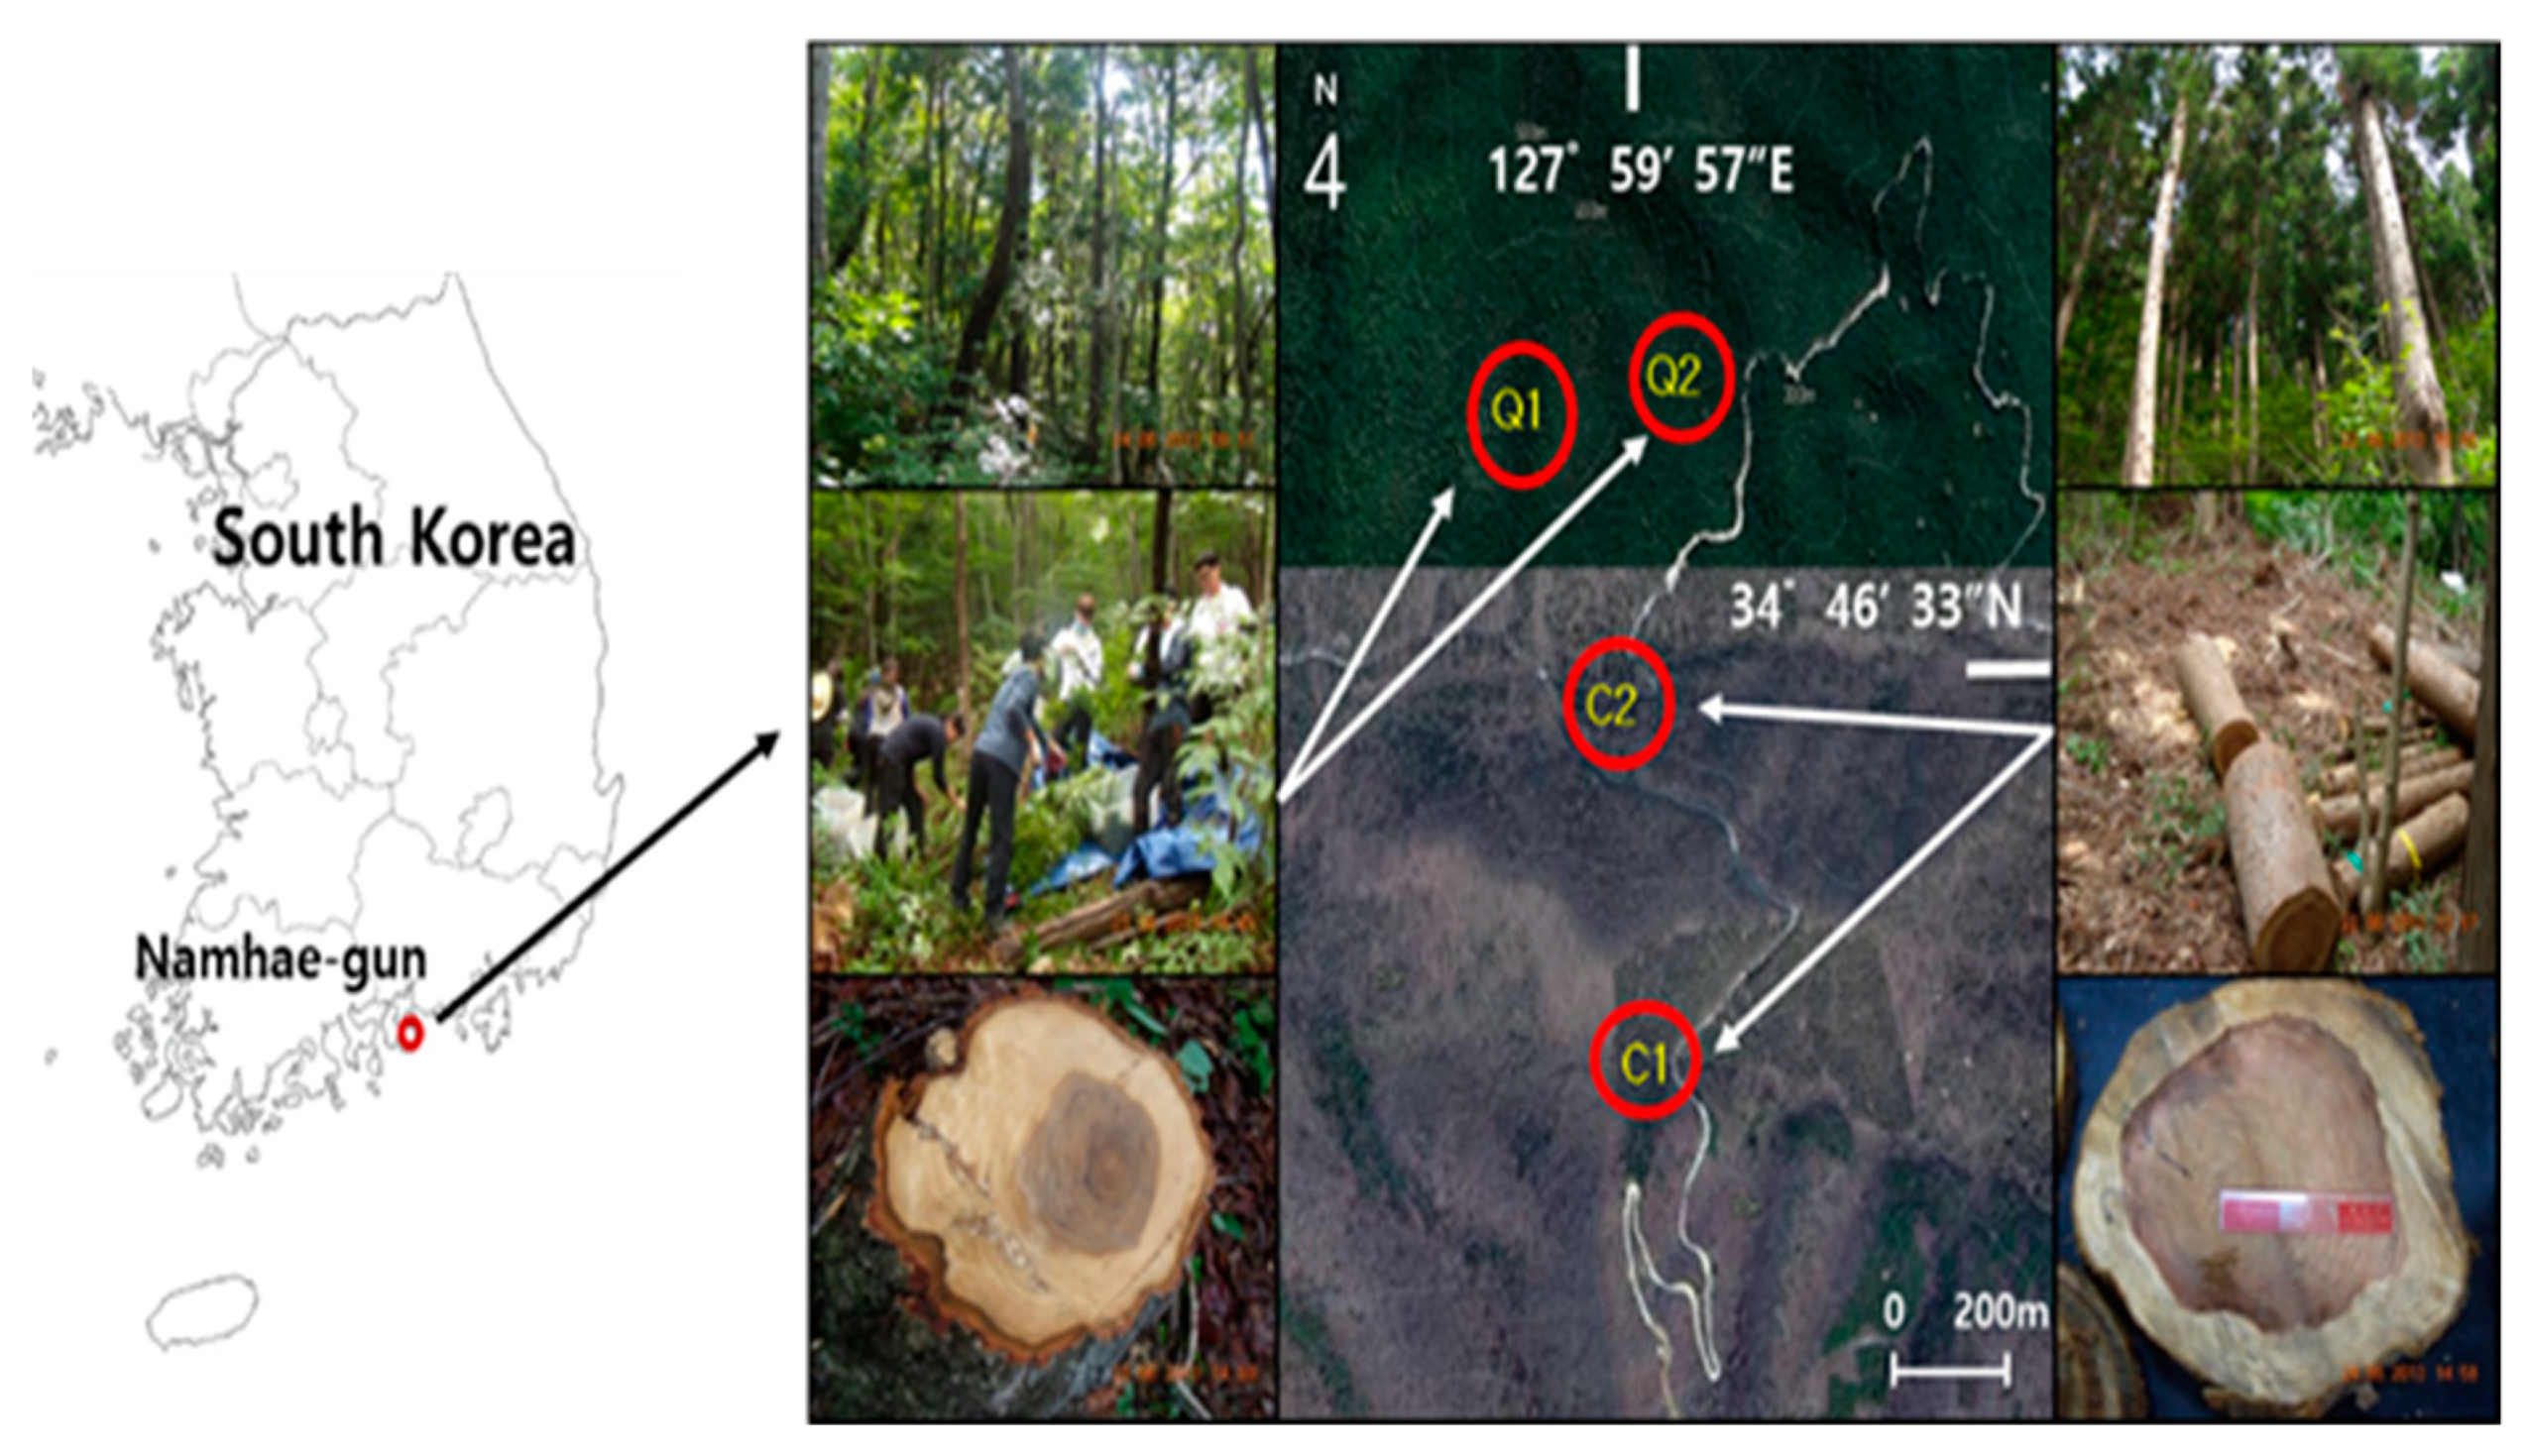
2.1. Stand Characteristics

The study was conducted in the Namhae National Forest located in Namhae-gun, Gyeongsangnam-do, southern Korea. The mean annual precipitation in this area is 1839 mm year−1, and the mean annual temperature is 14.1 °C. The soil is a well-drained slightly dry or wet brown forest soil (Inceptisol, USDA soil taxonomy) originating from granite, with a loamy and acidic property of pH 4.53–4.63 [16]. Study plots were located in a Japanese cedar plantation and an adjacent natural Serrata oak stand (Figure 1). The plantation was established after clearcutting of natural Serrata oak stands 48 years ago prior to this study. The dominant understory species in the Japanese cedar plantation included Zanthoxylum schinifolium S. et Z., Smilax china L., Aralia elata Seem, Lindera glauca Blume, Morus mongolica C.K. Schied., Callicarpa japonica Thunb., Toxicodendron trichocarpum Kuntze, Lindera erythrocarpa Makino, and Cornus controversa Hemsl. Ex Prain. The dominant understory species in the Serrata oak stand included Prunus sargentii Rehder, Smilax china L., Cornus kousa F. Buerger ex Hance, Lindera glauca Blume, Smilax china L., Fraxinus sieboldiana Blume, and Quercus variabilis Blume.

2.2. Carbon and Nitrogen Stocks in the Aboveground Tree Biomass

The study design consisted of six 20 m × 10 m plots with two blocks located in each stand type. Each block has three replicated plots. To measure the C and N stocks in the aboveground tree biomass and develop nutrient content equations for each of the tree components, five trees per block of Japanese cedar (total: 10 trees) and Serrata oak (total: 10 trees), representing the diameter at breast height (DBH) range of the stand, were destructively sampled on 23 and 26 June 2013. Each sample tree was cut 20 cm above the ground and separated into its components (stem, branches, and leaves). Each tree component was weighed in the field using portable electronic balances. All sampling procedures were carried out in accordance with the technical standards formulated by the Korea Forest Research Institute [17].
The subsamples of each tree component were oven-dried at 85 °C for one week, then ground in a Wiley mill, and passed through a 40-mesh stainless steel sieve. Carbon and N concentrations in the ground materials were determined for each tree component using an elemental analyzer (Thermo Fisher Scientific Flash 2000, Milan, Italy). Although tree samples are usually oven-dried at 65 °C for the N concentration, drying wood samples at higher temperatures does not affect their N concentration [18]. The C and N concentrations were multiplied by the dry weights of the aboveground components to calculate the C and N content in each tree component.
Allometric equations were developed for each of the tree components (stem wood, stem bark, branches, and leaves) using the standard equation: log10y = a + b × log10(DBH), where y is the C and N content of the respective tree component, DBH is the diameter at breast height, and a and b are regression coefficients. DBH was used as the primary variable to the C and N contents because DBH can be measured accurately as a variable for the prediction of tree C and N stocks [4,19].

2.3. Carbon and Nitrogen Stocks in the Forest Floor and Mineral Soils

The forest floor samples were collected at the same time as the tree samples from three random points in each plot using a 900 cm2 steel quadrat (30 cm × 30 cm). Forest floor samples consisted of needles with twigs (C. japonica), broadleaves (Q. serrata), a small branches piece (<2 cm), barks, and miscellaneous parts (e.g., reproduction fragments). Collected samples were placed in zipper paper, oven-dried at 65 °C, ground in a Wiley mill, and passed through a 40-mesh stainless sieve. Analysis of the C and N concentrations in the forest floor samples followed the same procedure used for tree C and N analysis. The C and N stocks in the forest floor were calculated by multiplying the C and N concentrations by the dry weight of the forest floor samples.
Soil samples underlying the forest floor sampling point were collected from three randomly selected points in each plot. At each point, a soil pit of 50 cm × 50 cm was excavated to collect soil samples at three depths (0–10 cm, 10–20 cm, and 20–30 cm). Two soil samples were collected at each soil depth using 400 cm3 stainless steel cans. One of the two soil samples was used to determine bulk density after drying at 105 °C for 24 h. The other one was air-dried and put pass through a 2 mm sieve to measure the amount of coarse fragments larger than 2 mm. The sieved soil samples were ground, passed through a 40-mesh (0.425 mm) stainless steel sieve, and an elemental analyzer (vario MACRO cube, Elementar Analysensysteme GmbH, Germany) was used to determine the C and N concentrations in the soil.
Soil C and N stocks at each soil depth were calculated using the following formula (Equation (1)):
NS = ∑NUi × BDi × Di × (1 − Fi/100)
where NS represents the C and N stocks (kg ha1) at each soil depth (i), NUi is the concentration (mg kg1) of soil C and N at each soil depth, BDi is the bulk density (g cm−3) at each soil depth, Di is the soil depth (cm), and Fi is the volumetric coarse fragment content (% by volume) at each soil depth.
In order to analyze soil chemical properties, soil P concentration, extracted by NH4F and HCl solutions [20], was determined using a UV spectrophotometer (Jenway 6505, Staffordshire, UK). Exchangeable K, Ca, and Mg concentrations, extracted by an NH4Cl solution [20] with a mechanical vacuum extractor (Model 24VE, SampleTek, Science Hill, KY, USA) were determined using ICP-OES (Perkin Elmer Optima 5300DV, Shelton, CT, USA).

2.4. Data Analysis

The accuracy of the allometric equations was evaluated using the coefficient of determination (R2) and root mean square error (RMSE). Bias correction factors (CF) in the logarithmic transformation were calculated using the standard error of the estimate [21]. All data were checked for normality using the Shapiro–Wilk test. Means with checking the assumption for equal variances were analyzed with Student’s t-test using the PROC T-test procedure of SAS [22] for significant differences at p < 0.05. Principle components analysis and correlation were carried out using Canoco 5.1 [23] to analyze the associations of variables in the soil C and N stocks.

3. Results

3.1. Stand and Soil Characteristics

Mean stand densities of 467 trees ha−1 and 1067 trees ha–1 were measured for the Japanese cedar plantations and Serrata oak stands, respectively (Table 1). Mean DBH and stand basal area were higher for the Japanese cedar plantation (DBH: 28.9 cm; basal area: 29.5 m2 ha−1) than for the Serrata oak stand (DBH: 12.0 cm; basal area: 13.5 m2 ha−1).
Although soil nutrient data prior to plantation establishment were not available, soil nutrient concentrations (N, P, K, Ca, and Mg) after plantation development showed a significant difference (p < 0.05) between the Japanese cedar plantation and the Serrata oak stand. Concentrations of N, K, Ca, and Mg in the surface soil (0–10 cm) were significantly higher in the Japanese cedar plantation than in the Serrata oak stand (p < 0.05), but the soil C concentration was not significantly different between the Japanese cedar plantation and the Serrata oak stand at all three soil depths (Table 2).

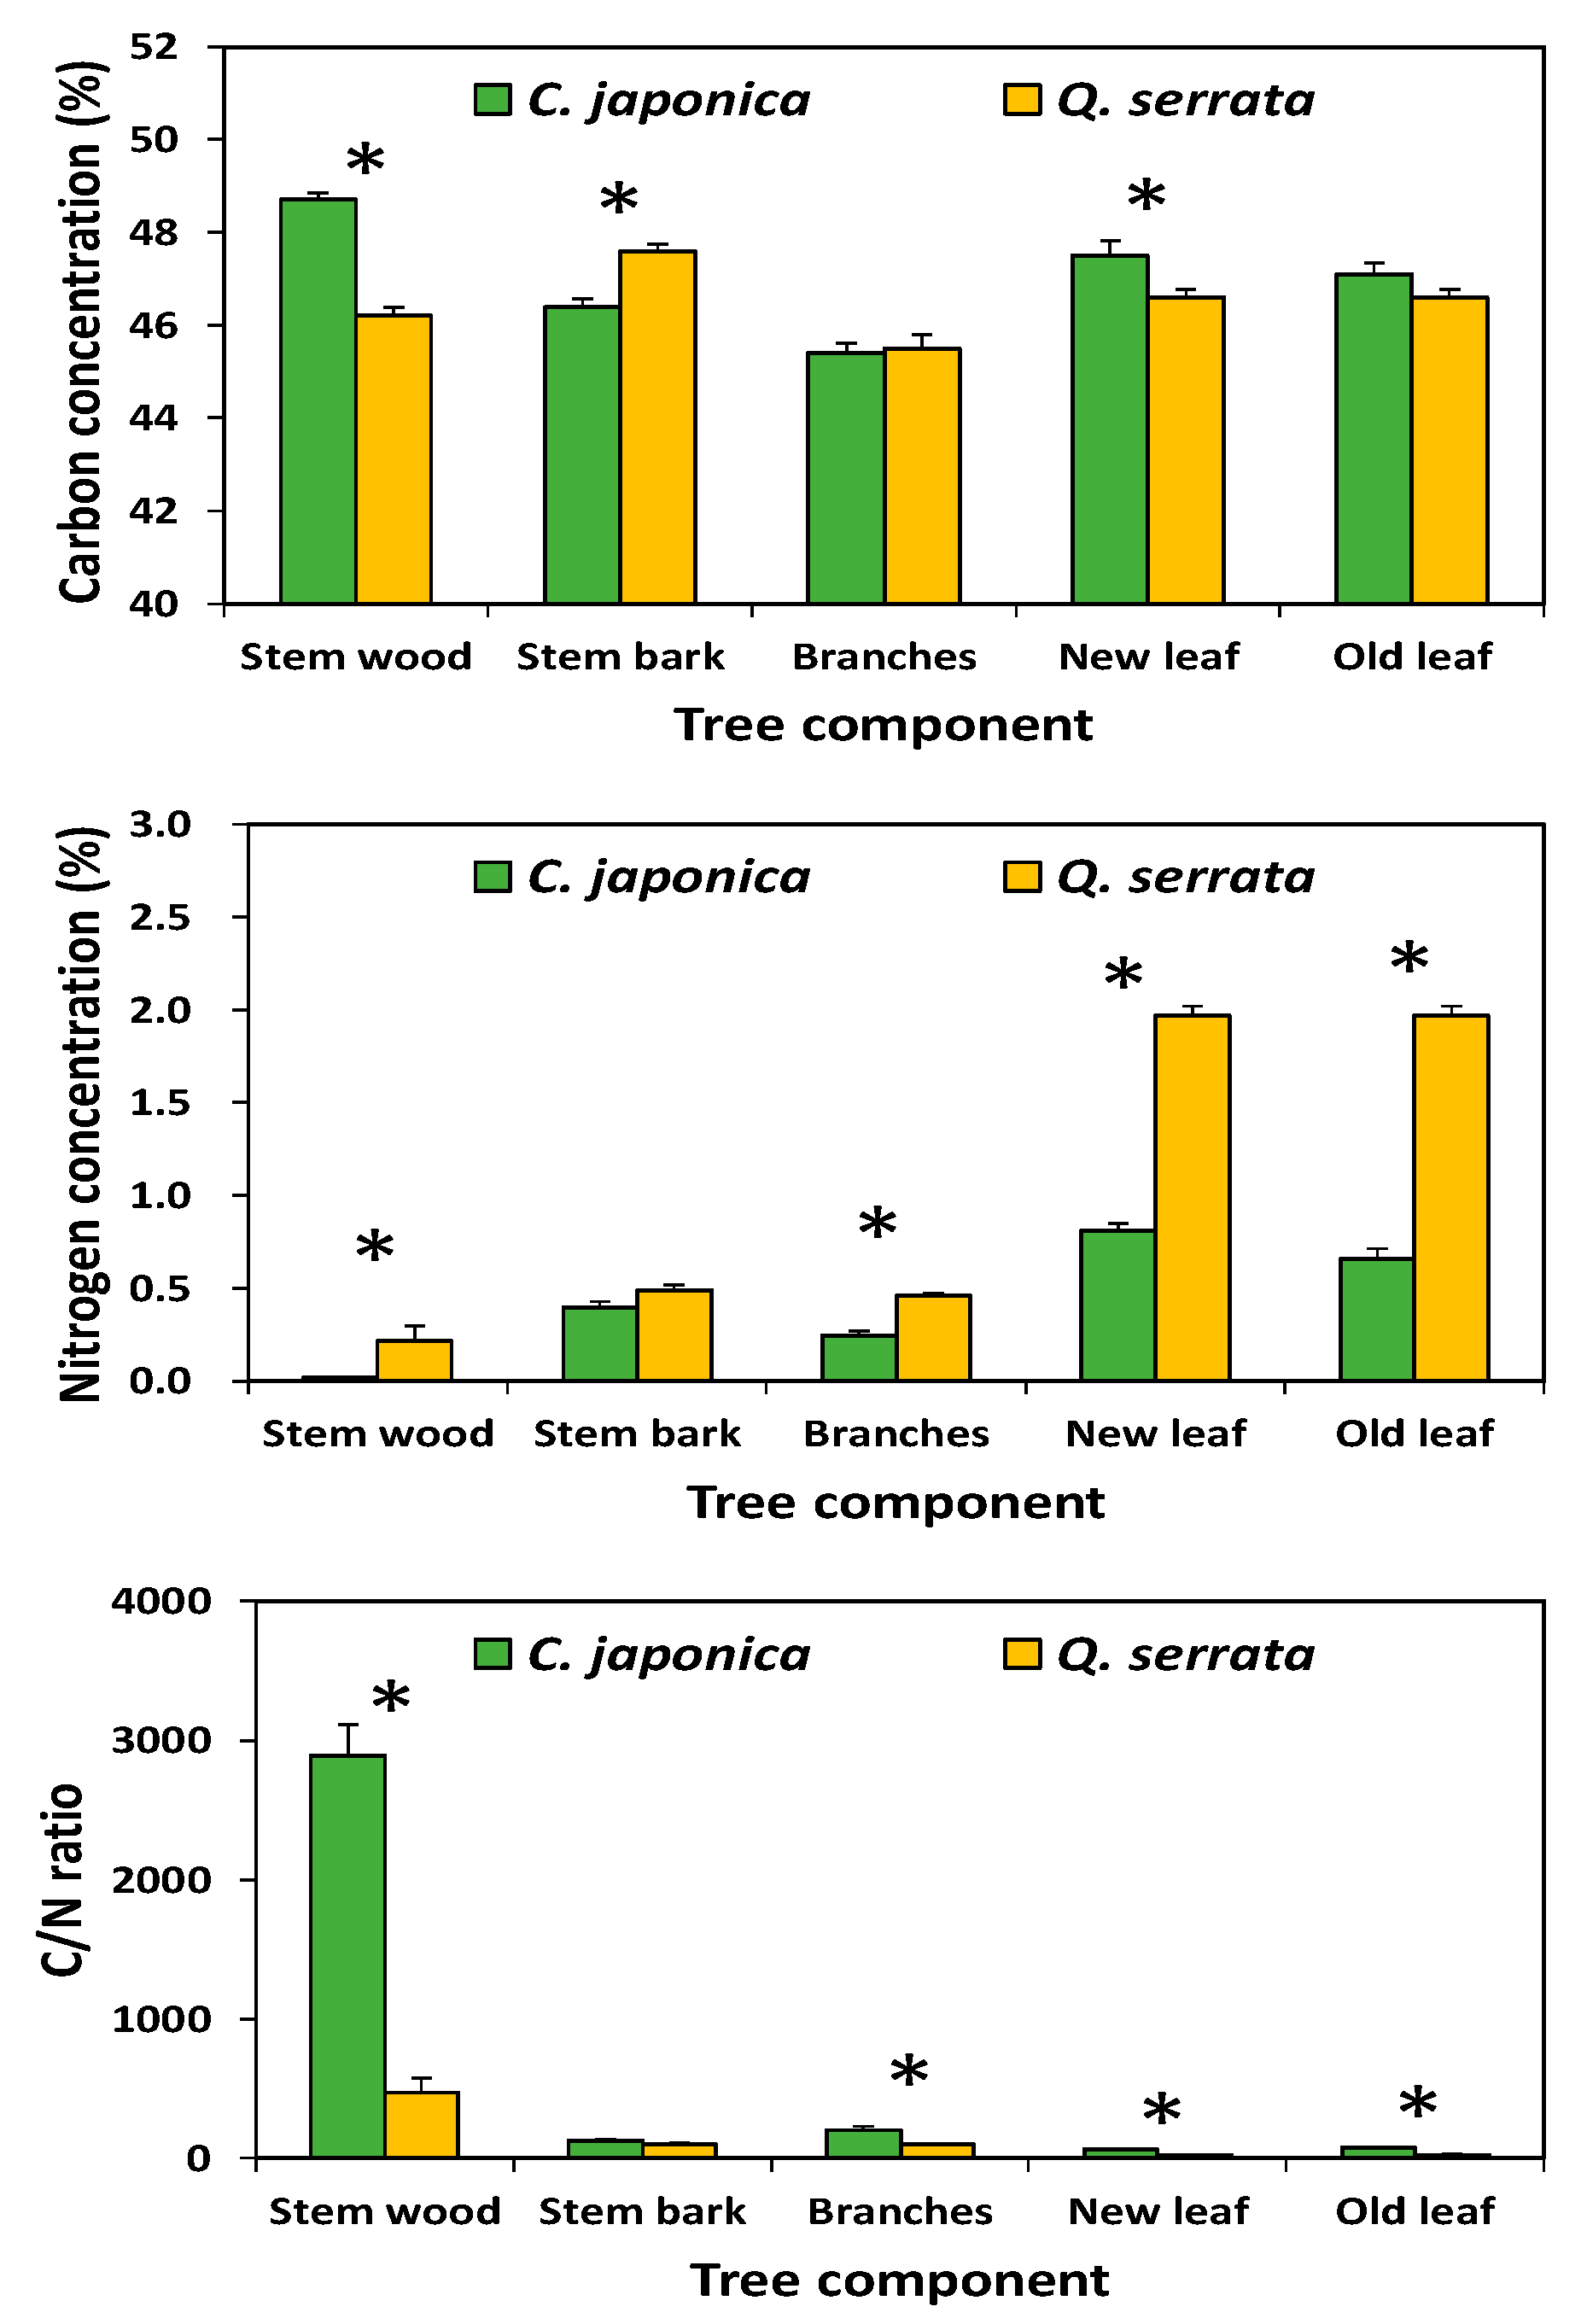
3.2. Carbon and Nitrogen Concentration in Aboveground Tree Biomass and the Forest Floor

Mean C concentrations in the stem and leaf components (Figure 2) were significantly higher (p < 0.05) in Japanese cedars (stem: 48.7%; leaf: 47.5%) than in Serrata oaks (stem: 46.2%; leaf: 46.6%), whereas the concentration of C in stem bark tended to be higher in Serrata oaks (47.6%) than in Japanese cedars (46.4%). The N concentration in leaves was significantly higher (p < 0.05) in Serrata oaks (1.97%) than in Japanese cedars (0.81%). Consequently, C/N ratio was significantly different between Japanese cedars and Serrata oaks except for stem bark.
Nitrogen concentration in the forest floor was significantly lower (p < 0.05) for the Japanese cedar plantation than for the Serrata oak stand, whereas C/N ratio showed an opposite trend (Table 3). However, the dry weight and C concentration were not significantly different (p > 0.05) between the Japanese cedar plantation and the Serrata oak stand.

3.3. Allometric Equation for Estimation of Carbon and Nitrogen Content

The allometric equations used to estimate C and N content of the tree biomass components were significant (p < 0.05). The allometric equations provided better fits of aboveground C content, ranging from 52–98% of the variation compared with aboveground N content (Table A1 in Appendix A). The slope values (b) of the allometric equations for total C and N content of aboveground components were generally higher for Serrata oak than for Japanese cedar (Table A1).

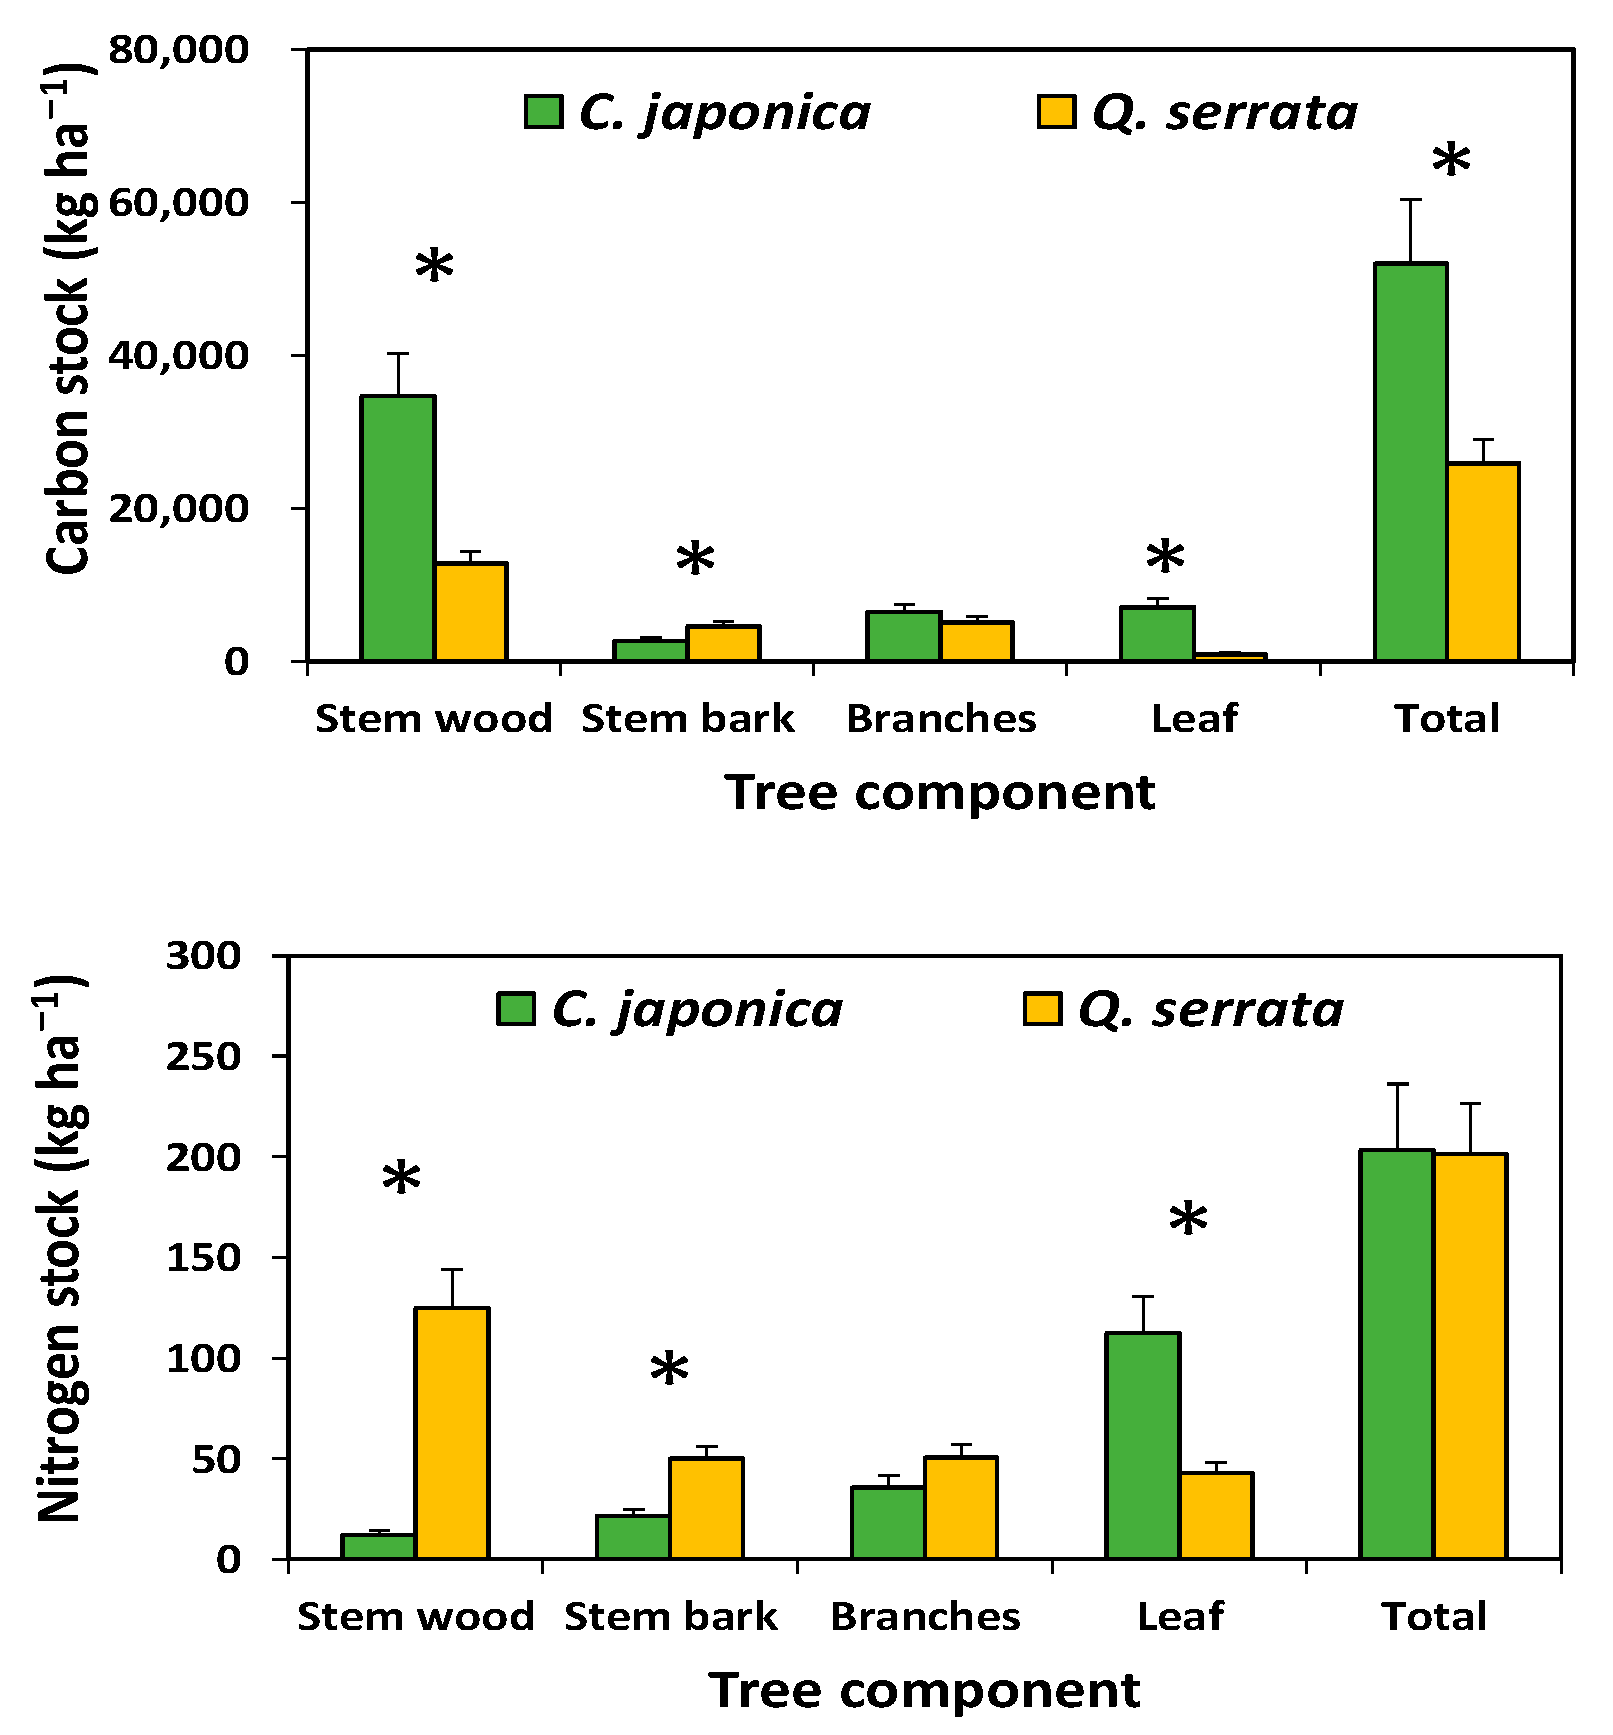
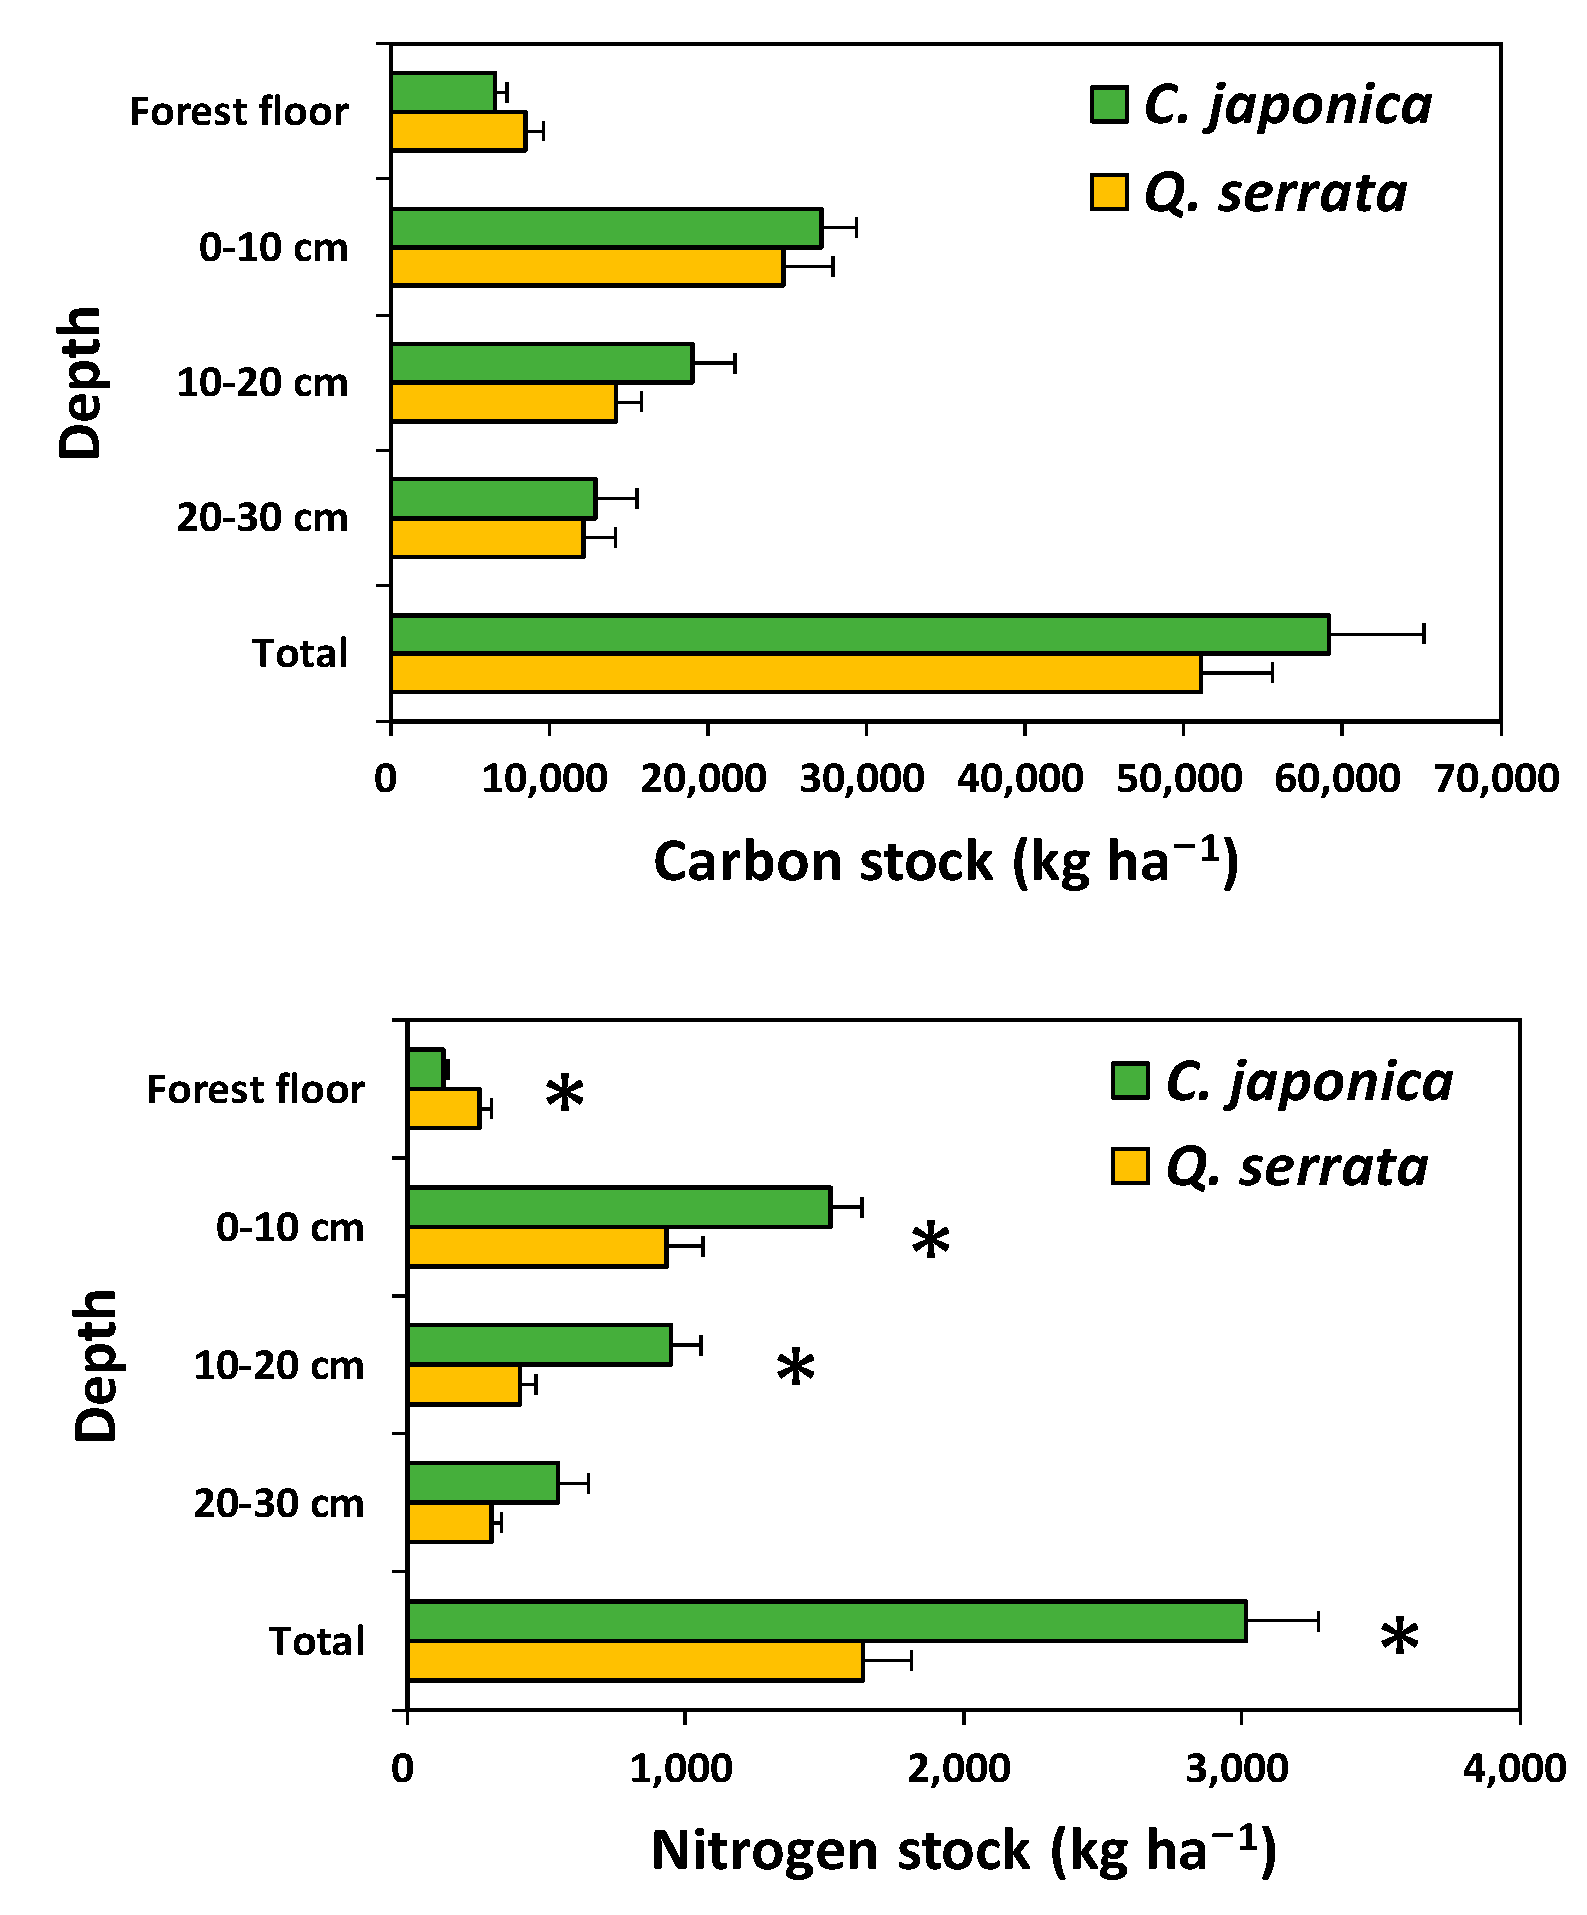
3.4. Carbon and Nitrogen Stocks at the Stand Level

Carbon stocks in the aboveground tree biomass were significantly higher in the Japanese cedar plantation, which had a greater basal area, than in the Serrata oak stand. However, N stocks in stem wood and stem bark were significantly lower in the Japanese cedar plantation than in the Serrata oak stand. In contrast to the woody components, N stocks in the leaves were significantly higher in the Japanese cedar plantation than in the Serrata oak stand (Figure 3). Carbon stocks in the forest floor and the soil were not significantly different (p > 0.05) between the Japanese cedar plantation and the Serrata oak stand; however, N stocks in the soil were significantly higher in the Japanese cedar plantation than in the Serrata oak stand (Figure 4).

3.5. Relationship between Soil C or N Stocks and Soil Property

Principal component analysis was performed to determine the key information from the multivariate data set by plotting all the soil data, along with the first two principal components. The first and second principal components accounted for 92.1% of the total variation in the Japanese cedar plantation and 88.4% of the total variation in the Serrata oak stand, respectively (Figure 5). There were positive correlations between C and N stocks and C and N concentrations, whereas the soil bulk density and C/N ratio were negatively correlated with C and N stocks.

4. Discussion

4.1. Carbon and Nitrogen Status of the Aboveground Tree Biomass, the Forest Floor, and the Mineral Soils

It is important to understand the distribution of C and N in forests following the conversion from natural forests to forest plantations because C and N interaction following forest replacement is one of the main processes responsible for sustainable forest productivity and C sequestration [2,24]. However, the differences in C and N distribution of natural and planted forests may have been affected by many factors, such as tree species, stand age, forest management, and site conditions [11,18,24]. For example, the difference in C and N distribution by stand density may be affected by thinning activities, which are the most commonly applied practices for manipulating the growth of plantations [25]. In addition, forest tending works, such as thinning, have become one of the most important forest management activities organized by the Korean government [26]. However, the difference in DBH, tree height and basal area between stand types may be due to the rapid growth patterns of exotic coniferous trees compared with slow-growing oaks. For example, the mean stand volume throughout the country examined in 2015 was higher for Japanese cedar plantations (346 m3 ha−1) than for Serrata oak (126 m3 ha−1) stands [5].
The results of this study showed that the C and N concentrations in the aboveground tree components were related to tree species, although some soil conditions differed between the Japanese cedar plantation and the Serrata oak stand. The high C concentrations in stem wood and new leaves of Japanese cedar could be associated with differences in nutrient concentration, polyphenolic compounds, and lignin concentrations. In addition, other studies reported that C concentrations in tree tissues were negatively correlated with nutrient concentration [4,27], whereas C concentrations in wood are known to be positively related to the proportion of lignified wood [28]. The lignin concentration in stems, reported by Chong and Park [29], is higher for Japanese cedar (32.0%) than for Serrata oak (22.6%). A previous study observed similar results in that C concentrations in tree components were found to be significantly higher for a coniferous tree species (Larix kaempferi Carriere) than a deciduous hardwood species (Quercus variabilis Blume), as a consequence of high lignin and low nutrient concentrations [24].
In this study, species-specific differences in mean N concentrations in the aboveground tree components were observed. These differences between Japanese cedar and Serrata oak are in agreement with the results of studies by Paré et al. [13] and Kim [24], which indicate that the N concentrations in tree components are generally lower in coniferous species than in deciduous hardwood species. Meerts [30] suggests that the low N concentration in stems of coniferous trees is related to the low proportion of living parenchyma cells in the stem tissues.
The N concentration and C/N ratio of the forest floor are a good proxy for predicting organic matter decomposition rates [31]. The low N concentration and high C/N ratio of the forest floor under Japanese cedar plantations were markedly higher than those under Serrata oak stands, which could subsequently increase the C stocks in the N-poor forest floor. In addition, no significant effect on C stocks of the forest floor between either tree species could be associated with site-specific effects of the two species or differences in aboveground litterfall inputs. The nitrogen status of the forest floor did not reflect the N concentration or C/N ratio in the mineral soil. This opposite trend indicates that the rooting systems play an important role in the C and N inputs incorporated into the mineral soil. For example, the annual fine root production observed in Japan was greater in Japanese cedar (72–320 g m−2 yr−1) [32] than in Serrata oak (144 g m–2 yr−1) [33]. Furthermore, the N concentration of fine roots was slightly higher in Japanese cedar (7.7 to 17.9 mg g−1) [34] than in Serrata oak (8.0 to 13.0 mg g−1) [35].

4.2. Carbon and Nitrogen Stocks in Aboveground Tree Biomass, the Forest Floor, and the Mineral Soils

Findings of this study indicate that replacement of natural oak forests with exotic Japanese cedar plantation had a significant effect (p < 0.05) on the parameters related to aboveground tree biomass and to N stocks in the forest floor and mineral soils. In comparison with the Serrata oak stand, the higher C stocks in aboveground tree components of the Japanese cedar plantation, which had a large stand basal area, could be related to rapid growth characteristics and accumulation of C in the form of living aboveground biomass. Other studies have reported that differences in the aboveground C stocks in forests were attributed to differences in stand basal area [24,26] and wood density [36]. However, basic wood density could not be associated with the difference of aboveground C stocks in two different species because basic wood density in Serrata oak (0.66 Mg m3) was greater than that (0.35 Mg m–3) of Japanese cedar [5]. In addition, the higher C stocks noted in the aboveground biomass of the Japanese cedar plantation could be related to the high C concentrations in the tree components of Japanese cedars and to stand age, given that trees in the 48-year-old Japanese cedar plantation were older than in the 37-year-old Serrata oak stand. Omoro et al. [9] suggest that changes in biomass C stocks after the replacement of indigenous forests with exotic tree species could depend on plantation age. The mean value of aboveground C stocks was 52,008 kg C ha−1 for the Japanese cedar plantation and 25,832 kg C ha−1 for the Serrata oak stand. The aboveground C stocks in the Japanese cedar plantation were similar to exotic 36-year-old L. kaempferi plantations (62,970 kg C ha−1) in Korean forests [24].
The N stocks in the aboveground biomass appeared to be dependent on either the N concentrations or the C stocks in the tree components. For example, the significant difference in N stocks in stems was mainly attributed to N concentrations rather than to stem C stocks, whereas the differences in N stocks in stem bark and leaves were due to the C stocks rather than the N concentrations. Thus, the total N stocks were similar in the Japanese cedar plantation (203 kg N ha−1) and the Serrata oak stand (201 kg N ha−1) because of the differences in N stocks in the tree components. However, the N stock values obtained in this study were slightly lower than the values of 253 kg N ha−1 for 36-year-old L. kaempferi plantations and 280 kg N ha−1 for 40-year-old Q. variabilis stands [24].
The C stocks in the forest floor were not significantly attributed to the different tree species in the Japanese cedar plantation (6536 kg C ha−1) and the Serrata oak stand (8473 kg C ha−1). The difference in the N stocks, however, while not related to the amount of forest floor, could possibly be due to the difference in N concentration between the Japanese cedar plantation and the Serrata oak stand. A previous study has reported that N concentration in the forest floor is generally higher in deciduous broad-leaf litter than in needle leaf litter [24].
The consequences of plantation development on soil C stocks in a Japanese cedar plantation could be minimal. Other studies have shown that total soil C stock did not change following afforestation with coniferous forests [2] and that soil organic C stocks in indigenous forests are greater than those in plantations [9]. Total soil C stocks (Japanese cedar plantation: 59,107 kg C ha−1; Serrata oak stand: 51,079 kg C ha−1) at 0–30 cm soil depth were similar to the mean C stocks of Korean coniferous forest soils (59,100 kg C ha−1) at 0–30 cm soil depth [5]. In contrast to soil organic C stocks, soil N stocks in the Japanese cedar plantations could be attributed to a high N concentration in mineral soil layers, as there was a trend of increasing N in soils 0–20 cm deep after the regeneration of exotic coniferous tree. In addition, higher biomass production and N concentrations in fine root biomass were observed in a pine (4.08 Mg ha−1; 5.6 mg g−1) plantation than in a natural sawtooth oak (3.17 Mg ha−1; 4.3 mg g−1) stand under similar site conditions in Korea [37]. If soil N stocks are regulated by species differences between above- and belowground litter, N concentration in below-ground litter could be an important determinant of soil N stocks after the replacement of natural forests by plantations of exotic species.
Soil properties, such as C and N concentrations, explained the tree species-related variability of C and N stocks (Figure 5). The positive relationship between soil C or N stocks and soil C or N concentration may be attributed to soil organic matter, which is closely connected to C and N cycling at the forest ecosystem levels. However, soil C and N stocks were negatively related to soil fertility parameters, such as the C/N ratio. This property tends to be associated with the rates of C and N mineralization, which in turn results in high soil N stocks in Japanese cedar plantations.
Although higher C and N stocks were observed under plantation forests than under natural forests (Table 4), the opposite patterns were also observed in natural forests [10,11], with no difference in the C stocks in soil between plantations and natural forests [38]. Thus, it is difficult to determine the effects of forest replacement on C and N stocks of tree biomass, forest floor, and mineral soils, because of the differences in the quantity and quality of above- and below-ground litter, litter decomposition, and tree C allocation between plantations and natural forests.

5. Conclusions

At a stand scale, Japanese cedar plantations that replace natural Serrata oak stands sequester more aboveground tree C and soil N than natural stands. The influence of tree replacement was pronounced in the C and N stocks of tree components, as well as the N stocks of the forest floor and mineral soil. These differences could be attributed to different C and N cycle mechanisms, influenced by above- and below-ground litter inputs, and differences in stand characteristics between plantations and natural stands. Soil C stocks, however, are relatively unaffected by Japanese cedar plantation development on a natural Serrata oak stand, indicating that reforestation did not have a significant impact on soil C stocks over the 50-year period after the establishment of Japanese cedar plantations on former natural Serrata oak stands. Although it is uncertain how elevated N stocks in Japanese cedar plantations respond to forest C stocks over a long period of tree growth, the results of this study suggest that establishing Japanese cedar plantations on former natural Serrata oak stands may increase aboveground C and soil N stocks to levels higher than those found in natural forests.

Author Contributions

Conceptualization, C.K.; methodology, C.K.; software, G.B.; validation, C.K. and G.B.; formal analysis, G.B.; investigation, G.B.; data curation, G.B.; writing—original draft preparation, G.B.; writing—review and editing, C.K., E.-J.B.; visualization, G.B.; supervision, C.K.; project administration, C.K., E.-J.B.; funding acquisition, C.K., E.-J.B. All authors have read and agreed to the published version of the manuscript.

Funding

This research was funded by Nation Institute of Forest Science and the National Research Foundation in Korea (NRF) grant (2020R1A2C1005791) funded by the Korea government (MIST).

Conflicts of Interest

The authors declare no conflict of interest.

Appendix A

Table A1. Allometric equations to estimate carbon and nitrogen content among tree components in Cryptomeria japonica and Quercus serrata.
NutrientTree SpeciesComponent (y)Regression CoefficientR2RMSEp-ValueCF
ab
CarbonC. japonicaStem wood (kg)−0.93401.93200.75930.11690.00101.016
Stem bark (kg)−1.62321.62170.59820.14280.00871.024
Branch (kg)−2.12952.24400.81590.11450.00031.015
Old leaf (kg)−1.49491.77700.79780.09610.00051.031
New leaf (kg)−1.76831.55900.51640.16210.01921.031
Total (kg)−0.78381.94960.84200.09080.00021.010
Q. serrataStem wood (kg)−1.15652.02520.98100.04110.00111.002
Stem bark (kg)−1.22551.69960.95680.0659<0.00011.005
Branch (kg)−3.01633.25950.93050.1624<0.00011.031
Leaf (kg)−3.61663.16930.88300.19610.00021.045
Total (kg)−1.07042.21310.95070.0919<0.00011.010
NitrogenC. japonicaStem wood (kg)−4.32131.88690.53800.18790.01581.041
Stem bark (kg)−3.98321.82000.66030.14030.00431.023
Branch (kg)−4.89702.58960.57620.23870.01091.068
Old leaf (kg)−4.19052.37320.82210.11860.00031.016
New leaf (kg)−4.16202.00230.58650.18060.00981.038
Total (kg)−3.82382.37630.88780.0908<0.00011.010
Q. serrataStem wood (kg)−5.46693.93850.58930.47930.04511.203
Stem bark (kg)−3.66552.11090.94280.0948<0.00011.010
Branch (kg)−4.90953.16250.92150.1683<0.00011.437
Leaf (kg)−4.95253.13840.87830.19860.00021.046
Total (kg)−3.64362.60880.90230.1565<0.00011.029
Allometric equation form is log10y = a + b × log10(DBH). The R2 is the coefficient of determination. p-values represent the significance of the equations. RMSE: root means squared error. CF: correction factor.

References

  1. Chen, X.; Li, B.-L. Change in soil carbon and nutrient storage after human disturbance of a primary Korean pine forest in northeast China. For. Ecol. Manag. 2003, 186, 197–206. [Google Scholar] [CrossRef]
  2. Li, D.; Niu, S.; Luo, Y. Global patterns of the dynamics of soil carbon and nitrogen stocks following afforestation: A meta-analysis. New Phytol. 2012, 195, 172–181. [Google Scholar] [CrossRef] [PubMed]
  3. Han, S.H.; Meng, L.; Park, G.S.; Kim, S.B.; Cho, M.S.; Park, B.B. Characteristics of soil carbon and nutrient stocks across land use types in a forest region of central Korea. For. Sci. Technol. 2017, 13, 93–99. [Google Scholar] [CrossRef]
  4. Kim, C.; Yoo, B.O.; Jung, S.Y.; Lee, K.S. Allometric equations to assess biomass, carbon and nitrogen content of black pine and red pine trees in southern Korea. Forest 2017, 10, 483–490. [Google Scholar] [CrossRef] [Green Version]
  5. Lee, S.J.; Yim, J.S.; Son, Y.M.; Son, Y.; Kim, R. Estimation of forest carbon stocks for National greenhouse gas inventory reporting in South Korea. Forests 2018, 9, 625. [Google Scholar] [CrossRef] [Green Version]
  6. Binkley, D.; Giardina, C. Why do tree species affect soils? The warp and woof of tree-soil interactions. Biogeochemistry 1998, 42, 89–106. [Google Scholar] [CrossRef]
  7. Augusto, L.; Ranger, J.; Binkley, D.; Rothe, A. Impact of several common tree species of European temperate forests on soil fertility. Ann. For. Sci. 2002, 59, 233–253. [Google Scholar] [CrossRef] [Green Version]
  8. Tang, Z.; Xu, W.; Zhou, G.; Bai, Y.; Li, J.; Tang, X.; Chen, D.; Liu, Q.; Ma, W.; Xiong, G.; et al. Patterns of plant carbon, nitrogen, and phosphorus concentration in relation to productivity in China’s terrestrial ecosystems. Proc. Natl. Acad. Sci. USA 2018, 115, 4033–4038. [Google Scholar] [CrossRef] [Green Version]
  9. Omoro, L.M.A.; Starr, M.; Pellikka, P.K.E. Tree biomass and soil carbon stocks in indigenous forests in comparison to plantations of exotic species in the Taita Hills of Kenya. Silva Fenn. 2013, 47, 935. [Google Scholar] [CrossRef] [Green Version]
  10. Dawud, S.M.; Vesterdal, L.; Raulund-Rasmussen, K. Mixed-species effects on soil C and N stocks, C/N ratio and pH using a transboundary approach in adjacent common garden Douglas-fir and beech stands. Forests 2017, 8, 95. [Google Scholar] [CrossRef] [Green Version]
  11. Liao, C.; Luo, Y.; Fang, C.; Li, B. Ecosystem carbon stock influenced by plantation practice: Implications for planting forests as a measure of climate change mitigation. PLoS ONE 2010, 5, e10867. [Google Scholar] [CrossRef] [Green Version]
  12. Kim, C.; Baek, G.; Choi, B.; Ha, J.; Bae, E.J.; Lee, K.S.; Son, Y.M. Carbon stocks of tree, forest floor, and mineral soil in Cryptomeria japonica and Chamaecyparis obtusa stands. J. Korean Soc. For. Sci. 2020, 109, 169–178. [Google Scholar]
  13. Paré, D.; Bernier, P.; Lafleur, B.; Titus, B.D.; Thiffault, E.; Maynard, D.G.; Guo, X. Estimating stand-scale biomass, nutrient contents, and associated uncertainties for tree species of Canadian forests. Can. J. For. Res. 2013, 43, 599–608. [Google Scholar] [CrossRef]
  14. Yang, K.; Zhu, J.; Xu, S.; Zheng, X. Conversion from temperate secondary forests into plantations (Larix spp.): Impact on belowground carbon and nutrient pools in northeastern China. Land Degrad. Dev. 2018, 29, 4129–4139. [Google Scholar] [CrossRef]
  15. Government of South Korea. Carbon Neutrality Strategies by 2050; Government of South Korea: Seoul, Korea, 2021; p. 117.
  16. Kim, C.; Lim, J.H.; Lee, I.K.; Park, B.B.; Chun, J.H. Annual variations of litterfall production in a broadleaved deciduous forest at the Mt. Keumsan LTER site. J. Korean For. Soc. 2013, 102, 210–215. [Google Scholar]
  17. Korea Forest Research Institute. Survey Manual for Biomass and Soil Carbon; Korea Forest Research Institute: Seoul, Korea, 2010; p. 60. [Google Scholar]
  18. Martin, A.R.; Erickson, D.L.; Kress, W.J.; Thomas, S.C. Wood nitrogen concentrations in tropical trees: Phylogenetic patterns and ecological correlates. New phytol. 2014, 204, 484–495. [Google Scholar] [CrossRef]
  19. Balboa-Murias, M.A.; Rojo, A.; Álvarez, J.G.; Merino, A. Carbon and nutrient stocks in mature Quercus robur L. stands in NW Spain. Ann. For. Sci. 2006, 63, 557–565. [Google Scholar] [CrossRef] [Green Version]
  20. Kalra, Y.P.; Maynard, D.G. Methods Manual for Forest Soil and Plant Analysis; Forestry Canada, Northwest Region, Information Report NOR-X-319E; Northern Forestry Centre: Edmonton, AB, Canada, 1991; p. 116. [Google Scholar]
  21. Garcia Villacorta, A.M.; Martin, T.A.; Jokela, E.J.; Cropper Jr, W.P.; Gezan, S.A. Variation in biomass distribution and nutrient content in loblolly pine (Pinus taeda L.) clones having contrasting crown architecture and growth efficiency. For. Ecol. Manag. 2015, 342, 84–92. [Google Scholar] [CrossRef]
  22. SAS Institute Inc. SAS/STAT Statistical Software, version 9.1; SAS publishing: Cary, NC, USA, 2003. [Google Scholar]
  23. ter Braak, C.J.F.; Śmilauer, P. Canoco Reference Manual and User’s Guide: Software for Ordination, version 5.10; Microcomputer Power: Ithaca, NY, USA, 2018; p. 536. [Google Scholar]
  24. Kim, C. Carbon and nitrogen distribution of tree components in Larix kaempferi Carriere and Quercus variabilis Blume stands in Gyeongnam province. J. Korean Soc. For. Sci. 2019, 108, 139–146. [Google Scholar]
  25. Lin, J.-C.; Chiu, C.M.; Lin, Y.-J.; Liu, W.-Y. Thinning effects on biomass and carbon stock for young Taiwania plantations. Sci. Rep. 2018, 8, 3070. [Google Scholar] [CrossRef]
  26. Kim, C.; Son, Y.; Lee, W.K.; Jeong, J.; Noh, N.J. Influences of forest tending works on carbon distribution and cycling in a Pinus densiflora S. et Z. stand in Korea. For. Ecol. Manag. 2009, 257, 1420–1426. [Google Scholar] [CrossRef]
  27. Martin, A.R.; Gezahegn, S.; Thomas, S.C. Variation in carbon and nitrogen concentration among major woody tissue types in temperate trees. Can. J. For. Res. 2015, 45, 744–757. [Google Scholar] [CrossRef]
  28. Bert, D.; Danjon, F. Carbon concentration variations in the roots, stem and crown of mature Pinus pinaster (Ait.). For. Ecol. Manag. 2006, 222, 279–295. [Google Scholar] [CrossRef]
  29. Chong, S.H.; Park, B.S. Wood Properties of the Useful Tree Species Grown in Korea; New Research Book No. 29; Korea Forest Research Institute: Seoul, Korea, 2008; p. 390. [Google Scholar]
  30. Meerts, P. Mineral nutrient concentrations in sapwood and heartwood: A literature review. Ann. For. Sci. 2002, 59, 713–722. [Google Scholar] [CrossRef] [Green Version]
  31. Cha, J.-Y.; Cha, Y.; Oh, N.-H. The effects of tree species on soil organic carbon content in South Korea. JGR Biogeosci. 2019, 124, 708–716. [Google Scholar] [CrossRef]
  32. Noguchi, K.; Konopka, B.; Satomura, T.; Kaneko, S.; Takahashi, M. Biomass and production of fine roots in Japanese forests. J. For. Res. 2007, 12, 83–95. [Google Scholar] [CrossRef]
  33. Van Do, T.; Sato, T.; Kozen, O. A new approach for estimating fine root production in forests: A combination of ingrowth core and scanner. Trees 2016, 30, 545–554. [Google Scholar] [CrossRef]
  34. Noguchi, K.; Nagakura, J.; Kaneke, S. Biomass and morphology of fine roots of sugi (Cryptomeria japonica) after 3 years of nitrogen fertilization. Front. Plant Sci. 2013, 4, 347. [Google Scholar] [CrossRef] [Green Version]
  35. Han, S.H.; Kim, S.; Cha, H.; Kim, H.-J.; Khamzina, A.; Son, Y. Soil depth-and root diameter-related variations affect root decomposition in temperate pine and oak forests. J. Plant. Ecol. 2019, 12, 871–881. [Google Scholar] [CrossRef]
  36. Flores, O.; Coomes, D.A. Estimating the wood density of species for carbon stock assessments. Method Ecol. Evol. 2011, 2, 214–220. [Google Scholar] [CrossRef]
  37. Kim, C. Biomass and nutrient concentrations of fine roots in a Korean pine plantation and a sawtooth oak stand. For. Sci. Technol. 2012, 8, 187–191. [Google Scholar] [CrossRef]
  38. Li, S.; Su, J.; Liu, W.; Lang, X.; Huang, X.; Jia, C.; Zhang, Z.; Tong, Q. Changes in biomass carbon and soil organic carbon stocks following the conversion from a secondary coniferous forest to a pine plantation. PLoS ONE 2015, 10, e0135946. [Google Scholar] [CrossRef] [PubMed] [Green Version]
Figure 1. Location of the study site (C1, C2: Cryptomeria japonica plantations; Q1, Q2: Quercus serrata stands).
Forests 12 00963 g001
Figure 2. Carbon and nitrogen concentration, and C/N ratio of tree components in Cryptomeria japonica (new and old leaf) and Quercus serrata (leaf). Vertical bar represents standard error. Asterisk (*) indicates a significant difference between tree species at p < 0.05.
Forests 12 00963 g002
Figure 3. Carbon and nitrogen stocks of tree components in Cryptomeria japonica plantations and Quercus serrata stands. Vertical bar represents standard error. Asterisk (*) indicates a significant difference between stand types at p < 0.05.
Forests 12 00963 g003
Figure 4. Carbon and nitrogen stocks of the forest floor and soil in Cryptomeria japonica plantations and Quercus serrata stands. Vertical bar represents standard error. Asterisk (*) indicates a significant difference between stand types at p < 0.05.
Forests 12 00963 g004
Figure 5. Principle component analysis of soil properties in Cryptomeria japonica plantations and Quercus serrata stands.
Forests 12 00963 g005
Table 1. General stand characteristics in Cryptomeria japonica plantations and Quercus serrata stands.
StandPlotAgeLocationAspectElevation
(m)
Slope
(°)
Parent RocksStand Density
(Tree ha–1)
DBH
(cm)
Height
(m)
Basal Area
(m2 ha–1)
C. japonica14934°46′21′′ N 128°03′02′′ ESE35530Granite667
(44)
25.4
(1.8)
16.2
(1.5)
35.54
(7.7)
24734°46′33′′ N 127°59′59′′ ENE29815Granite267
(17)
32.3
(2.6)
13.3
(1.6)
23.37
(3.8)
Mean48 467
(92)
28.9
(2.1)
14.8
(1.6)
29.5
(4.7)
Q. serrata13734°46′36′′ N 127°59′58′′ ESW33020Granite816
(142)
12.2
(0.7)
9.8
(1.5)
10.0
(1.8)
23634°46′41′′ N 128°07′97′′ ES33425Granite1316
(101)
11.9
(0.6)
8.2
(0.7)
16.3
(1.5)
Mean37 1067
(136)
12.0
(0.4)
9.0
(1.3)
13.5
(1.6)
Values in parenthesis represent standard error.
Table 2. Soil properties in Cryptomeria japonica plantations and Quercus serrata stands.
Depth
(cm)
StandBulk Density
(g cm–3)
Coarse Fragment
(g g–1)
Organic C
(%)
Total N
(%)
C/N
Ratio
Extractable
P (mg kg–1)
Exchangeable (cmolc kg–1)
K+Ca2+Mg2+
0–10C. japonica0.88
(0.06)
0.47
(0.02)
6.1
(0.74)
0.34
(0.04)
17.8
(0.7)
20.7
(3.2)
0.37
(0.03)
3.45
(0.61)
0.51
(0.05)
Q. serrata1.04
(0.04)
0.51
(0.03)
5.0
(0.76)
0.19
(0.03)
27.5
(1.9)
17.3
(0.7)
0.21
(0.03)
0.79
(0.42)
0.22
(0.07)
p-value0.040.270.320.010.0030.330.0050.0050.008
10–20C. japonica1.03
(0.04)
0.47
(0.02)
3.5
(0.49)
0.17
(0.02)
19.9
(0.7)
19.8
(0.7)
0.22
(0.02)
0.87
(0.14)
0.17
(0.01)
Q. serrata1.16
(0.04)
0.57
(0.03)
2.9
(0.43)
0.08
(0.01)
36.6
(2.8)
14.2
(1.4)
0.17
(0.03)
0.37
(0.16)
0.15
(0.05)
p-value0.030.020.380.0040.0020.0080.020.040.71
20–30C. japonica1.26
(0.07)
0.56
(0.04)
2.4
(0.43)
0.10
(0.02)
24.4
(1.9)
15.8
(0.7)
0.22
(0.02)
0.34
(0.07)
0.09
(0.01)
Q. serrata1.24
(0.04)
0.53
(0.03)
2.1
(0.30)
0.05
(0.01)
39.3
(3.5)
12.8
(1.6)
0.18
(0.03)
0.35
(0.12)
0.20
(0.07)
p-value0.800.550.570.040.0040.120.230.950.15
MeanC. japonica1.06
(0.04)
0.50
(0.01)
4.0
(0.46)
0.21
(0.02)
19.4
(0.7)
18.8
(1.4)
0.29
(0.02)
1.53
(0.25)
0.26
(0.02)
Q. serrata1.14
(0.02)
0.54
(0.02)
3.3
(0.33)
0.11
(0.01)
31.4
(1.0)
14.8
(1.1)
0.19
(0.03)
0.50
(0.23)
0.19
(0.06)
p-value0.060.180.260.0060.0010.040.020.010.35
Values in parenthesis represent standard error. Significant differences between stand types are indicated by p-value in bold.
Table 3. Dry weight, carbon and nitrogen concentrations, and C/N ratio of the forest floor in Cryptomeria japonica plantations and Quercus serrata stands.
StandDepth
(cm)
Dry Weight
(kg ha–1)
CNC/N Ratio
(%)
C. japonica4.0
(0.3)
14,911
(1379)
43.5
(2.3)
0.84
(0.05)
52.7
(4.7)
Q. serrata5.1
(0.5)
18,500
(2343)
45.5
(0.6)
1.39
(0.10)
34.1
(3.7)
p-value0.080.220.420.0020.01
Values in parenthesis represent standard error. Significant differences between stand types are indicated by p-value in bold.
Table 4. Comparison of carbon and nitrogen stocks between plantation and natural forests.
Nutrient StockForest TypesTree Biomass Forest FloorSoilsReferences
(Mg ha−1)
CCryptomeria japonica (p)52.06.559.11This study
Quercus serrata (n)25.88.551.10
NCryptomeria japonica (p)0.200.133.02
Quercus serrata (n)0.200.261.64
CDouglas-fir (p)- *11.346.8[10]
Beech (n)-7.446.4
NDouglas-fir (p)-0.33.4
Beech (n)-0.23.6
CPlantation forests (p)79.55.1103.9[11]
Pimary or secondary forests (n)121.16.1128.8
CEucalyptus saligna, Pinus spp. (p)195-78[9]
Macaranga conglomerate (n)360-146
CPinus kesiya var. langbianensis (p)141.432.3857.2[38]
Secondary coniferous forests (n)64.032.7850.6
*: not determined; p: plantations; n: natural forests.
Publisher’s Note: MDPI stays neutral with regard to jurisdictional claims in published maps and institutional affiliations.

