
Iterative Method of Discriminant Analysis to Classify Beech (Fagus sylvatica L.) Forest

 , , , and
Abstract
:1. Introduction
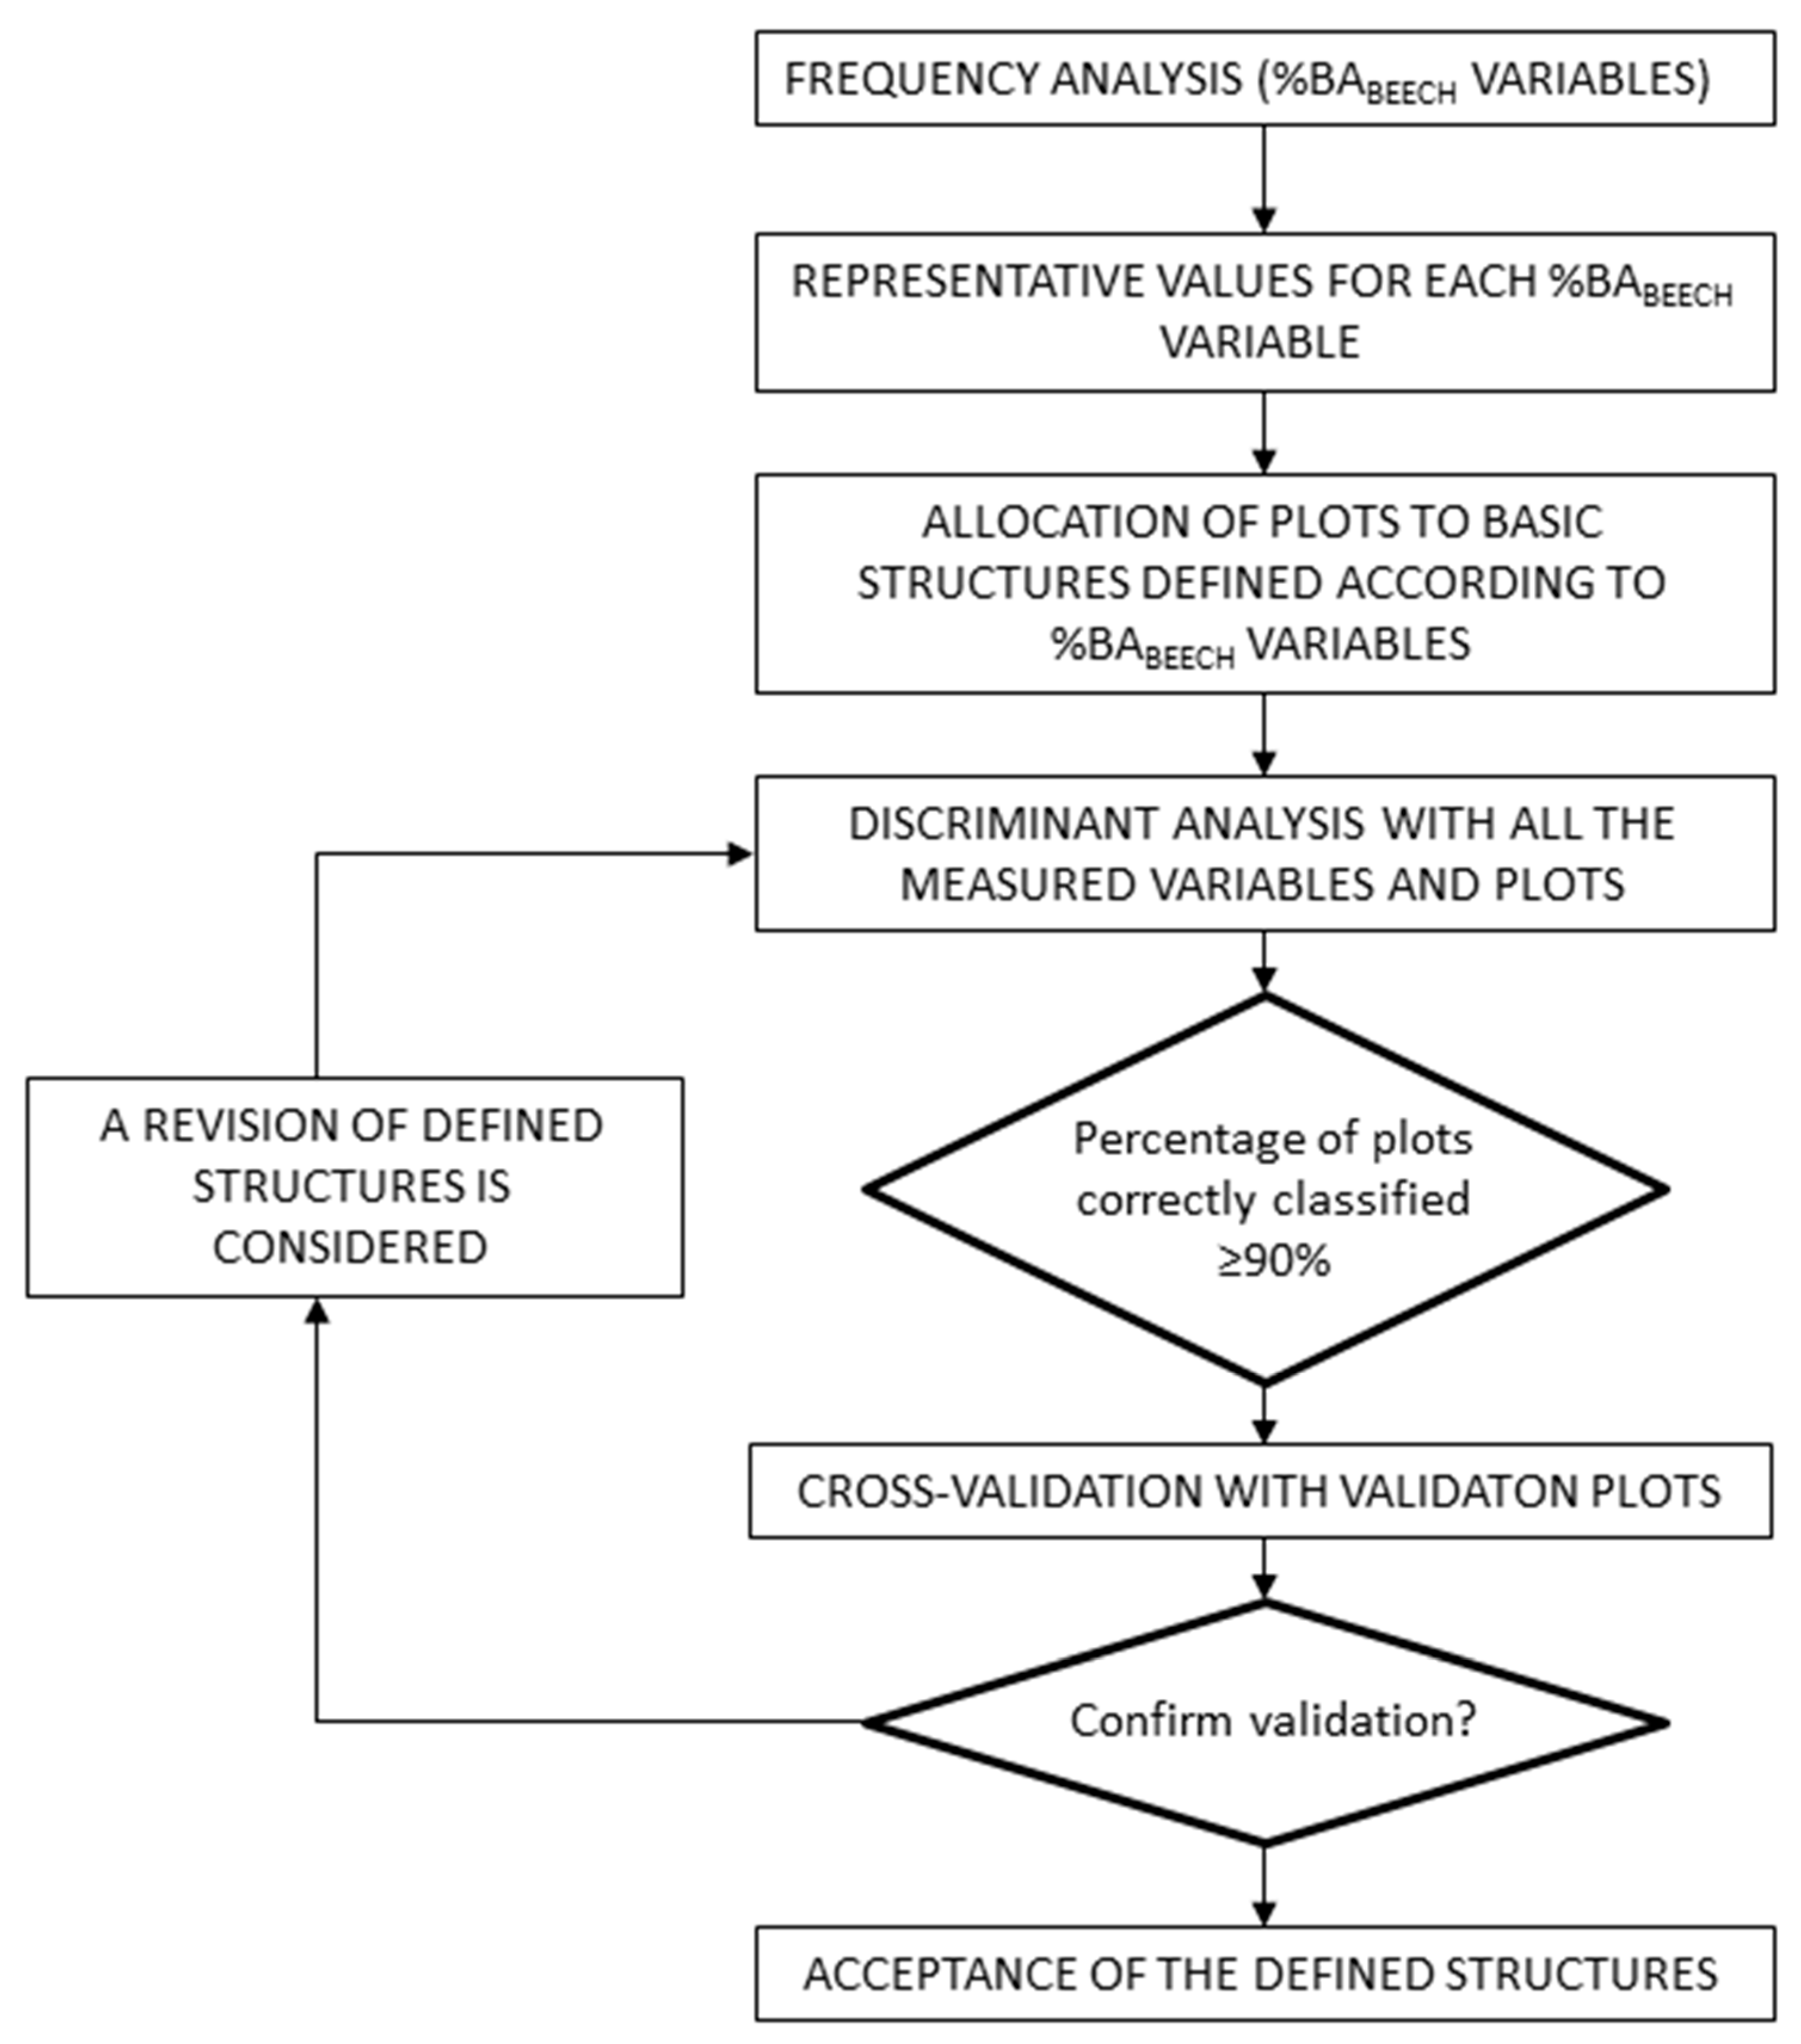
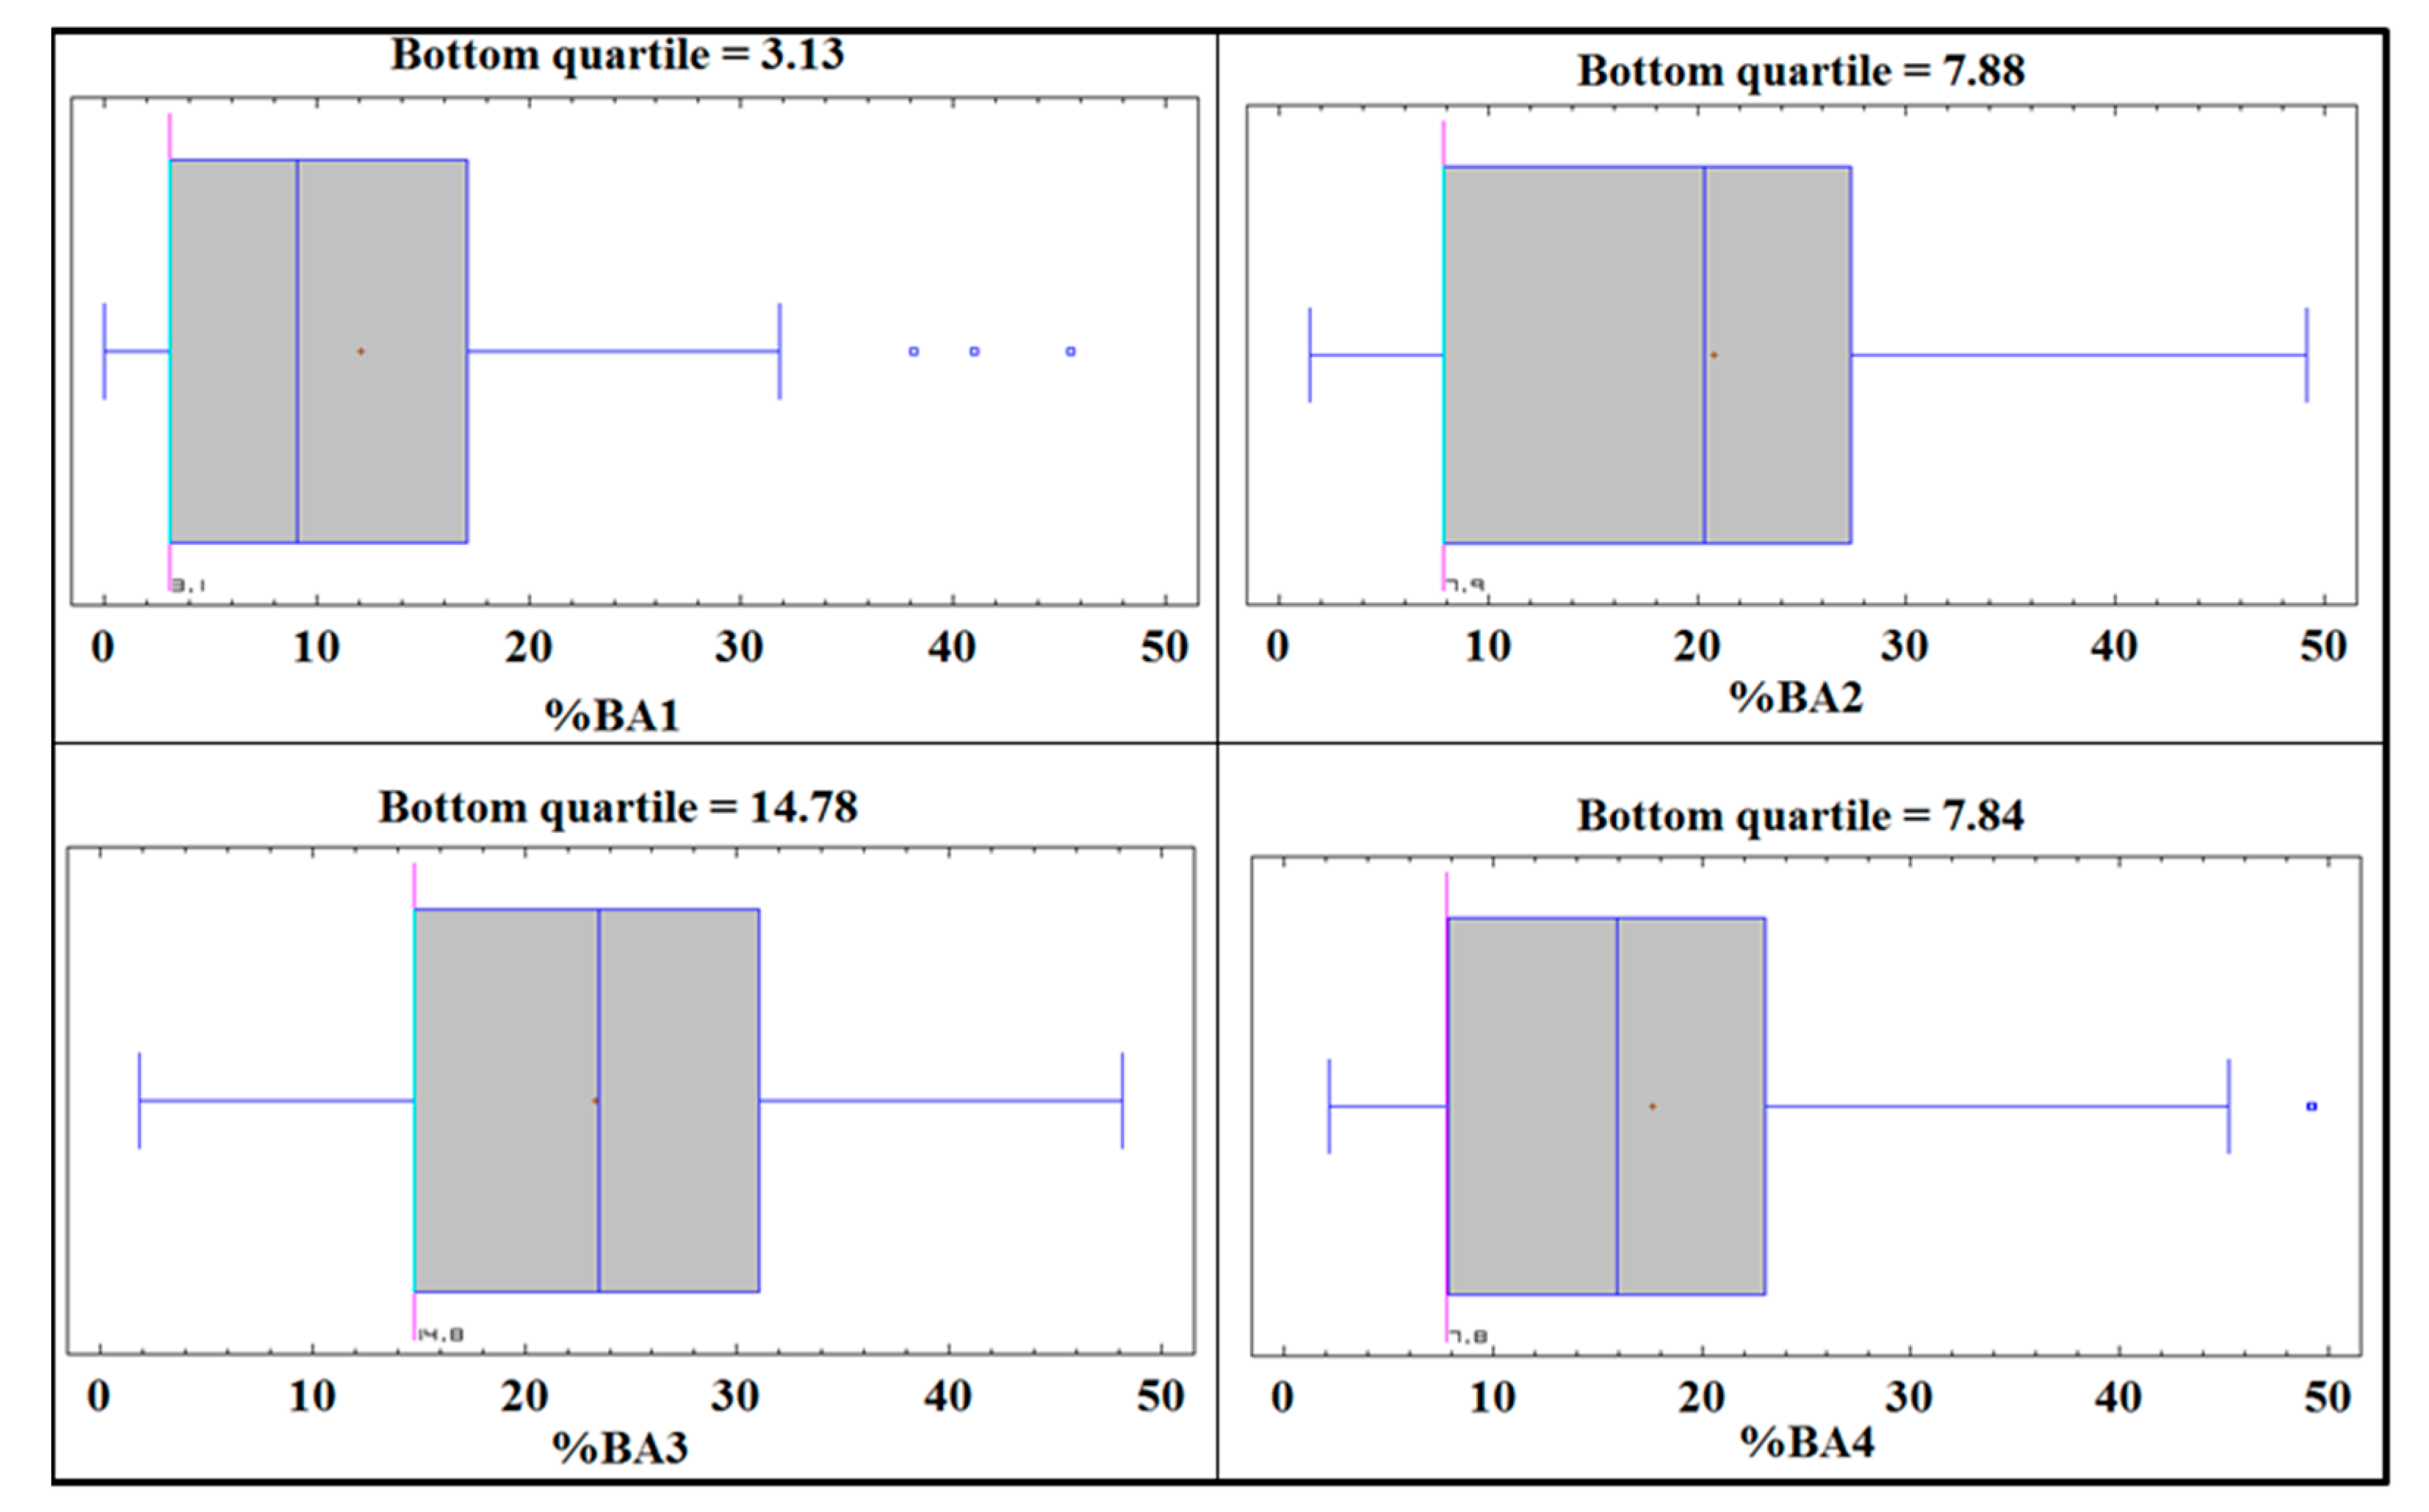
2. Materials and Methods
3. Application to Burgos Beech Forests
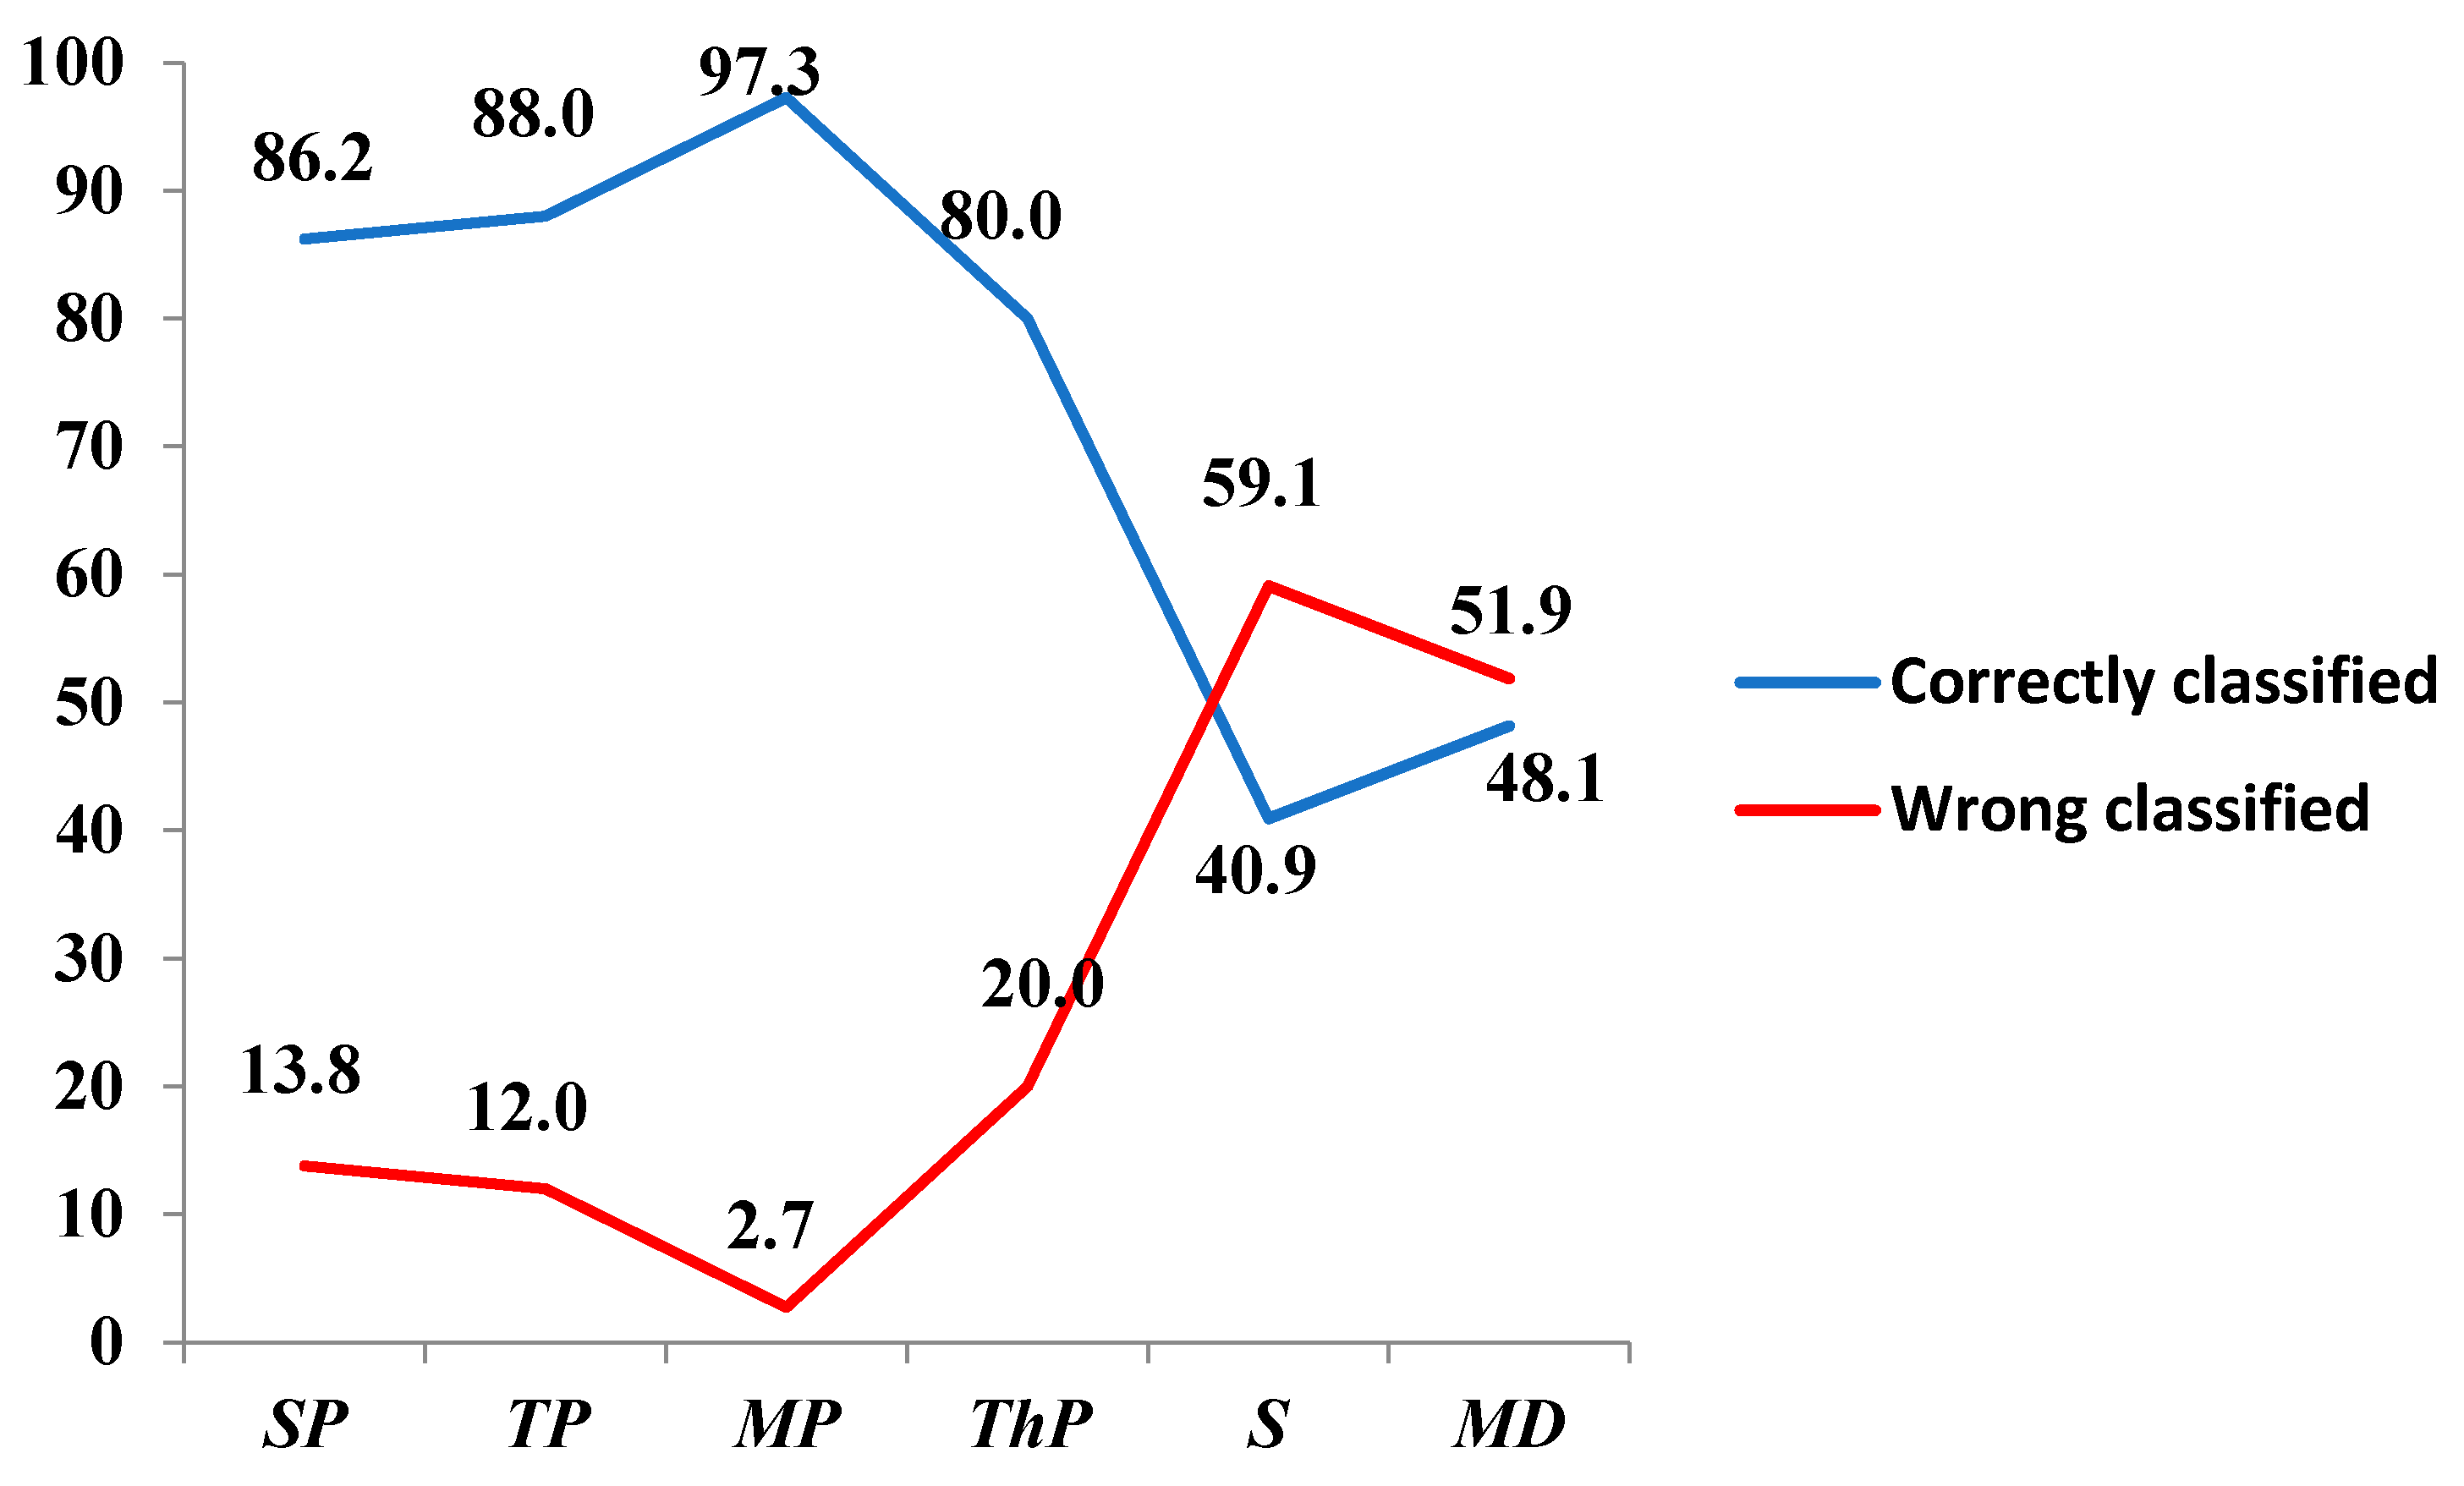
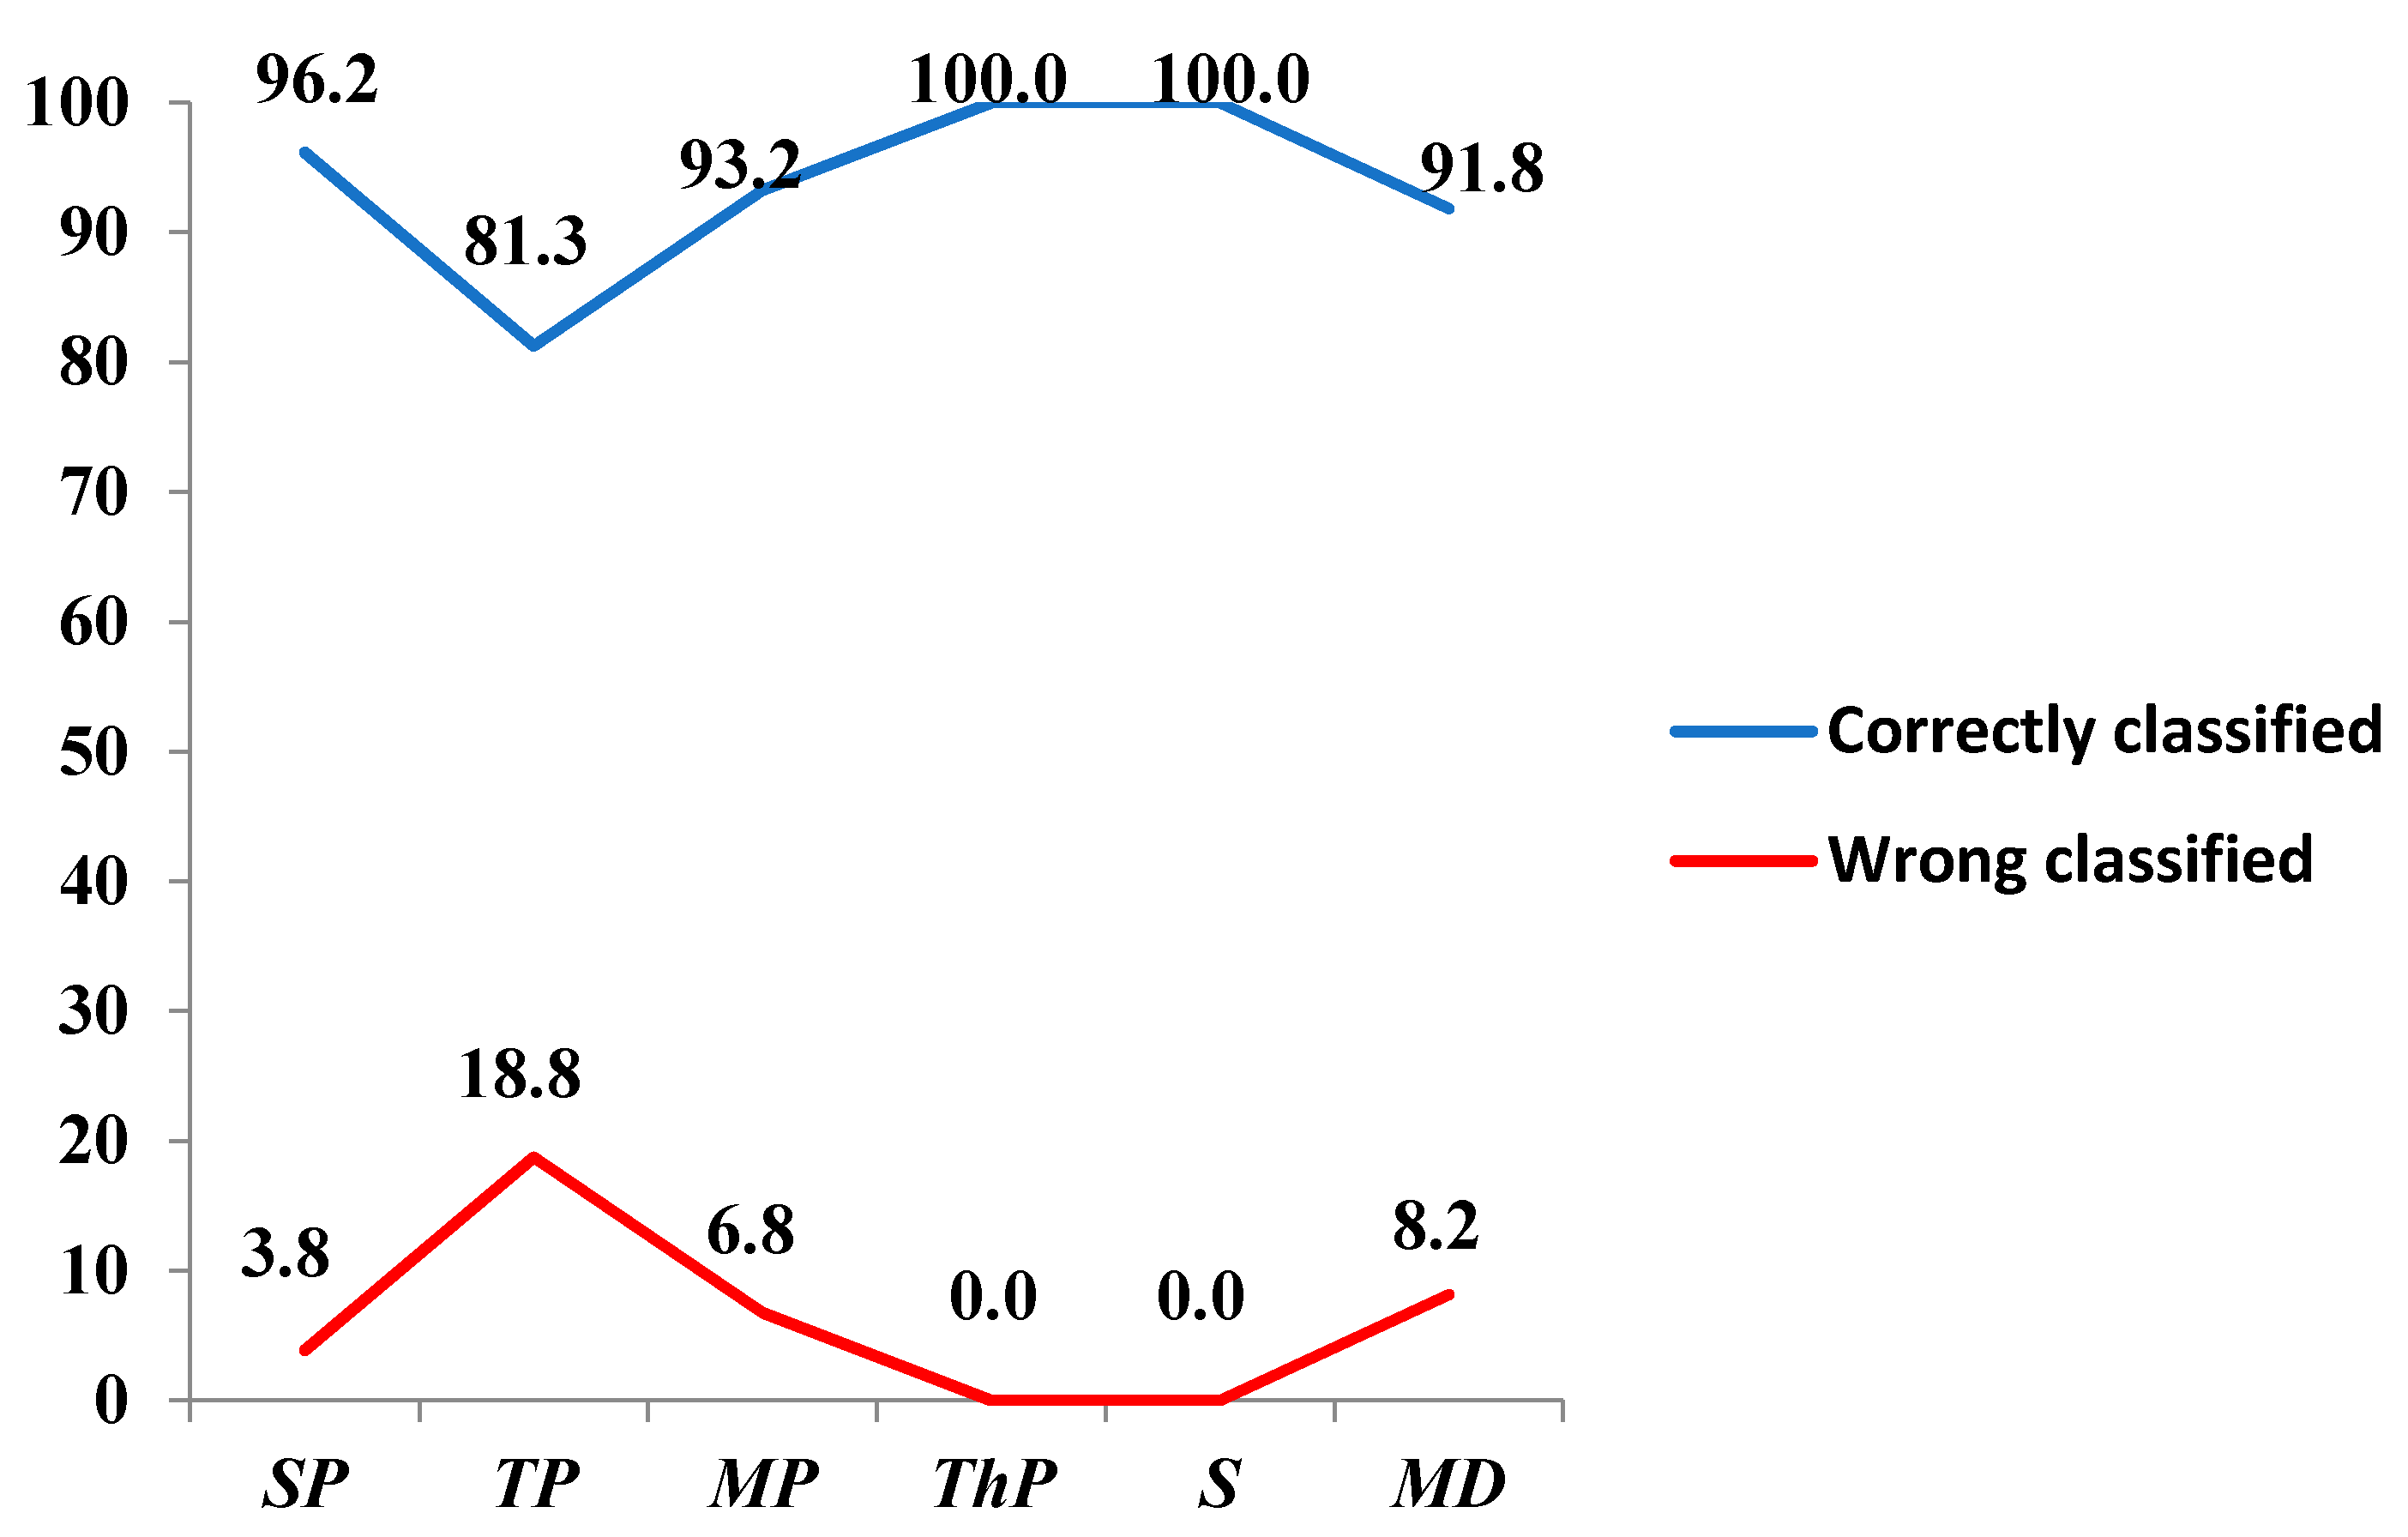
4. Results
- -
- SP: 1 plot reclassified as S
- -
- TP: 1 plot reclassified as MD
- -
- MP: 5 plots reclassified as S, 5 plots reclassified as MD.
- -
- ThP: 13 plots reclassified as S
- -
- S: stay the same
- -
- MD: 4 plots reclassified as SP, 10 plots reclassified as TP, 9 plots reclassified as MP, 4 plots reclassified as ThP and 1 plot reclassified as S.
5. Discussion
6. Conclusions
Author Contributions
Funding
Institutional Review Board Statement
Informed Consent Statement
Data Availability Statement
Conflicts of Interest
References
- Aunós, A.; Blanco, R. Desarrollo de las tipologías de masas forestales en España. Actas Del Congr. For. Español 2009, 1, 14. [Google Scholar]
- Feldman, E.; Glatthorn, J.; Ammer, C.; Leuschner, C. Regeneration dynamics following the formation of understory gaps in a Slovakian beech virgin forest. Forests 2020, 11, 585. [Google Scholar] [CrossRef]
- Jaloviar, P.; Sedmákova, D.; Pittner, J.; Jarcusková, L.; Kucbel, S.; Sedmák, R.; Saniga, M. Gap structure and regeneration in the mixed old-growth forests of NationalReserve Sitno, Slovakia. Forests 2020, 11, 81. [Google Scholar] [CrossRef] [Green Version]
- Gadow, K.; Zhang, C.Y.; Zhao, X.H.; Wehenkel, C.; Corral-Rivas, J.; Pommerening, A.; Korol, M.; Myklush, S.; Hui, G.Y.; Kiviste, A.; et al. Forest Structure and Diversity. In Continuous Cover Forestry Managing Forest Ecosystems; Pukkala, T., Gadow, K.V., Eds.; Springer: Dordrecht, The Netherlands, 2012; Volume 23, pp. 29–83. [Google Scholar]
- Janowiak, M.K.; Nagel, L.M.; Webster, C.R. Spatial Scale and Stand Structure in Northern Hardwood Forests: Implications for Quantifying Diameter Distributions. For. Sci. 2008, 54, 497–506. [Google Scholar]
- Leak, W.B. Long-Term Structural Change in uneven-aged northern hardwoods. For. Sci. 1996, 42, 160–165. [Google Scholar]
- Westphal, C.; Tremer, N.; von Oheimb, G.; Hansen, J.; von Gadow, K.; Härdtle, W. Is the reverse J-shaped diameter distribution universally applicable in European virgin beech forests? For. Ecol. Manag. 2006, 223, 75–83. [Google Scholar] [CrossRef]
- Zhang, L.; Gove, J.H.; Liu, C.; Keak, W.B. A finite mixture of two Weibull distributions for modeling the diameter distributions of rotated-sigmoid, uneven-aged stands. Can. J. For. Res. 2001, 31, 1654–1659. [Google Scholar] [CrossRef]
- Zhang, L.; Liu, C. Fitting irregular diameter distribution of forest stands by Weibull, modified Weibull, and mixture Weibull models. J. For. Res. 2006, 11, 369–372. [Google Scholar] [CrossRef]
- Alessandrini, A.; Biondi, F.; Di Filippo, A.; Ziaco, E.; Piovesan; G. Tree size distribution at increase spatial scales converges to the rotated sigmoid curve in two old-growth beech stands of the Italian Apennines. For. Ecol. Manag. 2011, 262, 1950–1962. [Google Scholar] [CrossRef]
- Commarmot, B.; Bachofen, H.; Bundziak, Y.; Bürgi, A.; Ramp, B.; Shparyk, Y.; Sukhariuk, D.; Viter, R.; Zingg, A. Structure of virgin and managed beech forest in Uholka (Ukraine) and Sihlwald (Switzerland): A comparative study. For. Snow Landsc. Res. 2005, 79, 45–56. [Google Scholar]
- Nord-Larsen, T.; Cao, Q.V. A diameter distribution model for even-aged beech in Denmark. For. Ecol. Manag. 2006, 231, 218–225. [Google Scholar] [CrossRef]
- Paffeti, D.; Travaglini, D.; Buonamici, A.; Nocentini, S.; Vendramin, G.G.; Giannini, R.; Vettori, C. The influence of forest management on beech (Fagus sylvatica L.) stand structure and genetic diversity. For. Ecol. Manag. 2012, 284, 34–44. [Google Scholar] [CrossRef]
- Rugani, T.; Diaci, J.; Hladnik, D. Gap Dynamics and Structure of Two Old-Growth Beech Forest Remnants in Slovenia. PLoS ONE 2013, 8, e52641. [Google Scholar] [CrossRef] [PubMed]
- Trotsiuk, V.; Hobi, M.; Commarmot, B. Age structure and disturbance dynamics of the relic virgin beech forest Uholka (Ukrainian Carpathians). For. Ecol. Manag. 2012, 265, 181–190. [Google Scholar] [CrossRef]
- Von Oheimb, G.; Westphal, C.; Tempel, H.; Härdtle, W. Structural pattern of a near-natural beech forest (Fagus sylvatica)(Serrahn, North-east Germany). For. Ecol. Manag. 2005, 212, 253–263. [Google Scholar] [CrossRef]
- Kucbel, S.; Saniga, M.; Jaloviar, P.; Vencurik, J. Stand structure and temporal variability on old-growth beech-dominated forests of the northwestern Carpathians: A 40-years perspective. For. Ecol. Manag. 2012, 264, 125–133. [Google Scholar] [CrossRef]
- Pretzsch, H.; Matthew, C.; Dieler, J. Allometry of Tree Crown Structure. Relevance for Space Occupation at the Individual Plant Level and for Self-Thinning at the Stand Level. In Growth and Defence in Plants. Ecological Studies (Analysis and Synthesis); Matyssek, R., Schnyder, H., Oßwald, W., Ernst, D., Munch, J., Pretzsch, H., Eds.; Springer: Berlin/Heidelberg, Germany, 2012; Volume 220. [Google Scholar] [CrossRef]
- Bianchi, L.; Bottacci, A.; Calamini, G.; Maltoni, A.; Mariotti, B.; Quilghini, G.; Salbitano, F.; Tani, A.; Zoccola, A.; Paci, M. Structure and dynamics of a beech forest in a fully protected área in the northern Apennines (SassoFratino, Italy). iForest 2011, 4, 136–144. [Google Scholar] [CrossRef] [Green Version]
- Herbert, I.; Rebeirot, F. Les futaies jardinées du Haut-Jura. Rev. For. Fr. 1985, 6, 465–481. [Google Scholar] [CrossRef] [Green Version]
- Chollet, F.; Kuus, L. La Typologie des hêtraies pyrénéennes. Rev. For. Fr. 1998, 2, 112–123. [Google Scholar] [CrossRef] [Green Version]
- Roig, S.; Alonso-Ponce, R.; Río, M.; Montero, G. Tipología dasométrica de masas puras y mixtas de sabina albar (Juniperus thurifera L.) española. In Actas Del Tercer Coloquio Internacional Sobre Los Sabinares y Enebrales (Género Juniperus): Ecología y Gestión Sostenible; Ed. Junta de Castilla y León: Soria, Spain, 2006; pp. 177–185. [Google Scholar]
- Aunós, A.; Martínez, E.; Blanco, R. Tipología selvícola para los abetales españoles de Abies alba Mill. Investig. Agraria. Sist. Rec. 2007, 16, 52–64. [Google Scholar] [CrossRef] [Green Version]
- Reque, J.A.; Bravo, F. Identifying forest structure types using National Forest Inventory Data: The case of sessile oak forest in the Cantabrian range. Investig. Agrar. Sist. Recur. 2008, 17, 105–113. [Google Scholar] [CrossRef] [Green Version]
- Gómez-Manzanedo, M.; Roig, S.; Reque, J.A. Caracterización selvícola de los hayedos cantábricos: Influencia de las condiciones de estación y los usos antrópicos. Investig. Agrar. Sist. Recur. For. 2008, 17, 155–167. [Google Scholar]
- Fabbio, G.; Cantiani, P.; Ferretti, F.; di Salvatore, U.; Bertini, G.; Becagli, C.; Chiavetta, U.; Marchi, M.; Salvati, L. Sustainable land management, adaptative silviculture, and new forest challenges: Evidence from a latitudinal gradient in Italy. Sustainability 2018, 10, 2520. [Google Scholar] [CrossRef] [Green Version]
- Becagli, C.; Puletti, N.; Chiavetta, U.; Cantiani, P.; Salvati, L.; Fabbio, G. Early impact of alternative thinning approaches on structure diversity and complexity at stand level in two beech forests in Italy. Ann. Silvic. Res. 2013, 37, 55–63. [Google Scholar]
- Georgi, L.; Kunz, M.; Fichtner, A.; Reich, K.F.; Bienert, A.; Maas, H.G.; von Oheimb, G. Effects of local neighbourhood diversity on crown structure and productivity of individuals trees in mature mixed-species forests. For. Ecosyst. 2021, 8, 26. [Google Scholar] [CrossRef]
- Williams, B.K. Some Observations of the Use of Discriminant Analysis in Ecology. Ecology 1983, 64, 1283–1291. [Google Scholar] [CrossRef]
- Mardia, K.V.; Kent, J.T.; Bibby, J.M. Multivariate Analysis; Academic Press: Cambridge, MA, USA, 1994. [Google Scholar]
- Riveiro-Valiño, J.A.; Álvarez-López, C.J.; Mareypérez, M.F. The use of discriminant analysis to validate a methodology for classifying farms based ona combinatorial algorithm. Comput. Electron. Agric. 2009, 66, 113–120. [Google Scholar] [CrossRef]
- MMA-DGB 2005 (Ministerio de Medio Ambiente. Dirección General de la Biodiversidad. Base de Datos de la Biodiversidad, Madrid). 2º Inventario Forestal Nacional 2005 [Second Nacional Forest Inventory (CD-rom)]. Available online: https://www.miteco.gob.es/es/biodiversidad/temas/inventarios-nacionales/inventario-forestal-nacional/index_segundo_inventario.aspx (accessed on 21 August 2021).
- Sánchez-Medina, A. Diagnóstico De Los Hayedos Burgaleses e Identificación De Tipologías Estructurales Para La Asignación De Tratamientos Selvícolas. Ph.D. Thesis, Universidad Politécnica de Madrid, Madrid, Spain, 2005. Available online: http://oa.upm.es/1402/ (accessed on 21 August 2021).
- MMA-DGB. 1º Inventario Forestal Nacional 1969 (CDROM). [First Nacional Forest Inventory (CD-rom)]; Ministerio de Medio Ambiente, Dirección General de la Biodiversidad. Base de Datos de la Biodiversidad: Madrid, Spain, 1969; Available online: https://www.miteco.gob.es/es/biodiversidad/servicios/banco-datos-naturaleza/informacion-disponible/primer_inventario_nacional_forestal.aspx/ (accessed on 21 August 2021).
- Saniga, M.; Schütz, J.P. Dynamics of changes in dead wood share in selected beech virgin forests in Slovakia within their development cycle. J. For. Sci. 2001, 47, 557–565. [Google Scholar]
- Wardle, J.A.; Hayward, J. The forests and scrublands of the Taramakau and the effects of browsing by deer and chamosis. Proc. N. Z. Ecol. Soc. 1970, 17, 80–91. [Google Scholar]
- Manson, B.R.; Guest, R. Protection forests of the Wairau catchment. N. Z. J. For. Sci. 1975, 5, 123–142. [Google Scholar]
- Wardle, J.A.; Guest, R. Forests of the Waitaki and Lake Hawea catchments. N. Z. J. For. Sci. 1977, 7, 44–97. [Google Scholar]
- Stewart, G.H.; Wardle, J.A.; Burrows, L.E. Forest understory changes after reduction in deer numbers, northern Fiorland, New Zealand. N. Z. J. For. Sci. 1987, 10, 35–42. [Google Scholar]
- Stewart, G.H.; Burrows, L.E. The impact of white-tailed deer Odocoileus virginianus on regeneration in the coastal forests of Stewart Island, New Zealand. Biol. Conserv. 1989, 49, 275–293. [Google Scholar] [CrossRef]
- Allen, R.B. RECCE: An inventory method for describing New Zealand vegetation. Forest Research Institute, New Zealand. FRI Bull. 1992, 181, 25. [Google Scholar]
- Molinaro, A.M.; Simon, R.; Pfeiffer, R.M. Prediction error estimation: A comparison of resampling methods. Bioinformatics 2005, 21, 3301–3307. [Google Scholar] [CrossRef] [Green Version]
- Algina, J.; Keselman, H.J. Cross-Validation Sample Sizes. Appl. Psychol. Meas. 2000, 24, 173–179. [Google Scholar] [CrossRef]
- Sánchez-Medina, A.; Grande-Ortiz, M.A.; Ayuga-Téllez, E.; García-Abril, A.; González-García, C. Identificación de los Tipos de Estructuras Forestales de los Hayedos Burgaleses Mediante Análisis Estadístico; V Congr. Nac. Congr. Ibérico Agroingeniería, Ed.; Departamento de Ingeniería Agroforestal, Escuela Politécnica Superior de Lugo: Lugo, Spain, 2009; Volume 11, p. 469. ISBN 978-84-692-5560-5. [Google Scholar]
- Davidson, N.J.; Close, D.C.; Battaglia, M.; Churchill, K.; Ottenschlaeger, M.; Watson, T.; Bruce, J. Eucalypt health and agricultural land management within bushland remnants in the Midlands of Tasmania. Aust. Biol. Conserv. 2007, 139, 439–446. [Google Scholar] [CrossRef]
- Ramayah, T.; Hazlina Ahmad, N.; Abdul Halim, H.; Mohamed Zainal, S.; Lo, M. Discriminant analysis: An illustrated example. Afr. J. Bus. Manag. 2010, 4, 1654–1667. [Google Scholar]
- Neville, P.; Tan, P.Y.; Mann, G.; Wolfinger, R. Generalizable mass spectrometry mining used to identify disease state biomarkers from blood serum. Proteomics 2003, 3, 1710–1715. [Google Scholar] [CrossRef]
- Harwood, V.J.; Whitlock, J.; Withington, V. Classification of Antibiotic Resistance Patterns of Indicator Bacteria by Discriminant Analysis: Use in Predicting the Source of Fecal Contamination in Subtropical Waters. Appl. Environ. Microbiol. 2000, 66, 3698–3704. [Google Scholar] [CrossRef] [PubMed] [Green Version]
- Carson, A.; Shear, B.L.; Ellersieck, M.R.; Schnell, J.D. Comparison of Ribotyping and Repetitive Extragenic Palindromic-PCR for Identification of Fecal Escherichia coli from Humans and Animals. Appl. Environ. Microbiol. 2003, 69, 1836–1839. [Google Scholar] [CrossRef] [PubMed] [Green Version]
- Ayuga-Téllez, E.; González-García, C.; Martin Fernández, S.; Martínez Falero, J.E.; Pardo, M. Técnicas De Muestreo En Ciencias Forestales y Ambientales; Bellisco: Madrid, Spain, 1999; p. 328. ISBN 84-930002-6-4. [Google Scholar]
- Bannister, J.R.; Donoso, P.J. Forest typification to characterize the structure and composition of old-growth evergreen forest on Chiloe Island, North Patagonia (Chile). Forests 2013, 4, 1087. [Google Scholar] [CrossRef]
- Valerio, M.; Ibañez, R.; Gazol, A. The role of canopy cover dynamics over a decade of changes in the understory of an atlantic beech-oak forest. Forests 2021, 12, 938. [Google Scholar] [CrossRef]
- Sánchez-Medina, A.; Ayuga Téllez, E.; Grande-Ortiz, M.A.; García-Abril, A. Forestry alternatives to Navarran yield tables for beech (Fagus sylvatica L.). Allg. Forst-Und Jagdztg. 2008, 179, 225–231. [Google Scholar]


| Variable | % BA1 | % BA2 | % BA3 | % BA4 |
|---|---|---|---|---|
| Average | 4.4 | 5.4 | 12.4 | 78.1 |
| Error | 2.8 | 3.0 | 3.7 | 2.7 |
| Range | 1.6–7.2 | 2.4–8.4 | 8.6–16.1 | 75.5–80.8 |
| % BA1 | % BA2 | % BA3 | % BA4 |
|---|---|---|---|
| SR | IR | SR | SR |
| SR | IR | SR | IR |
| SR | IR | IR | SR |
| SR | SR | IR | SR |
| IR | SR | IR | SR |
| Variable | Group | |||||
|---|---|---|---|---|---|---|
| SP | TP | MP | ThP | S | MD | |
| % BA1 | 0.569 | 0.267 | 0.092 | 0.130 | 0.217 | 0.197 |
| % BA2 | 0.302 | 0.462 | 0.160 | 0.186 | 0.168 | 0.270 |
| % BA4 | 0.155 | 0.154 | 0.087 | 0.366 | 0.256 | 0.180 |
| Constant | −25.795 | −17.915 | −3.097 | −16.577 | −10.673 | −9.059 |
| Variable | Group | |||||
|---|---|---|---|---|---|---|
| SP | TP | MP | ThP | S | MD | |
| % BA1 | 0.857 | 0.450 | 0.146 | 0.369 | 0.647 | 0.373 |
| % BA2 | 0.478 | 0.705 | 0.206 | 0.389 | 0.361 | 0.448 |
| % BA4 | 0.386 | 0.353 | 0.157 | 0.604 | 0.460 | 0.337 |
| Constant | −39.684 | −29.540 | −3.658 | −26.587 | −29.140 | −14.640 |
| DA | Group | |||||
|---|---|---|---|---|---|---|
| SP | TP | MP | ThP | S | MD | |
| First DA | 26 | 16 | 74 | 34 | 2 | 49 |
| Second DA | 29 | 25 | 73 | 25 | 22 | 27 |
| Variable | Mean | |||||
| SP | TP | MP | ThP | S | MD | |
| % BA1 | 0.569 | 0.267 | 0.092 | 0.130 | 0.217 | 0.197 |
| % BA2 | 0.302 | 0.462 | 0.160 | 0.186 | 0.168 | 0.270 |
| % BA4 | 0.155 | 0.154 | 0.087 | 0.366 | 0.256 | 0.180 |
| Constant | −25.795 | −17.915 | −3.097 | −16.577 | −10.673 | −9.059 |
| Variable | Standard Deviation | |||||
| SP | TP | MP | ThP | S | MD | |
| % BA1 | 0.569 | 0.267 | 0.092 | 0.130 | 0.217 | 0.197 |
| % BA2 | 0.302 | 0.462 | 0.160 | 0.186 | 0.168 | 0.270 |
| % BA4 | 0.155 | 0.154 | 0.087 | 0.366 | 0.256 | 0.180 |
| Constant | −25.795 | −17.915 | −3.097 | −16.577 | −10.673 | −9.059 |
Publisher’s Note: MDPI stays neutral with regard to jurisdictional claims in published maps and institutional affiliations. |
© 2021 by the authors. Licensee MDPI, Basel, Switzerland. This article is an open access article distributed under the terms and conditions of the Creative Commons Attribution (CC BY) license (https://creativecommons.org/licenses/by/4.0/).
Share and Cite
Sánchez-Medina, A.; Ayuga-Téllez, E.; Grande-Ortiz, M.A.; González-García, C.; García-Abril, A. Iterative Method of Discriminant Analysis to Classify Beech (Fagus sylvatica L.) Forest. Forests 2021, 12, 1128. https://doi.org/10.3390/f12081128
Sánchez-Medina A, Ayuga-Téllez E, Grande-Ortiz MA, González-García C, García-Abril A. Iterative Method of Discriminant Analysis to Classify Beech (Fagus sylvatica L.) Forest. Forests. 2021; 12(8):1128. https://doi.org/10.3390/f12081128
Chicago/Turabian StyleSánchez-Medina, Alvaro, Esperanza Ayuga-Téllez, Maria Angeles Grande-Ortiz, Concepción González-García, and Antonio García-Abril. 2021. "Iterative Method of Discriminant Analysis to Classify Beech (Fagus sylvatica L.) Forest" Forests 12, no. 8: 1128. https://doi.org/10.3390/f12081128
APA StyleSánchez-Medina, A., Ayuga-Téllez, E., Grande-Ortiz, M. A., González-García, C., & García-Abril, A. (2021). Iterative Method of Discriminant Analysis to Classify Beech (Fagus sylvatica L.) Forest. Forests, 12(8), 1128. https://doi.org/10.3390/f12081128