Article

Genetic Diversity Analysis and Potential Distribution Prediction of Sophora moorcroftiana Endemic to Qinghai–Tibet Plateau, China

1
College of Agriculture, Guizhou University, Guiyang 550025, China
2
Institute for Forest Resources and Environment of Guizhou, Guizhou University, Guiyang 550025, China
3
Key Lab Forest Ecology Tibet Plateau, Ministry Education, Tibet Agriculture & Animal Husbandry University, Nyingchi 860000, China
*
Author to whom correspondence should be addressed.
Forests 2021, 12(8), 1106; https://doi.org/10.3390/f12081106
Submission received: 24 July 2021 / Revised: 12 August 2021 / Accepted: 16 August 2021 / Published: 18 August 2021
(This article belongs to the Special Issue Importance of Genetic Diversity for Forest and Landscape Restoration)

Abstract

:
Sophora moorcroftiana (Benth.) Baker is an endemic woody species distributed in the Qinghai–Tibet Plateau (QTP), a part of the world characterized by high altitude and cold weather. In this study, the genetic diversity of S. moorcroftiana was evaluated based on 300 representative samples of 15 populations using 20 polymorphic SSR markers, and its potential distribution was predicted according to 19 bioclimatic factors using MaxEnt modeling. Results showed the population genetic diversity of S. moorcroftiana was generally not high (around 0.5), and the range of variation was small (0.437–0.539). Altitude, rather than other environmental factors, was the key factor affecting the present genetic diversity. Moreover, due to climate change in the QTP, the suitable area is increasing and will continue to increase by 48.35%, 84.44%, 101.98%, and 107.30% in the four future periods of 2030s, 2050s, 2070s, and 2090s, respectively, compared to the present, which is beneficial for S. moorcroftiana. These results will provide a theoretical basis for the development of germplasm conservation strategies for S. moorcroftiana and enrich information on the impacts of climate change on plants in the QTP.

1. Introduction

The global climate temperature has continuously increased for nearly 100 years. According to the Intergovernmental Panel on Climate Change (IPCC) report, the global average surface temperature has increased by 0.8 °C over the past 130 years and will continue to increase in the future [1]. Climate change is the most serious environmental challenge for living creatures, which will lead to higher rates of extinction, lower species diversity, and more fragile regional ecosystems [1]. In addition, precipitation patterns have changed and extreme climate events have increased, which have affected the growth and distribution of plants [2,3]. These changes have also driven plant diversity alteration and posed a serious threat to biodiversity [4]. During the long process of species evolution, gene and climate have formed a stable interaction relationship. The climate would inevitably change the genetic material and then cause changes to genetic diversity [5]. Furthermore, it might lead to population shrinkage and interrupt the exchange of genetic material between populations, thereby resulting in constant inbreeding within the species and genetic diversity loss [5,6]. By contrast, it could also increase genetic diversity and thus lead to population growth and expansion [7].
The Qinghai–Tibet Plateau (QTP), known as the “Roof of the World″, is the highest, largest, and youngest plateau in the world. However, it has been recognized as an early warning and sensitive area of global climate change due to its unique geographical environment [8]. Because of the high altitude (average above 4000 m), cold weather, and uneven distribution of precipitation [1], plants in the QTP have been reported to be sensitive to climate change, and their evolution is closely related to the change [9]. Studies have shown that the average annual temperature of the QTP will rise by 1.3–4.2 °C in the next 100 years; in this regard, woody plants will migrate to the northwest and enter the QTP interior, gradually replacing herbaceous plants [9]. At present, the impact of the change on plant distribution and diversity in the QTP is the focus of academic attention [8].
The unique environment of the QTP has produced many endemic species [10]. Sophora moorcroftiana (Benth.) Baker is one of them. It is a low perennial shrub with blue-purple flowers in the leguminous family [10]. This species is mainly distributed in the reaches of the Yarlung Tsangpo River basin with an altitude of 2800–4400 m in the QTP [11]. It has ecological, ornamental, medicinal, and animal feeding values [12,13]. However, in recent years, it has been found that the distribution is fragmented and the number of resources has been reduced. Therefore, it urgently needs to be conserved. Genetic evolution of plant species in the QTP has been influenced by climate change [11]. Although S. moorcroftiana is a valuable endemic species there, it is at risk of isolation and extinction, and whether its genetic status is affected by climate change remains unclear.
With the increasing availability of climatic data and the development of analytical methods, species distribution modeling has brought a new perspective to genetic diversity. The possible effects of climate change on plant diversity can be explored based on the simulation of species distribution [14]. Some previous studies on plant species distributed in the QTP and its adjacent regions have focused on the impact of historical and future climate change on plant species distribution patterns [8,9], which has helped us better understand the past and future of the species in the QTP. However, whether the genetic diversity of species is affected by climate factors in the QTP is unknown. Applying genetic diversity research to resource conservation is critical. Considering the particularity of the QTP and its sensitivity to climate change, it is of great significance to study the genetic diversity and predict the distribution variation of S. moorcroftiana under climate change for the conservation of this endemic species in the QTP.
In this study, 20 SSR markers were used to analyze the genetic diversity of 15 natural populations (300 loci) of S. moorcroftiana, and niche models were employed to comprehensively study the distribution of S. moorcroftiana. The specific objectives were as follows: to illustrate the present genetic diversity of S. moorcroftiana, to determine whether the genetic diversity is affected by climate change, and to determine whether climate change will have a positive or negative impact on S. moorcroftiana distribution in the QTP. The results will provide a theoretical basis for the development of germplasm conservation strategies of S. moorcroftiana and also enrich information on the impacts of climate change on plants in the QTP.

2. Materials and Methods

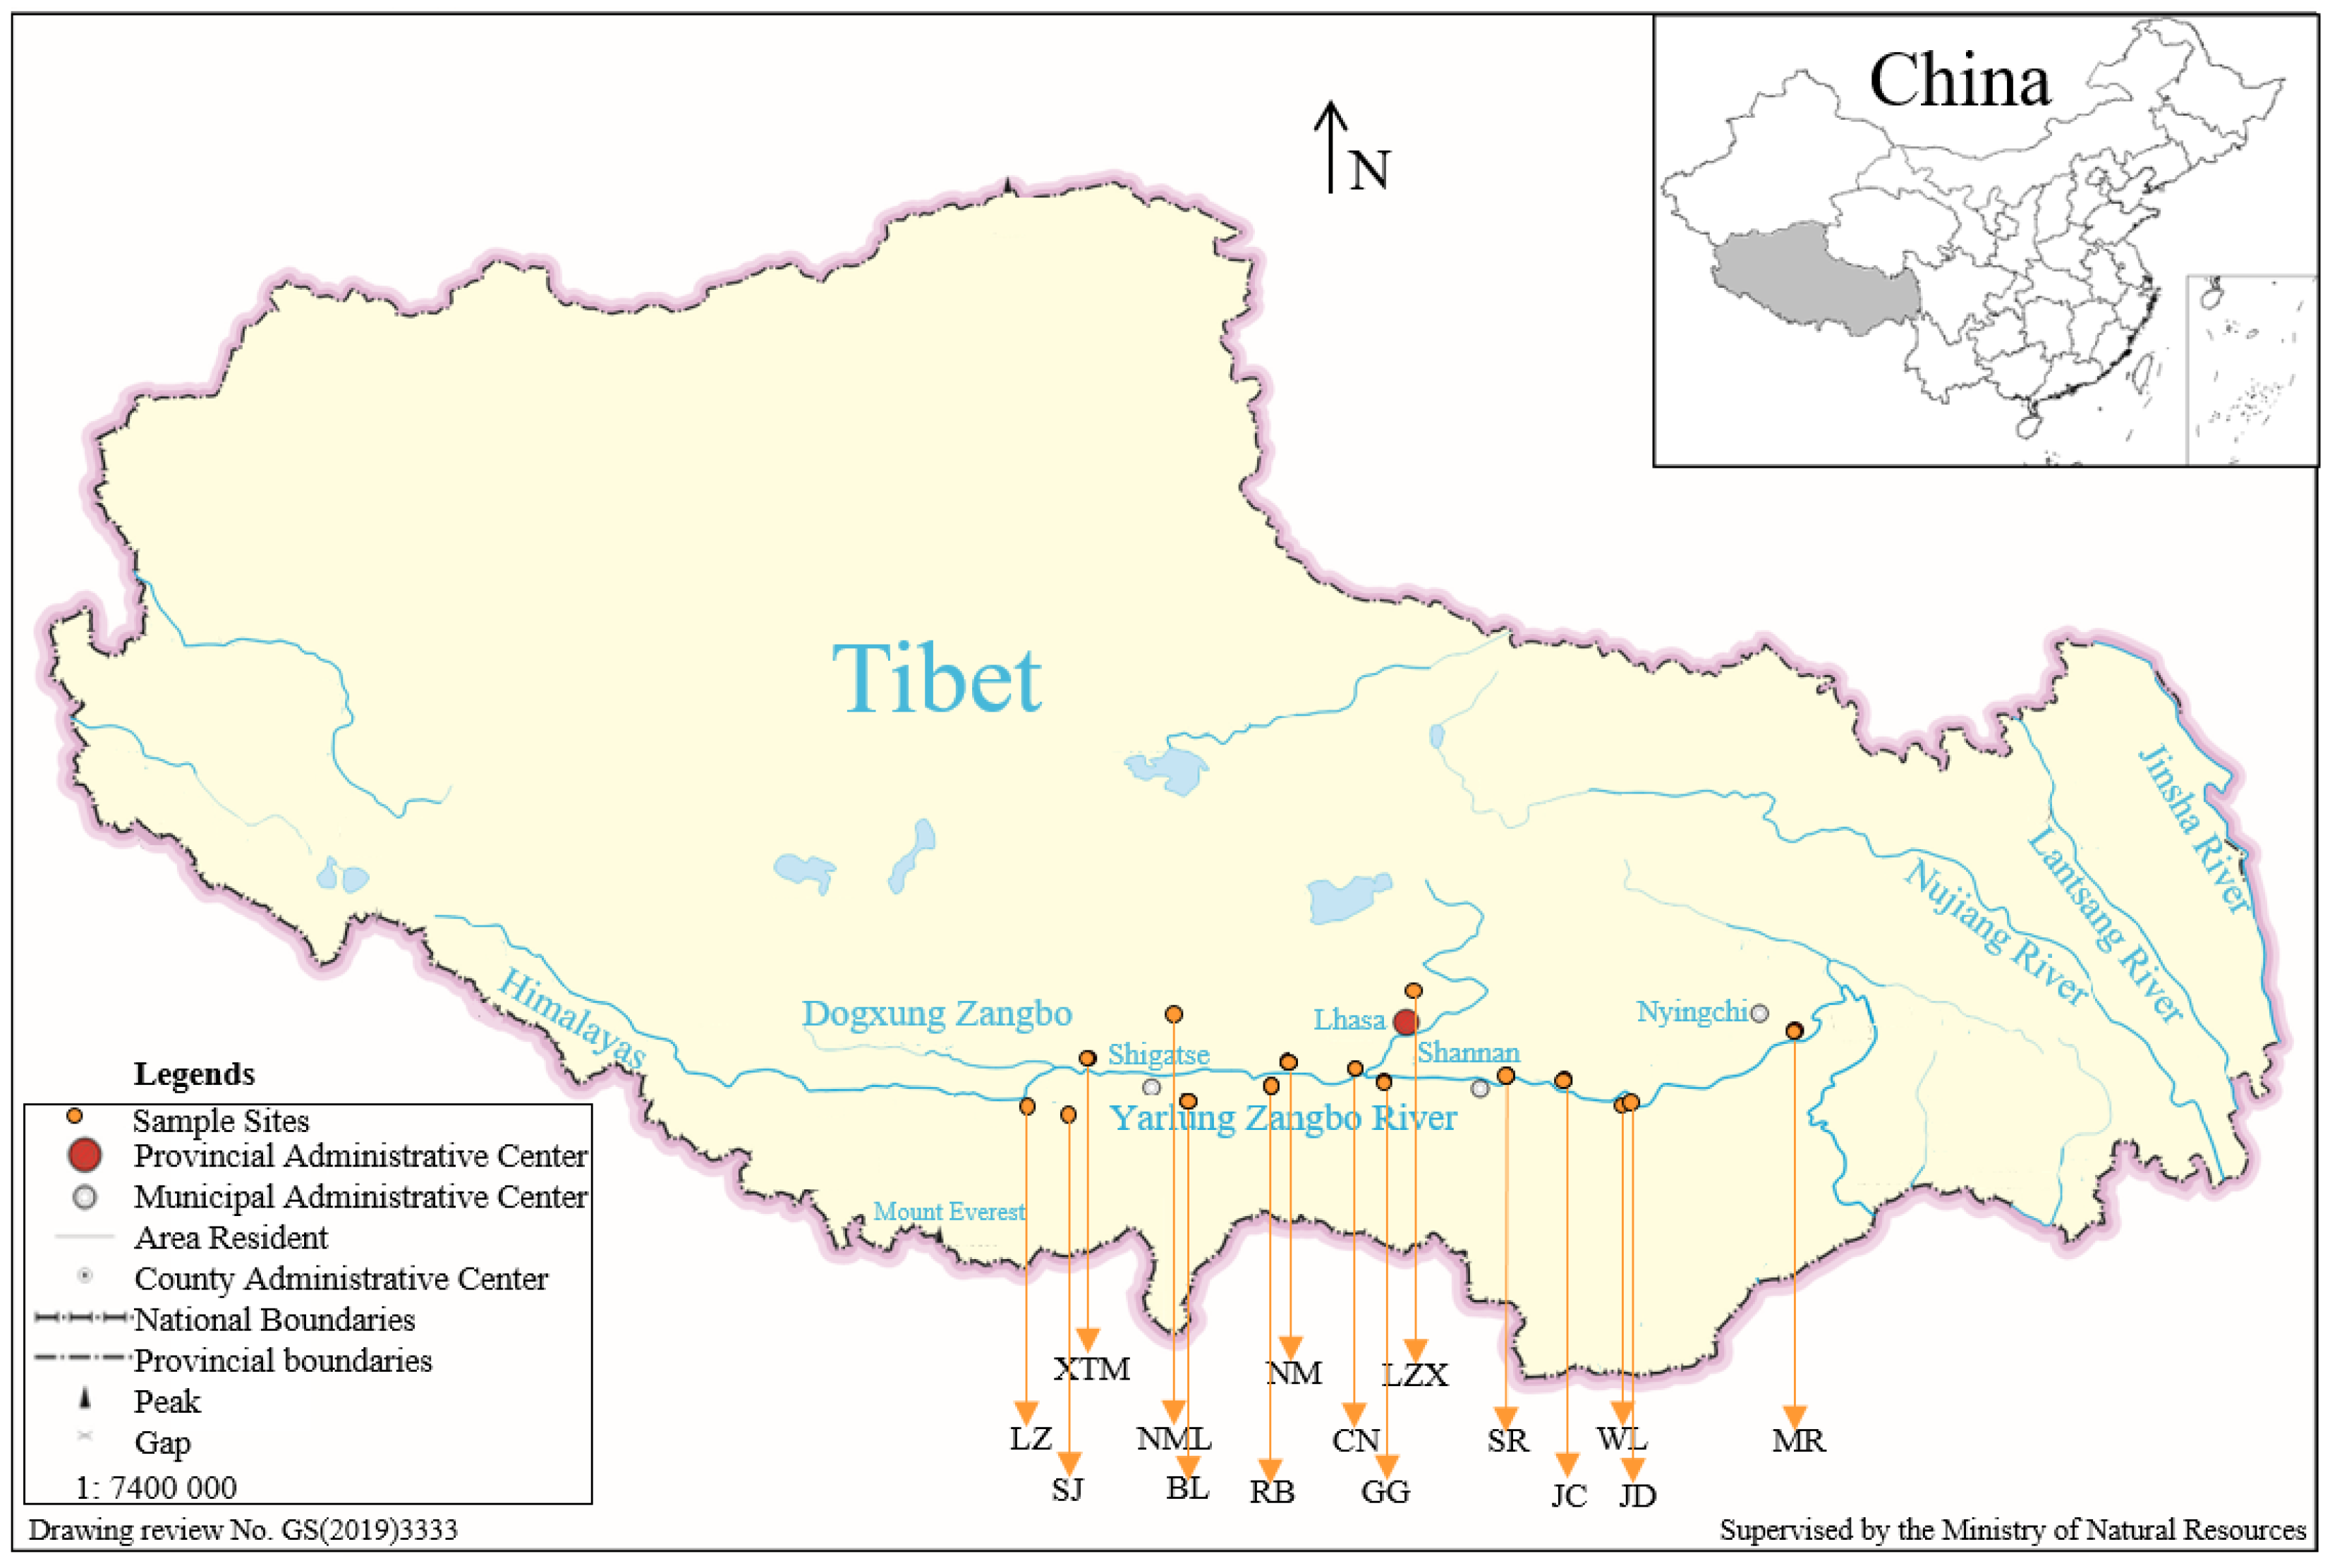
2.1. Materials and Data Sources

Plant materials were sampled from 15 populations in the sand-generating locust distribution area of the Yarlung Tsangpo River basin of Tibet (Figure 1) from Nyingchi in the east to the west through Shannan, Lhasa, and then to Shigatse with increasing altitude (2931–4087 m) in 2019. Twenty representative individuals without diseases and pests were randomly sampled from each population, and the distance between individuals was no less than 100 m. The individual numbers and sampling information of each population are shown in Table 1. Additional distribution information was collected from published articles and the global biodiversity information network (GBIF) (http://www.gbif.org/ (accessed on 06 April 2021)) to improve the prediction accuracy. The longitude and latitude of all 60 geographical distribution data are listed in Table S1. The environmental data of 19 bioclimatic factors in two past periods (Last Glacial Maximum (LGM) and mid-Holocene (MH)), the present (1970–2000), and four future periods (2020–2040, 2040–2060, 2060–2080, and 2080–2100) were obtained from Worldclim (http://www.worldclim.org (accessed on 24 March 2021)) (Table S2).

2.2. DNA Extraction, Primer Screening, and PCR Amplification

Genomic DNA was extracted from the germinating radicles of S. moorcroftiana seeds using the cetyltrimethylammonium bromide (CTAB) method [15]. DNA concentration and purity was detected by an ultramicro spectrophotometer (Thermofisher, Singapore). The DNA was diluted to 100 ng/μL and stored at −20 °C for later experiment. A total of 123 SSR primers were designed, screened by agarose gel electrophoresis, and detected by 8% polyacrylamide gel electrophoresis. Twenty SSR primers (Table S3) with stable polymorphic bands were screened for subsequent capillary electrophoresis analysis. PCR was performed with a total volume of 25 μL containing 12.5 μL of 2x Taq PCR Mix, 1 μL each of forward and reverse primers, 1 μL of template DNA, and 25μL ddH2O complement. The reaction procedure comprised initial denaturation at 94 °C for 3 min, followed by 30 s at 94 °C; annealing using descending PCR starting at 63 °C with 0.2 °C per cycle for 30 s, 35 cycles at 72 °C for 1 min, followed by final extension cycle at 72 °C for 5 min; and then preserving at 4 °C for subsequent capillary electrophoresis analysis.
Then, 300 representative samples of S. moorcroftiana were amplified by PCR using 20 pairs of screened fluorescent marker SSR primers. The PCR products were genotyped according to fragmentation length using high-performance capillary electrophoresis (Emilion, China) [16]. A data matrix was created, recorded, saved using computer software, and used for subsequent analysis.

2.3. Genetic Diversity Analysis

Genetic diversity parameters, including the average number of alleles (Na), effective number of alleles (Ne), observed heterozygosity (Ho), expected heterozygosity (He), Nei’s gene diversity coefficient (H), Shannon’s diversity index (I), inbreeding coefficient (FIS), gene flow (Nm), and genetic differentiation index (FST), were calculated by PopGen v3.2 software [17,18]. The percentage of polymorphic loci (PPL) was calculated using PowerMarker v3.25 [18]. Based on the result of Nei’s genetic distance, the principal coordinate analysis (PCoA) of 300 individuals was conducted with Gene Alex v6.5 software [19]. Redundancy analysis (RDA) between genetic parameters (Na, Ne, Ho, He, PPL, F, and I) and environmental factors (annual average temperature, annual average precipitation, latitude, longitude, and altitude) was performed using the Canoco 5 software [20]. Bayesian clustering analysis of S. moorcroftiana population genetic structure was conducted using Structure v2.3.4 software [18]. The program was run with the admixture model and independent allele frequency using a burn-in period of 1 × 10⁶ and 1 × 10⁵ Markov chain Monte Carlo (MCMC) replications. Twenty independent runs were performed for each K value ranging from 1 to 20. The most likely number of clusters was evaluated using △K, and the log-likelihood value was evaluated with Structure Harvester v0.6.94 [21]. All analyses were based on the SSR data.

2.4. Niche Modelling for Past Two Periods, the Present, and Four Future Periods

Climatic data were obtained from the world climatic database (Worldclim. http://www.worldclim.org (accessed on 24 March 2021)). Climatic factors from LGM and MH were selected as the two past climatic data, and MIROC-ESM was chosen as the general circulation model. In addition, climatic factors from 1960 to 1990 were selected as the present climatic data, and climatic factors from 2030s, 2050s, 2070s, and 2090s were selected as future climatic data. BCC-CSM2-MR, CNRM-CM6-1, and MIROC-ES2L, which were developed by the World Climate Database, were selected as three general atmospheric circulation models. The 19 climatic factors were derived from the following four parameters: minimum monthly temperature, maximum monthly temperature, mean monthly temperature, and monthly precipitation. When built in the maximum entropy model, the multicollinearity of the environment variables can lead to excessive fitting model and further influence the accuracy of the fitting results. Therefore, preprocessing the climate data is necessary before building the maximum entropy model. ENMTools software was used to calculate the Pearson correlation coefficient matrix among the 19 present bioclimatic factors (territory in China) [22]. The threshold value of 0.80 was used to determine whether the correlation was significant. MaxEnt v3.3.3 software was used for premodeling to obtain the percentage contributions of each factor to the model and the analysis results of Jackknife. Each factor with contribution rate greater than 2.00 was retained, and the filtered bioclimatic factors were used for the final building niche model [23]. The element types and the regularization multiplier were optimized using the “Kuenm” language package in R language [24].
According to the four Representative Concentration Pathways (RCP) published in the IPCC Fifth Assessment Report (IPCC5, 2015), RCP 4.5 climate scenarios were selected to represent high CO2 concentrations in the future according to the principles of representability and priority. The original climatic data layers were extracted by DIVA-GIS software, and the climatic data layers of 19 bioclimatic variables in the region (28°10′00″–34°88′00″ N, 77°39′45″–98°60′69″ E) were obtained. The layers were transformed into the climatic data layer in ASCII format by DIVA-GIS to construct the MaxEnt model. MaxEnt v3.3.3 software was used to build the niche model for the past two periods and the present period and then to project the three kinds of general circulation models (BCC-CSM2-MR, CNRM-CM6-1, and MIROC-ES2L) and RCP 4.5 to the next four future periods (2030s, 2050s, 2070s, and 2090s). Finally, the prediction results were averaged.
The data information table of 60 distribution points in the csv format and the selected bioclimatic factors were imported into MaxEnt v3.3.3 software. For the distribution point data, 70% was randomly selected for model building, and the remaining 30% was used as the test data. A 10-fold subsample was applied to generate multimodel means and quantify uncertainties associated with subsample model variance over 10 replicate runs. A 10% omission threshold and 5000 bootstrap iterations were specified, and the remaining parameters were set as default. The analysis results were generated in grd format in the MaxEnt niche model and could be converted to a raster layer in DIVA-GIS [25]. In addition, the threshold value of suitable area classification could be obtained from the results of MaxEnt, and the suitable areas of S. moorcroftiana under the past, present, and future periods were calculated by R language package and a series of mathematical formulas. The MaxEnt prediction results were evaluated. The AUC value of the ROC curve represents the accuracy of the prediction results, and the AUC value is the area of the ROC curve and the X-axis. A large AUC indicates a good prediction result. The prediction result is excellent when AUC ranges from 0.90 to 1.00, good when AUC ranges from 0.80 to 0.90, general when AUC ranges from 0.70 to 0.80, poor when AUC ranges from 0.60 to 0.70, and failed when AUC ranges from 0.50 to 0.60 [26]. Based on the present distribution of S. moorcroftiana, the ROC curve of the MaxEnt model showed that the training AUC value was 0.9736 ± 0.0037, and the test AUC value was 0.9821 ± 0.0113. The prediction result of the MaxEnt model was excellent according to the AUC evaluation index. Hence, the prediction result of the model was reliable.

3. Results

3.1. Genetic Diversity Analysis

3.1.1. Genetic Diversity Analysis of SSR Loci

A total of 96 Na were detected in 300 samples using 20 primer pairs (corresponding to 20 loci, represented by Sm). The average allele number of each population was 4.803. Twelve loci (Sm6, Sm8, Sm10, Sm11, Sm12, Sm14, Sm15, Sm16, Sm17, Sm18, Sm19, and Sm20) were less than four alleles, and eight loci (Sm1, Sm2, Sm3, Sm4, Sm5, Sm7, Sm9, and Sm13) were more than three alleles. Ne was 57.562. The Ne of a single locus ranged from 1.003 (Sm8) to 8.122 (Sm2) with an average of 2.878. I ranged from 0.008 (Sm8) to 2.188 (Sm2) with an average of 0.994. Ho ranged from 0.000 (Sm18) to 1.000 (Sm1) with an average of 0.568. He ranged from 0.003 (Sm8) to 0.860 (Sm2), and the average expected heterozygosity was 0.489. The fixed index (F) ranged from −0.598 (Sm6) to 1.000 (Sm18), and the average was −0.069. Only Sm4, Sm13, Sm17, Sm18, and Sm19 had positive values, and the others had negative values, indicating the presence of more heterozygotes in the S. moorcroftiana population (Table S4). The average polymorphic information content was more significant than 0.5, implying abundant polymorphism. The genetic diversity of Sm18 was the lowest, and those of Sm1, Sm2, Sm3, and Sm5 were relatively high. The diversity index differed for each locus, indicating that the genetic diversity of varying loci also varied.

3.1.2. Genetic Diversity of S. moorcroftiana Population

At the population level, 20 primer pairs revealed that polymorphic loci (PPL) ranged from 80% (LZX) to 95.00% (NML and SJ). Na ranged from 3.70 (MR) to 5.50 (SJ) with an average of 4.80. Ne ranged from 2.266 (MR) to 3.250 (RB) with an average of 2.878. I ranged 0.816 (MR) to 1.118 (SJ) with an average of 0.994. Ho ranged from 0.516 (MR) to 0.648 (JC) with an average of 0.568. He ranged from 0.437 (MR) to 0.539 (SJ) with an average of 0.489. Only one population, SJ, had a positive F with an average of −0.120 (Table 2).

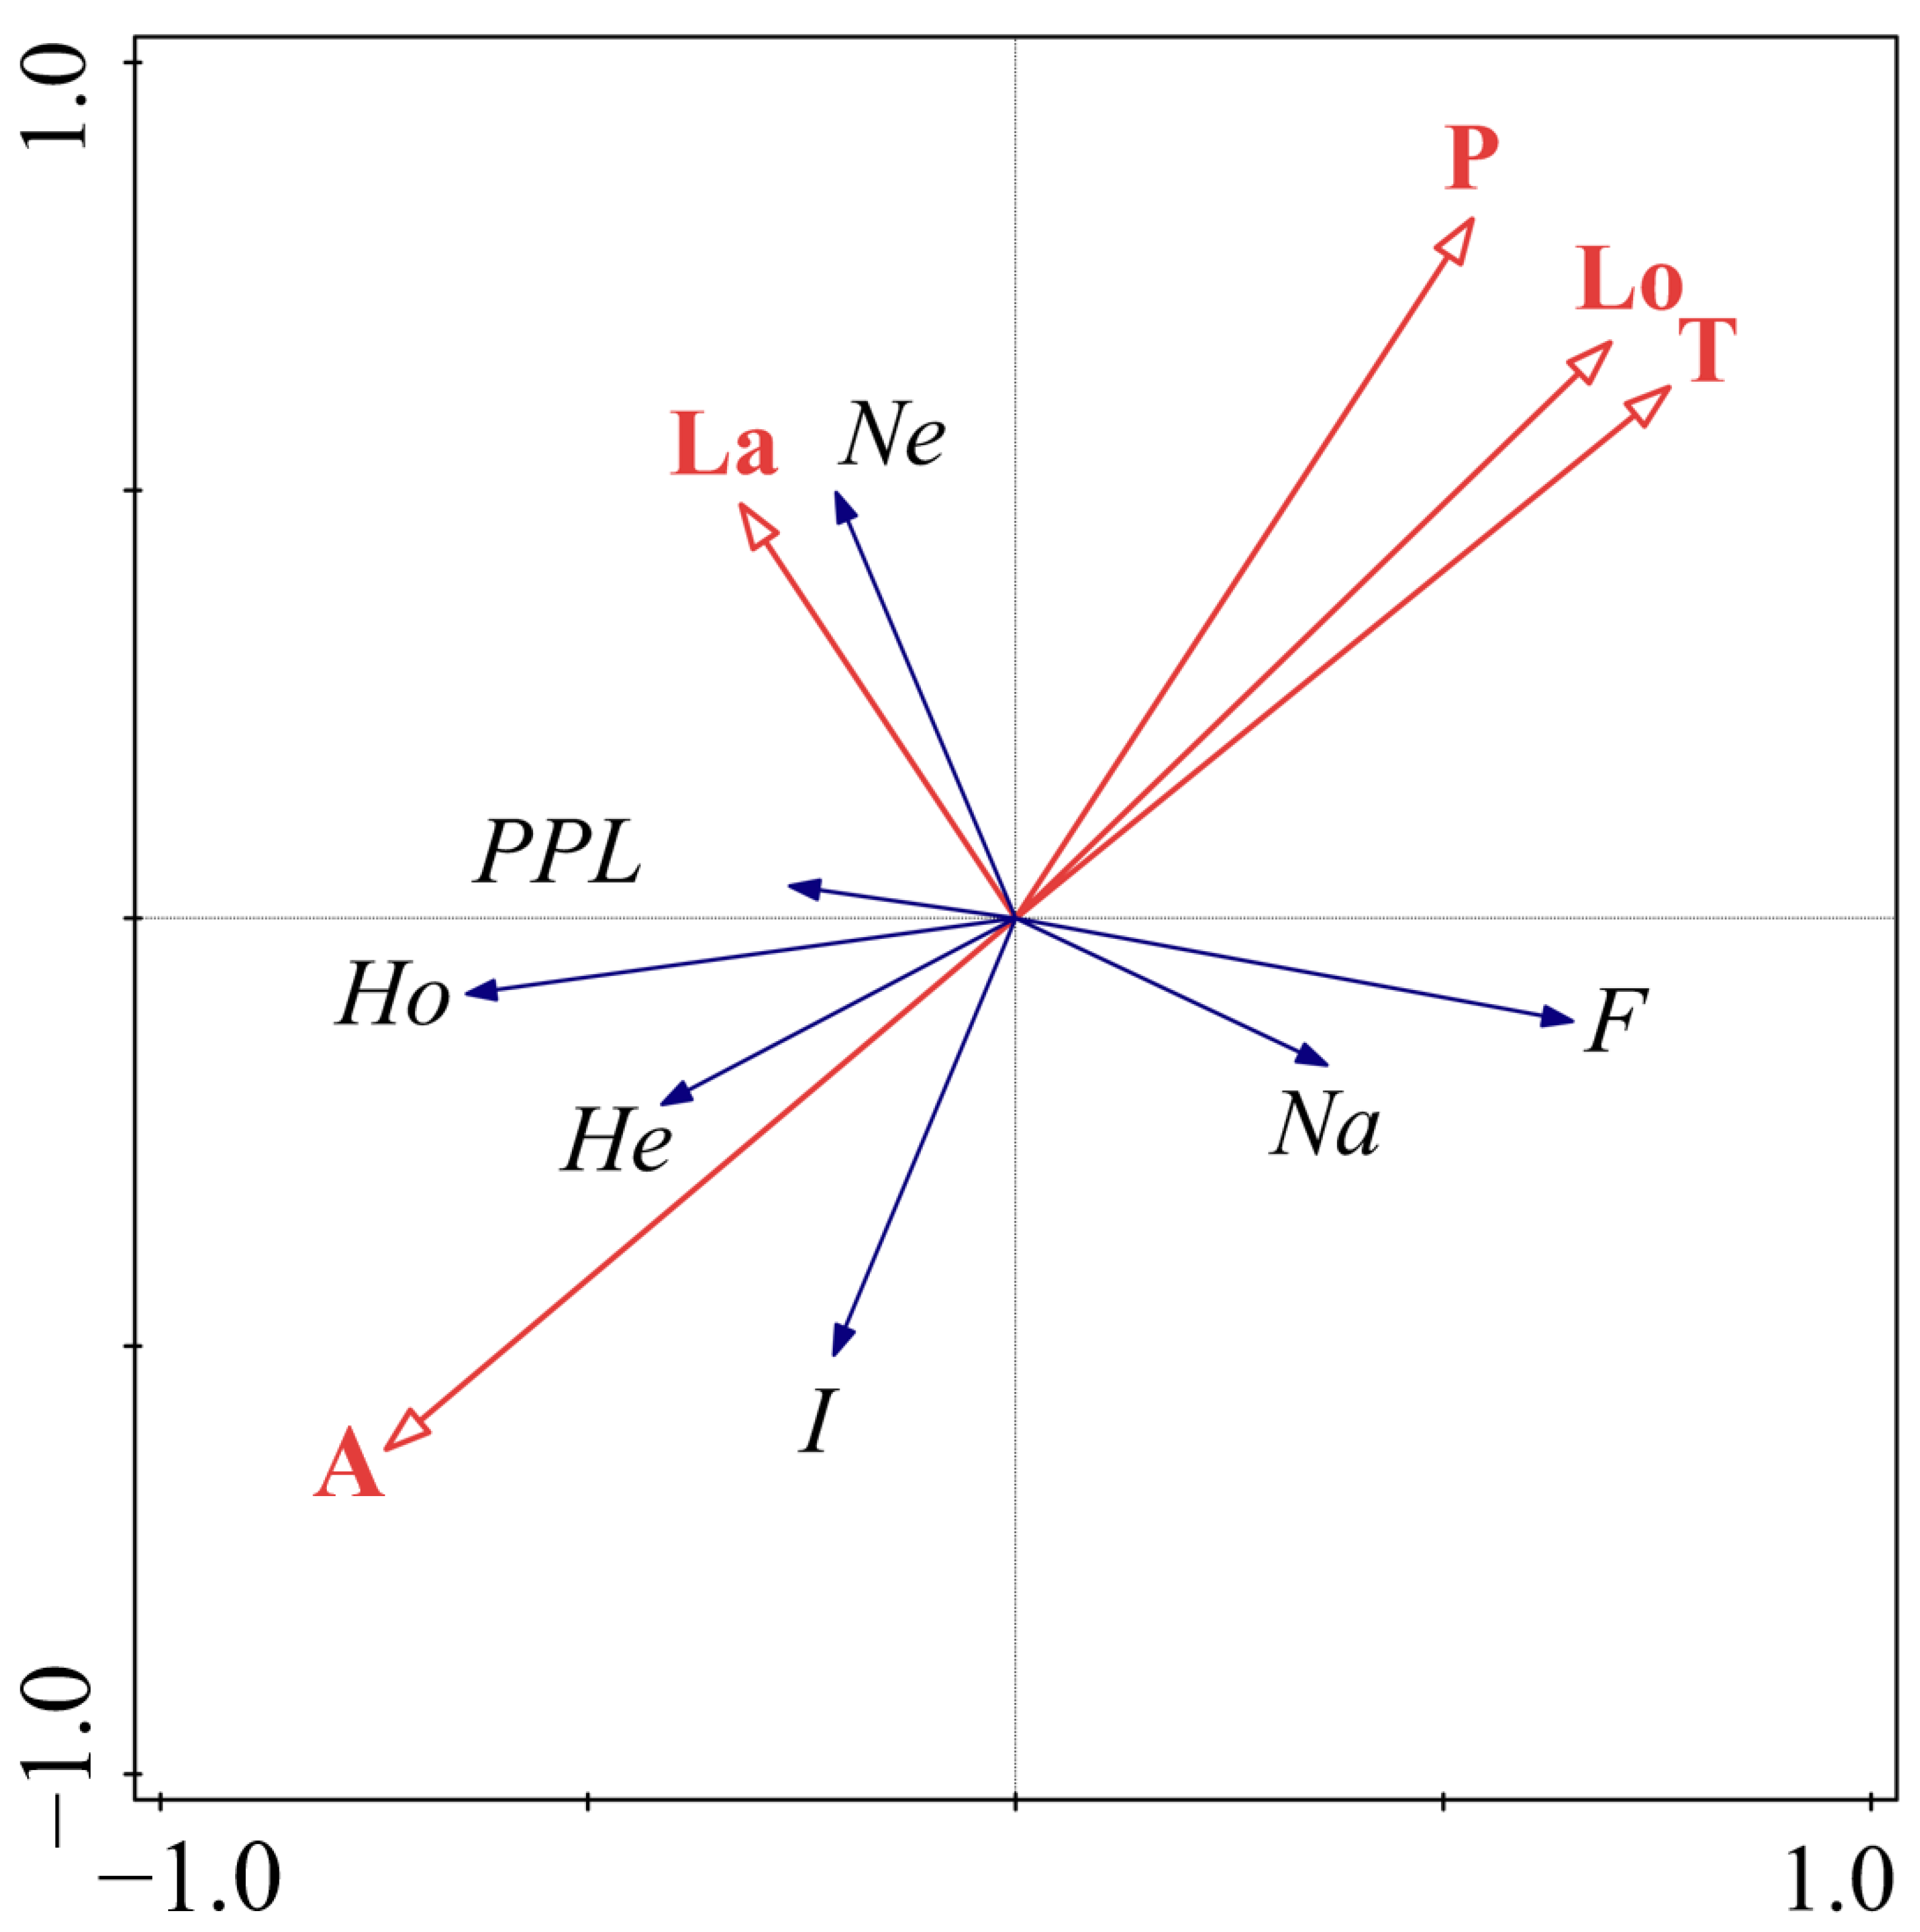
3.1.3. Genetic Differentiation and Gene Flow among Populations of S. moorcroftiana

The genetic differentiation coefficient (FST) among S. moorcroftiana natural populations ranged from 0.017 to 0.179 with an average of 0.078. Genetic differentiation was the largest between JD and XTM (FST = 0.179) populations and the smallest between LZX and NML (FST = 0.017) populations (Table S5). Gene flow (Nm) varied from 0.181 to 4.303 with an average of 0.917, with the maximum (Nm = 4.303) found between LZX and NML populations and the minimum (Nm = 0.181) between JD and XTM populations (Table S6). AMOVA for the S. moorcroftiana natural populations showed that 12% of genetic variation existed between populations and 88% within individuals (Table S7). Consistent with the genetic differentiation coefficient (FST = 0.078), the degree of differentiation was small between populations and large between individuals. In addition, the gene flow (Nm) between populations was 0.917, indicating extensive gene exchange among populations and genetic differentiation among individuals caused by the geographical environment. Genetic parameters such as PPL, Na, Ne, Ho, He, F, and I are indicators of population genetic diversity. He is currently the most widely used parameter as it is less affected by sample size and can represent population genetic diversity. RDA results (Figure 2) showed that the angle between altitude, latitude, and He was obtuse angle, indicating a positive correlation, and the attachment length to the origin of altitude was longer than the latitude. Therefore, altitude was the key environmental variable to affect the genetic diversity of S. moorcroftiana.

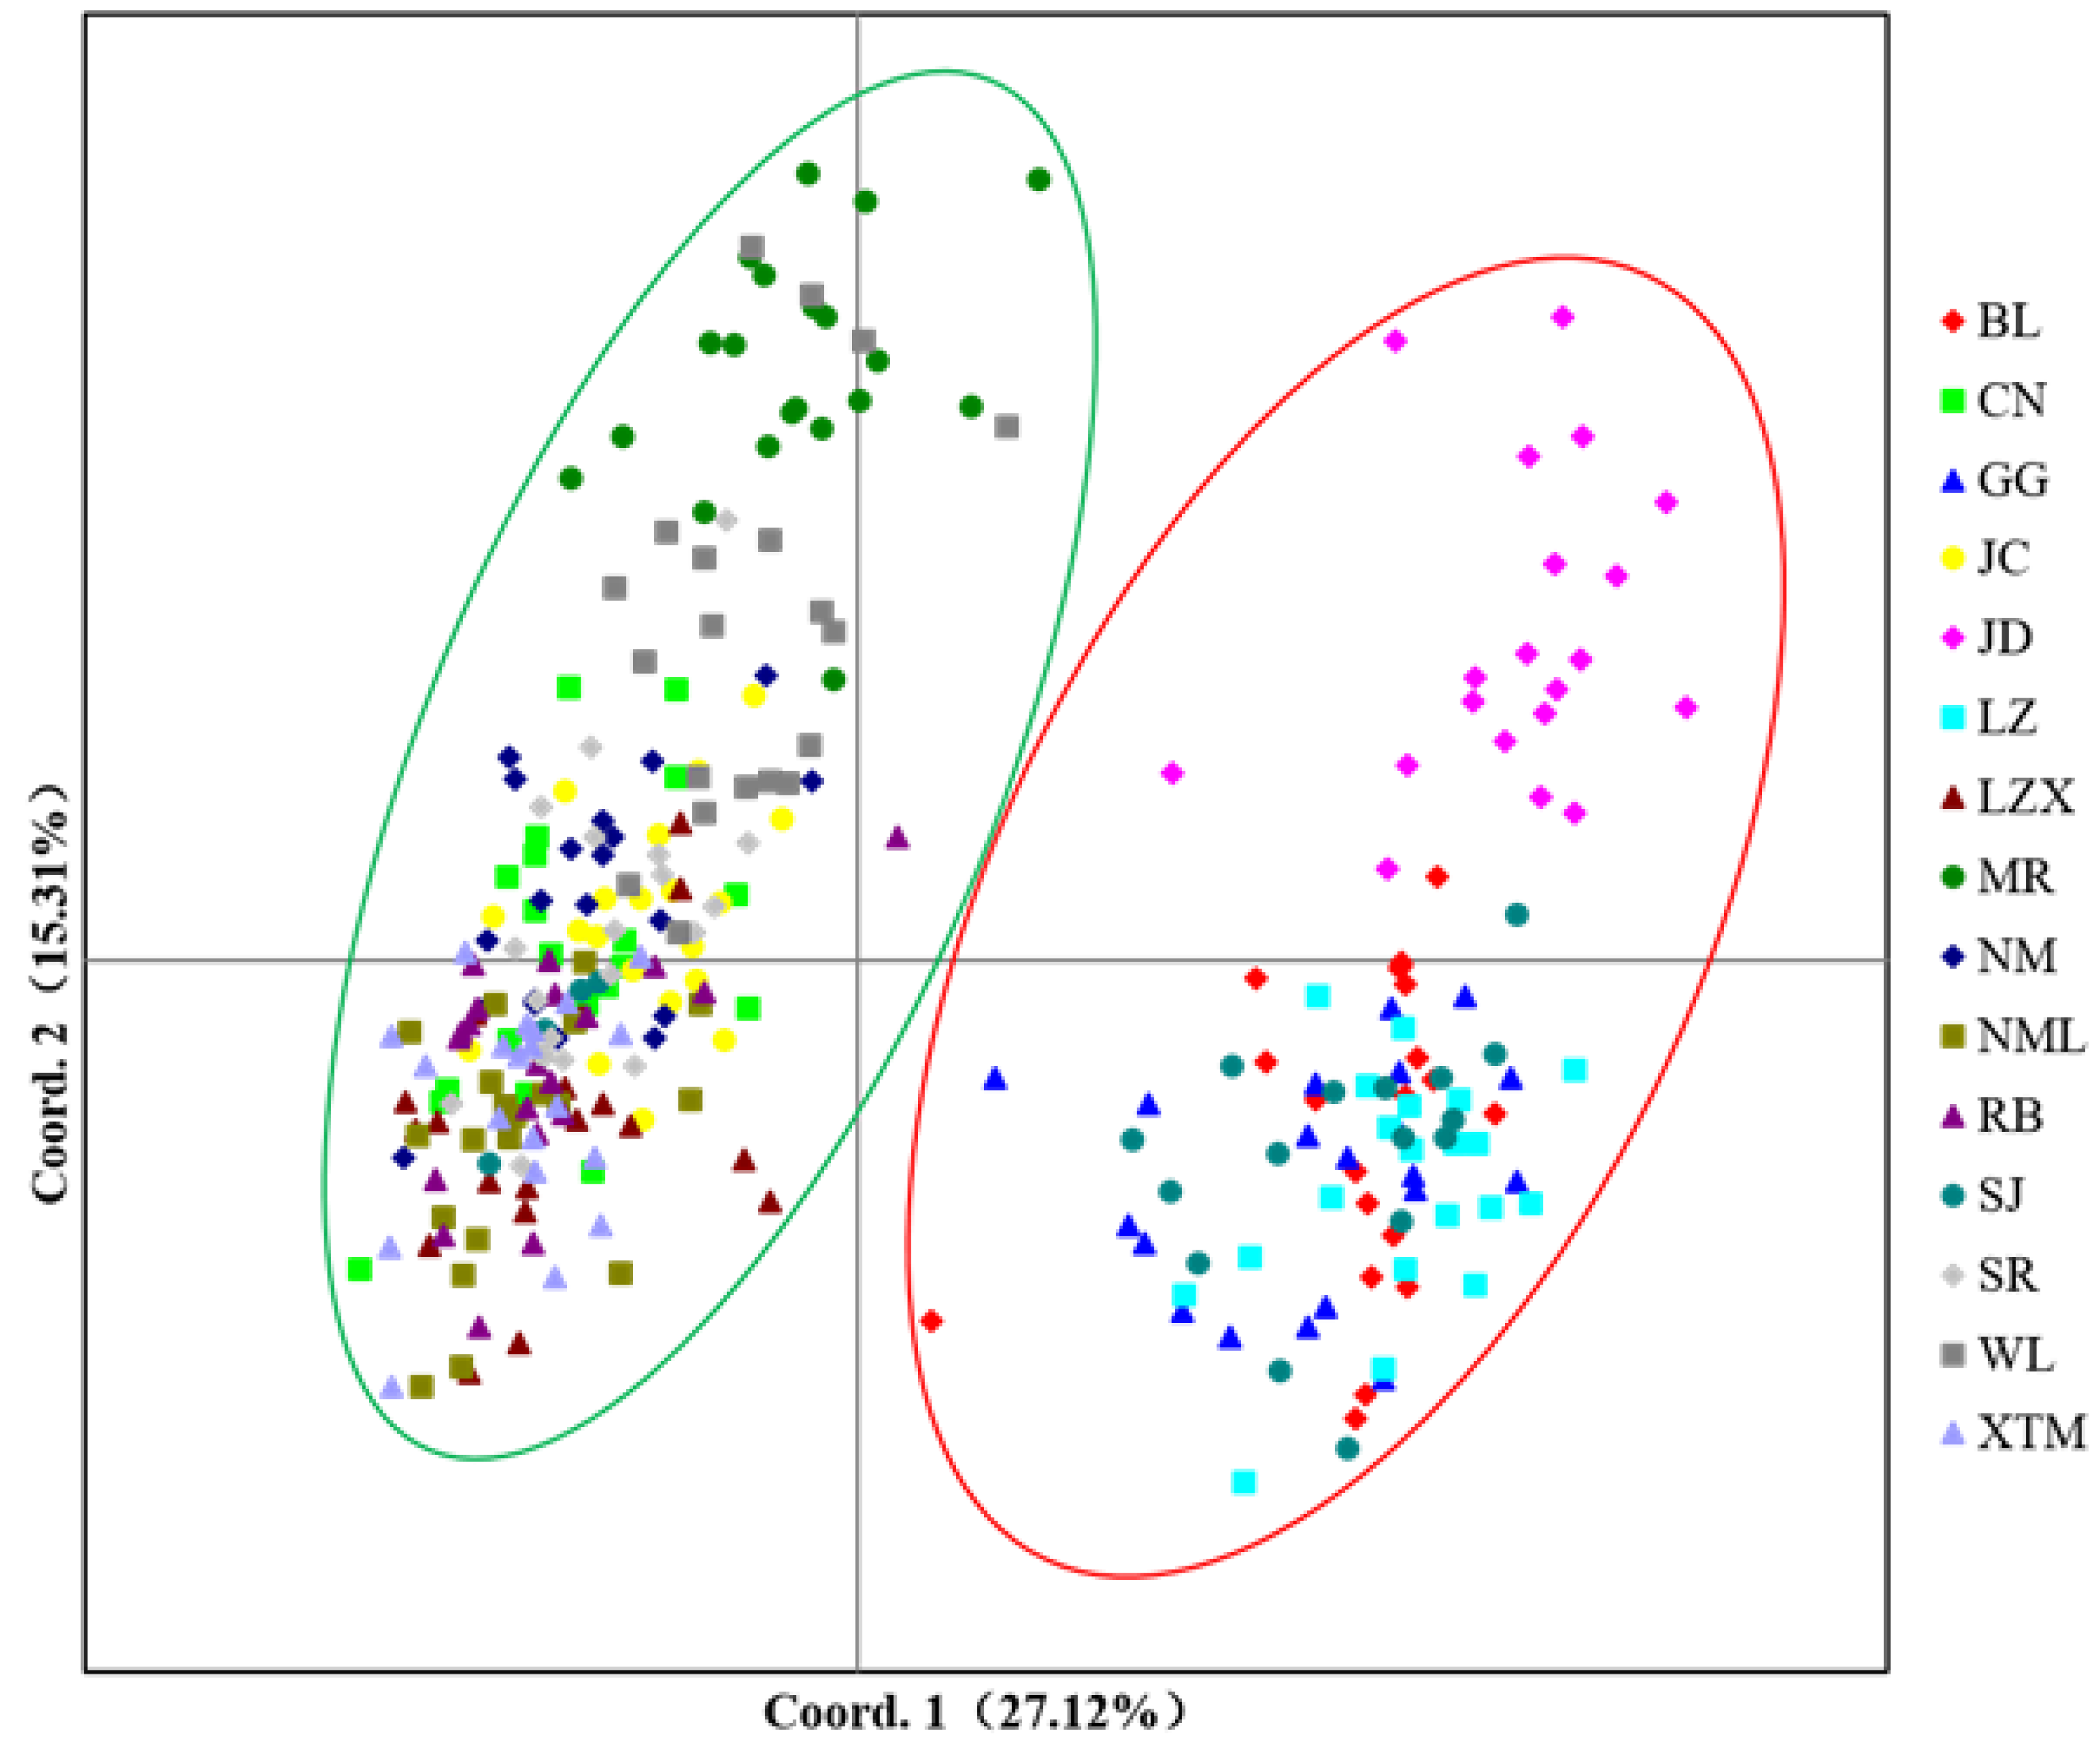
3.1.4. Genetic Distance and Clustering Analysis among Populations of S. moorcroftiana

The genetic distance among S. moorcroftiana populations ranged from 0.033 to 0.472 with an average of 0.191 (Table S8). The genetic consistency ranged from 0.624 to 0.967 with an average of 0.831 (Table S9). Among the populations, JD and XTM had the largest genetic distance (0.472) and the lowest genetic consistency (0.624), and this finding was consistent with the minimum gene flow (Nm = 0.181) between these two populations. By contrast, LZX and NML populations had the smallest genetic distance (0.033) and the highest genetic consistency (0.967), and these trends were consistent with the maximum gene flow (Nm = 4.303) between these two populations.
PCoA results showed that the first, second, and third principal components accounted for 27.12%, 15.31%, and 9.32% of the total variation, respectively. The first and second principal components are shown in the PCoA chart (Figure 3). According to the principal components based on the K-means [21], the left and right sides of the first principal component were clustered into one category, and the upper and lower right sides were clustered into two categories. A close chart indicated high genetic similarity. In addition, the genetic similarity among populations was high, and genetic difference among groups was obvious.

3.1.5. Bayesian-Inference-Based Genetic Structure Analysis

According to Delta K results, K = 2 is the most suitable number of taxa (Figure 4). The cluster analysis graphs of the 15 populations were obtained under this value. Ten S. moorcroftiana populations (CN, JC, LZX, NM, NML, RB, SR, WL, and XTM) were gathered into a class (red), and the five remaining populations (BL, GG, JD, LZ, and SJ) were grouped into another class (green). Except for SJ, each cluster was relatively pure, which was consistent with PCoA results (Figure 3).

3.2. Niche Modelling and Analysis

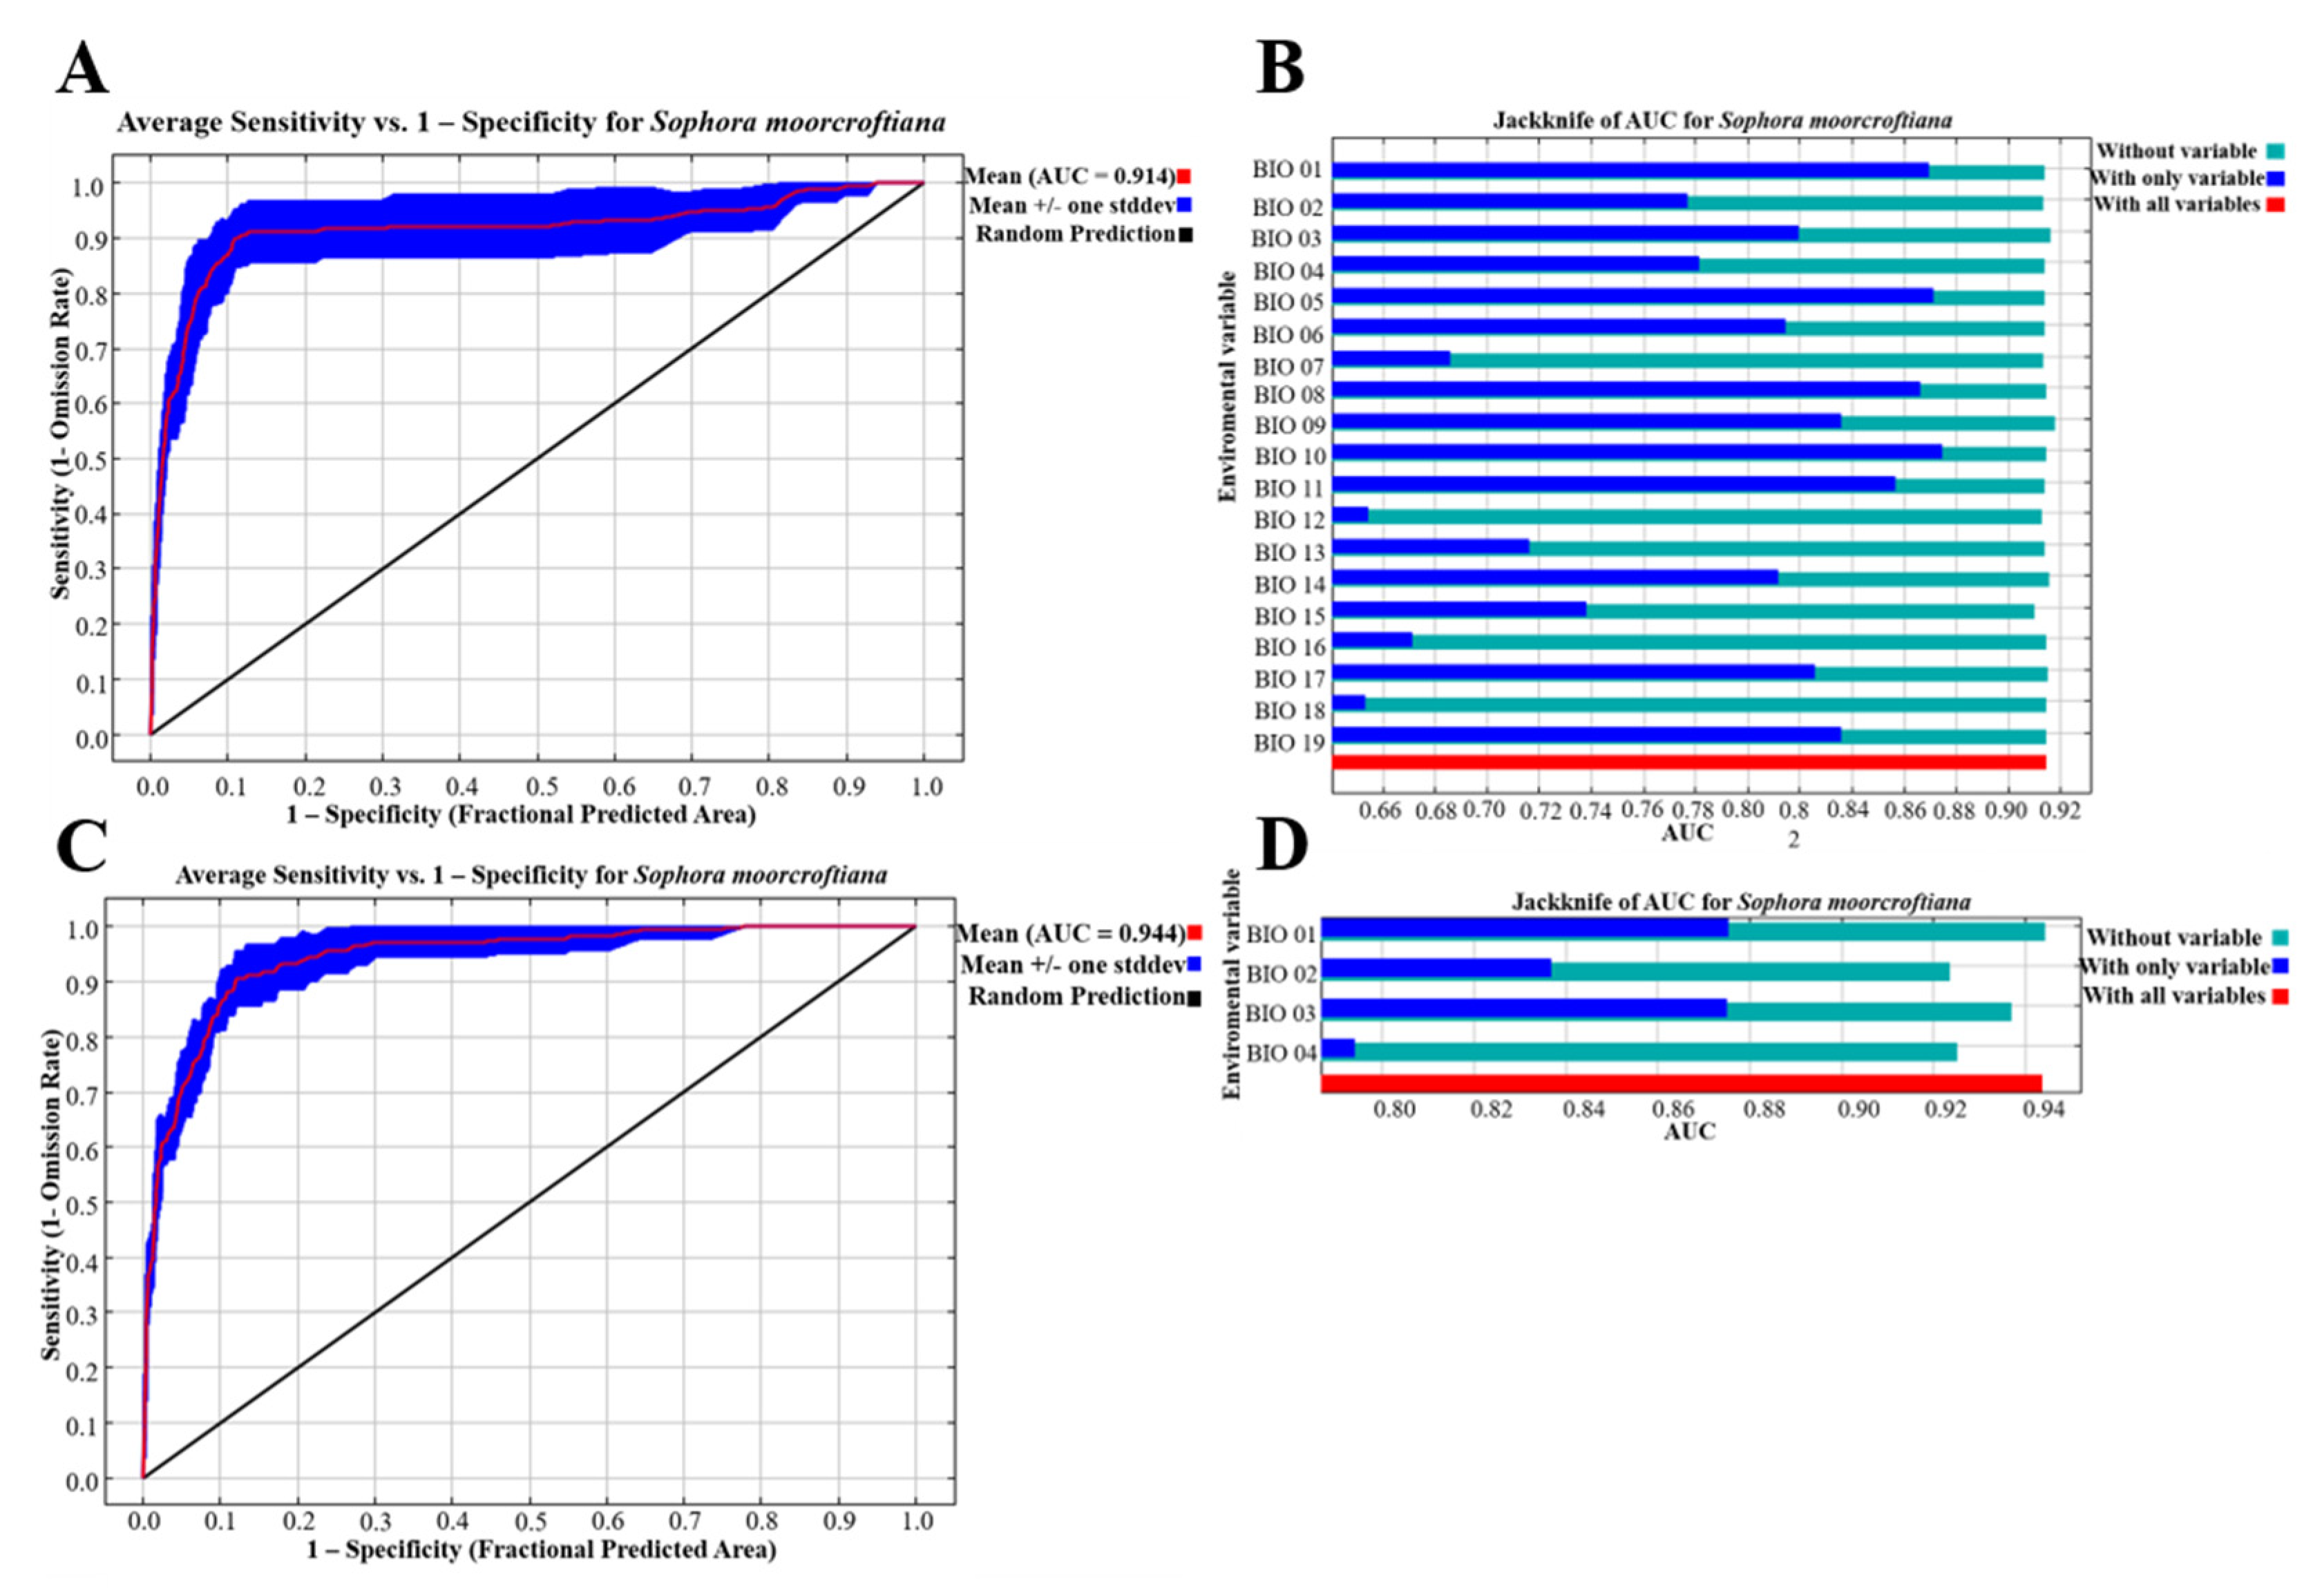
3.2.1. Screening of Critical Environmental Variables

The following bioclimatic factors have an important contribution to S. moorcroftiana distribution: precipitation of the wettest month (mm) (Bio 14), annual mean temperature (°C) (Bio 01), precipitation of the coldest quarter (mm) (Bio 19), isothermality (Bio 03), mean diurnal range (°C) (Bio 02), mean temperature of the coldest quarter (°C) (Bio 11), mean temperature of the driest quarter (°C) (Bio 09), and mean temperature of the warmest quarter (°C) (Bio 10). After the results of Pearson correlation and the contribution rate of bioclimatic factors, the following four critical environmental variables were selected (Table S10): precipitation of the wettest month (mm) (Bio 14), annual mean temperature (°C) (Bio 01), isothermality (Bio 03), and mean temperature of the warmest quarter (°C) (Bio 10), with contribution rates of 49.9%, 33.5%, 10.1%, and 6.5%, respectively. These environmental variables were used for the final modeling and subsequent analysis.

3.2.2. MaxEnt Model Prediction

The element type was linear quadratic product hinge feature (LQPH), and the regularization multiplier was 1.1. The threshold value of the classification of the species suitable area was determined as 0.1431 using equal test sensitivity and specificity. Grading values were as follows: unsuitable region (0.000–0.1431), lowly suitable region (0.1431–0.4287), moderately suitable region (0.4287–0.7144), and highly suitable region (0.7144–1.000). For the present period, receiver operating characteristic (ROC) curve analysis of the MaxEnt model showed that the training area under the ROC curve (AUC) was 0.9736 ± 0.0037. The test AUC value was 0.9821 ± 0.0113 (Figure 5), indicating that the prediction result of the MaxEnt model was reliable.

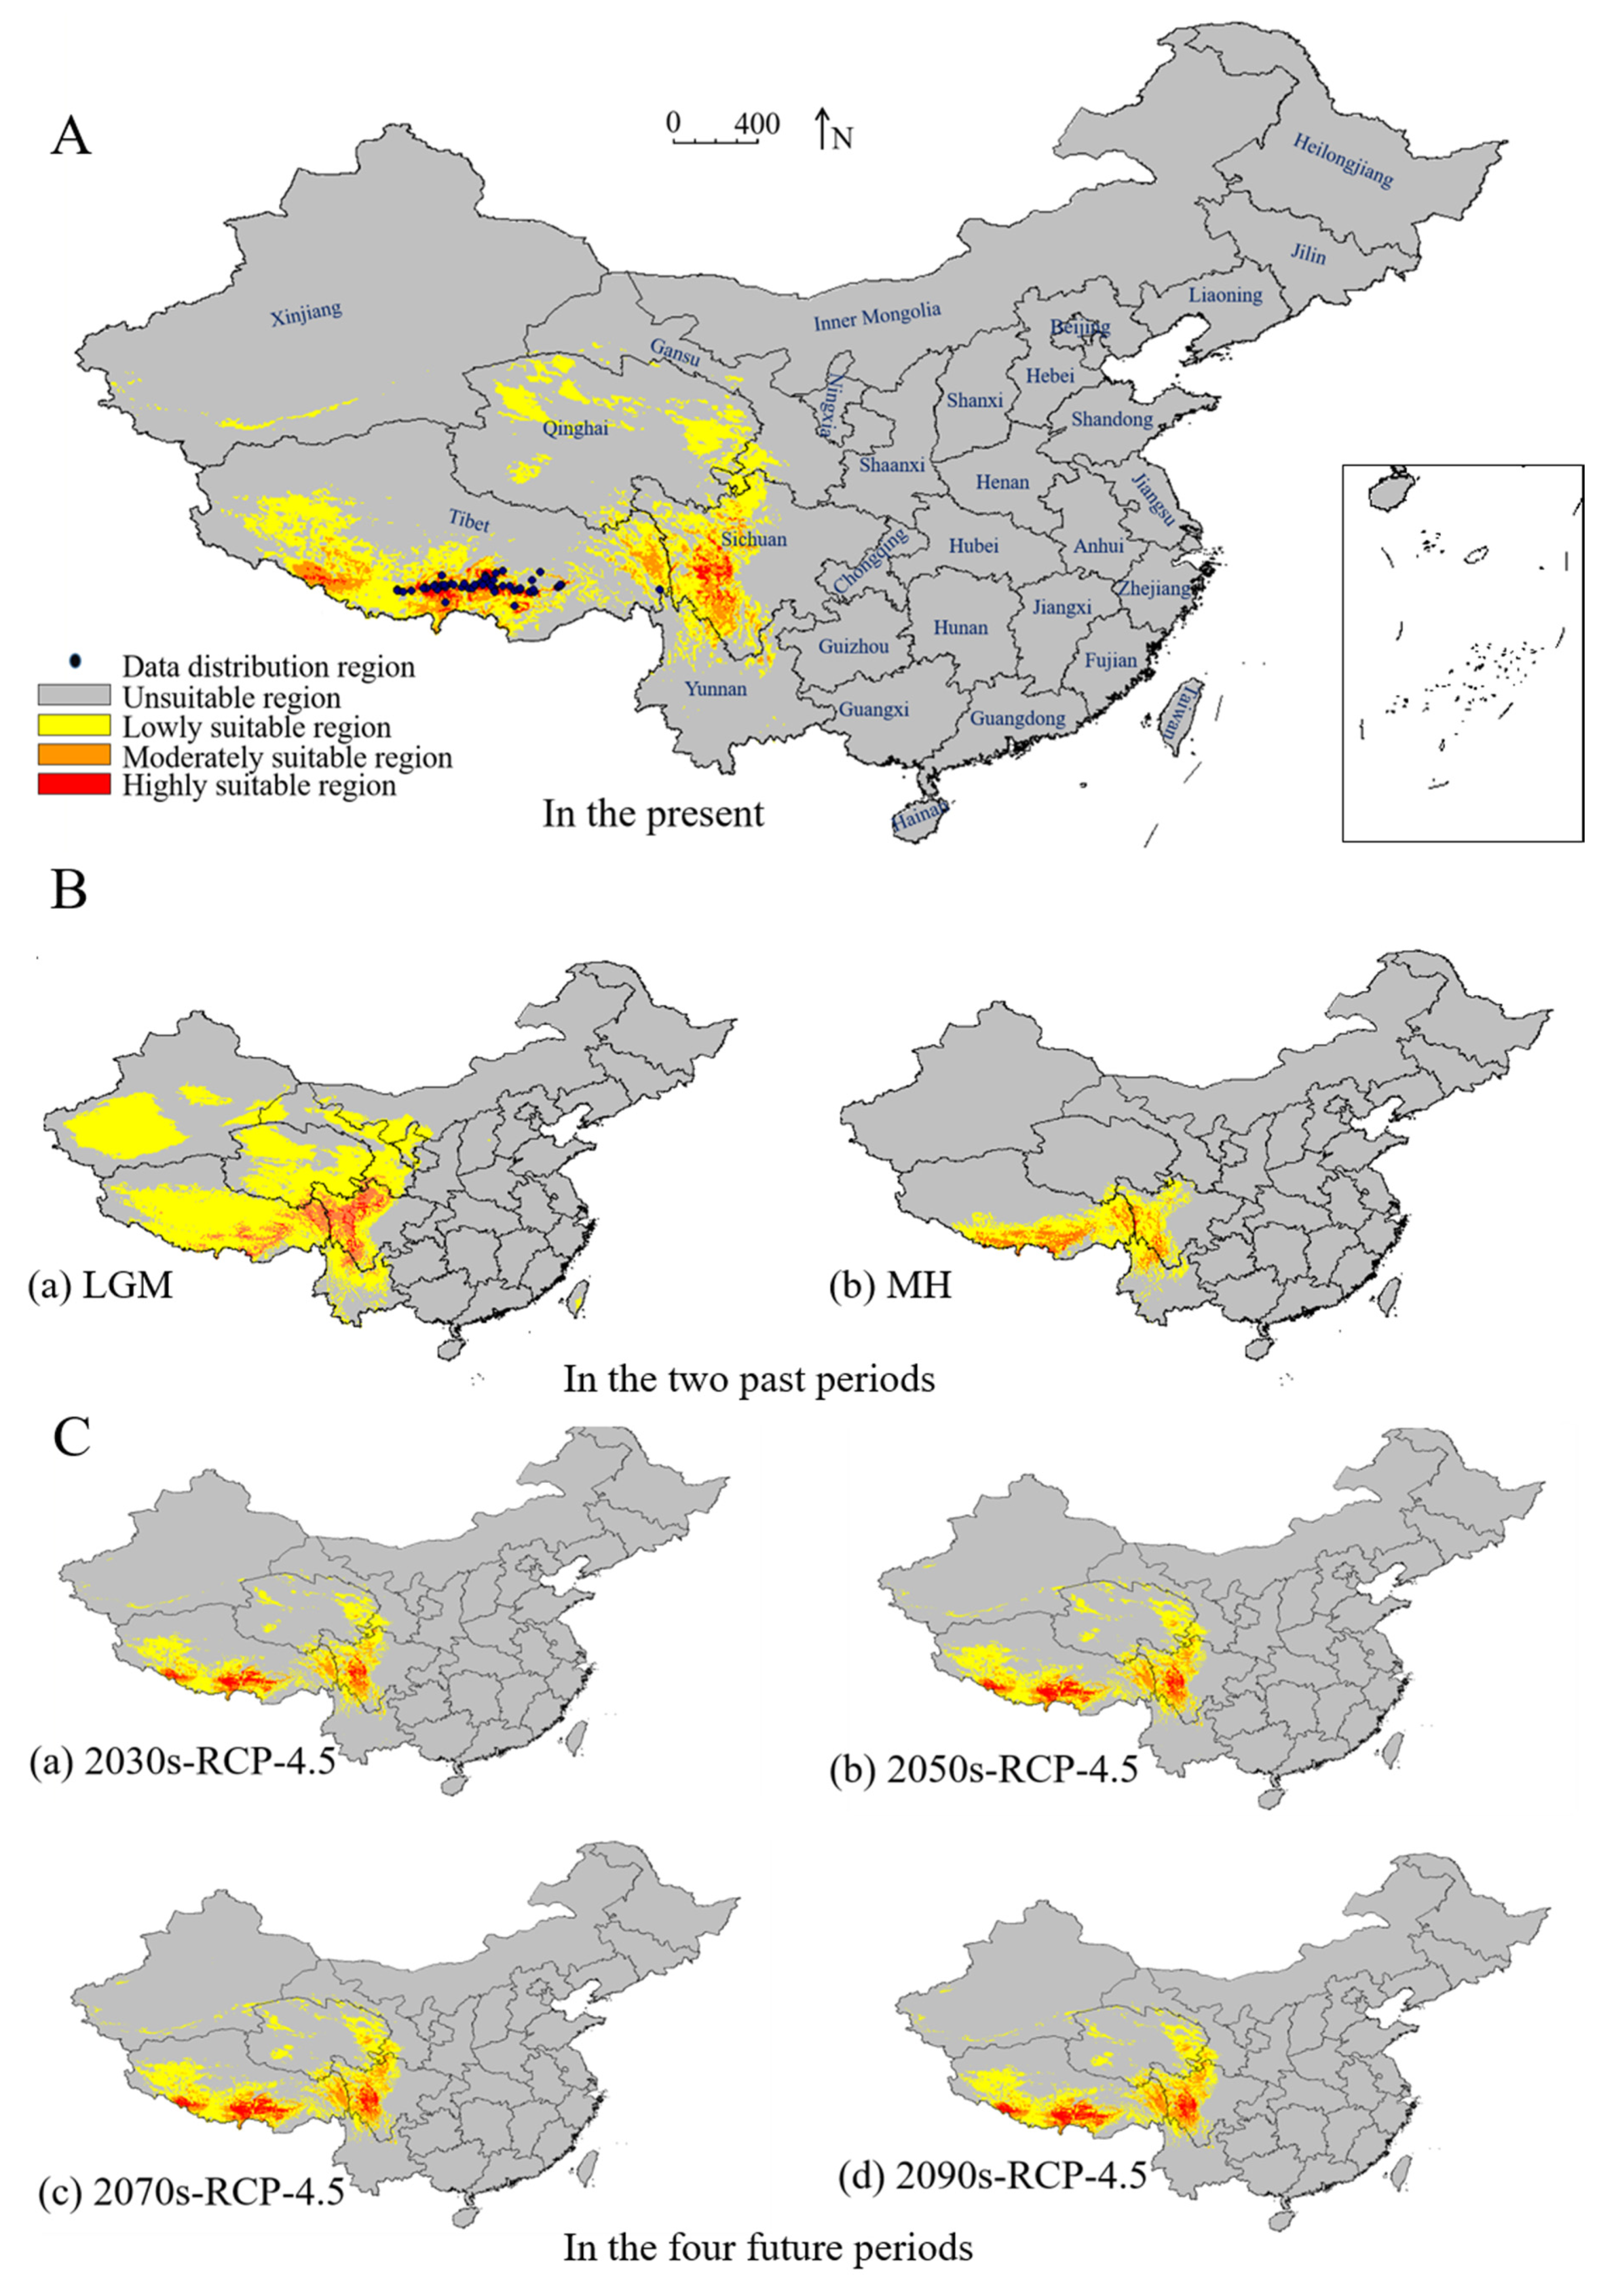
3.2.3. Distribution Trend of S. moorcroftiana during two Past Periods, the Present, and Four Future Periods

The distribution of S. moorcroftiana (Figure 6) in two past periods, the present, and four future periods was obtained using the MaxEnt model. In the past two periods, S. moorcroftiana was mainly distributed in east of the QTP during LGM but gradually moved from the eastern to western region during MH. In the present and four future periods, S. moorcroftiana was primarily concentrated in the reaches of Yarlung Tsangpo River and east of the QTP.

3.2.4. Prediction of the Potentially Suitable Areas of S. moorcroftiana in Four Future Periods

The potential suitable distribution areas were calculated using the MaxEnt model (Table S11). At present, the total suitable area of S. moorcroftiana is 71.31 × 10⁴ km2, the highly suitable area is 3.42 × 10⁴ km2, and the moderately suitable area is 12.96 × 10⁴ km2. According to the species distribution changes in the four future periods from 2030s to 2090s, the total suitable area will increase to 74.17 × 10⁴ km2, 84.43 × 10⁴ km2, 90.21 × 10⁴ km2, and 87.35 × 10⁴ km2. The increase rate of the moderately (113.14%, 136.24%, 149.66%, and 154.59%) and highly (148.35%, 184.44%, 201.98%, and 207.30%) suitable areas is higher than that of the total suitable area (104.01%, 118.39%, 126.50%, and 122.48%).

4. Discussion

Genetic parameters such as Ho, He, F, PPL, Na, Ne, and I are indicators of population genetic diversity [11]. He and H are currently the most widely used parameters, and He is less affected by sample size and can represent population genetic diversity [16]. He of all populations of S. moorcroftiana in this study was generally not high (around 0.5), with the He being the lowest for population MR and the highest for population SJ. MR had the lowest altitude and SJ had the highest, thus indicating that altitude is a major environmental factor affecting the population genetic diversity of S. moorcroftiana. This may be because there are many mountains with different altitudes in the QTP, which makes the microclimate environment different there, resulting in it becoming the main influencing factor of the plateau plant distribution and gene exchange [27]. However, the result of population genetic diversity of S. moorcroftiana in this study was not quite consistent with a previous study [11], where the He ranged from 0.2956 to 0.3382 compared to 0.437 to 0.539 in this study. This may have been caused by the use of different molecular marker techniques. In the previous study, population genetics was studied using high-throughput genotyping by sequencing (GBS), while SSR markers were used in this study. In addition, there were differences in the representative sample collection in the two studies, although the results of the small range of population genetic diversity variation was consistent.
FST and Nm can describe the degree of differentiation among natural populations [16,19]. The greater the FST among populations, the smaller the Nm and the greater the differences among populations. Nm is one of the main reasons for the homogeneity of the population genetic structure. Some scholars believe that when Nm >1, the gene exchange between populations is extensive to resist the genetic differentiation of populations caused by genetic drift [19]. However, the Nm among S. moorcroftiana populations was greater than 1.000 and less than 1.000, with an average of 0.917, which indicated the high and low frequency gene flow among S. moorcroftiana populations. Moreover, the genetic differentiation among individuals was greater due to geographical environment and other factors [6].
All populations in this study were divided into two groups by genetic structure clustering, while the populations of S. moorcroftiana were clustered into five subgroups in the previous study [11]. Overall, the two groups in this study did not conflict with the five in the previous study. In fact, one of the groups in this study contained three subgroups from the previous study, while another group contained two other subgroups from the previous study. However, for the analysis of climatic factors affecting S. moorcroftiana, only the wind direction was taken into account in the previous study, while five environmental factors were used for comprehensive analysis in this study, which would be more conducive for revealing the impact of the main climatic factors on S. moorcroftiana. The RDA results showed that altitude, rather than other climatic factors, was the key environmental variable affecting the present genetic diversity of S. moorcroftiana, that is, the present climate change did not affect the genetic diversity. This may be due to the present distribution being too narrow in the QTP.
In this study, the sampling sites of S. moorcroftiana were from east to west, from the Nyingchi area to Shigatse, Tibet, with gradually increasing altitude. The genetic diversity of Shigatse and Shannan were higher than Lhasa and Nyingchi, which is consistent with previous reports [11]. S. moorcroftiana is a dry-tolerant species; therefore, the growth of S. moorcroftiana in Shigatse and Shannan area were better, and its genetic diversity was higher than that in the other areas. In Lhasa and Nyingchi, although the temperature is lower, the wet climate is conducive to the growth of S. moorcroftiana, which had lower genetic diversity.
The results of distribution prediction in the past, present, and future periods showed that the suitable area is increasing along with climate change and would continue to increase in the future, especially under increasing temperature in the QTP, which is beneficial for the conservation of S. moorcroftiana. According to the MaxEnt analysis, the temperature and precipitation are the main environmental variables affecting the present distribution of S. moorcroftiana in the Yarlung Tsangpo River, which is located in the south–central part of the QTP [27]. The southwest monsoon in summer brings water vapor from the Indian Ocean to the south part of the QTP via the Yarlung Tsangpo Grand Canyon and forms abundant precipitation [28]. This may be the main reason the distribution area of S. moorcroftiana is limited to the Yarlung Tsangpo River basin [29,30]. By contrast, water vapor is extremely difficult to reach in the central and northern parts of the QTP due to the extremely high altitude mountain barrier.
Increasing atmospheric CO2 concentration in recent decades has led to global warming, particularly in the QTP [1,8,30,31]. A previous study found that the expansion of Picea purpurea in the QTP could be favorable under climate warming in the future [31]. Consistent with P. purpurea, S. moorcroftiana distribution was found to have a similar changing pattern in the four future periods in this study, that is, climate warming in the QTP will be beneficial to the survival of S. moorcroftiana, and its moderately and highly suitable areas will expand substantially.
Overall, given the genetic diversity of all populations of S. moorcroftiana in this study was generally not high (around 0.5) and climate warming in the QTP will be beneficial to the survival of S. moorcroftiana, we provide some suggestions about the conservation and protection of the endemic S. moorcroftiana. Firstly, there should be tighter regulation to reduce or avoid man-made damage and change to its original living environment. Then, the seedling or small shrub should be raised, and appropriate tending measures should be taken to improve its survival rate. In addition, as the wild resource is greatly destroyed, artificial introduction and cultivation will have huge significance and influence. Moreover, full use must be made of the S. moorcroftiana natural populations, where the results of this study showed that 12% of genetic variation exists between populations and 88% within individuals, to make genetic improvement. Besides, select germplasm resources that are more adaptable to the environment and have better survival ability should be used for breeding.

5. Conclusions

In this study, the genetic diversity of S. moorcroftiana was evaluated based on 300 representative samples of 15 populations using 20 polymorphic SSR markers, and its potential distribution was predicted according to 19 bioclimatic factors using MaxEnt modeling. Results showed the population genetic diversity of S. moorcroftiana was generally not high (around 0.5), and the range of variation was small (0.437–0.539). Moreover, altitude, rather than other environmental factors, was the key environmental factor affecting the present genetic diversity. However, the temperature in the QTP is increasing, and climate change means the suitable area is increasing continuously and will continue to increase in the future, which is beneficial for S. moorcroftiana. These results will provide a theoretical basis for the development of germplasm conservation strategies for S. moorcroftiana and provide a reference for other plant species in the QTP.

Supplementary Materials

The following are available online at https://www.mdpi.com/article/10.3390/f12081106/s1, Table S1: Sixty geographic distribution points of S. moorcroftiana, Table S2: Nineteen bioclimatic factors commonly used in the construction of niche models for S. moorcroftiana, Table S3: Twenty pairs of SSR primers capable of amplifying stable polymorphic bands of S. moorcroftiana, Table S4: Genetic diversity parameters of the 20 SSR markers in all tested individuals of S. moorcroftiana, Table S5: Pairwise population FST values among 15 natural populations of S. moorcroftiana, Table S6: Pairwise population matrix of mean Nm values over loci among 15 natural populations of S. moorcroftiana, Table S7: Analysis of molecular variance (AMOVA) of natural population of S. moorcroftiana, Table S8: Pairwise population matrix of Nei genetic distance among 15 natural populations of S. moorcroftiana, Table S9: Pairwise population matrix of Nei genetic identity among 15 natural populations of S. moorcroftiana, Table S10: Bioclimical variables that contribute to the distribution of the suitable area of S. moorcroftiana, Table S11: Suitable area for the present and the four future periods of S. moorcroftiana.

Author Contributions

Conceptualization, L.Y. and H.L.; formal analysis, L.Y., Q.L. and H.L.; investigation, L.Y., Q.L., Q.G. and J.L.; writing—original draft preparation, L.Y., Q.L. and H.L.; funding acquisition, H.L. All authors have read and agreed to the published version of the manuscript.

Funding

This work was financially supported by the National Natural Science Foundation of China [Grant No. 31960320].

Institutional Review Board Statement

Not applicable.

Informed Consent Statement

Not applicable.

Data Availability Statement

All cleaned/processed data are made available as supplemental materials associated with this article.

Acknowledgments

We thank Yaru Fu for assistance in the experiments.

Conflicts of Interest

The authors declare no conflict of interest.

References

  1. Song, H.; Cheng, S.; Zhang, Y. The growth of two species of subalpine co-nifer saplings in response to soil warming and inter-competition in Mt. Gongga on the south-eastern fringe of the Qinghai-Tibetan Plateau, China. World J. Eng. Technol. 2016, 4, 398–412. [Google Scholar] [CrossRef] [Green Version]
  2. Wu, Y.; Shen, X.; Tong, L.; Lei, F.; Mu, X.; Zhang, X. Impact of past and future climate change on the potential distribution of an endangered montane shrub Lonicera oblata and its conservation implications. Forests 2021, 12, 125. [Google Scholar] [CrossRef]
  3. Ouyang, L.; Arnold, R.J.; Chen, S.; Xie, Y.; He, S.; Liu, X.; Zhang, W. Prediction of the suitable distribution of Eucalyptus grandis in China and its responses to climate change. New For. 2021. (prepublish). [Google Scholar] [CrossRef]
  4. Kirpotin, S.N.; Callaghan, T.V.; Peregon, A.M.; Babenko, A.S.; Berman, D.I.; Bulakhova, N.A.; Byzaakay, A.A.; Chernykh, T.M.; Chursin, V.; Interesova, E.A. Impacts of environmental change on biodiversity and vegetation dynamics in Siberia. Ambio 2021. Epub ahead of print. [Google Scholar] [CrossRef] [PubMed]
  5. Gianni, B.; Catherine, P. Effects of climate change on grassland biodiversity and productivity. Agronomy 2021, 11, 1047. [Google Scholar]
  6. Tang, Z.; Chen, L.; Chen, Z.; Fu, Y.; Sun, X.; Wang, B.; Xia, T. Climatic factors determine the yield and quality of Honghe flue-cured tobacco. Sci. Rep. 2020, 10, 19868. [Google Scholar] [CrossRef] [PubMed]
  7. Hellwig, T.; Abbo, S.; Sherman, A.; Ophir, R. Prospects for genetic diversity of crop wild relatives under climate change: The case of the wild pea Pisum fulvum. Plant Sci. 2021, 310, 110957. [Google Scholar] [CrossRef] [PubMed]
  8. Wang, S.; Guo, L.; He, B.; Lyu, Y.; Li, T. The stability of Qinghai-Tibet Plateau ecosystem to climate change. Phys. Chem. Earth 2019, 115, 102827. [Google Scholar] [CrossRef]
  9. Hirota, M.; Tang, Y.; Hu, Q.; Kato, T.; Hirata, S.; Mo, W.; Cao, G.; Mariko, S. The potential importance of grazing to the fluxes of carbon dioxide and methane in an alpine wetland on the Qinghai-Tibetan Plateau. Atmosp Environ. 2005, 39, 5255–5259. [Google Scholar] [CrossRef]
  10. Li, H.; Yang, L.; Li, Q.; Li, J. Completed plastome sequence of Sophora moorcroftiana, an endemic shrub to the Qinghai-Tibet Plateau, China. Mitochond. DNA Part B Res. 2019, 4, 4182–4183. [Google Scholar] [CrossRef] [Green Version]
  11. Liu, Y.; Yi, F.; Yang, G.; Wang, Y.; Pubu, C.; He, R.; Xiao, Y.; Wang, J.; Liu, N.; Wang, J.; et al. Geographic population genetic structure and diversity of Sophora moorcroftiana based on genotyping-by-sequencing (GBS). Peerj 2020, 8, e9609. [Google Scholar] [CrossRef] [PubMed]
  12. Yao, W.; Fu, Y.; Zhang, Y.; Li, H. Cloning of four DREB genes from Tibetan Sophora moorcroftiana and analysis of their expression during abiotic stress. North. For. Univ. 2016, 27, 675–683. [Google Scholar] [CrossRef]
  13. Li, H.; Yao, W.; Fu, Y.; Li, S.; Guo, Q. De novo assembly and discovery of genes that are involved in drought tolerance in Tibetan Sophora moorcroftiana. PLoS ONE 2015, 10, e111054. [Google Scholar]
  14. Qin, A.; Jin, K.; Batsaikhan, M.-E.; Nyamjav, J.; Li, G.; Li, J.; Xue, Y.; Sun, G.; Wu, L.; Indree, T.; et al. Predicting the current and future suitable habitats of the main dietary plants of the Gobi Bear using MaxEnt modeling. Glob. Ecol. Conserv. 2020, 22, e01032. [Google Scholar] [CrossRef]
  15. Hsia, A.P.; Chen, H.D.; Ohtsu, K.; Schnable, P.S. DNA extraction from freeze-dried plant tissue with CTAB in a 96-Well format. Cold Spring Harb. Protoc. 2010, 2010, pdb.prot5516. [Google Scholar] [CrossRef] [PubMed]
  16. You, Q.; Pan, Y.; Xu, L.; Gao, S.; Wang, Q.; Su, Y.; Yang, Y.; Wu, Q.; Zhou, D.; Que, Y. Genetic diversity analysis of sugarcane germplasm based on fluorescence-labeled simple Sequence repeat markers and a capillary electrophoresis-based genotyping platform. Sugar Tech. 2016, 18, 380–390. [Google Scholar] [CrossRef]
  17. Ollvelra, T.; Perelra, A.; Coppede, J.; França, S.; Ming, L.; Bertonl, B. Genetic diversity analysis of Croton antisyphiliticus Mart. using AFLP molecular markers. Gen. Mol. Res. GMR 2016, 15, gmr.15017461. [Google Scholar]
  18. Marlon, L.; Massimo, G.; Lorenzo, B.; Erick, O.; Erick, D.; Osman, G.; Alberto, M.; Edgardo, G.; Stefano, B.; Enrico, P. Genetic Purity of cacao criollo from Honduras is revealed by SSR molecular markers. Agronomy 2021, 11, 225. [Google Scholar]
  19. Reetika, S.; Pratap, K.S.; Nishi, K.; Major, S. Regeneration of soapnut tree through somatic embryogenesis and assessment of genetic fidelity through ISSR and RAPD markers. Physiol. Mol. Biol. Plants Int. J. Funct. Plant Biol. 2016, 22, 381–389. [Google Scholar]
  20. Qi, Y.; Zhao, W.; Huang, Y.; Wang, X.; Zhao, Y. Correlation between climatic factors and genetic diversity of Phrynocephalus forsythii. Asian Herpetol. Res. 2019, 10, 270–275. [Google Scholar]
  21. Nyabera, L.; Nzuki, I.; Runo, S.; Amwayi, P. Assessment of genetic diversity of pumpkins (Cucurbita spp.) from western Kenya using SSR molecular markers. Mol. Biol. Rep. 2021, 48, 2253–2260. [Google Scholar] [CrossRef]
  22. Warren, D.; Matzke, N.; Cardillo, M.; Baumgartner, J.; Beaumont, L.; Turelli, M.; Glor, R.; Huron, N.; SimÕes, M.; Lglesias, T.; et al. ENMTools 1.0: An R package for comparative ecological biogeography. Ecography 2021, 44, 504–511. [Google Scholar] [CrossRef]
  23. Sivaraj, N.; Elangovan, M.; Kamala, V.; Pandravada, S.; Pranusha, P.; Chakrabarty, S. Maximum entropy (Maxent) approach to Sorghum Landraces distribution modelling. Ind. J. Plant Gen. Res. 2016, 29, 16–21. [Google Scholar] [CrossRef]
  24. Cobos, M.; Peterson, A.; Barve, N.; Olvera, L. Kuenm: An R package for detailed development of ecological niche models using Maxent. Peerj 2019, 7, e6281. [Google Scholar] [CrossRef] [PubMed] [Green Version]
  25. Maruthi, R.; Kumar, A.; Choudhary, S.; Sharma, H.; Mitra, J. DIVA-GIS based insight into geographical distribution and diversity spectrum of indian sunnhemp (Crotalaria juncea L.) accessions suitable for diversified applications. Leg. Res. Int. J. 2020, 43, 749–756. [Google Scholar] [CrossRef]
  26. Swets, J. Measuring the accuracy of diagnostic systems. Science 1988, 240, 1285–1293. [Google Scholar] [CrossRef] [PubMed] [Green Version]
  27. Khan, G.; Zhang, F.; Gao, Q.; Fu, P.-C.; Xing, R.; Wang, J.; Liu, H.; Chen, S. Molecular phylogeography and intraspecific divergence of Spiraea alpina (Rosaceae) distributed in the Qinghai-Tibetan Plateau and adjacent regions inferred from nrDNA. Biochem. Syst. Ecol. 2014, 57, 278–286. [Google Scholar] [CrossRef]
  28. Liu, W.; Zhao, Y.; Qi, D.; You, J.; Zhou, Z.; Song, Z. The Tanggula Mountains enhance population divergence in Carex moorcroftii: A dominant sedge on the Qinghai-Tibetan Plateau. Sci. Rep. 2018, 8, 2741. [Google Scholar] [CrossRef]
  29. Cheng, S.; Qiong, L.; Lu, F.; Yonezawa, T.; Yin, G.; Song, Z.; Wang, Y.; Yang, J.; Zhang, W. Phylogeography of Sophora moorcroftiana supports Wu’s hypothesis on the origin of Tibetan Alpine Flora. J. Heredity 2017, 108, 405–414. [Google Scholar] [CrossRef]
  30. Zhang, M.; Xiang, X.; Xue, J.; Sanderson, S.; Firtsch, P. Himalayan uplift shaped biomes in Miocene temperate Asia: Evidence from leguminous Caragana. Sci. Rep. 2016, 6, 36528. [Google Scholar] [CrossRef]
  31. Zhao, Z.; Kang, D.; Guo, W.; Zhao, L.; Li, C.; Li, J. Climate sensitivity of purple cone spruce (Picea purpurea) across an altitudinal gradient on the eastern Tibetan Plateau. Dendrochronologia 2019, 56, 125586. [Google Scholar] [CrossRef]
Figure 1. Fifteen sampling population sites of S. moorcroftiana in Qinghai–Tibet Plateau for genetic diversity analysis. All abbreviations in Figure 1 are defined as follows: Sajia County (SJ), Linzhou County (LZ), Xietongmeng County (XTM), Nanmulin County (NML), Bailang County (BL), Renbu County (RB), Nimu County (NM), Caina County (CN), Gongga County (GG), Lazi County (LZX), Sangri County (SR), Jiacha County (JC), Wolong County (WL), Jindong County (JD), and Mirui County (MR).
Forests 12 01106 g001
Figure 2. Redundancy analysis (RDA) of genetic diversity parameters and environmental factors for S. moorcroftiana. All abbreviations in the Figure 2 are defined as follows: altitude (A), latitude (La), precipitation (P), longitude (Lo), temperature (T), average number of alleles (Na), effective number of alleles (Ne) Shannon’s diversity index (I), observed heterozygosity (Ho), expected heterozygosity (He), percentage of polymorphic loci (PPL), and fixed index (F).
Forests 12 01106 g002
Figure 3. Principal component analysis based on the SSR data of 300 S. moorcroftiana individuals.
Forests 12 01106 g003
Figure 4. Bayesian-model-based clustering STRUCTURE analysis of 300 individuals of S. moorcroftiana. (A) △K values for different numbers of clusters (K); (B) mean log-likelihood (Ln(K) ± SD) against the number of K; (C,D) estimated population structure of 300 S. moorcroftiana individuals on K = 2; (C) bar plot sorted by Q-value in a single line; (D) bar plot grouped by population ID in multiple lines.
Forests 12 01106 g004
Figure 5. (A) ROC curve of MaxEnt model simulation results of all climate variables; (B) ROC curve of MaxEnt model simulation results of the selected climate variables; (C) Jackknife test for evaluating the relative importance of all climate variables on the distribution of S. moorcroftiana; (D) Jackknife test for evaluating the relative importance of the selected climate variables on the distribution of S. moorcroftiana.
Forests 12 01106 g005
Figure 6. Suitable distribution area of S. moorcroftiana in China. (A) Suitable regional distribution and 60 data point distributions of S. moorcroftiana in the present period; (B,C) suitable regional distribution of S. moorcroftiana in the past two periods and four future periods by the RCP 4.5 pathway.
Forests 12 01106 g006
Table 1. Geographic information and climatic data of S. moorcroftiana samples in Qinghai–Tibet Plateau.
Population NamePopulation CodeLongitudeLatitudeAltitude (m)Annual Average Temperature (°C)Annual Average Precipitation (mm)
Jiding Township, Sajia County, ShigatseSJ87°38′13″29°05′12″40873.6242
Chawu Township, Lazi County, ShigatseLZX87°34′80″29°06′56″40103.9251
Dongga Township, Xietongmeng County, ShigatseXTM88°50′90″29°21′26″38554.1269
Bazha Township, Bailang County, ShigatseBL89°02′20″29°09′40″38454.3274
Aima Township, Nanmulin County, ShigatseNML89°06′43″29°18′49″38195.1279
Qiewa Township, Renbu County, ShigatseRB89°37′30″29°20′30″37825.8282
Nimu Township, Nimu County, LhasaNM90°10′40″29°19′27″37385.9344
Kazi Township, Linzhou County, LhasaLZ91°17′34″29°41′22″37096.7374
Caina Township, LhasaCN91°06′52″29°44′59″36226.9412
Jiazhulin Township, Gongga County, ShannanGG90°54′12″29°17′28″35907.3396
Rong Township, Sangri County, ShannanSR91°52′28″29°15′53″35827.4377
Jiacha Township, Jiacha County, ShannanJC92°35′52″29°08′39″32517.7364
Wolong Township, NyingchiWL93°15′35″29°00′14″31577.9492
Jindong Township, NyingchiJD93°19′55″29°01′43″30488.6567
Mirui Township, NyingchiMR94°31′00″29°27′40″29318.8591
Climate data from the Resource and Environment Science and Data Center of the Chinese Academy of Sciences.
Table 2. Genetic diversity statistics in 15 populations of S. moorcroftiana.
PopNNaNeIHoHePPL (%)F
BL20 4.65 2.8080.9860.5630.49185.00%−0.104
CN20 4.05 2.4850.8680.5430.44590.00%−0.128
GG20 5.45 3.2401.1160.6390.53490.00%−0.167
JC20 4.50 2.7270.9670.6480.49790.00%−0.276
JD20 4.45 2.6060.9440.5230.47785.00%−0.043
LZ20 4.40 2.7690.9440.5410.47190.00%−0.107
LZX20 5.35 3.1961.0620.5730.50080.00%−0.146
MR20 3.70 2.2660.8160.5160.43790.00%−0.132
NM20 4.50 2.7020.9070.5510.44890.00%−0.186
NML20 4.90 2.7190.9690.5600.46995.00%−0.154
RB20 5.55 3.2501.0950.5850.51290.00%−0.087
SJ20 5.50 3.0431.1180.5760.53995.00%0.003
SR20 5.25 3.2141.0760.5700.51390.00%−0.074
WL20 4.75 2.8671.0140.5680.50290.00%−0.100
XTM20 5.05 3.2791.0240.5660.49390.00%−0.092
mean20 4.80 2.8780.994 0.5680.489 89.33%−0.120
N, number of individuals; Na, average number of alleles; Ne, effective number of alleles; I, Shannon’s diversity index; Ho, observed heterozygosity; He, expected heterozygosity; PPL, percentage of polymorphic loci; F, fixed index.
Publisher’s Note: MDPI stays neutral with regard to jurisdictional claims in published maps and institutional affiliations.

