Abstract
Concerning the ecological and economical importance of the Pearl River basin, short-term climate changes have been widely studied by using the instrumental records in the basin, but there is still a lack of long-term climatic reconstructions that can be used to evaluate the centennial scale climate anomalies. Here, we present a 237-year tree-ring width chronology from Tsuga longibracteata in the north-central Pearl River basin, with reliable coverage from 1824 to 2016. Based on the significant relationship between tree growth and mean temperature from the previous March to the previous October, we reconstructed the previous growing season (pMar-pOct) temperatures for the past 193 years, with an explained variance of 43.3% during 1958–2016. The reconstruction reveals three major warm (1857–1890, 1964–1976, and 1992–2016) and cold (1824–1856, 1891–1963, and 1977–1991) periods during 1824–2016. Comparison with other temperature sensitive proxy records from nearby regions suggests that our reconstruction is representative of large-scale temperature variations. Significant correlations of tree growth with the sea surface temperatures (SSTs) in the western Pacific Ocean, northern Indian Ocean, and Atlantic Ocean suggest that SST variability in these domains may have strongly influenced the growing season temperature change in the Pearl River basin.
1. Introduction
As carbon sinks, forests play a key role in land-atmosphere carbon dioxide exchanges under global warming, providing vital ecological services [1,2,3]. Globally and regionally, a changing climate could have detrimental impacts on forest ecosystems. For example, increasing drought stress could have major negative impacts on the water-limited primary forests of the Croatian Dinaric mountains [4]. For subtropical coniferous forests in the south-eastern United States, increasing water availability after short-term summer drought could significantly affect ecosystem phenological processes by extending the growing season [5]. Under a tropical monsoon climate, high temperatures in the dry season may result in high mortality for mangrove forests in eastern Thailand, leading to long-term reduction of forest biomass [6]. Therefore, heat-induced drought and other disturbances such as wildfires could limit forest growth and even trigger widespread tree mortality, thereby shifting this important terrestrial carbon sink into a carbon source [7,8,9]. It is increasingly important to understand the climate impacts on various tree species in diverse forests under a rapidly changing climate.
Climate-tree growth relationships have been widely investigated around the world [10,11,12,13,14]. For example, warmer and drier climatic conditions in April were associated with enhanced crown defoliation in Spanish forest plots [15]. Increasing summer temperatures and drought resulted in recent decline in the growth of Norway spruce (Picea abies) in Croatia [4]. In addition, many studies have shown strong correlations between radial growth of various tree species and the climate variables of the previous year [16,17]. In China, extensive tree-ring studies have been conducted in the Tibetan Plateau and northern China, particularly in terms of the climate-tree growth responses and the reconstruction of key climate variables [18,19,20,21,22,23]. Although trees growing in tropics were assumed to be less likely to form annual growth ring due to a lack of seasonality [24], forests in tropical South China have rich species diversity, including abundant coniferous species. This indicates a high potential for further exploration of tree growth and its responses to climate change in the region [25,26,27]. For example, Chen et al. [27] found that the growth of Bristlecone hemlock (Tsuga longibracteata) and Japanese cypress (Chamaecyparis obtuse) in southeast China was associated with autumn and winter temperatures in the previous year. Cai et al. [26] suggested that growing season (April-November) precipitation had a significantly positive impact on the tree growth of Masson pine (Pinus massoniana) in Fujian province in subtropical southeast China. Therefore, whether the previous or current year’s climate plays a key role in controlling tree growth in south China, in particular in the Pearl River basin, is largely uncertain. With future climate warming and varied precipitation patterns, addressing this question is particularly important for assessing the carbon sink capacity of subtropical forests in China.
T. longibracteata is endemic to China, and is typically distributed in evergreen forests in the warm and humid climate at elevations of 600–2100 m a.s.l. in remote areas of South China, such as southwest Hunan, northeast Guizhou, northeast Guangxi, northern Guangdong, and southern Fujian provinces [28]. The geographical distribution of T. longibracteata is limited by precipitation in the driest month and the annual temperature range [29], whereas successful establishment of T. longibracteata seeding is determined by the light intensity of the forest stand [30]. T. longibracteata provides an important ecosystem function such that T. longibracteata-dominated natural forests have shown an exceptional fine water conservation capability, with 258.426 t/ha of the water-holding content in its above-ground portion [31].
Under the influence of global warming, temperatures in the Pearl River basin exhibited an increasing trend based on meteorological records during 1956–2013 [32], and the warming rate in winter was greater than that in summer [32,33]. Tian and Yang [32] pointed out that the annual total precipitation in the Pearl River basin did not show any significant trend during 1956–2013, despite the fact that it showed a significant decreasing trend during the more recent period of 1994–2011. Based on the Palmer drought severity index (PDSI), Wang et al. [34] assessed the spatiotemporal variations of future drought (2016–2100) in the Pearl River basin using the Variable Infiltration Capacity (VIC) model and the general circulation models (GCMs), suggesting that the severity and duration of drought in most areas of the basin are likely to increase in the 21st century, especially in the mid-west Pearl River basin.
This study aimed to investigate the influence of climate change on T. longibracteata growth in the north-central Pearl River basin, south China. The objectives of this study were to: (1) develop a tree-ring width (TRW) chronology of T. longibracteata at a study site in the north-central Pearl River basin and investigate the cyclicity of T. longibracteata growth; (2) examine the relationship between climate variables and T. longibracteata growth; (3) reconstruct the past growing season’s temperature variability based on TRW chronology; and (4) explore the linkage of regional temperature variability with the global sea surface temperatures (SSTs).
2. Materials and Methods
2.1. Characteristics of the Study Area
The study area is located at the Mao’ershan (MRS) mountain, north-central Pearl River Basin (Figure 1). Oriented in a northeast-southwest direction, the MRS mountain is located in northern Guangxi province with a peak altitude of around 2141 m a.s.l., which is the highest mountain in south China. Based on 18 soil samples collected every 100 m on the southern slope of the MRS mountain between 438 and 2098 m a.s.l., the pH value was 3.98–5.61, the organic matter content was 31.2–98.8 g/kg, and the avaliable nitrogen (N), phosphorus (P), and potassium (K) content were 222.7–388.3 mg/kg, 30.9–58.8 mg/kg, and 28.8–99.8 mg/kg, respectively [35]. Under the influence of the East Asian monsoon, the plentiful precipitation in this region resulted in rich biodiversity and abundant primeval forests. As an area reserved for the conservation of water resources, forests in the MRS mountain have not been disturbed by evident human activities.
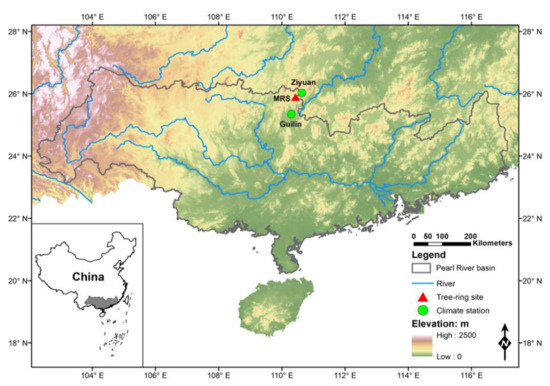
Figure 1.
Map of the Pearl River basin showing the location of the tree-ring sampling site (red triangle) and two nearby meteorological stations (green circle).
2.2. Tree-Ring Data
Tree cores of T. longibracteata were taken from the MRS mountain in Guangxi Province of South China, with an elevation of 1991 m a.s.l. (Figure 1). The sampled trees are healthy without natural or human disturbances, such as insect infestation, logging, and other human damage. Two cores were drilled from each tree at the breast height with 5.1 mm diameter increment borers. All tree-core samples were air-dried, mounted, and polished in the lab. Subsequently, tree cores were cross-dated visually under a microscope and measured to a 0.001 mm resolution on a Velmex ring-width measuring system (Velmex Inc., Bloomfield, NY, USA). All the series were statistically checked with the COFECHA program to ensure the quality and accuracy of the cross-dating and measurements [36]. Finally, 36 cores from 18 trees were used to build the mean TRW chronology (Table 1). A standardization process was used to remove the non-climatic, biological signals of the raw ring-width series [37]. The tree-ring index was calculated as ratios between raw ring-width series and a fitted age-dependent spline smoothing curve using the “signal-free” method, and the mean chronology was calculated with a robust biweight mean method [38,39]. Compared with the residual method [40], the ratio method used in this study did not produce a biased tree-ring index and provided a better fit to climatic records concerning magnitude and overall correlation. The TRW chronology was finally developed with its variance stabilized through the Rbar weighted method after detrending [41,42]. The 31-year running Rbar was calculated to evaluate the mean correlation among ring-width series, and the expressed population signal (EPS, threshold value of 0.85) was applied to define the reliable time span of the chronology [43]. Other statistic parameters, such as the standard deviation (SD), mean sensitivity (MS), and first-order autocorrelation (AC1), were also calculated to assess the quality of the chronology.

Table 1.
Site information and tree-ring chronology statistics.
2.3. Climate Data
Climate data from two meteorological stations (Guilin, 25.32° N, 110.30° E, 164.4 m a.s.l.; Ziyuan, 26.03° N, 110.63° E, 408.4 m a.s.l.) near the sampling site were obtained from the National Meteorological Information Center (http://data.cma.cn/). The climate parameters include the monthly mean temperature and monthly total precipitation. Regional mean climate was calculated by averaging the records of the two meteorological stations over their common period of 1957–2016 to decrease the environmental heterogeneity effects. As shown in Figure 2, the monthly mean temperature of the study area ranges from 6.9 °C to 27.3 °C, and monthly total precipitation ranges from 51.0 mm to 338.6 mm. January is the coldest month (6.8 °C), while July is the hottest (27.3 °C). The rainy season is from March to August, accounting for 76.0% of the annual total precipitation. Furthermore, based on meteorological records of Xing’an, Ziyuan, and Longsheng stations near the MRS mountain, the annual mean sunshine duration varied from 1309.4 h to 1467.1 h, the annual mean wind speed varied from 2.1 m/s to 3.2 m/s, the annual mean relative humidity varied from 79% to 82%, and the annual mean frost day varied from 7.3 days to 15.5 days [35]. Based on the daily temperature and precipitation data of 81 meteorological stations in Guangxi during 1961–2016, the frequency of persistent low temperatures and the snow freezing process in Guangxi has been 2 times/10a since the 1990s, with average days of 23.7 day/10a [44]. According to the Köppen-Geiger climate classification [45,46], the study area features a humid subtropical climate.
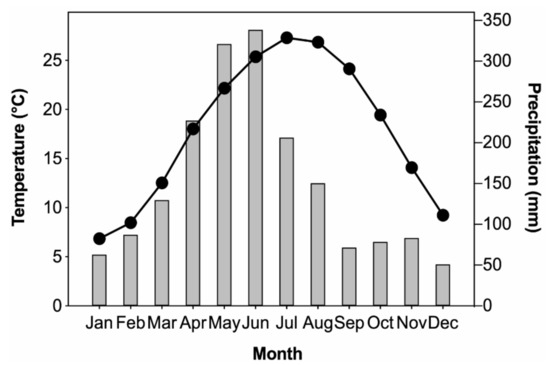
Figure 2.
Monthly mean temperature (line with circles) and monthly total precipitation (bar) averaged from Guilin and Ziyuan meteorological stations (1957–2016).
2.4. Methods
Pearson’s correlations between TRW chronology and instrumental temperature and precipitation from the previous March to current October during 1958–2016 were calculated to analyze the climate-growth relationship. Correlations on the seasonal scales were also calculated in order to reveal the controlling climatic factors on tree growth. The targeted climatic parameter was reconstructed through a linear regression model [37]. Both the mean and variance of the reconstruction were stabilized to match that of the instrumental data over the common period. The leave-one-out cross-validation (LOOCV) method was applied to test the reliability of the reconstruction because of the short common period between the meteorological data and TRW chronology [47]. A positive reduction of error (RE) suggests good model quality. Wavelet power spectrum analysis was used to elucidate the spectral properties of tree growth [48]. A 11-year lowpass Fast Fourier Transformation (FFT) filter was employed to show multidecadal changes of the TRW chronology and the reconstruction. Spatial correlations of the reconstruction with the gridded Global Historical Climatology Network (GHCN v4.0.1) temperature anomalies from the National Climatic Data Center (NCDC, www.ncdc.noaa.gov) and the global gridded Extended Reconstructed Sea Surface Temperature (ERSST v5) were applied to investigate the spatial representativeness and the global SST influence on temperature variability in the study area respectively, based on the KNMI Climate Explorer (http://climexp.knmi.nl, accessed on 2 June 2021) [49,50].
3. Results
3.1. Climate–Growth Relationship
Figure 3 shows the TRW chronology in this study and its corresponding sample size, Rbar, and EPS statistics. The TRW chronology ranges from 1780 to 2016. The series length varies between 96 and 235 years, with mean length of 163 years. The SD is 0.34, the MS is 0.18, and the AC1 is 0.75 (Table 1). The reliable period of the TRW chronology spans from 1824 to 2016, according to the EPS threshold value 0.85 [43]. The Rbar ranges from 0.30 to 0.65, with an average value of 0.46. These statistics indicate a good quality of the TRW chronology.
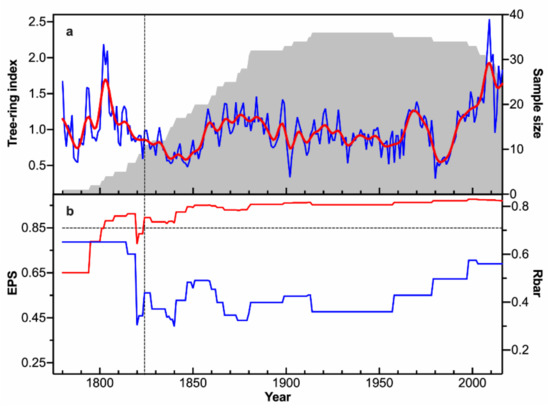
Figure 3.
(a) TRW chronology at the MRS site in the north-central Pearl River basin (blue line), the 11-year lowpass FFT filter (red line), and the corresponding sample size (gray shading), and (b) the running EPS (red) and Rbar (blue) statistics calculated with a 31-year window. Horizontal dashed line in (b) denotes the 0.85 cutoff value. Vertical dashed line indicates the beginning year when the EPS value is above 0.85.
The result of wavelet power spectrum analysis for the TRW chronology is shown in Figure 4. For tree growth cycles at the MRS site, multi-year and multi-decadal signals could be found dated to 1824–2016. Multi-year power was more concentrated within the 8-year band during the 1820s–1920s, which suggests that the tree growth may have had a multi-year periodicity during this period. A significant power signal existed in a 16–32-year band during the 1920s–2010s. A multi-decadal power existed within a 32–64-year band during the 1820s–2010s, which indicates that tree growth varied mostly on a multi-decadal scale. Nonetheless, the spectral result should be interpreted with caution due to the shortness of the data.
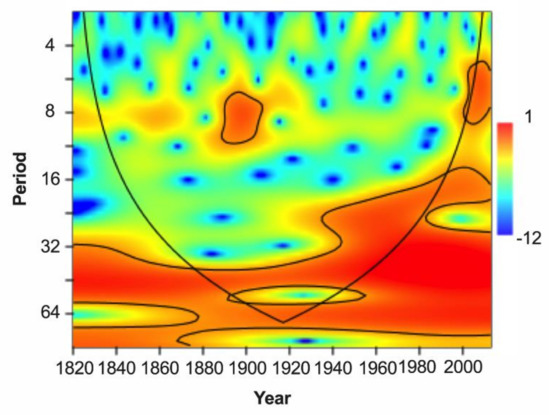
Figure 4.
Wavelet power spectrum of the TRW chronology using the Morlet wavelet during the period of 1824–2016. The black line denotes the cone of influence beyond which the edge effect may distort the results. Shading with contours indicates the 95% confidence level.
Figure 5 shows the Pearson’s correlations between the TRW chronology of T. longibracteata and the regional climate from the previous March to the current October during the common period 1958–2016. As shown, temperature played a key role in the radial growth of T. longibracteata. The TRW chronology showed significant correlations with the temperature in the previous March to May, as well as the previous and current August to October (p < 0.05). The mean temperature from the previous March to the previous October (pMar-pOct) had the highest correlation with the TRW chronology (r = 0.66, p < 0.01). Therefore, the pMar-pOct mean temperature was most crucial for tree growth, which was chosen for reconstruction.
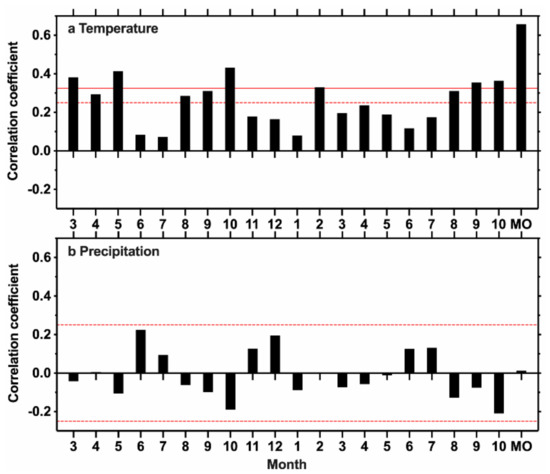
Figure 5.
Correlation coefficients of the TRW chronology with (a) monthly mean temperature and (b) monthly total precipitation from the previous March to the current October during the common period 1958–2016. MO (previous March to previous October) represents the target months for reconstruction. Horizontal solid (dash) line denotes the 0.01 (0.05) significance level, respectively.
3.2. Previous Growing Season Temperature Reconstruction
According to the results of the climate–growth relationship, the previous growing season (pMar-pOct) temperature was reconstructed based on a linear regression model during their common period of 1958–2016. During the common period, the reconstruction explains 43.3% of the observed pMar-pOct mean temperature variance, and the F statistic is 43.53 (p < 0.01). The estimated and observed pMar-pOct mean temperature and their first-differenced data were compared during their common period (Figure 6a,b). The LOOCV method was employed to evaluate the reliability of the reconstruction [47]. The correlation coefficient between the observed data and the LOOCV generated reconstruction is significantly positive (r = 0.63, p < 0.01). The highly positive values of reduction of error (RE = 0.40) and root mean squared error (RMSE = 0.36) suggest that the reconstruction model is reliable. These statistics together suggest that robustness of the pMar-pOct mean temperature reconstruction.
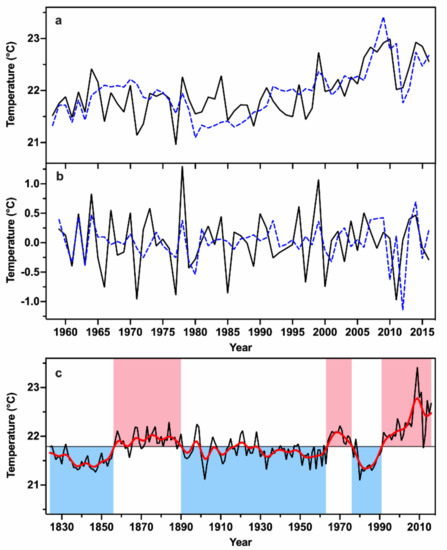
Figure 6.
(a) Comparison of the estimated (dash line) and the observed pMar-pOct temperature (solid line) during the common period 1958–2016; (b) Comparison between their first-differences during 1958–2016; (c) The pMar-pOct mean temperature reconstruction from 1824 to 2016 (black line) and its 11-year lowpass FFT filter (red line). The horizontal line denotes the mean value of the reconstruction. The pink and blue shadings denote the warm and cold phases of the reconstruction, respectively.
The pMar-pOct mean temperature was reconstructed in the study area for the past 193 years (Figure 6c). The mean and SD of the reconstructed pMar-pOct temperature are 21.79 °C and 0.34 °C, respectively. Decadal and multi-decadal variations were found in the pMar-pOct mean temperature reconstruction. Based on a 11-year lowpass FFT filter and its mean value, three major warm (1857–1890, 1964–1976, and 1992–2016) and cold (1824–1856, 1891–1963, and 1977–1991) periods were found in the reconstruction period from 1824 to 2016. The top 10 warmest and coldest years are listed in Table 2. The extremely warm (cold) years were defined as the years with the temperature values higher (lower) than 1.5 SD, respectively. Nine extremely warm years (2009, 2008, 2011, 2010, 2014, 2016, 2007, 2015, and 1999) and three extremely cold years (1980, 1902, 1847) were identified over the reconstruction period.
Table 2.
The top 10 warmest and coldest years of the pMar-pOct mean temperature reconstruction during 1824–2016.
4. Discussion
4.1. The Climate–Growth Relationship
The MRS site is located in the north-central part of the Pearl River basin. The reliable period of the TRW chronology at the MRS site is 1824–2016 (Figure 3). Based on the wavelet power spectrum analysis of the TRW chronology, multi-year and multi-decadal signals were found during the reconstruction period 1824–2016 (Figure 4). As shown in Figure 5a, previous growing season temperatures (i.e., previous March to October) showed the most significant correlation with the TRW chronology (p < 0.05), which suggests that the previous growing season’s temperature had a significant impact on the growth of T. longibracteata at the MRS site. The temperature in the current February was also significantly and positively correlated with the growth of T. longibracteata in the study area (p < 0.05, Figure 5a). Increased spring temperatures may result in earlier growth onset with earlier cambial activity and cell differentiation, while prolonging xylogenesis duration, and thus increasing tree growth [51,52,53,54]. The increased late autumn and winter temperatures may promote carbohydrates storage, and the carry-over carbohydrates reserved from the previous year could favor tree growth in the next growing season [27]. For example, Dong et al. [16] found that high winter temperatures in the previous year had an important impact on the tree growth of Chinese cedar (Cryptomeria fortune) in Fujian province of humid subtropical China. The dendroecological study of Chihuahua spruce (Picea chihuahuana) in northern Mexico also showed that cool and wet conditions in the previous winter could favor the earlywood and latewood growth of the current year [17]. In addition, the current August to October temperature also had positive impacts on the tree growth of T. longibracteata at the MRS site (p < 0.05, Figure 5a), reflecting the positive effect of temperature on photosynthesis, wood formation duration, and tree growth [51].
The precipitation from the previous March to the current October showed nonsignificant relationship with the growth of T. longibracteata at the MRS site (p > 0.05, Figure 5b). Therefore, the tree growth of T. longibracteata in the study area is more sensitive to temperature, which is inconsistent with the nearby tree-ring latewood width based study of T. longibracteata conducted at an altitude of 1030 m a.s.l. in the border of Guangxi and Hunan provinces that revealed a significant positive correlation with June-August precipitation [55]. We hypothesized that the climate sensitivity of T. longibracteata is elevation-dependent. T. longibracteata trees grow near the top of the MRS mountain with a peak altitude of around 2100 m a.s.l., which is the highest mountain in South China. Tree growth in high-altitude sites is generally more responsive to temperature, while trees growing at low-elevation sites are generally more sensitive to precipitation [56,57,58]. The climate sensitivity analysis of European beech (Fagus sylvatica) along an elevation gradient (110–1230 m) in south-western Germany showed that tree growth of F. sylvatica was strongly limited by low precipitation at lower elevations (110–300 m), but by low summer temperature at higher elevations (1230 m) [57]. In addition, different microsite environments and topographic conditions, such as soil microbes, soil depth and slope orientation, may also influence the sensitivity of tree growth [59,60,61]. At microsites with high moisture storage capacity, Douglas-fir (Pseudotsuga menziesii) in Slovenia favored the exposed and dry sites for optimal survival and development [61]. Zhao et al. [60] pointed that T. longibracteata located at a southeast-oriented hillside with a steep slope and shallow soil may experience severe water stress in summer due to having a low soil water-holding capacity and experiencing enhanced soil evaporation, while T. longibracteata growing on a northwest-oriented hillside with a flat slope and thick soil layer may be less water-restricted in summer due to a high soil water-holding capacity and experiencing low soil evaporation.
4.2. Tree-Ring Based Growing Season Temperature Variability
To assess the spatial representativeness of the temperature reconstruction, spatial correlations of the reconstructed pMar-pOct mean temperature with the NCDC gridded GHCN v4.0.1 temperature were calculated during their common period of 1958–2016 (Figure 7). Significant correlations in large-scale areas indicated that the TRW chronology at the MRS site could effectively represent the regional growing season temperature variability, especially to the north of the MRS site.
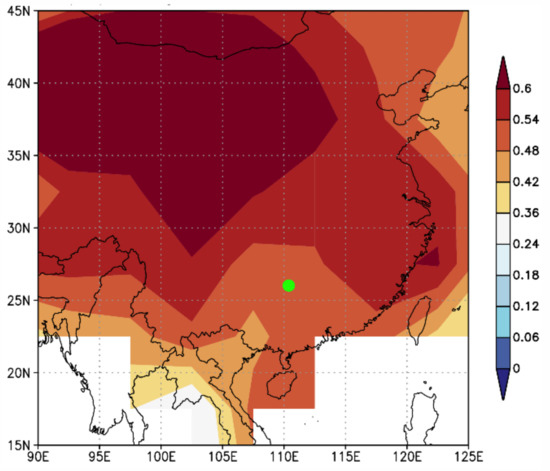
Figure 7.
Spatial correlations between the reconstructed pMar-pOct mean temperature and the NCDC gridded temperature during 1958–2016. The green dot denotes the MRS site in this study. Shading denotes the correlations that are statistically significant at the 0.10 level.
Multi-decadal variations were detected in the growing season temperature (pMar-pOct) reconstruction. Three major warm (1857–1890, 1964–1976, and 1992–2016) and cold (1824–1856, 1891–1963, and 1977–1991) periods were detected in the reconstruction period from 1824 to 2016. To further verify the reconstructed pMar-pOct mean temperature, three temperature series from nearby regions in central and south-central China were compared to our reconstruction (Figure 8), including the NCDC gridded GHCN v4.0.1 pMar-pOct temperature anomalies over the region of 20°–40° N and 100°–120° E over the period of 1900–2016 [50], the phenological and natural evidence based growing season temperature reconstruction during 1850–2008 in south-central China [62], and the tree-ring based February-May temperature reconstruction during 1824–2011 from the Shennongjia area in central China [63]. These three temperature records are significantly correlated with our reconstruction during their common periods (Figure 8). Many common variations can be found among these temperature records. For instance, the cold period in the 1970s–1980s was evident in all the temperature records. The major cold period in the 1890s–1950s was also found in all the four series, especially the extremely low temperatures in the 1890s, 1900s, and 1950s. The cold period in 1820s–1850s was also consistent with the tree-ring based February-May temperature reconstruction from central China [63]. Moreover, remarkable warming since the 1990s was observed in all the temperature series, suggesting that tree growth was effective at capturing the rapid warming signal in the area. As shown in Table 2, nine of the 10 warmest years in our reconstruction have occurred since 1999. However, there are some discrepancies among these temperature records, such as the warm periods in the 1860s and 1960s–1970s. These discrepancies may be related to the different reconstructed seasons and/or site-specific temperature anomalies at different locations. Regardless, the above comparison validates the general spatial representativeness of our growing season temperature reconstruction.
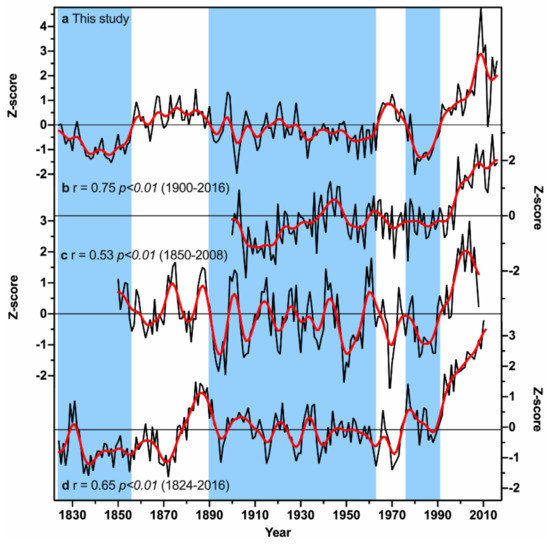
Figure 8.
Comparison of our pMar-pOct mean temperature reconstruction with the temperature records from other studies. (a) the pMar-pOct mean temperature reconstruction in this study; (b) the NCDC gridded GHCN v4.0.1 pMar-pOct temperature anomalies over the region of 20°–40° N and 100°–120° E [51]; (c) the phenological and natural evidence based growing season temperature reconstruction in south-central China [63]; (d) the tree-ring based February-May temperature reconstruction from the Shennongjia area in central China [64]. All series have been standardized for direct comparison. The red curve in each panel denotes a 11-year lowpass FFT filter. Vertical shading denotes cold periods in our reconstruction. The correlation coefficients were calculated between our reconstruction and the other three temperature series over their respective common period.
4.3. Linkages of the Growing Season Temperature Variability to Global SSTs
To explore the influences of global ocean SSTs on growing season temperature variations in the study area, spatial correlations were analyzed between the reconstructed pMar-pOct mean temperature and the global ERSST v5 SSTs during their common period of 1958–2016 (Figure 9). The reconstructed temperature is positively correlated with SSTs in the western Pacific Ocean, the northern Indian Ocean, and the northern and equatorial Atlantic Ocean. Hu et al. [64] indicated that warming in the tropical Indian Ocean Basin could trigger a low-level anomalous anticyclone circulation in the subtropical northwest Pacific, leading to above-normal surface air temperatures in south China. The reconstructed temperature is also significantly correlated with remote Atlantic Ocean SSTs, which may be explained by the ‘‘atmospheric bridge’’ that connects the large-scale atmospheric circulation anomalies in the Northern Hemisphere to the Atlantic Multidecadal Oscillation (AMO) [65]. Multi-decadal signal within a 30–60-year periodicity can be found in the TRW chronology during 1820s–2010s based on the result of wavelet power spectrum analysis (Figure 4), which is consistent with the periodicity of AMO [66,67]. Many studies have investigated the impacts of AMO on tree-ring based temperature variations in China and other regions around the world [68,69,70,71]. The warm/cold phases of the AMO could influence the positive/negative temperature anomalies over East Asia via strengthening/weakening the East Asian monsoon system [70]. Nonetheless, high resolution paleoclimate records are still scarce in the Pearl River basin. Future development of a large tree-ring network with long chronologies in the basin will help improve the understanding of regional temperature regimes and the AMO impacts in the basin.
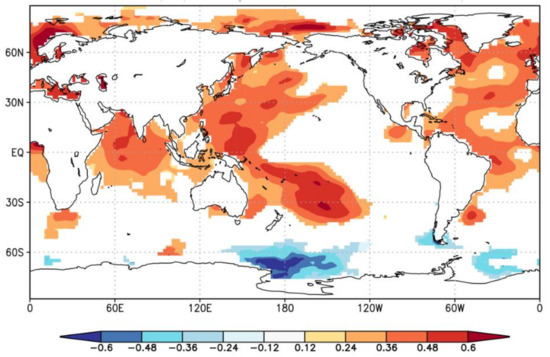
Figure 9.
Spatial correlations of the reconstructed pMar-pOct mean temperature with global ERSST v5 SSTs during 1958–2016. Shading denotes the correlations that are statistically significant at the 0.10 level.
5. Conclusions
In this study, we developed a ring-width chronology of T. longibracteata from 1780 to 2016 in the north-central Pearl River basin. Multi-year and multi-decadal signals can be found during the reliable period of the chronology (1824–2016), based on the wavelet power spectrum analysis of the chronology. According to the climate–growth relationship, the previous growing season (pMar-pOct) temperature was reconstructed during 1824–2016. Three major warm (1857–1890, 1964–1976, and 1992–2016) and cold (1824–1856, 1891–1963, and 1977–1991) periods were found in the pMar-pOct mean temperature reconstruction. A remarkable warming trend since the 1990s was detected in our reconstruction. Comparison with the NCDC gridded temperature records and proxy-based temperature reconstructions from nearby regions suggests that our reconstruction is representative of large-scale mean temperature changes over the past two centuries. Significant correlations with the SSTs in the western Pacific Ocean, northern Indian Ocean, and Atlantic Ocean suggest that SST change in these domains may have strong influence on growing season temperature variations in the Pearl River basin. Overall, our study indicates a potential of tree-rings as a record to reflect growing season temperatures in the Pearl River basin, which was not identified before. Nonetheless, TRW chronology of T. longibracteata developed at the high-altitude site of the MRS mountain is not sufficient to identify the elevation-dependent climate sensitivity. More research is also needed in order to broaden our understanding of climate change impacts on tree growth in subtropical China at both spatial and temporal scales. Due to the generally low climate sensitivity of trees in subtropical China and the scarcity of tree-ring studies in this region, future work should explore multiple tree species and tree-ring parameters, so as to maximize the potential of reconstructing long-term climate changes and their impacts on tree growth in subtropical regions of China.
Author Contributions
T.L. and J.L. conceptualized the study. T.L., J.L., and T.F.A. conducted the field investigation. T.L. wrote the original draft, with contributions from J.L., T.F.A., and D.D.Z. for review and editing. All authors have read and agreed to the published version of the manuscript.
Funding
This research was funded by the National Key Research and Development Program of China (No. 2018YFA0605601), Hong Kong Research Grants Council (No. 17303017), and Key Platform Construction Project–Special Project of High-Level University Construction at Guangzhou University (No. 290020363).
Conflicts of Interest
The authors declare no conflict of interest.
References
- Harris, N.L.; Gibbs, D.A.; Baccini, A.; Birdsey, R.A.; de Bruin, S.; Farina, M.; Fatoyinbo, L.; Hansen, M.C.; Herold, M.; Houghton, R.A.; et al. Global maps of twenty-first century forest carbon fluxes. Nat. Clim. Chang. 2021, 11, 234–240. [Google Scholar] [CrossRef]
- Jiang, M.; Medlyn, B.E.; Drake, J.E.; Duursma, R.A.; Anderson, I.C.; Barton, C.V.M.; Boer, M.M.; Carrillo, Y.; Castañeda-Gómez, L.; Collins, L.; et al. The fate of carbon in a mature forest under carbon dioxide enrichment. Nature 2020, 580, 227–231. [Google Scholar] [CrossRef] [PubMed]
- Domke, G.M.; Oswalt, S.N.; Walters, B.F.; Morin, R.S. Tree planting has the potential to increase carbon sequestration capacity of forests in the United States. Proc. Natl. Acad. Sci. USA 2020, 117, 24649–24651. [Google Scholar] [CrossRef]
- Begović, K.; Rydval, M.; Mikac, S.; Čupić, S.; Svobodova, K.; Mikoláš, M.; Kozák, D.; Kameniar, O.; Frankovič, M.; Pavlin, J.; et al. Climate-growth relationships of Norway Spruce and silver fir in primary forests of the Croatian Dinaric mountains. Agric. For. Meteorol. 2020, 288–289, 108000. [Google Scholar] [CrossRef]
- Gong, Y.; Staudhammer, C.L.; Wiesner, S.; Starr, G.; Zhang, Y. Characterizing growing season length of subtropical coniferous forests with a phenological model. Forests 2021, 12, 95. [Google Scholar] [CrossRef]
- Poungparn, S.; Komiyama, A.; Umnouysin, S.; Rodtassana, C.; Sangtiean, T.; Maknual, C.; Pravinvongvuthi, T.; Suchewaboripont, V.; Kato, S. Ten-year estimation of net primary productivity in a mangrove forest under a tropical monsoon climate in eastern Thailand: Significance of the temperature Environment in the Dry Season. Forests 2020, 11, 987. [Google Scholar] [CrossRef]
- Au, T.F.; Maxwell, J.; Novick, K.; Robeson, S.; Warner, S.; Lockwood, B.; Phillips, R.; Harley, G.; Telewski, F.; Therrell, M.; et al. Demographic shifts in eastern US forests increase the impact of late-season drought on forest growth. Ecography 2020, 43, 1475–1486. [Google Scholar] [CrossRef]
- Novick, K.; Ficklin, D.; Stoy, P.; Williams, C.; Bohrer, G.; Oishi, A.; Papuga, S.; Blanken, P.; Noormets, A.; Sulman, B.; et al. The increasing importance of atmospheric demand for ecosystem water and carbon fluxes. Nat. Clim. Chang. 2016, 6, 1023–1027. [Google Scholar] [CrossRef] [Green Version]
- Seidl, R.; Thom, D.; Kautz, M.; Martin-Benito, D.; Peltoniemi, M.; Vacchiano, G.; Wild, J.; Ascoli, D.; Petr, M.; Honkaniemi, J.; et al. Forest disturbances under climate change. Nat. Clim. Chang. 2017, 7, 395–402. [Google Scholar] [CrossRef] [Green Version]
- Farahat, E.; Linderholm, H.W. Growth–climate relationship of European beech at its northern distribution limit. Eur. J. Forest Res. 2018, 137, 619–629. [Google Scholar] [CrossRef]
- Depardieu, C.; Girardin, M.; Nadeau, S.; Lenz, P.; Bousquet, J.; Isabel, N. Adaptive genetic variation to drought in a widely distributed conifer suggests a potential for increasing forest resilience in a drying climate. New Phytol. 2020, 227. [Google Scholar] [CrossRef] [Green Version]
- Szymański, N.; Wilczyński, S. Radial growth response of European larch provenances to interannual climate variation in Poland. Forests 2021, 12, 334. [Google Scholar] [CrossRef]
- Di Filippo, A.; Baliva, M.; Brunetti, M.; Fiore, L. Long-term tree-ting tesponse to drought and frost in two Pinus halepensis populations growing under contrasting environmental conditions in peninsular Italy. Forests 2021, 12, 305. [Google Scholar] [CrossRef]
- Šimůnek, V.; Vacek, Z.; Vacek, S.; Ripullone, F.; Hájek, V.; D’Andrea, G. Tree rings of European beech (Fagus Sylvatica L.) indicate the relationship with solar cycles during climate change in central and southern Europe. Forests 2021, 12, 259. [Google Scholar] [CrossRef]
- Sánchez-Salguero, R.; Camarero, J.J.; Grau, J.M.; De la Cruz, A.C.; Gil, P.M.; Minaya, M.; Fernández-Cancio, Á. Analysing atmospheric processes and climatic drivers of tree defoliation to determine forest vulnerability to climate warming. Forests 2017, 8, 13. [Google Scholar] [CrossRef] [Green Version]
- Dong, Z.; Chen, D.; Du, J.; Yang, G.; Bai, M.; Zhou, F.; Zheng, Z.; Ruan, C.; Fang, K. A 241-year Cryptomeria fortune tree-ring chronology in humid subtropical China and its linkages with the Pacific Decadal Oscillation. Atmosphere 2020, 11, 247. [Google Scholar] [CrossRef] [Green Version]
- Cabral-Alemán, C.; Pompa-García, M.; Acosta-Hernández, A.C.; Zúñiga-Vásquez, J.M.; Camarero, J.J. Earlywood and latewood widths of Picea chihuahuana show contrasting sensitivity to seasonal climate. Forests 2017, 8, 173. [Google Scholar] [CrossRef] [Green Version]
- Li, J.; Shi, J.; Zhang, D.; Yang, B.; Fang, K.; Yue, P.H. Moisture increase in response to high-altitude warming evidenced by tree-rings on the southeastern Tibetan Plateau. Clim. Dyn. 2017, 48, 649–660. [Google Scholar] [CrossRef] [Green Version]
- Gao, L.; Deng, Y.; Yan, X.; Li, Q.; Zhang, Y.; Gou, X. The unusual recent streamflow declines in the Bailong River, north-central China, from a multi-century perspective. Quat. Sci. Rev. 2021, 260, 106927. [Google Scholar] [CrossRef]
- Wang, H.L.; Zhang, Y.X.; Shao, X.M. A tree-ring-based drought reconstruction from 1466 to 2013 CE for the Aksu area, western China. Clim. Chang. 2021, 165, 16. [Google Scholar] [CrossRef]
- Jiang, Y.A.; Cao, Y.T.; Han, S.J.; Zhang, J.H.; Hao, L. Spatial variation and temporal instability in the growth/climate relationship of white birch (Betula platyphylla Suk) in the Changbai mountain, China. Forests 2021, 12, 16. [Google Scholar] [CrossRef]
- Li, J.; Li, J.; Li, T.; Au, T.F. Tree growth divergence from winter temperature in the Gongga Mountains, southeastern Tibetan Plateau. Asian Geogr. 2020, 37, 1–15. [Google Scholar] [CrossRef]
- Yang, B.; Qin, C.; Bräuning, A.; Osborn, T.J.; Trouet, V.; Ljungqvist, F.C.; Esper, J.; Schneider, L.; Grießinger, J.; Büntgen, U.; et al. Long-term decrease in Asian monsoon rainfall and abrupt climate change events over the past 6,700 years. Proc. Natl. Acad. Sci. USA 2021, 118, e2102007118. [Google Scholar] [CrossRef]
- Zhao, S.; Pederson, N.; D’Orangeville, L.; HilleRisLambers, J.; Boose, E.; Penone, C.; Bauer, B.; Jiang, Y.; Manzanedo, R. The International Tree-Ring Data Bank (ITRDB) revisited: Data availability and global ecological representativity. J. Biogeogr. 2018, 46, 355–368. [Google Scholar] [CrossRef]
- Li, T.; Li, J.; Au, T.F.; Zhang, D.D. Moisture variability in the east Pearl River basin since 1894 CE inferred from tree ring records. Atmosphere 2020, 11, 13. [Google Scholar] [CrossRef]
- Cai, Q.; Liu, Y.; Liu, H.; Sun, C.; Wang, Y. Growing-season precipitation since 1872 in the coastal area of subtropical southeast China reconstructed from tree rings and its relationship with the East Asian summer monsoon system. Ecol. Indic. 2017, 82, 441–450. [Google Scholar] [CrossRef]
- Chen, F.; Yuan, Y.; Wei, W.; Yu, S.; Wang, H. Tree-ring response of subtropical tree species in southeast China on regional climate and sea-surface temperature variations. Trees 2015, 29, 17–24. [Google Scholar] [CrossRef]
- Lin, J.; Hu, Y.; Wang, F. Wood and Bark Anatomy of Nothotsuga (Pinaceae). Ann. Mo. Bot. Gard. 1995, 82, 603–609. [Google Scholar] [CrossRef]
- Tan, X.; Zhang, L.; Zhang, A.; Wang, Y.; Huang, D.; Wu, X.; Sun, X.; Xiong, Q.; Pan, K. The suitable distribution area of Tsuga longibracteata revealed by a climate and spatial constraint model under future climate change scenarios. Acta Ecol. Sin. 2018, 38, 8934–8945. (In Chinese) [Google Scholar] [CrossRef]
- Zhu, X.; Feng, D. Natural regeneration of Tsuga longibracteata Ⅱ. Seedling establishment of different type communities and environmental impacts. J. Fujian Coll. For. 2011, 31, 315–319. (In Chinese) [Google Scholar] [CrossRef]
- Zhong, X.; Huang, H. A study on the water conservation function of Tsuga longibracteata nature forest. J. Fujian For. Sci. Technol. 2004, 31, 54–57. (In Chinese) [Google Scholar] [CrossRef]
- Tian, Q.; Yang, S. Regional climatic response to global warming: Trends in temperature and precipitation in the Yellow, Yangtze and Pearl River basins since the 1950s. Quat. Int. 2017, 440, 1–11. [Google Scholar] [CrossRef]
- Ren, G.; Guan, Z.; Shao, X.; Gong, D. Changes in climatic extremes over mainland China. Clim. Res. 2011, 50, 105–111. [Google Scholar] [CrossRef]
- Wang, Z.; Zhong, R.; Lai, C.; Zeng, Z.; Lian, Y.; Bai, X. Climate change enhances the severity and variability of drought in the Pearl River Basin in South China in the 21st century. Agric. For. Meteorol. 2018, 249, 149–162. [Google Scholar] [CrossRef]
- Huang, C.; Luo, Y.; Zhang, J.; Jiang, D.; Yu, W.; Li, B. The Vertical Distribution Characters of Forest Soil Chemical Properties in Guangxi Maoer Mountain Nature Reserve. Chin. J. Anhui Agric. Sci. 2009, 37, 245–247. (In Chinese) [Google Scholar] [CrossRef]
- Holmes, R.L. Computer-assisted quality control in tree-ring dating and measurement. Tree-Ring Bull. 1983, 43, 69–78. [Google Scholar]
- Fritts, H.C. Tree rings and climate; Academic Press: London, UK, 1976. [Google Scholar]
- Cook, E.R.; Kairiukstis, L.A. Methods of Dendrochronology: Applications in the Environmental Sciences; Springer Science & Business Media: Dordrecht, The Netherlands, 1990. [Google Scholar]
- Melvin, T.M.; Briffa, K.R.; Nicolussi, K.; Grabner, M. Time-varying-response smoothing. Dendrochronologia 2007, 25, 65–69. [Google Scholar] [CrossRef]
- Cook, E.R.; Peters, K. Calculating unbiased tree-ring indices for the study of climatic and environmental change. Holocene 1997, 7, 361–370. [Google Scholar] [CrossRef]
- Frank, D.; Esper, J.; Cook, E.R. Adjustment for proxy number and coherence in a large-scale temperature reconstruction. Geophys. Res. Lett. 2007, 34, L16709. [Google Scholar] [CrossRef] [Green Version]
- Osborn, T.; Briffa, K.; Jones, P. Adjusting variance for sample size in tree-ring chronologies and other regional mean timeseries. Dendrochronologia 1997, 15, 89–99. [Google Scholar]
- Wigley, T.M.; Briffa, K.R.; Jones, P.D. On the average value of correlated time series, with applications in dendroclimatology and hydrometeorology. J. Clim. Appl. Meteor. 1984, 23, 201–213. [Google Scholar] [CrossRef]
- Zhu, Q.; He, H.; Zhou, X.; Tang, Y. Analysis on the characteristics and climatic causes of the persistent low temperature and snow freezing process in Guangxi. Chin. J. Meteorol. Res. Appl. 2019, 40, 38–41. (In Chinese) [Google Scholar] [CrossRef]
- Köppen, W. Das Geographische System der Klimate, in Handbuch der Klimatologie; Borntraeger Science Publishers: Berlin, Germany, 1936. [Google Scholar]
- Peel, M.; Finlayson, B.; McMahon, T. Updated World Map of the Koppen-Geiger Climate Classification. Hydrol. Earth Syst. Sci. Discuss. 2007, 4. [Google Scholar] [CrossRef] [Green Version]
- Michaelsen, J. Cross-validation in statistical climate forecast models. J. Clim. Appl. Meteor. 1987, 26, 1589–1600. [Google Scholar] [CrossRef] [Green Version]
- Torrence, C.; Compo, G.P. A practical guide to wavelet analysis. Bull. Am. Meteorol. Soc. 1998, 79, 61–78. [Google Scholar] [CrossRef] [Green Version]
- Huang, B.; Thorne, P.W.; Banzon, V.F.; Boyer, T.; Chepurin, G.; Lawrimore, J.H.; Menne, M.J.; Smith, T.M.; Vose, R.S.; Zhang, H.-M. Extended reconstructed sea surface temperature, version 5 (ERSSTv5): Upgrades, validations, and intercomparisons. J. Clim. 2017, 30, 8179–8205. [Google Scholar] [CrossRef]
- Menne, M.J.; Williams, C.N.; Gleason, B.E.; Rennie, J.J.; Lawrimore, J.H. The global historical climatology network monthly temperature dataset, version 4. J. Clim. 2018, 31, 9835–9854. [Google Scholar] [CrossRef]
- Begum, S.; Kudo, K.; Rahman, M.H.; Nakaba, S.; Yamagishi, Y.; Nabeshima, E.; Nugroho, W.D.; Oribe, Y.; Kitin, P.; Jin, H.-O.; et al. Climate change and the regulation of wood formation in trees by temperature. Trees 2018, 32, 3–15. [Google Scholar] [CrossRef]
- Saderi, S.; Rathgeber, C.B.K.; Rozenberg, P.; Fournier, M. Phenology of wood formation in larch (Larix decidua Mill.) trees growing along a 1000-m elevation gradient in the French Southern Alps. Ann. For. Sci. 2019, 76, 89. [Google Scholar] [CrossRef]
- Meng, F.; Zhang, L.; Zhang, Z.; Jiang, L.; Wang, Y.; Duan, J.; Wang, Q.; Li, B.; Liu, P.; Hong, H.; et al. Enhanced spring temperature sensitivity of carbon emission links to earlier phenology. Sci. Total Environ. 2020, 745, 140999. [Google Scholar] [CrossRef]
- Yan, T.; Song, H.; Zeng, H. Spring phenophases of larch are more sensitive to spring warming than to year-round warming: Results of a seasonally asymmetric warming experiment. For. Ecol. Manag. 2020, 474, 118368. [Google Scholar] [CrossRef]
- Zhao, Y.; Shi, J.; Shi, S.; Yu, J.; Lu, H. Tree-ring latewood width based July–August SPEI reconstruction in South China since 1888 and its possible connection with ENSO. J. Meteor. Res. 2017, 31, 39–48. [Google Scholar] [CrossRef]
- Salzer, M.W.; Hughes, M.K.; Bunn, A.G.; Kipfmueller, K.F. Recent unprecedented tree-ring growth in bristlecone pine at the highest elevations and possible causes. Proc. Natl. Acad. Sci. USA 2009, 106, 20348–20353. [Google Scholar] [CrossRef] [PubMed] [Green Version]
- Dulamsuren, C.; Hauck, M.; Kopp, G.; Ruff, M.; Leuschner, C. European beech responds to climate change with growth decline at lower, and growth increase at higher elevations in the center of its distribution range (SW Germany). Trees 2017, 31, 673. [Google Scholar] [CrossRef]
- Kolar, T.; Čermák, P.; Trnka, M.; Žid, T.; Rybníček, M. Temporal changes in the climate sensitivity of Norway spruce and European beech along an elevation gradient in Central Europe. Agric. For. Meteorol. 2017, 239, 24–33. [Google Scholar] [CrossRef]
- Classen, A.; Sundqvist, M.; Henning, J.; Newman, G.; Moore, J.; Cregger, M.; Moorhead, L.; Patterson, C. Direct and indirect effects of climate change on soil microbial and soil microbial-plant interactions: What lies ahead? Ecosphere 2015, 6, 130. [Google Scholar] [CrossRef]
- Zhao, Y.; Shi, J.; Shi, S.; Wang, B.; Yu, J. Summer climate implications of tree-ring latewood width: A case study of Tsuga longibracteata in South China. Asian Geogr. 2017, 34, 131–146. [Google Scholar] [CrossRef]
- Čater, M. Microsites influence the light response of young Douglas-fir (Pseudotsuga menziesii (Mirb.) Franco). Forests 2021, 12, 687. [Google Scholar] [CrossRef]
- Zheng, J.; Hua, Z.; Liu, Y.; Hao, Z. Temperature changes derived from phenological and natural evidence in South Central China from 1850 to 2008. Clim. Past 2015, 11, 1553–1561. [Google Scholar] [CrossRef] [Green Version]
- Zheng, Y.; Shao, X.; Lu, F.; Li, Y. February–May temperature reconstruction based on tree-ring widths of Abies fargesii from the Shennongjia area in central China. Int. J. Biometeorol. 2016, 60, 1175–1181. [Google Scholar] [CrossRef]
- Hu, K.; Huang, G.; Huang, R. The impact of tropical Indian Ocean variability on summer surface air temperature in China. J. Clim. 2011, 24, 5365–5377. [Google Scholar] [CrossRef]
- Si, D.; Ding, Y. Oceanic forcings of the interdecadal variability in East Asian summer rainfall. J. Clim. 2016, 29, 7633–7649. [Google Scholar] [CrossRef]
- Gray, S.T.; Graumlich, L.J.; Betancourt, J.L.; Pederson, G.T. A tree-ring based reconstruction of the Atlantic Multidecadal Oscillation since 1567 AD. Geophys. Res. Lett. 2004, 31, L12205. [Google Scholar] [CrossRef]
- Schmitt, D.; Gischler, E.; Birgel, D.; Peckmann, J.; Anselmetti, F.S.; Vogel, H. Great Blue Hole (Lighthouse Reef, Belize): A continuous, annually-resolved record of Common Era sea surface temperature, Atlantic Multidecadal Oscillation and cyclone-controlled run-off. Quat. Sci. Rev. 2020, 247, 106570. [Google Scholar] [CrossRef]
- Li, J.; Li, J.; Li, T.; Au, T.F. 351-year tree ring reconstruction of the Gongga Mountains winter minimum temperature and its relationship with the Atlantic Multidecadal Oscillation. Clim. Chang. 2021, 165, 49. [Google Scholar] [CrossRef]
- Li, T.; Li, J. A 564-year annual minimum temperature reconstruction for the east central Tibetan Plateau from tree rings. Glob. Planet. Chang. 2017, 157, 165–173. [Google Scholar] [CrossRef]
- Wang, J.; Yang, B.; Ljungqvist, F.C.; Zhao, Y. The relationship between the Atlantic Multidecadal Oscillation and temperature variability in China during the last millennium. J. Quat. Sci. 2013, 28, 653–658. [Google Scholar] [CrossRef]
- Gaire, N.P.; Fan, Z.-X.; Shah, S.K.; Thapa, U.K.; Rokaya, M.B. Tree-ring record of winter temperature from Humla, Karnali, in central Himalaya: A 229 years-long perspective for recent warming trend. Geogr. Ann. Ser. A Phys. Geogr. 2020, 102, 297–316. [Google Scholar] [CrossRef]
Publisher’s Note: MDPI stays neutral with regard to jurisdictional claims in published maps and institutional affiliations. |
© 2021 by the authors. Licensee MDPI, Basel, Switzerland. This article is an open access article distributed under the terms and conditions of the Creative Commons Attribution (CC BY) license (https://creativecommons.org/licenses/by/4.0/).