
Forest Management of Pinus pinaster Ait. in Unbalanced Forest Structures Arising from Disturbances—A Framework Proposal of Decision Support Systems (DSS)


 and
and
Abstract
:1. Introduction
2. Materials and Methods
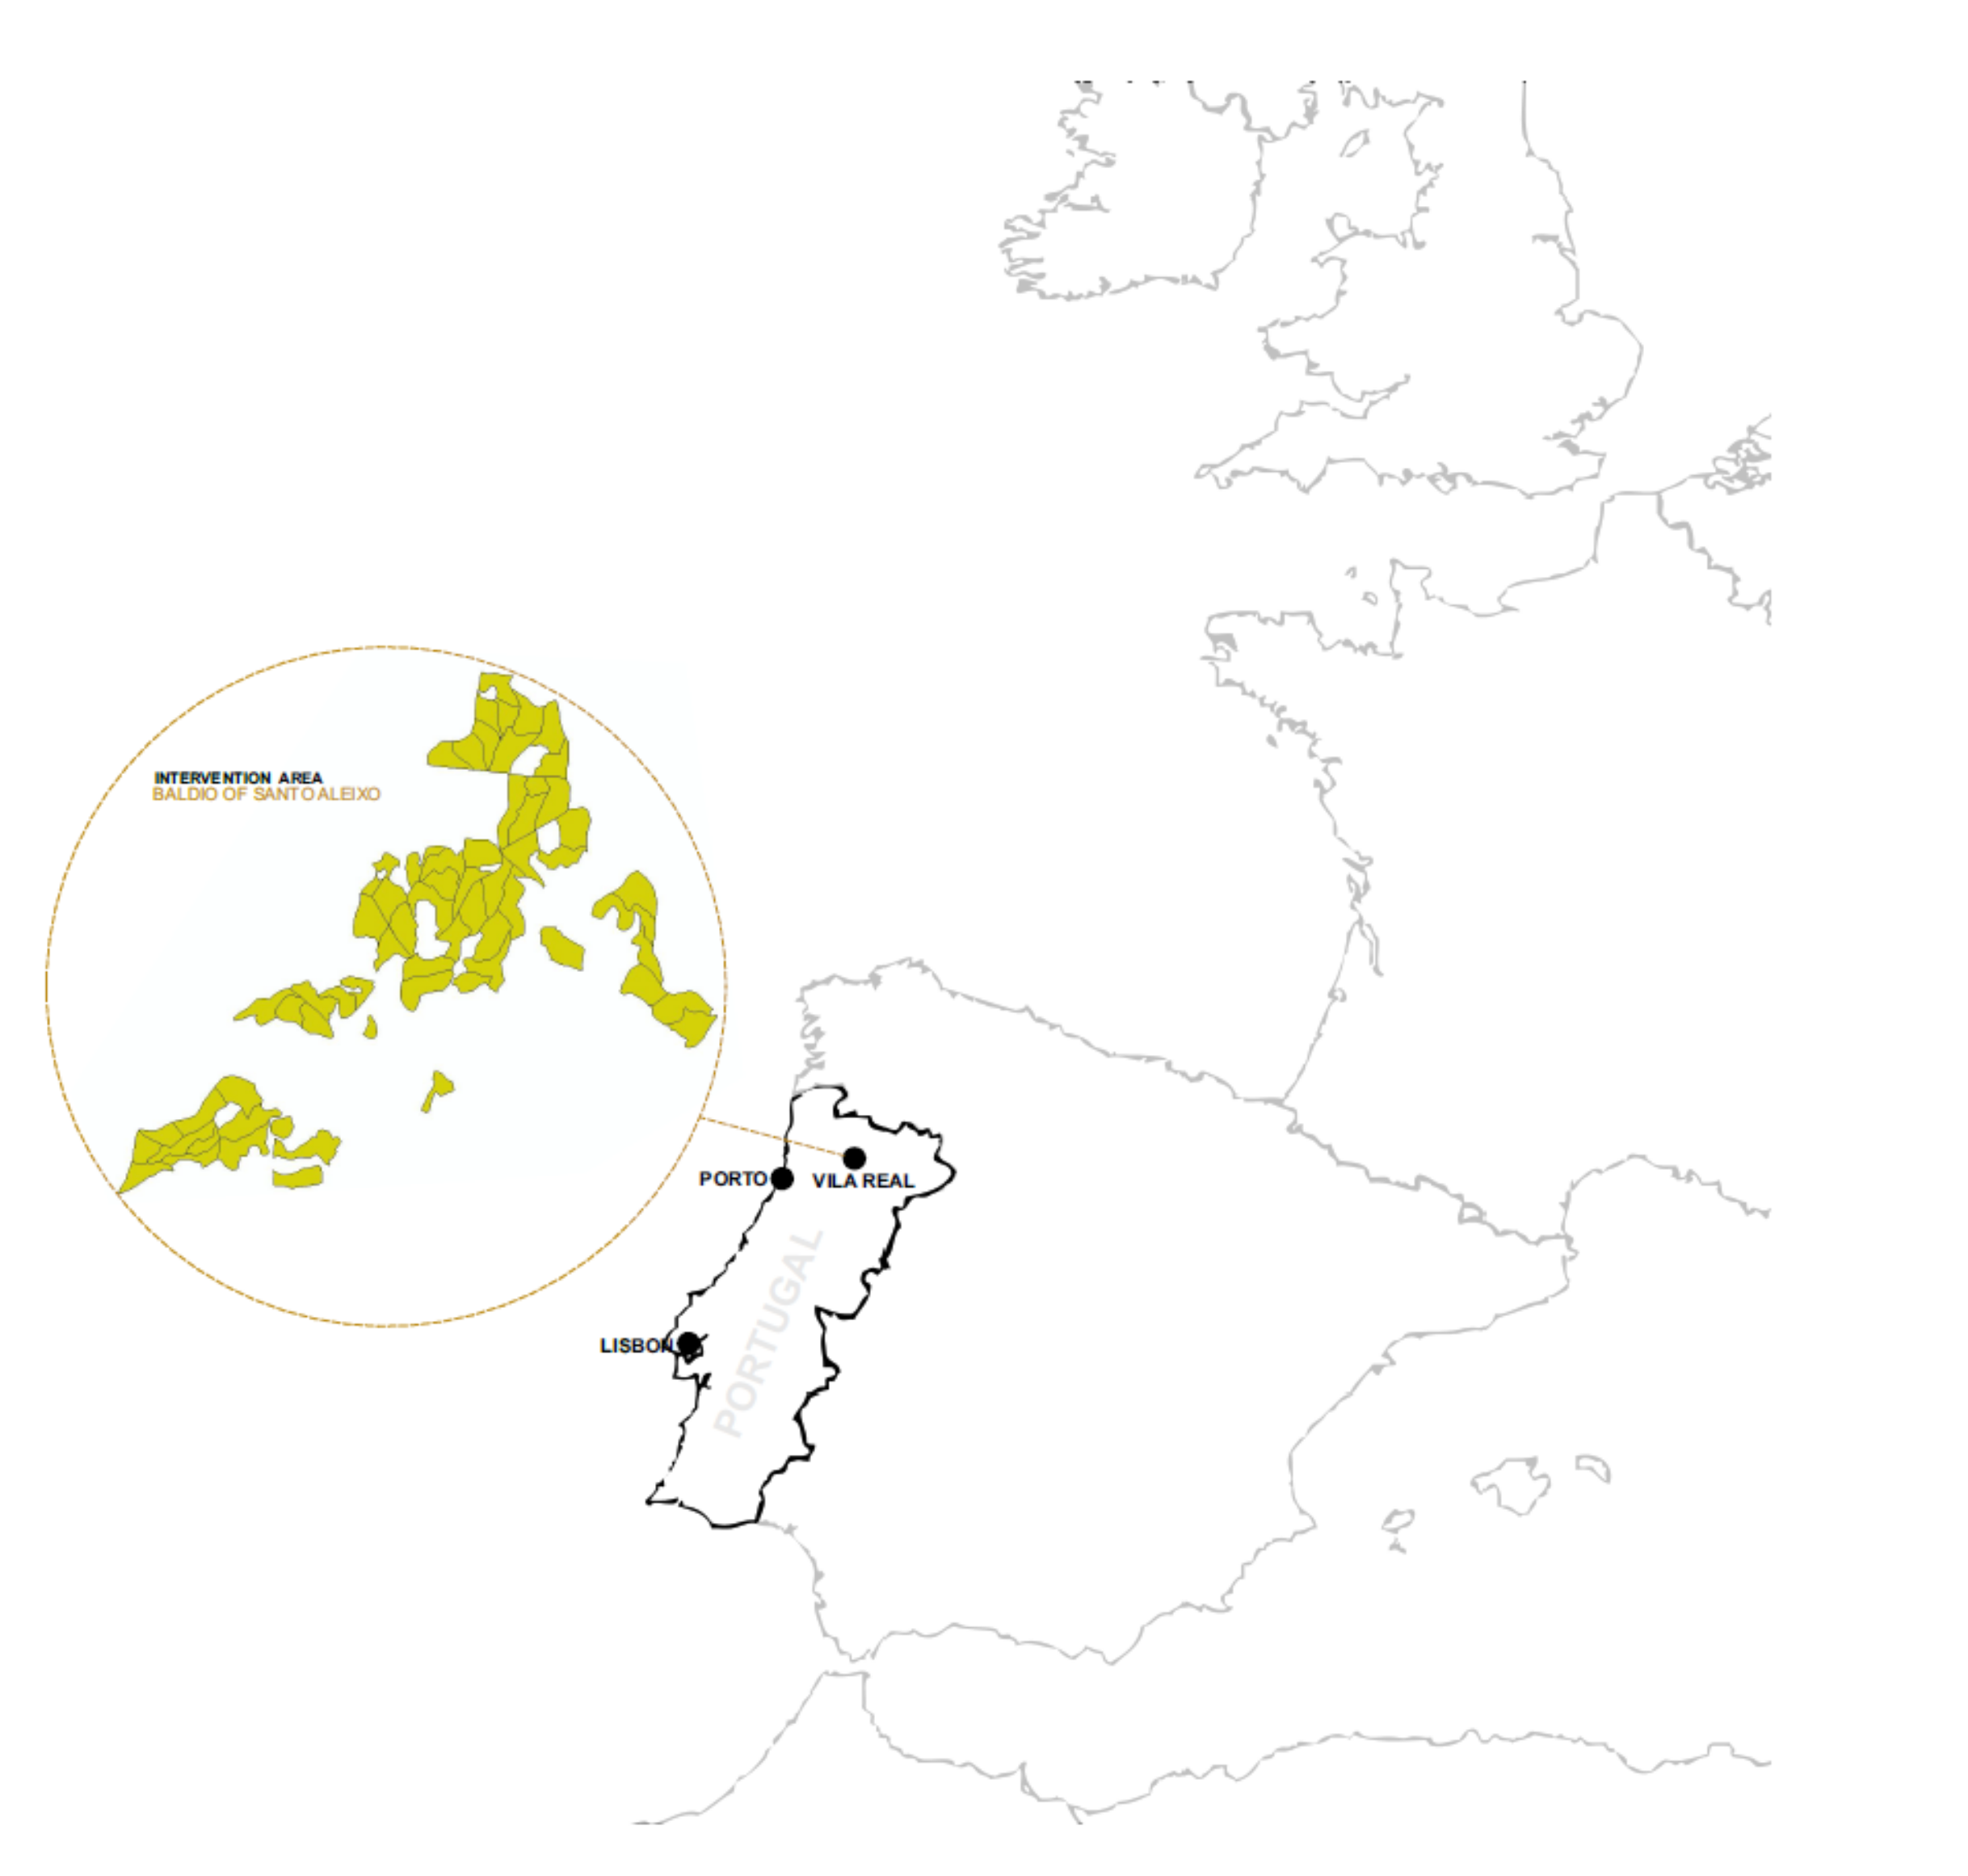
2.1. Study Area Characteristics
2.2. Simulation Scenarios Using ModisPinaster
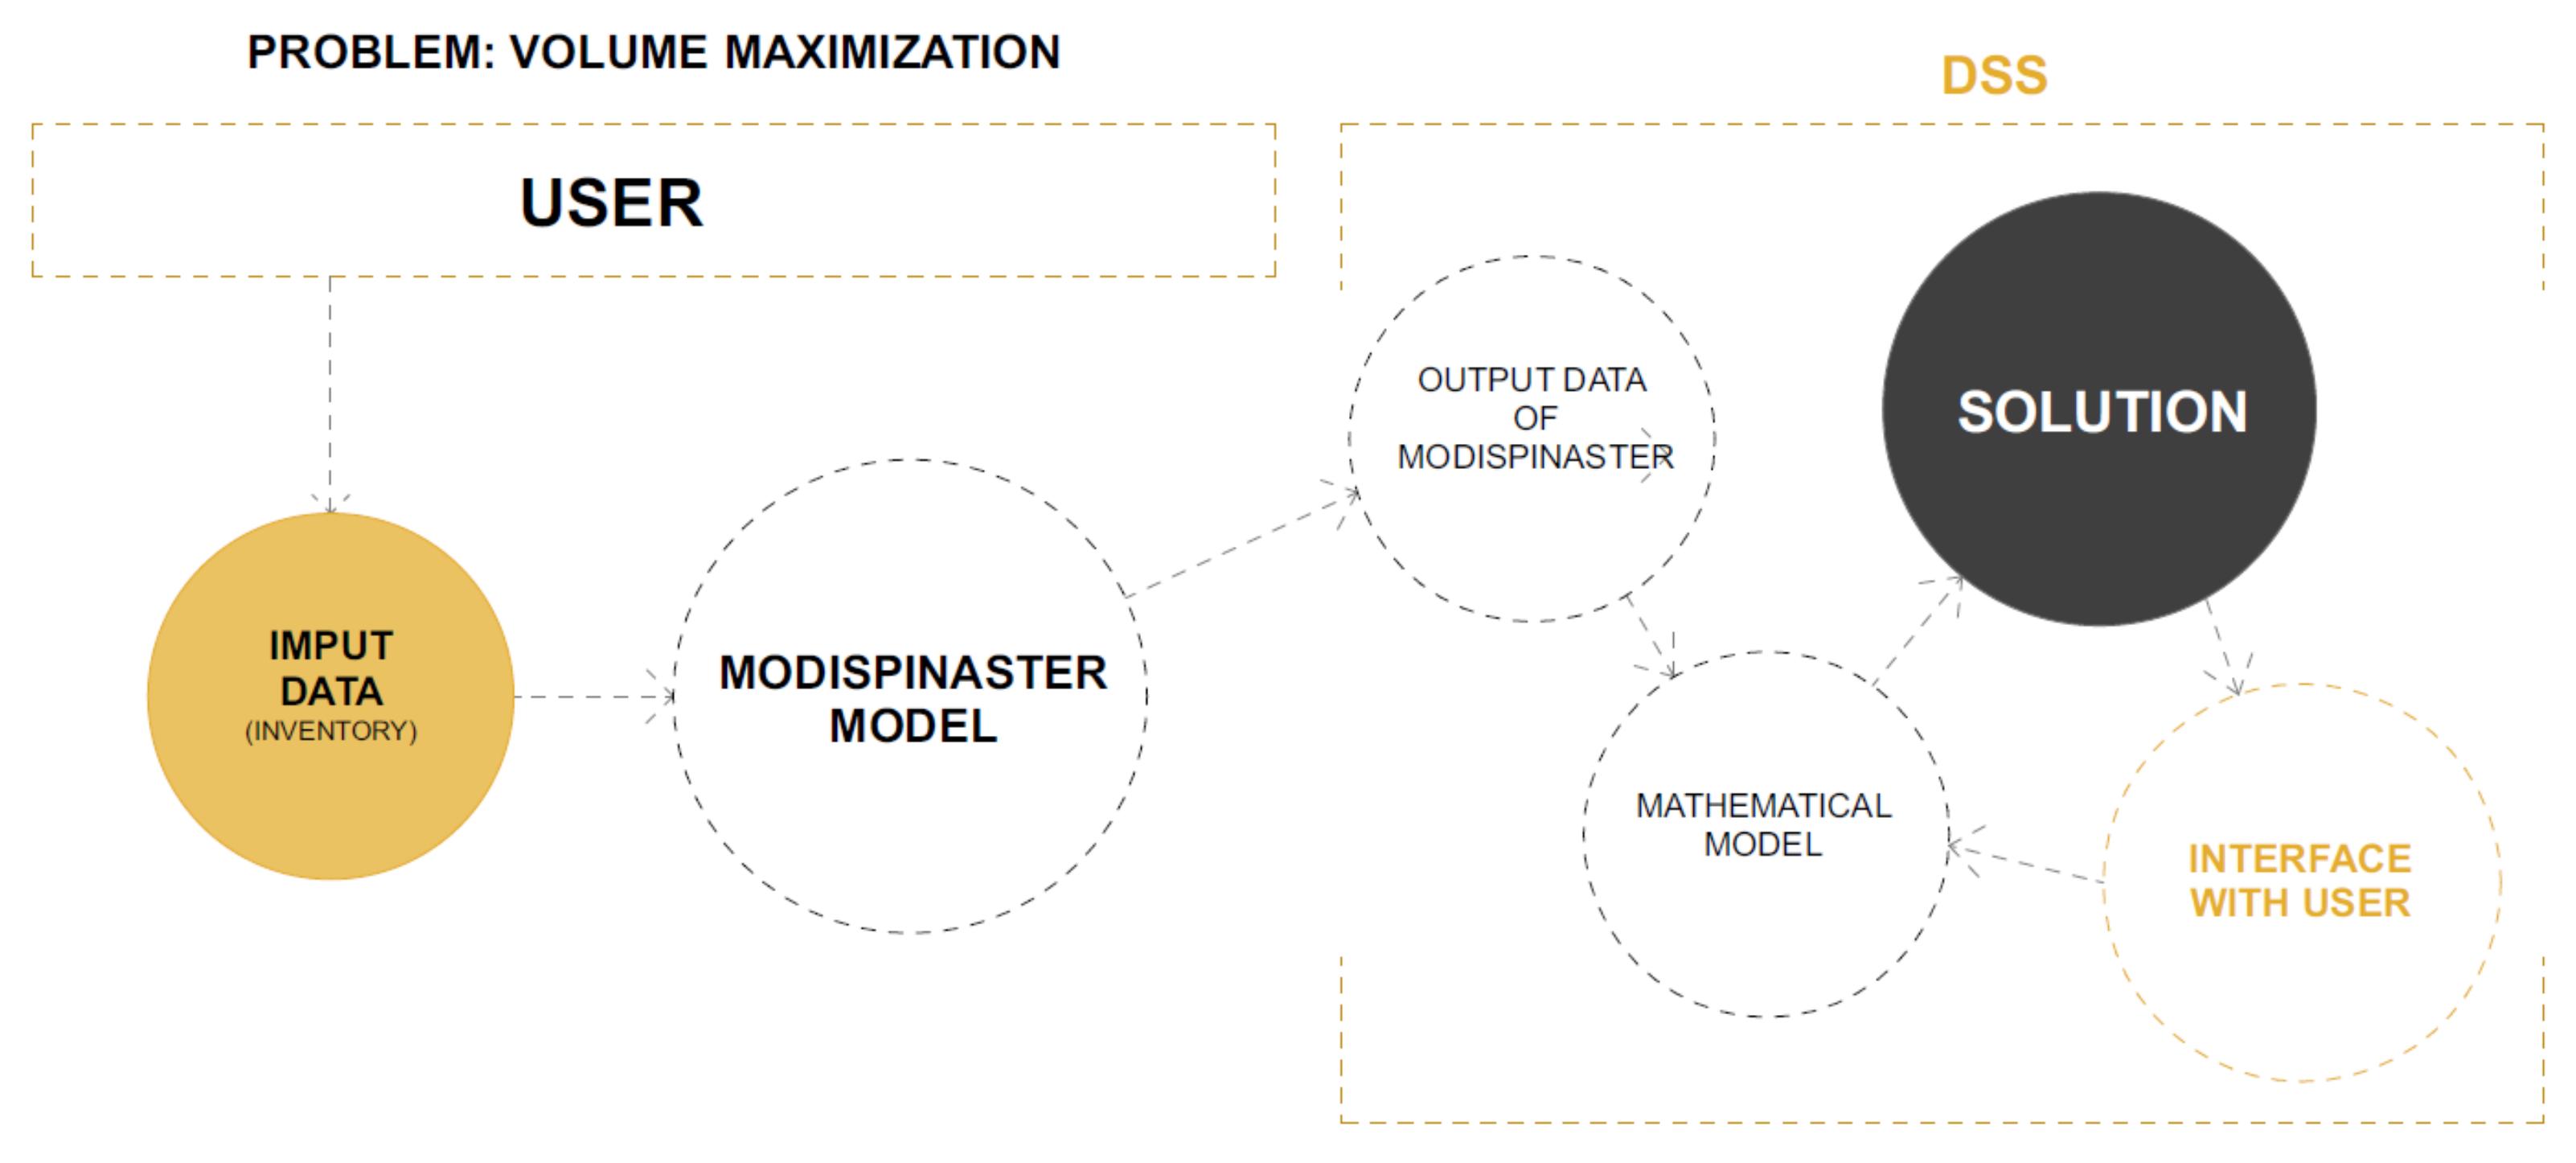
2.3. Proposed DSS Structure and Components
2.4. Optimization Model
3. Results
3.1. Remarks about the Model Parameters
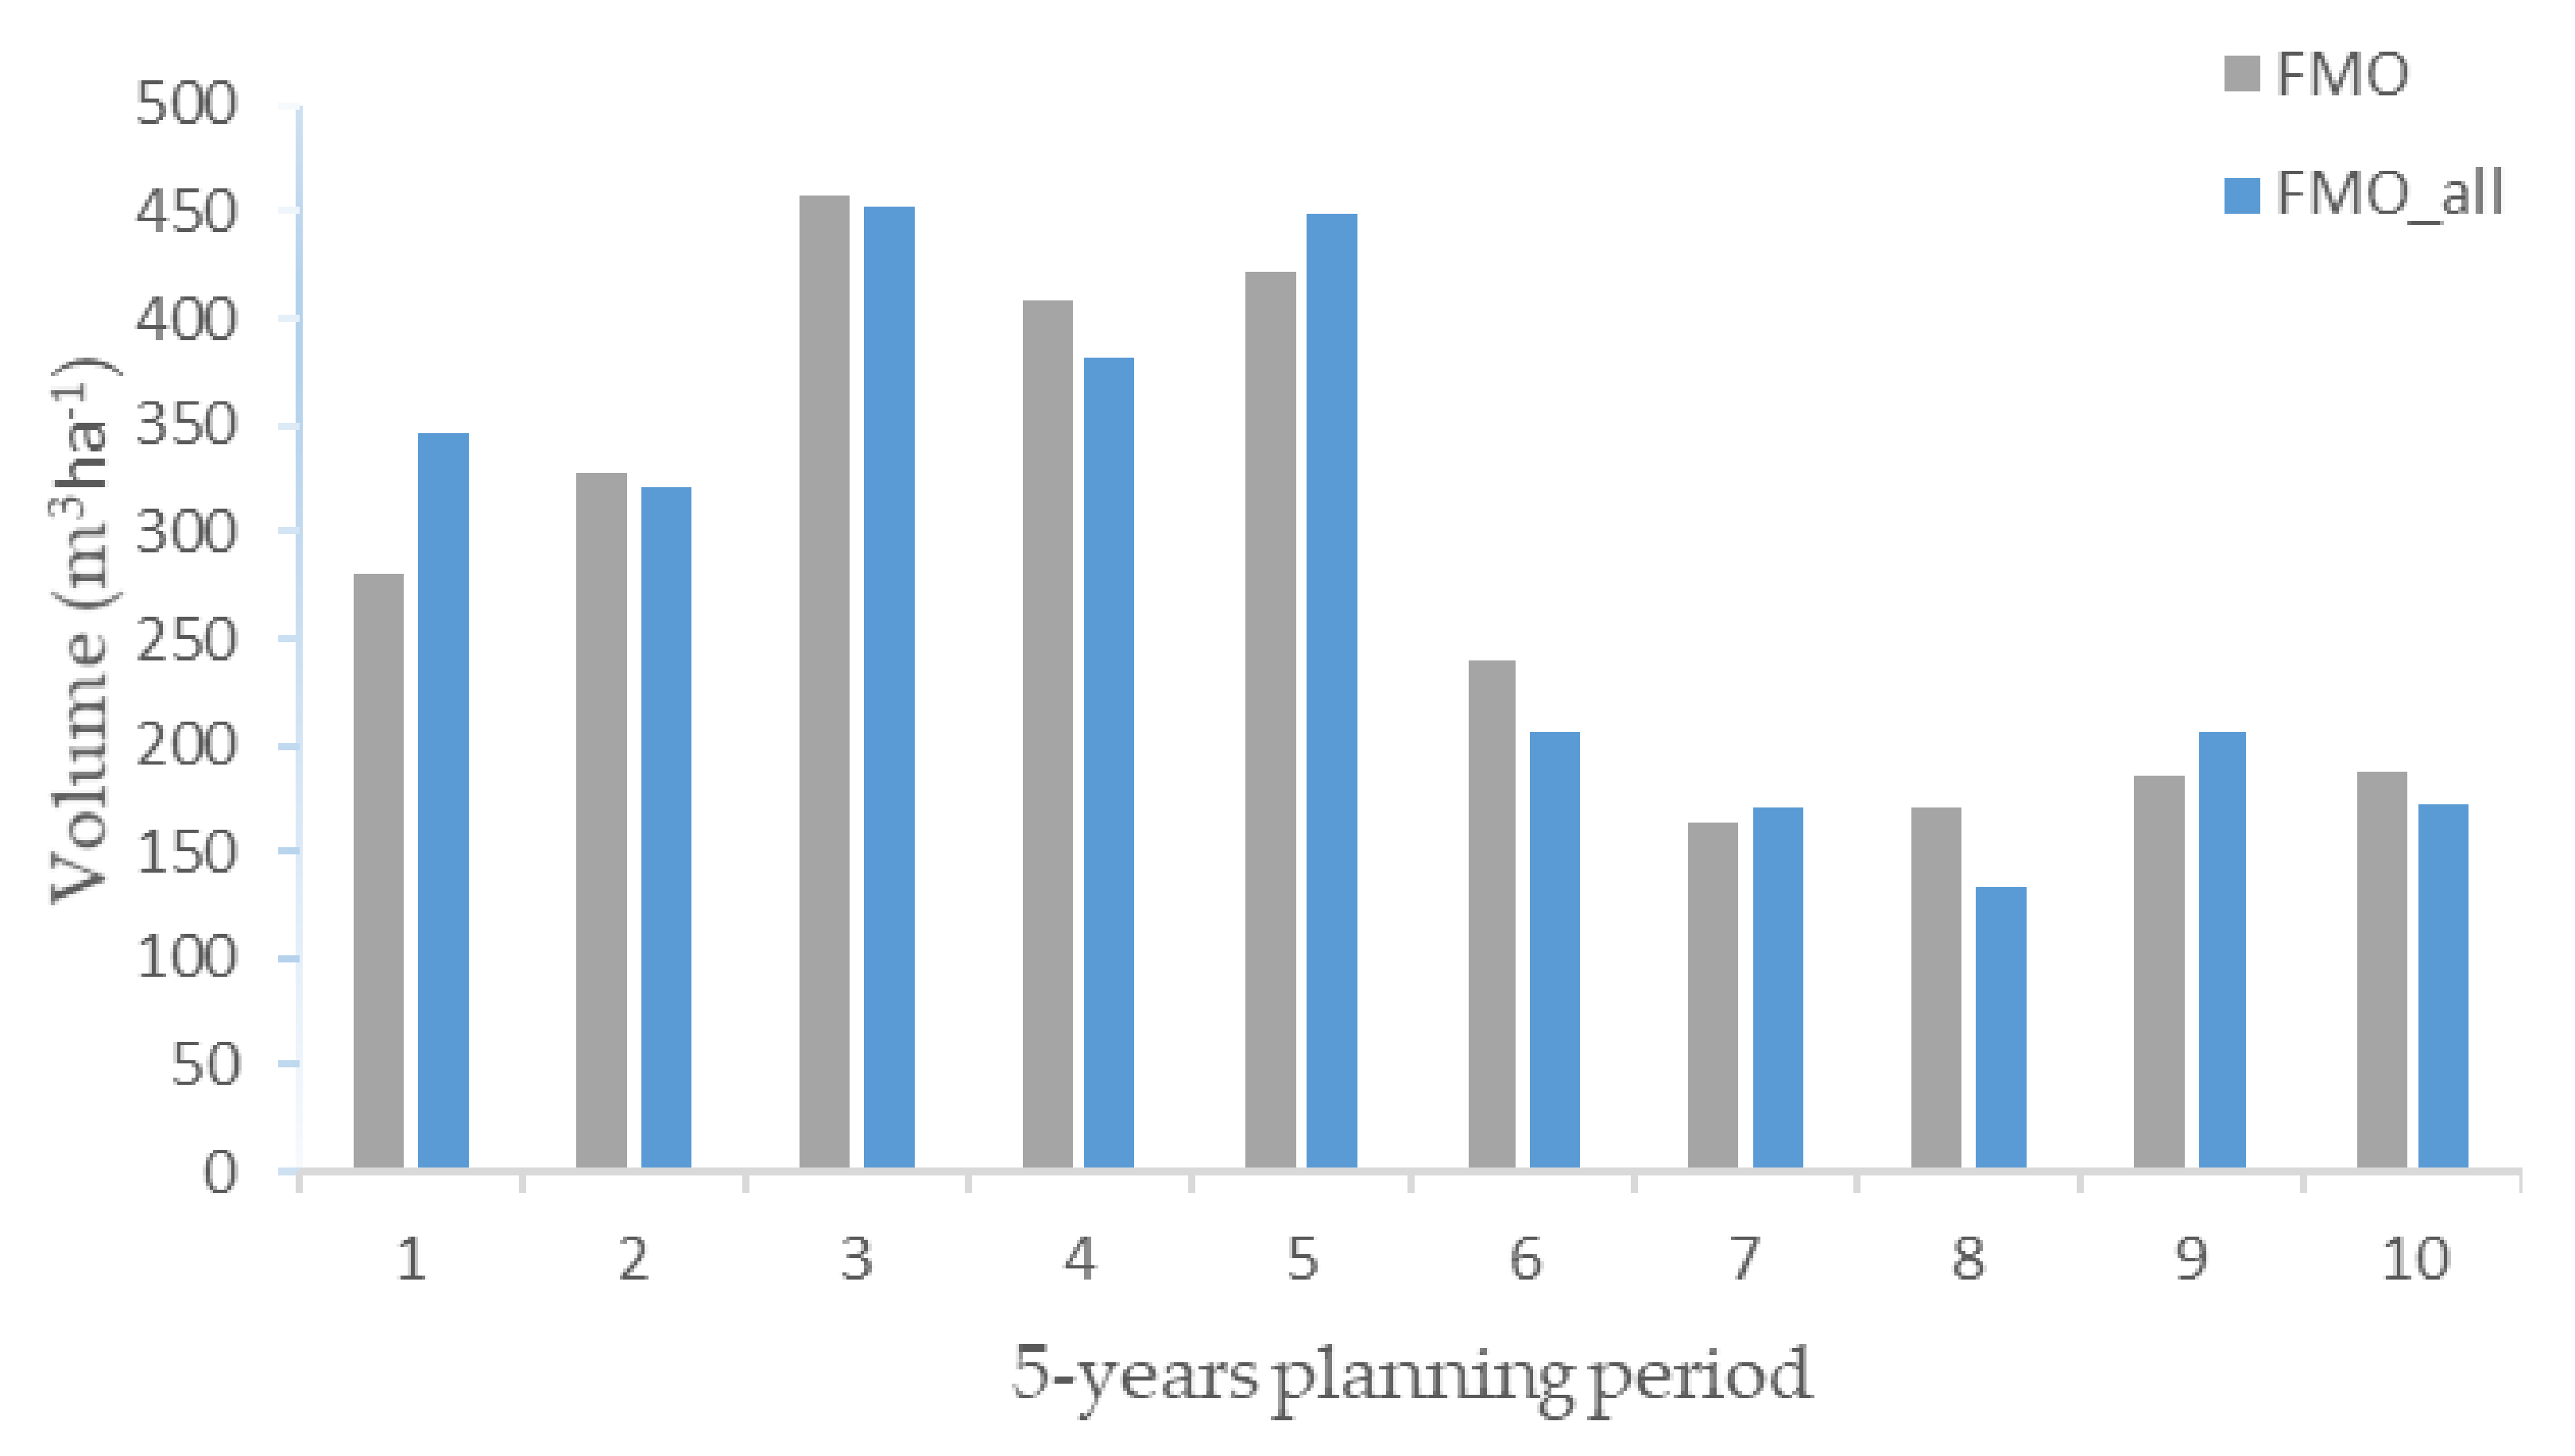
3.2. Obtained Results with the Framework DSS
4. Discussion
5. Conclusions
Author Contributions
Funding
Institutional Review Board Statement
Informed Consent Statement
Data Availability Statement
Acknowledgments
Conflicts of Interest
Appendix A. Complementary Results

| Variable | FMO_FA | FMO_CA | FMO_RV | |||
|---|---|---|---|---|---|---|
| Sc1 | Sc2 | Sc1 | Sc2 | Sc1 | Sc2 | |
| n | 43 | 22 | 43 | 22 | 41 | 24 |
| A (ha) | 283.73 | 155.14 | 287.07 | 151.8 | 275.81 | 163.06 |
| vol-cc (m3) | 188,177.09 | 73,626.32 | 189,221.62 | 70,794.05 | 177,254.97 | 76,453.52 |
| vol-th (m3) | 12,870.07 | 37,547.97 | 10,555.79 | 40,358.23 | 4002.40 | 43,508.24 |
| Total vol. (m3) | 312,221.455 | 310,929.692 | 301,219.129 | |||
| Final avg. age (yr) | 20.00 | 19.65 | 20.68 | |||
References
- Clutter, J.L.; Fortson, J.C.; Pienaar, L.V.; Brister, G.H.; Baily, R.L. Timber Management: A Quantitative Approach; John Wiley and Sons: New York, NY, USA, 1983; p. 333. [Google Scholar]
- Keen, P. Decision Support Systems: A Research Perspective; Addison-Wesley: Boston, MA, USA, 1978; p. 264. [Google Scholar]
- Sprague, R.H., Jr. A Framework for the Development of Decision Support Systems. MIS Q. 1980, 4, 1–25. [Google Scholar] [CrossRef]
- Igbaria, M.; Sprague, R.H., Jr.; Basnet, C.; Foulds, L. The impact and benefits of a DSS: The case of FleetManager. Inf. Manag. 1996, 31, 215–225. [Google Scholar] [CrossRef]
- Shim, J.P.; Warkentin, M.; Courtney, J.F.; Power, D.J.; Sharda, R.; Christer, C. Past, present, and future of decision support technology. Decis. Support Syst. 2002, 33, 111–126. [Google Scholar] [CrossRef]
- Hung, S.-Y.; Ku, Y.-C.; Liang, T.-P.; Lee, C.-J. Regret avoidance as a measure of DSS success: An exploratory study. Decis. Support Syst. 2007, 42, 2093–2106. [Google Scholar] [CrossRef]
- Pick, R.A. Benefits of Decision Support Systems. In Handbook on Decision Support Systems 1; Springer: Berlin/Heidelberg, Germany, 2008; pp. 719–730. [Google Scholar]
- Power, D.J.; Sharda, R. Decision Support Systems. In Springer Handbook of Automation—Part I; Nof, S., Ed.; Springer: Berlin/Heidelberg, Germany, 2009; pp. 1539–1548. [Google Scholar]
- Keen, P.G.W. Value Analysis: Justifying Decision Support Systems. MIS Q. 1981, 5, 1–15. [Google Scholar] [CrossRef]
- Reynolds, K.M.; Twery, M.; Lexer, M.J.; Vacik, H.; Ray, D.; Shao, G.; Borges, J.G. Decision support systems in natural resource management. In Handbook on Decision Support Systems; Burstein, F., Holsapple, C., Eds.; Springer: Berlin, Germany, 2008; Volume 2, pp. 499–534. [Google Scholar]
- Segura, M.; Ray, D.; Maroto, C. Decision support systems for forest management: A comparative analysis and assessment. Comput. Electron. Agric. 2014, 101, 55–67. [Google Scholar] [CrossRef]
- 6.º Inventário Florestal Nacional 2015—Relatório Final. Instituto da Conservação da Natureza e das Florestal. Available online: http://www2.icnf.pt/portal/florestas/ifn/resource/doc/ifn/ifn6/IFN6_Relatorio_completo-2019-11-28.pdf (accessed on 28 March 2021).
- Centro Pinus. A Fileira do Pinho em 2018—Indicadores da Fileira do Pinho. 2019. Available online: https://www.centropinus.org/files/upload/indicadores/indicadores-centro-pinus-2019-vf.pdf (accessed on 19 July 2021).
- Beighley, M.; Hyde, A.C.; Portugal Wildfire Management in a New Era Assessing Fire Risks. Resources and Reforms February. 2018. Available online: https://www.isa.ulisboa.pt/files/cef/pub/articles/2018-04/2018_Portugal_Wildfire_Management_in_a_New_Era_Engish.pdf (accessed on 27 July 2021).
- Borges, P.J.; Fragoso, R.; Garcia-Gonzalo, J.; Borges, J.G.; Marques Lucas, S. Assessing impacts of Common Agricultural Policy changes on regional land use patterns with a decision support system: An application in Southern Portugal. For. Policy Econ. 2010, 12, 111–120. [Google Scholar] [CrossRef] [Green Version]
- Marto, M.; Reynolds, K.M.; Borges, J.G.; Bushenkov, V.A.; Marques, S.; Marques, M.; Barreiro, S.; Botequim, B.; Tomé, M. Web-Based Forest Resources Management Decision Support System. Forests 2019, 10, 1079. [Google Scholar] [CrossRef] [Green Version]
- Garcia-Gonzalo, J.; Palma, J.H.N.; Freire, J.P.A.; Tome, M.; Mateus, R.; Rodriguez, L.C.E.; Bushenkov, V.; Borges, J.G. A decision support system for a multi stakeholder’s decision process in a Portuguese National Forest. For. Syst. 2013, 22, 359. [Google Scholar] [CrossRef] [Green Version]
- Garcia-Gonzalo, J.; Borges, J.G.; Palma, J.H.N.; Zubizarreta-Gerendiain, A. A decision support system for management plan-ning of Eucalyptus plantations facing climate change. Ann. For. Sci. 2014, 71, 187–199. [Google Scholar] [CrossRef]
- Falcão, A.; Borges, J.G. Designing decision support tools for Mediterranean forest ecosystems management: A case study in Portugal. Ann. For. Sci. 2005, 62, 751–760. [Google Scholar] [CrossRef] [Green Version]
- Moreira, A.M.; Fonseca, T.F. Tabela de produção para o pinhal do Vale do Tâmega. Silva Lusitana 2002, 10, 63–71. [Google Scholar]
- Fonseca, T.F. Modeling the Growth, Mortality and Diametric Distribution of Maritime Pine Forest in the Tâmega Valley (Modelação do Crescimento, Mortalidade e Distribuição Diamétrica, do Pinhal Bravo no Vale do Tâmega). Ph.D. Thesis, Universidade de Trás-os-Montes e Alto Douro, Vila Real, Portugal, 2004. [Google Scholar]
- Fonseca, T.F.; Parresol, B.; Marques, C.; de Coligny, F. Models to Implement a Sustainable Forest Management—An Overview of the ModisPinaster Model. In Sustainable Forest Management/Book 1; Martín, J.G., Diez Casero, J.J., Eds.; InTech-Open Access Publisher: London, UK, 2012; pp. 321–338. [Google Scholar]
- Fonseca, T.F.; Carneiro, S. Ferramentas de Apoio à Gestão de Pinhal-Bravo: Tabelas de Produção; Centro PINUS: Rio de Mouro, Portugal, 2019; p. 40. [Google Scholar]
- Cerveira, A.; Fonseca, T.; Mota, A.; Martins, I. An Integer Programming Model for the Management of a Forest in the North of Portugal. In Numerical Analysis Applied Mathematics ICNAAM 2011: International Conference on Numerical Analysis and Applied Mathematics; Simos, T.E., Psihoyios, G., Tsitouras, C., Anastassi, Z., Eds.; AIP: Melville, NY, USA, 2011; pp. 1890–1893. [Google Scholar]
- Fonseca, T.F.; Cerveira, A.; Mota, A. An integer programming model for a forest harvest problem with temporal and con-straints. For. Syst. 2012, 21, 272–283. [Google Scholar]
- Martins, I.; Cerveira, A.; Mota, A.; Bento, J.; Fonseca, T. Sustainable Management of a Northern Portugal Forest, Recent Re-searches in Environment, Energy Systems and Sustainability. In Proceedings of the 8th WSEAS International Conference on EEESD’12; Ramos, R.A.R., Straupe, I., Panagopoulos, T., Eds.; WSEAS Press: Algarve, Portugal, 2012; pp. 232–237. [Google Scholar]
- Cerveira, A.; Martins, I.; Mota, A.; Bento, J.; Fonseca, T.F. Otimização de Planos de Exploração Florestal em Baldios do Norte de Portugal. In Investigação Operacional em Ação—Casos de Aplicação; Oliveira, R.C., Ferreira, J.S., Eds.; Imprensa da Universidade de Coimbra: Coimbra, Portugal, 2014; pp. 17–56. [Google Scholar]
- Fonseca, T.F.; Lousada, J.L. Management of Maritime Pine: Energetic Potential with Alternative Silvicultural Guidelines. In Forest Biomass—From Trees to Energy; Gonçalves, C., Sousa, A., Malico, I., Eds.; InTech-Open Access Publisher: London, UK, 2021; pp. 71–86. [Google Scholar]
- Mota, A.A.R. Exploitation Plan for Pinus Pinaster Ait. In the Ribeira de Pena Forest Reserve, Barroso Forested Area (Plano de Exploração para Pinus Pinaster Ait. dos Baldios de Ribeira de Pena, Perimetro Florestal do Barroso). Master’s Thesis, Universidade de Trás-os-Montes e Alto Douro, Vila Real, Portugal, 2011. [Google Scholar]
- Costa, P. Decision Support Systems Applied to Sustainable Forest Management in Pinus Pinaster Ait. (Sistemas de Suporte à Decisão Aplicados à Gestão Florestal Sustentável em Povoamentos de Pinus Pinaster Ait.). Master’s Thesis, Universidade de Trás-os-Montes e Alto Douro, Vila Real, Portugal, 2017. [Google Scholar]
- Dufour-Kowalski, S.; Courbaud, B.; Dreyfus, P.; Meredieu, C.; de Coligny, F. Capsis: An open software framework and com-munity for forest growth modelling. Ann. For. Sci. 2012, 69, 221–233. [Google Scholar] [CrossRef]
- Luis, J.S.; Fonseca, T.F. The allometric model in the stand density management of Pinus pinaster in Portugal. Ann. For. Sci. 2004, 61, 807–814. [Google Scholar] [CrossRef] [Green Version]
- McDill, M.E.; Rebain, S.A.; Braze, J. Harvest scheduling with area-based adjacency constraints. For. Sci. 2002, 48, 631–642. [Google Scholar]
- Marušák, R.; Kašpar, J. Spatially-constrained harvest scheduling with respect to environmental requirements and silvicultural. For. J. 2015, 61, 71–77. [Google Scholar]
- Baskent, E.Z.; Borges, J.G.; Kašpar, J.; Tahri, M. A Design for Addressing Multiple Ecosystem Services in Forest Management Planning. Forests 2020, 11, 1108. [Google Scholar] [CrossRef]

| Variable | Min | Mean | Max | sd |
|---|---|---|---|---|
| A (ha) | 1.56 | 6.78 | 10.00 | 1.98 |
| t (yr) | 23 | 32.4 | 47 | 6.3 |
| N (trees·ha−1) | 339 | 706.8 | 1933 | 372 |
| G (m2·ha−1) | 24.9 | 37.3 | 58.5 | 8.0 |
| dg (cm) | 17.8 | 27.8 | 39.6 | 6.6 |
| ddom (cm) | 24.2 | 34.1 | 45.8 | 6.5 |
| hdom (m) | 12.2 | 17.5 | 22.5 | 3.0 |
| Model | Constraints Characterization | Equations |
|---|---|---|
| FMO |
| (1)–(10) |
| FMO_FA |
| (1)–(14) |
| FMO_CA |
| (1)–(13), (15)–(19) |
| FMO_RV |
| (1)–(10), (20), (21), |
| FMO_all |
| (1)–(21) |
| Variable | FMO | FMO_all | ||
|---|---|---|---|---|
| Sc1 | Sc2 | Sc1 | Sc2 | |
| n | 47 | 18 | 40 | 25 |
| A (ha) | 311.17 | 127.7 | 274.59 | 164.28 |
| vol-cc (m3) | 202,194.48 | 59,854.26 | 176,507.45 | 76,647.58 |
| vol-th (m3) | 12,095.06 | 39,070.38 | 3362.04 | 44,200.70 |
| Total vol. (m3) | 313,214.18 | 300,717.773 | ||
| Final avg. age (yr) | 18.61 | 20.79 | ||
| 5-Years Period | Sc1 | Sc2 | ||||||
|---|---|---|---|---|---|---|---|---|
| Cc | Th | Cc | Th | |||||
| n | A (ha) | n | A (ha) | n | A (ha) | n | A (ha) | |
| 1 | 4 | 30.45 | 3 | 19.62 | 3 | 20.85 | ||
| 2 | 13 | 88.68 | 6 | 35.46 | 13 | 88.98 | ||
| 3 | 29 | 185.95 | 2 | 11.83 | ||||
| 4 | 1 | 6.09 | 11 | 77.93 | 4 | 28.45 | ||
| 5 | 6 | 40.28 | ||||||
| 6 | 4 | 30.45 | 1 | 9.49 | ||||
| 7 | 13 | 88.68 | ||||||
| 8 | 29 | 185.95 | ||||||
| 9 | 1 | 6.09 | ||||||
| 10 | 9 | 68.95 | ||||||
| 5-Years Period | Sc1 | Sc2 | ||||||
|---|---|---|---|---|---|---|---|---|
| Cc | Th | Cc | Th | |||||
| n | A (ha) | n | A (ha) | n | A (ha) | n | A (ha) | |
| 1 | 11 | 77.17 | 2 | 14.89 | 5 | 32.75 | ||
| 2 | 12 | 83.72 | 16 | 104.28 | ||||
| 3 | 14 | 92.75 | 8 | 45.17 | 2 | 11.83 | ||
| 4 | 3 | 20.95 | 8 | 53.63 | 5 | 35.02 | ||
| 5 | 8 | 55.99 | ||||||
| 6 | 11 | 77.17 | 1 | 9.49 | ||||
| 7 | 12 | 83.72 | ||||||
| 8 | 14 | 92.75 | ||||||
| 9 | 3 | 20.95 | 2 | 15.97 | ||||
| 10 | 10 | 60.17 | ||||||
Publisher’s Note: MDPI stays neutral with regard to jurisdictional claims in published maps and institutional affiliations. |
© 2021 by the authors. Licensee MDPI, Basel, Switzerland. This article is an open access article distributed under the terms and conditions of the Creative Commons Attribution (CC BY) license (https://creativecommons.org/licenses/by/4.0/).
Share and Cite
Costa, P.; Cerveira, A.; Kašpar, J.; Marušák, R.; Fonseca, T.F. Forest Management of Pinus pinaster Ait. in Unbalanced Forest Structures Arising from Disturbances—A Framework Proposal of Decision Support Systems (DSS). Forests 2021, 12, 1031. https://doi.org/10.3390/f12081031
Costa P, Cerveira A, Kašpar J, Marušák R, Fonseca TF. Forest Management of Pinus pinaster Ait. in Unbalanced Forest Structures Arising from Disturbances—A Framework Proposal of Decision Support Systems (DSS). Forests. 2021; 12(8):1031. https://doi.org/10.3390/f12081031
Chicago/Turabian StyleCosta, Paulo, Adelaide Cerveira, Jan Kašpar, Robert Marušák, and Teresa Fidalgo Fonseca. 2021. "Forest Management of Pinus pinaster Ait. in Unbalanced Forest Structures Arising from Disturbances—A Framework Proposal of Decision Support Systems (DSS)" Forests 12, no. 8: 1031. https://doi.org/10.3390/f12081031
APA StyleCosta, P., Cerveira, A., Kašpar, J., Marušák, R., & Fonseca, T. F. (2021). Forest Management of Pinus pinaster Ait. in Unbalanced Forest Structures Arising from Disturbances—A Framework Proposal of Decision Support Systems (DSS). Forests, 12(8), 1031. https://doi.org/10.3390/f12081031