Article

Evaluation of Soda Lignin from Wheat Straw/Sarkanda Grass as a Potential Future Consolidant for Archaeological Wood

by
Jeannette J. Łucejko
1,2,
Anne de Lamotte
1,
Fabrizio Andriulo
1,
Hartmut Kutzke
1,
Stephen Harding
1,3,
Mary Phillips-Jones
1,3,
Francesca Modugno
1,2,
Ted M. Slaghek
1,4,
Richard J. A. Gosselink
1,4 and
Susan Braovac
1,*
1
Museum of Cultural History, University of Oslo, PB 6762 St. Olavs Plass, 0130 Oslo, Norway
2
Department of Chemistry, University of Pisa, Via G. Moruzzi 13, 56124 Pisa, Italy
3
National Centre for Macromolecular Hydrodynamics (NCMH), School of Biosciences, University of Nottingham, Sutton Bonington LE12 5RD, UK
4
Wageningen Food & Biobased Research, Bornse Weilanden 9, 6708WG Wageningen, The Netherlands
*
Author to whom correspondence should be addressed.
Forests 2021, 12(7), 911; https://doi.org/10.3390/f12070911
Submission received: 6 June 2021 / Revised: 9 July 2021 / Accepted: 9 July 2021 / Published: 13 July 2021
(This article belongs to the Special Issue Historical Wood: Structure, Properties and Conservation)

Abstract

:
This work is part of a larger study, which aims to use soda lignin from straw as the starting point for a non-aqueous consolidant for highly degraded archaeological wood from the Oseberg collection. This wood was treated with alum salts in the early 1900s, is actively degrading and exists in varying states of preservation. Non-aqueous consolidants are an option to stabilize this wood mechanically in cases where it is too deteriorated to undergo aqueous-based retreatments, for example using polyethylene glycol. The aim of this study was to compare the extent of penetration of two soda lignin preparations in low- to medium-degraded archaeological pine. The soda lignins were dissolved in ethyl acetate and had two molecular weight groups: P1000 (molecular weight Mw of~3 kDa) and the ethyl acetate fraction FB01 (Mw of ~1 kDa). Penetration after immersion was evaluated by infrared spectroscopy and analytical pyrolysis. Treated specimens were also evaluated using weight and dimensional change and scanning electron microscopy. Both lignins penetrated into sample cores, but P1000 did not penetrate as well as FB01. This may be due to differences in their molecular weights, but also differences in polarity due to the presence of different functional groups.

1. Introduction

From the mid-1800s to ca 1950-60s, alum salts (either pure KAl(SO4)2·12 H2O or mixtures with NH4Al(SO4)2·12H2O) were used to treat highly deteriorated archaeological waterlogged wood before drying to prevent their destruction [1,2,3,4,5]. However, this method is now known to cause chemical deterioration due to the presence of sulphuric acid in the wood [6,7,8]. The sulphuric acid was generated during the alum treatment and absorbed by the wood [9]. Due to the absorbed sulphuric acid, the pH of alum-treated wood is very low, ranging from 0 to 3.5, and high acidity is considered to be the main reason for the observed deterioration. Aluminium salts (aluminium chlorate, aluminium sulphate) have been reported to catalyse the degradation processes of polysaccharides [10,11,12]. Evidence of aluminium-catalysed hydrolysis of cellulose in paper treated with aluminium salts has also been found [13,14,15]. Generally, alum-treated wood has a highly degraded holocellulose fraction and an altered, partially depolymerized lignin structure [16]. To preserve alum-treated wood for future generations, the main strategy is to reconserve it [17,18,19]. The general approach has relied on an aqueous method, where re-immersion in water removes alum salts and acidic products. The wood is then strengthened by impregnation with PEG 2000 or 3000 and, finally, freeze-dried. This produces a wood with pH of ca 5, which is strong enough for ‘museum use’, such as study and display.
A significant proportion of the wooden objects from the Viking Age Oseberg burial finds have been treated with alum salts from 1905 to ca 1912–1913 [4,20]. Aqueous retreatment is suitable for some of these objects, but for others, the wood would risk irreparable damage if reconserved using the PEG freeze-dry method. This is because wooden objects may now be too deteriorated to withstand immersion in water or have previous damage from this treatment, which includes deep cracks, voids and collapse that would make an object fall apart if re-immersed. Furthermore, many of the objects have been restored using glue, plaster fills, new wood and metal hardware (screws, pins, iron bars, etc.) [21]. These objects also may have features that may be damaged during immersion or freeze-drying, such as fine surface carvings and tool marks. For such objects, we must find alternative retreatment strategies that are not water-based. The research project Saving Oseberg (2015–2020) was established to carry out investigations for this purpose.
This consideration has led us to try different types of non-aqueous consolidants, either commercially bought or developed within the Saving Oseberg project. One of the potential consolidants under investigation is based on lignin. Lignin is a major side product from the pulp and paper industry, which has high potential for further use. As it is a biopolymer derived from plants, it has relevant properties to potentially act as a consolidant for archaeological wood preservation. These include its binding and antimicrobial properties as well as its relative hydrophobicity compared to cellulose [22,23,24,25].
A soda lignin from mixed wheat straw/Sarkanda grass (P1000) was selected as a non-sulphur containing technical lignin, which is commercially available [22,26]. As the molar mass distribution could be a limiting factor for impregnation into the core of the wood, an ethyl acetate-fraction from the soda lignin was also studied [27].
The main aim of this work was to determine eventual differences in extent of penetration of the two lignins in archaeological wood after immersion in non-aqueous solutions using ethyl acetate as the solvent.
Methods used to evaluate penetration include pyrolysis gas-chromatography/mass spectrometry (Py-GC/MS) and attenuated total reflectance Fourier transform infrared spectroscopy (ATR-FTIR). We also investigated cellular morphology after treatment using scanning electron microscopy (SEM).

2. Materials and Methods

2.1. Wood Specimens

Discarded archaeological wood (identified as pine by light microscopy) recently excavated from Medieval Oslo in 2018 were donated from NIKU (Norsk institutt for kulturminneforskning). This was received as logs with diameter of ca 30 cm. The outermost 10 cm were more degraded than wood deeper below the surface. They were received in the waterlogged state and shortly afterwards were cut into 2 × 2 × 2 cm3 cubes and freeze-dried. Specimens contained heartwood, sapwood or both. The cubes were then acclimatized to 50% RH and 20 °C.
A total of 23 archaeological specimens were chosen for these experiments: 13 for impregnation and 5 for density and maximum moisture content measurements (Table 1). Due to the variability in wood condition, both well-preserved and less well-preserved wood were mixed for each group. Sound pine was used as reference wood for density measurements (6 specimens) relative to 50% RH, 20 °C, as well as for ATR-FTIR, Py-GC/MS and SEM analyses.

2.2. Density and Maximum Moisture Content Measurements

For density and maximum moisture content measurements, 5 archaeological cubes were re-waterlogged (specimens 52–56) by submerging cubes in water under low vacuum pressure. After waterlogging, the specimens were weighed, and their volumes were measured by water displacement. After measurements, the specimens were oven-dried to constant weight (105 °C). The basic density was calculated by dividing the oven-dried weight by the waterlogged volume. For specimens acclimatized to 50% RH and 20 °C (specimens 47–51 and sound pine, specimens 60, 70, 80, 90, 99, 100), density was based on the weight at 50% RH and volume based on direct measurement.

2.3. Materials Used for Impregnation

A commercially available soda lignin from mixed wheat straw/Sarkanda grass (P1000) was obtained from GreenValue (US/India). Lignin isolation by the soda method is described by Browning [28]. A lower molar mass fraction (FB01) was obtained by fractionating P1000 in ethyl acetate, using the procedure described by Gosselink, Putten and Van Es [27]. After collection of the solubilized lignin in ethyl acetate, the solvent was removed by rotary evaporation under reduced pressure. The recovered lignin fraction (FB01) was finally dried at 30 °C.
Chemical composition of both P1000 and FB01 were determined using wet chemical methods, where the lignin content was determined after a two-step hydrolysis as Klason lignin, the acid-insoluble fraction (AIL) and acid-soluble lignin (ASL). The carbohydrates were quantified by high performance anion exchange chromatography with pulsed amperometric detection (HPAEC-PAD) in the hydrolysate as previously described by Gosselink, van Dam, de Jong, Scott, Sanders, Li and Gellerstedt [29]. P1000 contained 83.5% AIL, 4.8% ASL, 1.9% Ash and 2.8% carbohydrates. FB01 contained 76.5% AIL, 5.8% ASL and 0.4% carbohydrates.
The chemical composition of P1000 and FB01 was also determined by Py-GC/MS in order to be able to properly evaluate the results obtained for the specimens after treatment. The results of this analysis are presented in Supplementary Materials, while the pyrolysis products deriving exclusively from these lignins have been highlighted in red in Table 2.
P1000 has a (weight average) molecular weight Mw of (3.0 ± 0.1) kDa, and FB01 has an Mw of (1.0 + 0.1) kDa as characterized by sedimentation equilibrium in the analytical ultracentrifuge reinforced by size exclusion chromatography measurements, which determined 2242 Daltons for P1000 and 1272 Daltons for FB01 [30]. Both lignin preparations had oblate disc-like conformations [30].
Ethyl acetate was purchased from Sigma-Aldrich.

2.4. Impregnation Set-Up

The investigation presented here was part of a larger study which involved more specimens, treated at different lignin concentrations (5%, 10% and 30%). The data obtained for concentrations lower than 30% were less clear both from the point of view of penetration and deposition. This led to the final choice of a 30% solution of lignin preparation.
Table 1 gives an overview of the impregnation systems used here and which analytical methods were used on each specimen.
Pre-immersion: wood specimens were saturated with ethyl acetate.
Impregnation: After solvent saturation, the specimens were immersed in 30% (weight/volume) concentrations of each lignin, made up to 100 mL using volumetric flasks. Immersion took place under normal atmospheric pressure. The lignin concentration is only approximate, as we did not know the exact solubility of lignin in ethyl acetate, and there was undissolved lignin residue in the volumetric flask.
There were four specimens tested for each lignin preparation. Five control specimens were immersed in ethyl acetate only (specimens 37–41). Five specimens remained completely untreated (specimens 47–51) and were stored in a climate chamber set to 50% RH and 20 °C.
Immersion time was two weeks, as previous experience has shown that the specimen size used here allows for full penetration of archaeological wood using polyethylene glycol (PEG 2000).
Drying: After removal from lignin solutions, the specimens were slowly air-dried for four days before they were placed in a climate chamber at 50% RH and 20 °C. Drying was monitored by weight change. Constant weight was reached after 21 days at 50% RH and 20 °C.
Before and after treatment, photographs were taken of each treatment group.

2.5. Change in Dimensions and Weight

Dimensions after each step of the treatment (dry state, after solvent saturation, after lignin impregnation and after drying) were measured based on reference pins placed into the cross-section of the wood in both radial and tangential orientations. Here, we report dimensions before and after treatment only. Dimensional changes in treated woods after acclimatization to 50% RH and 20 °C were compared against that measured at the start, when wood was dry, yet acclimatized to 50% RH and 20 °C. Equation (1) shows how % linear dimensional change was calculated.
%   linear   dimensional   change   = Dimension   After Rad   or   Tan Dimension   Before Rad   or   Tan Dimension   Before Rad   or   Tan × 100 %
Weight was measured using a 4-decimal balance before treatment, after each treatment step mentioned above as well as after acclimatization at 50% RH and 20 °C. Note, however, that weights measured in the ‘wet’ state are not reported here, as they were only valid to 1–2 decimal places due to the rapid evaporation of ethyl acetate during weighing.

2.6. Chemical Characterization and Distribution

After treatment, penetration and distribution of polymers within wood cells was assessed by weight gain, by SEM, PY-GC/MS and by ATR-FTIR.
Morphological analyses of cross-sections of selected specimens were undertaken by scanning electron microscopy (SEM).

2.6.1. SEM

Morphological analyses were performed using a FEI Quanta 450 Scanning Electron Microscope, using low vacuum mode to avoid charging and a voltage of 8 kV. The spot size was 4.5–5, chamber pressure 90–100 Pa, and the working distance between detector and sample was 10–13mm, depending on the sample.

2.6.2. ATR-FTIR

Fourier transform infrared spectroscopy of untreated and treated archaeological pine and reference samples (sound pine and pure lignins) were carried out in the attenuated total reflection (ATR) mode on a Thermo Fischer FTIR spectrometer (Nicolet iS50), with range 4000–400 cm−1. Each spectrum was acquired with 32 scans and 4 cm−1 resolution. Three spectra were taken of each sample and averaged. For each specimen, infrared spectra were taken at four depths: outer surface, inner surface (the underside of the surface sample), core edge and core centre (Figure 1). Averaged spectra at each depth were baseline corrected and normalized to the band maximum in the range 1027–1032 cm−1. To assess the extent of penetration of P1000 and FB01 lignins in archaeological wood, spectral band heights were then measured at ca 1328 cm−1 at each depth for each treated specimen. Band heights from the same depth for each treatment group were then averaged. For example, for P1000 lignin, all ‘outer surface’ spectra were averaged. This was repeated for each depth analysed, for each P1000 and FB01 lignin treatments.

2.6.3. Analytical Pyrolysis Py-GC/MS

Analytical pyrolysis was performed at 550 °C for 0.2 min in the presence of 1,1,1,3,3,3-hexamethyldisilazane (HMDS, chemical purity 99.9%, Sigma Aldrich Inc., St. Louis, MO, USA) for the thermally assisted silylation of pyrolysis products. A micro-furnace of Multi-Shot Pyrolyzer EGA/Py-3030D (Frontier Lab) was coupled to a gas chromatograph 6890 Agilent Technologies (USA) equipped with an HP-5MS fused silica capillary column (stationary phase 5% diphenyl—95% dimethyl-polysiloxane, 30 m × 0.25 mm i.d., Hewlett Packard, USA) and with a deactivated silica pre-column (2 m × 0.32 mmi.d., Agilent J&W, USA). The GC was coupled with an Agilent 5973 Mass Selective Detector operating in electron impact mode (EI) at 70 eV. Approximately 80 μg of sample and 2 μL HMDS were inserted into a stainless steel cup and placed in the micro-furnace. Before analysis, all the samples were oven-dried for 24 h at 40–50 °C to remove residual water. Samples were analysed in triplicate.
Ninety-one pyrolysis products were identified by comparing their mass spectra with spectra reported in the Wiley and NIST08 libraries and in the literature [31,32] and reported in Table 2. Deconvolution and integration of chromatographic peaks derived from lignin and holocellulose pyrolysis products were carried out by AMDIS software (automated mass spectral deconvolution and identification system by NIST). Semi-quantitative calculations were performed using chromatographic areas: peak areas were normalised with respect to the sum of the peak areas of all the pyrolysis products identified, and the data were averaged and expressed as percentages. The percentage areas were used to calculate the relative abundances of wood pyrolysis products divided into categories on the base of their chemical structure as described in [33]. Lignin pyrolysis products were sorted into six groups: monomers, long chain, short chain, demethylated, carbonyl and acid, while holocellulose pyrolysis products into five categories: furans, cyclopentenones, pyranones, hydroxybenzenes and anhydrosugars.
Samples analysed by Py-GC/MS were taken from the ‘inner surface’ and ‘core centre’, as shown in Figure 1.

3. Results and Discussion

3.1. Characterization of Wood Specimens before Treatment

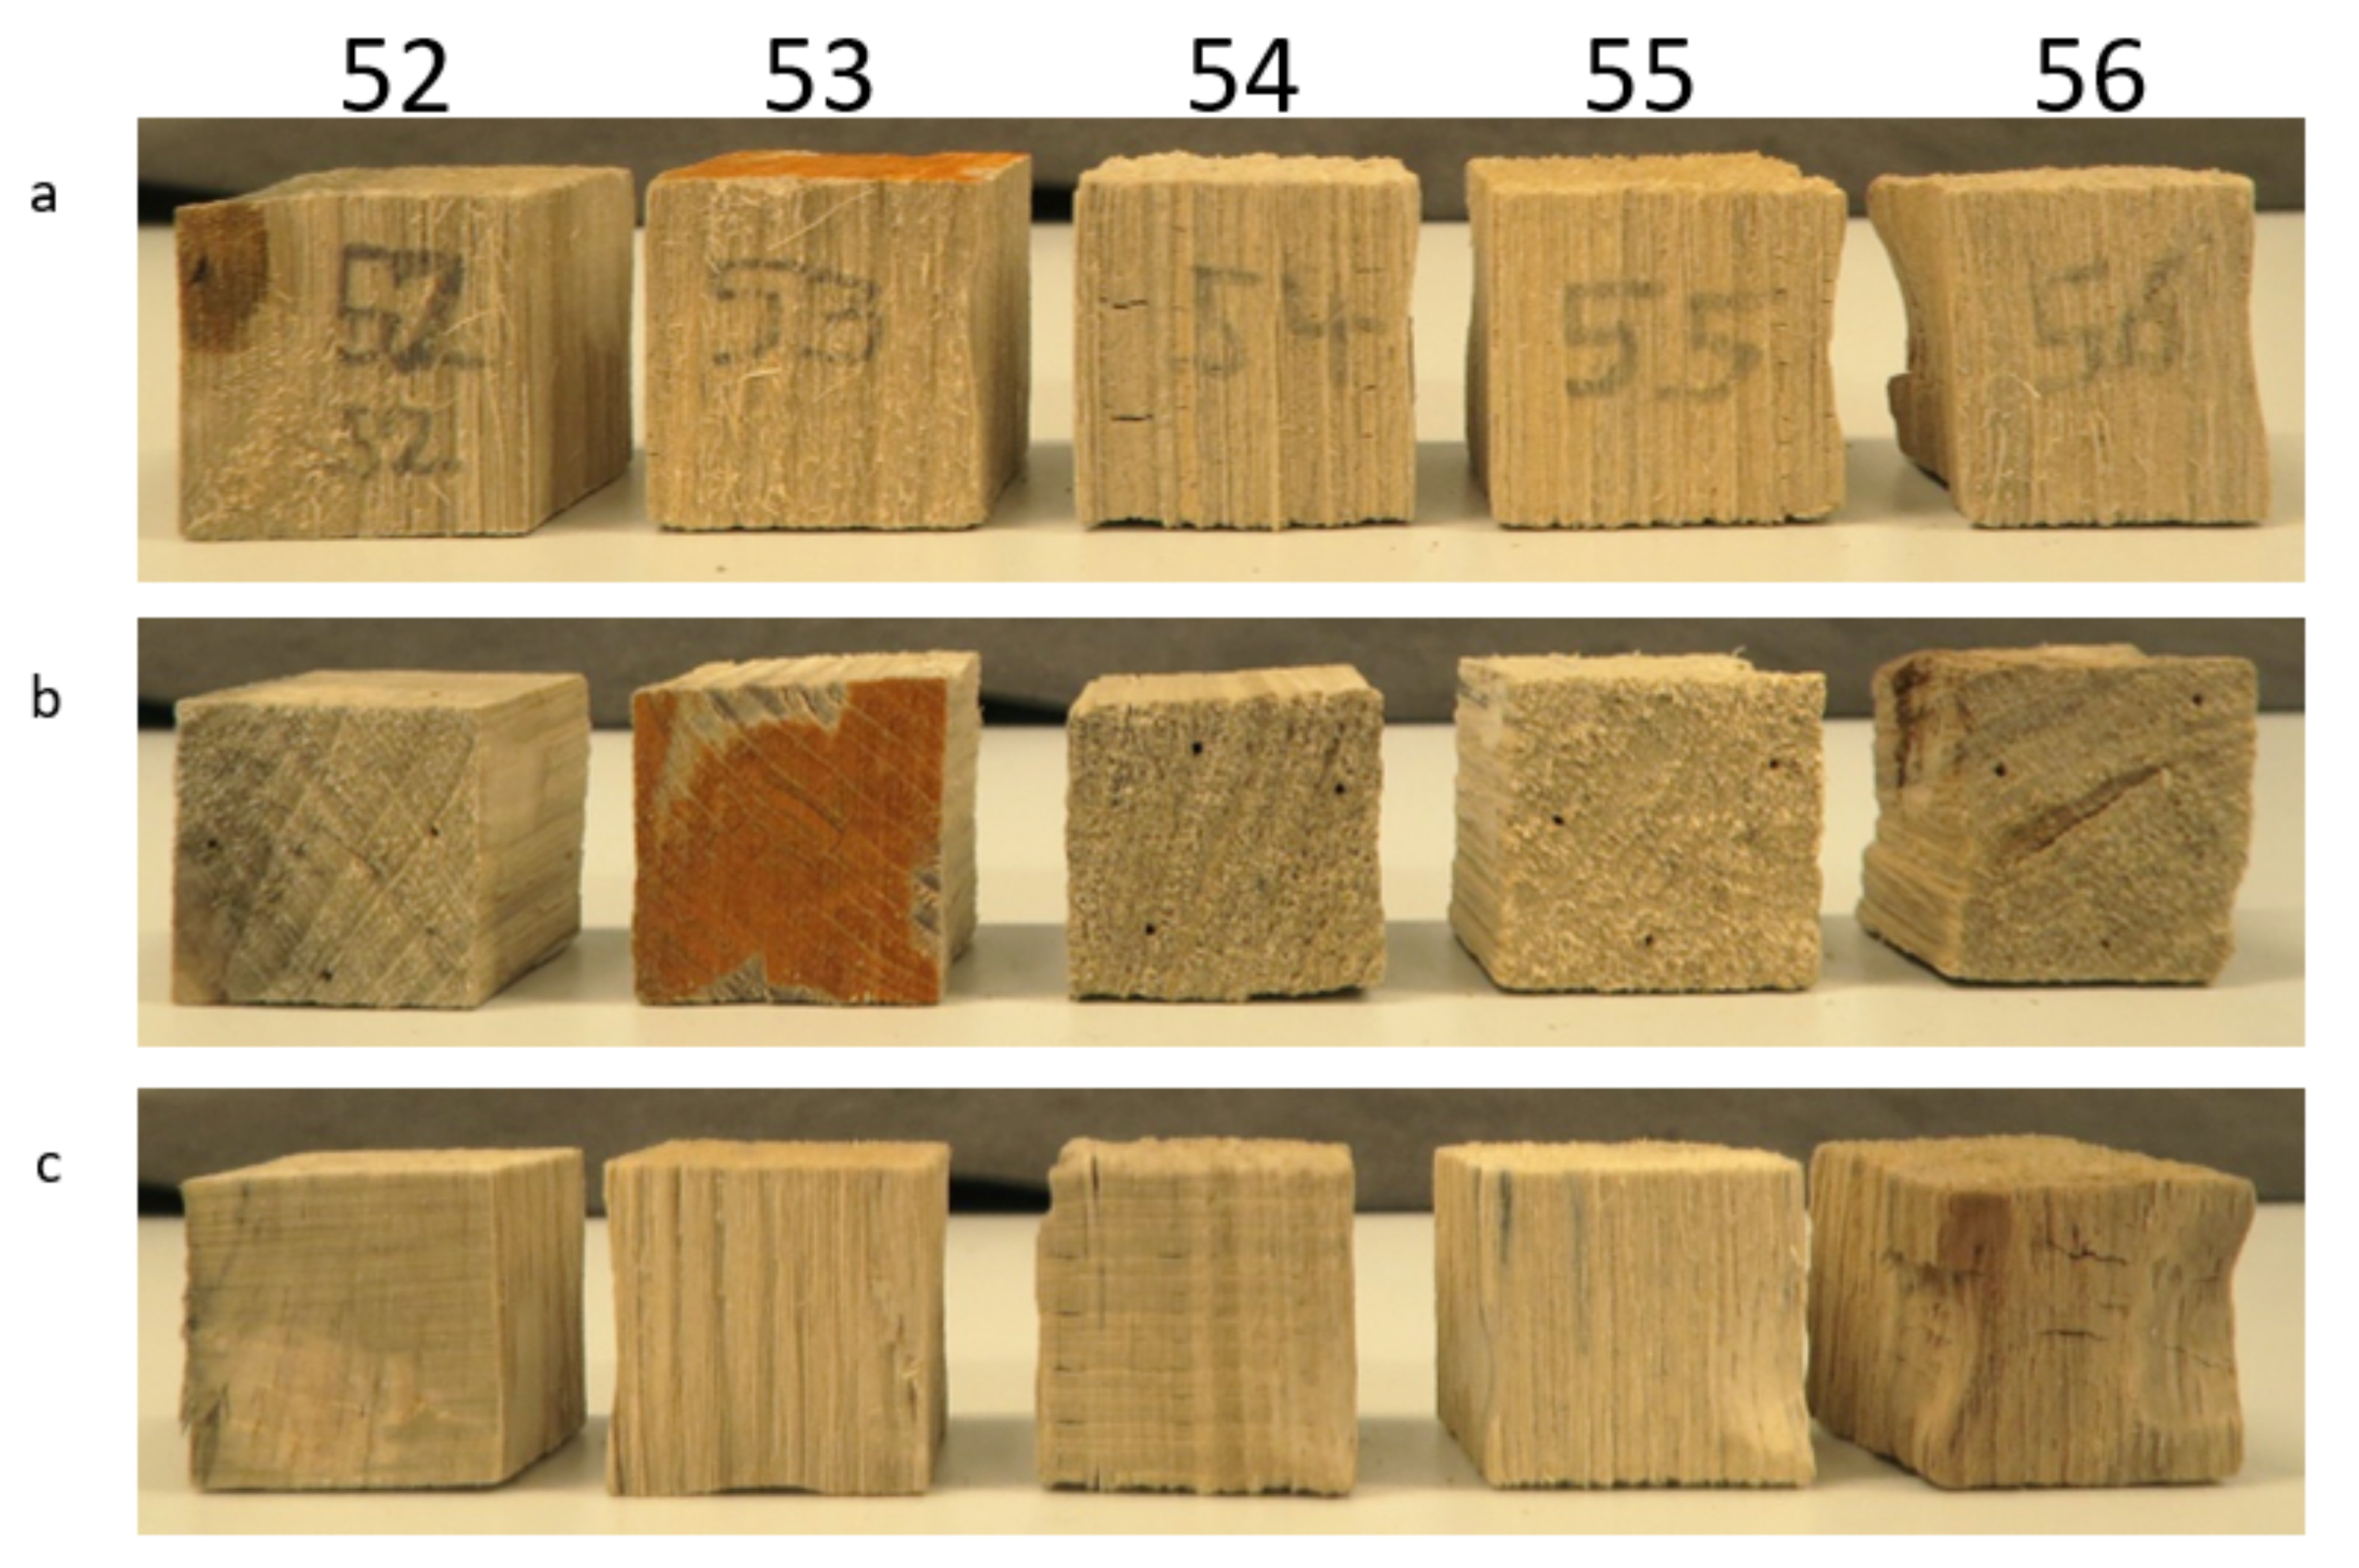
3.1.1. Macroscopic Observations

Annual rings were not perfectly aligned with cut faces. Specimens were composed of both well-preserved and more degraded wood, related to where they originated from the log. Some specimens contained defects, such as knots and cracks (Figure 2). It is very difficult to obtain flawless sampling material from archaeological wood.

3.1.2. Density and Maximum Moisture Content

The basic density of archaeological specimens (52–56) showed a variation in the state of preservation of the archaeological wood, ranging from 0.210 g/cm3 to 0.443 g/cm3 (Table 3). Specimens 52 and 53 were much better preserved than specimens 54, 55 and 56. For comparison, sound pine has a density of about 0.5 g/cm3, based on our own measurements of oven-dried sound pine. The maximum moisture content of the archaeological specimens ranged from 140–410%. The wood specimens may, thus, be considered to be low (52, 53) to medium degraded (54, 55, 56), see for example Grattan and Clarke [34]. This variation in condition is common in archaeological wood, due to uneven degradation in the soil. As degradation during burial proceeds from the surface to the inner core, surfaces are generally more degraded than cores.
The density of freeze-dried archaeological pine specimens (47–51) acclimatized to 50% RH and 20 °C were also measured (Table 3). Again, there are relatively large differences in densities among archaeological wood specimens (range: 0.237–0.381 g/cm3). Specimens 49 and 51 are best preserved.

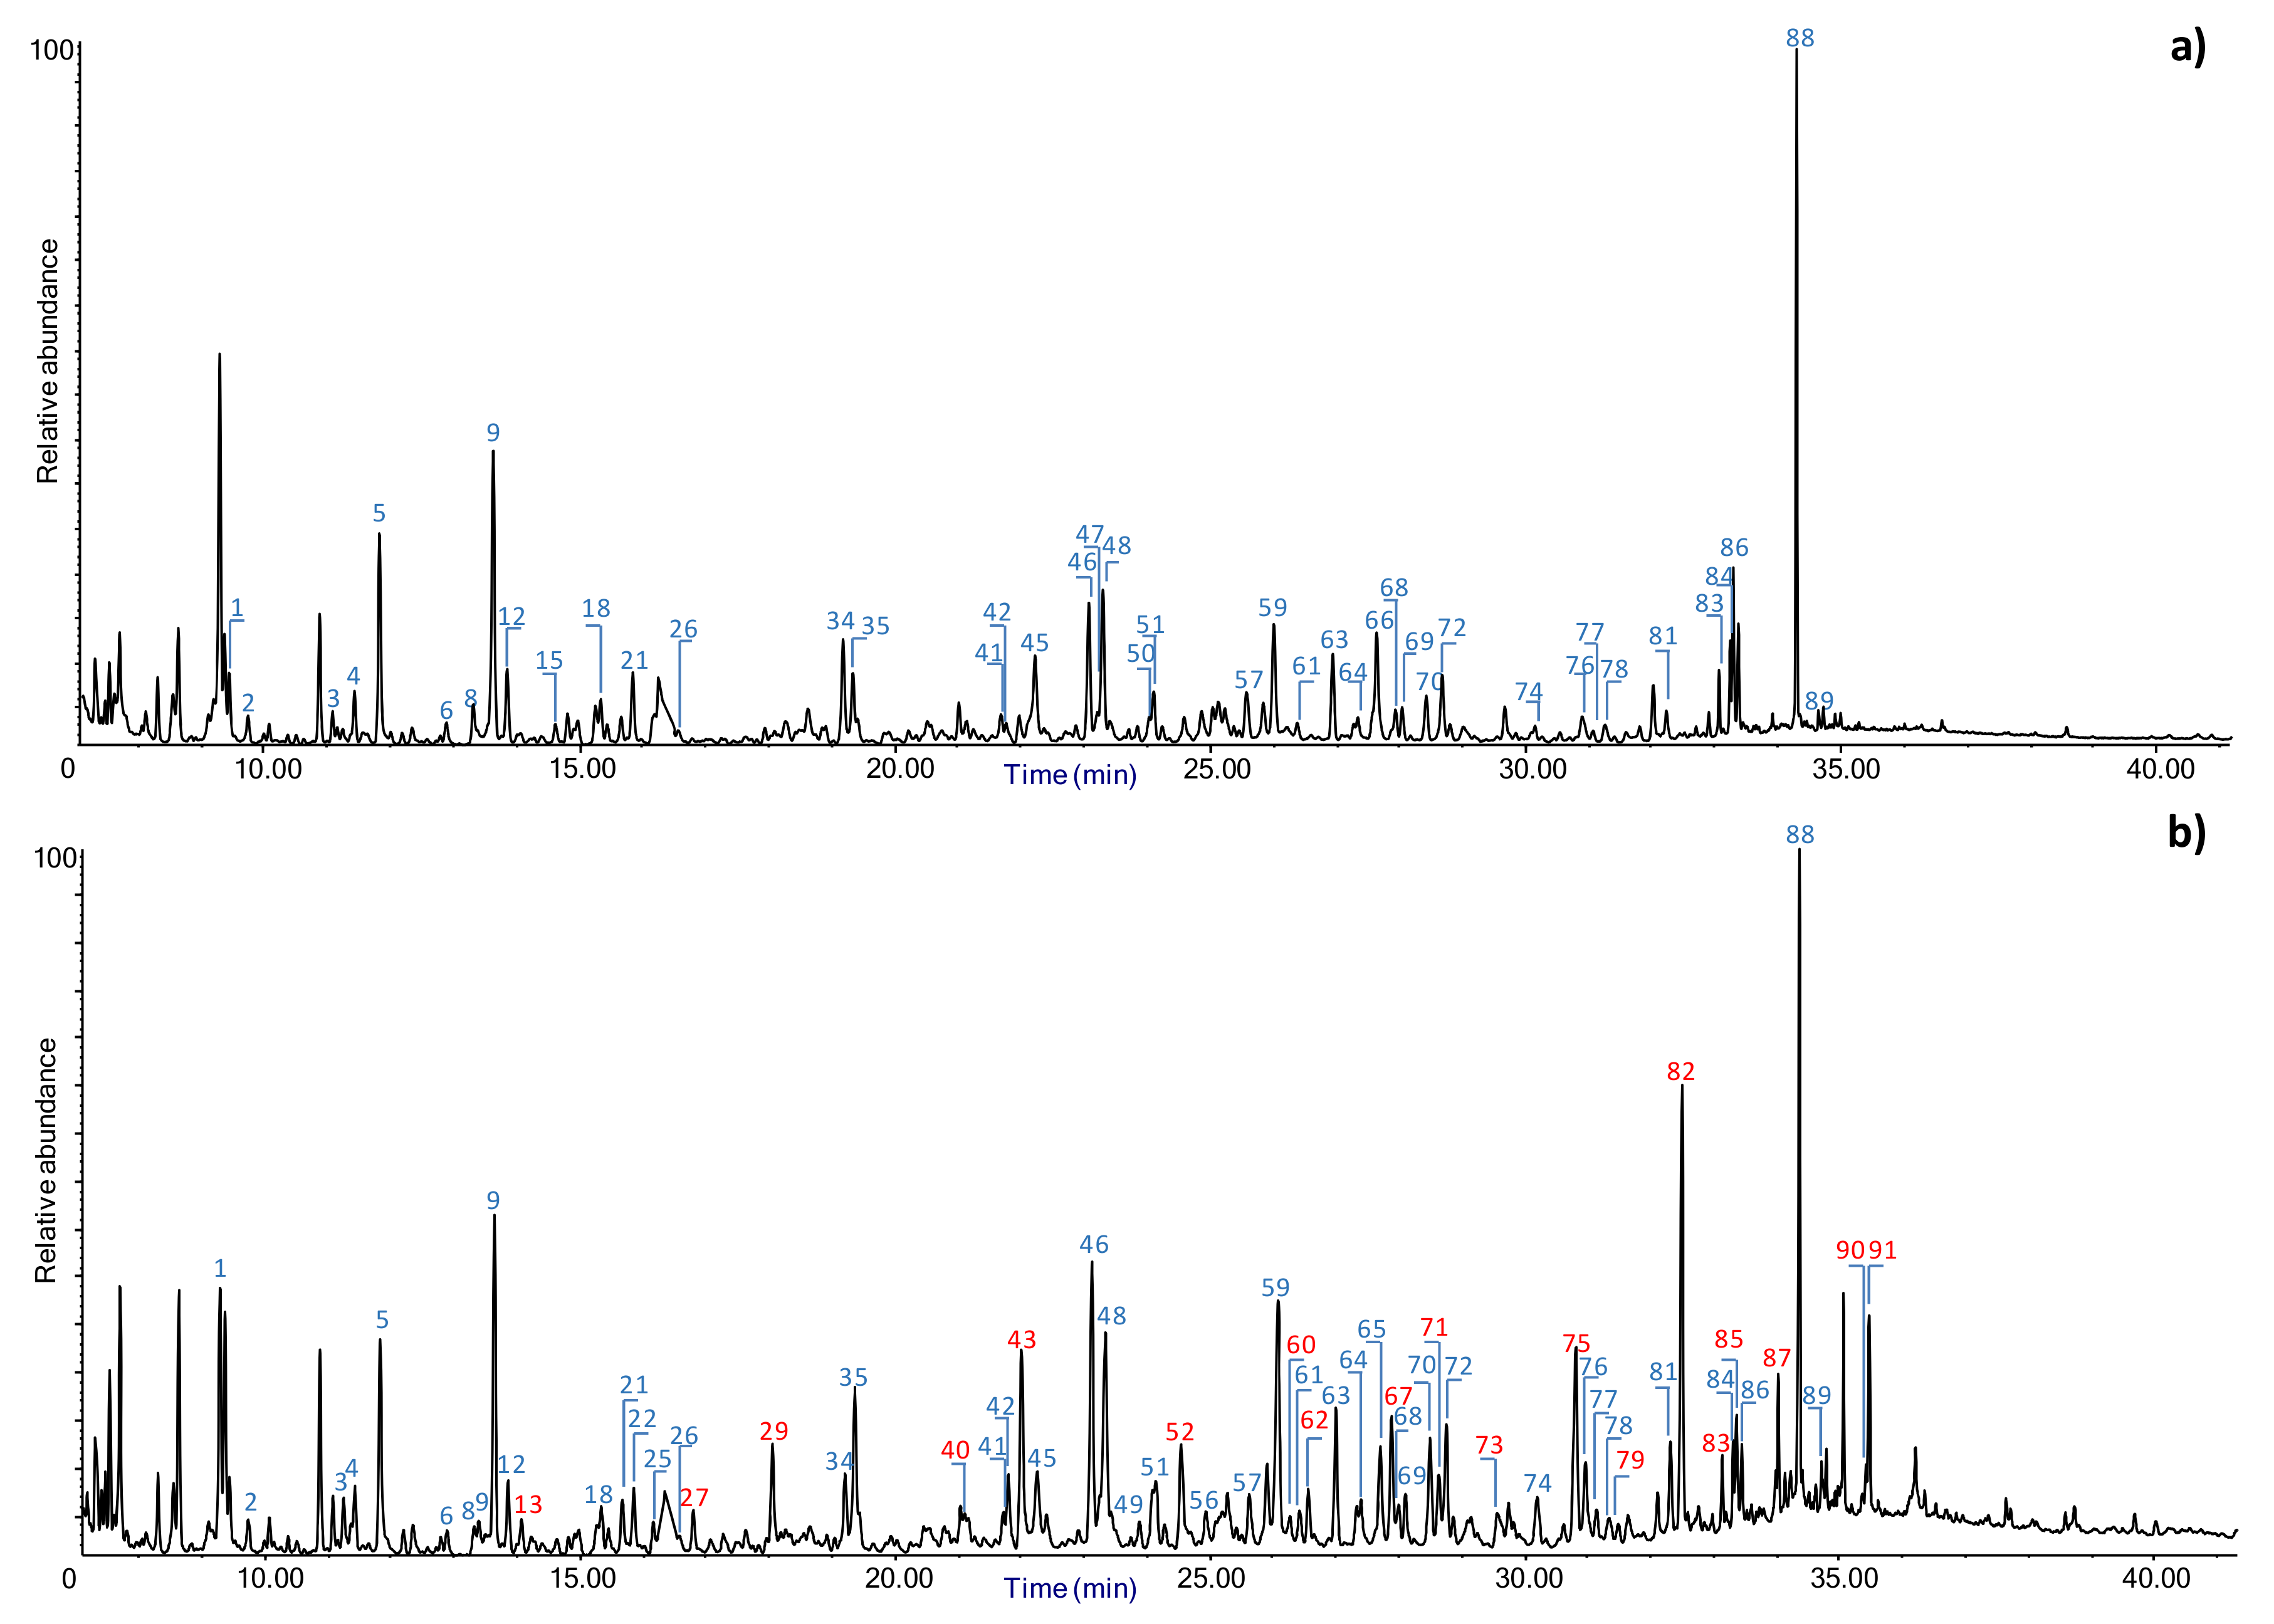
3.1.3. Analytical Pyrolysis (Py-GC/MS)

Sound untreated pine, archaeological untreated pine and archaeological wood immersed in ethyl acetate are considered reference specimens. Seventy-four pyrolysis products deriving from holocellulose and lignin were identified and their peaks integrated. Pine is a conifer, and its lignin is mainly composed of guaiacyl units. The semi-quantitative analysis results show that the archaeological pine is composed of about 50% of polysaccharides and 50% of lignin (Table 4), showing that it is well preserved when compared with undegraded reference sound wood.
As expected, the polysaccharide fraction in the archaeological specimen is preferentially degraded, resulting in H/L indices lower than those of fresh wood. Differences between specimens of untreated and solvent-treated archaeological woods (47 and 37, respectively), are also apparent, demonstrating not only the heterogeneity of the wood specimens, likely related to variability in the initial state of preservation but also the extractive capacity of the solvent. According to polysaccharide content, nr. 37 is not as well preserved as nr. 47. Further details of reference specimens are given in the Supplementary Materials.

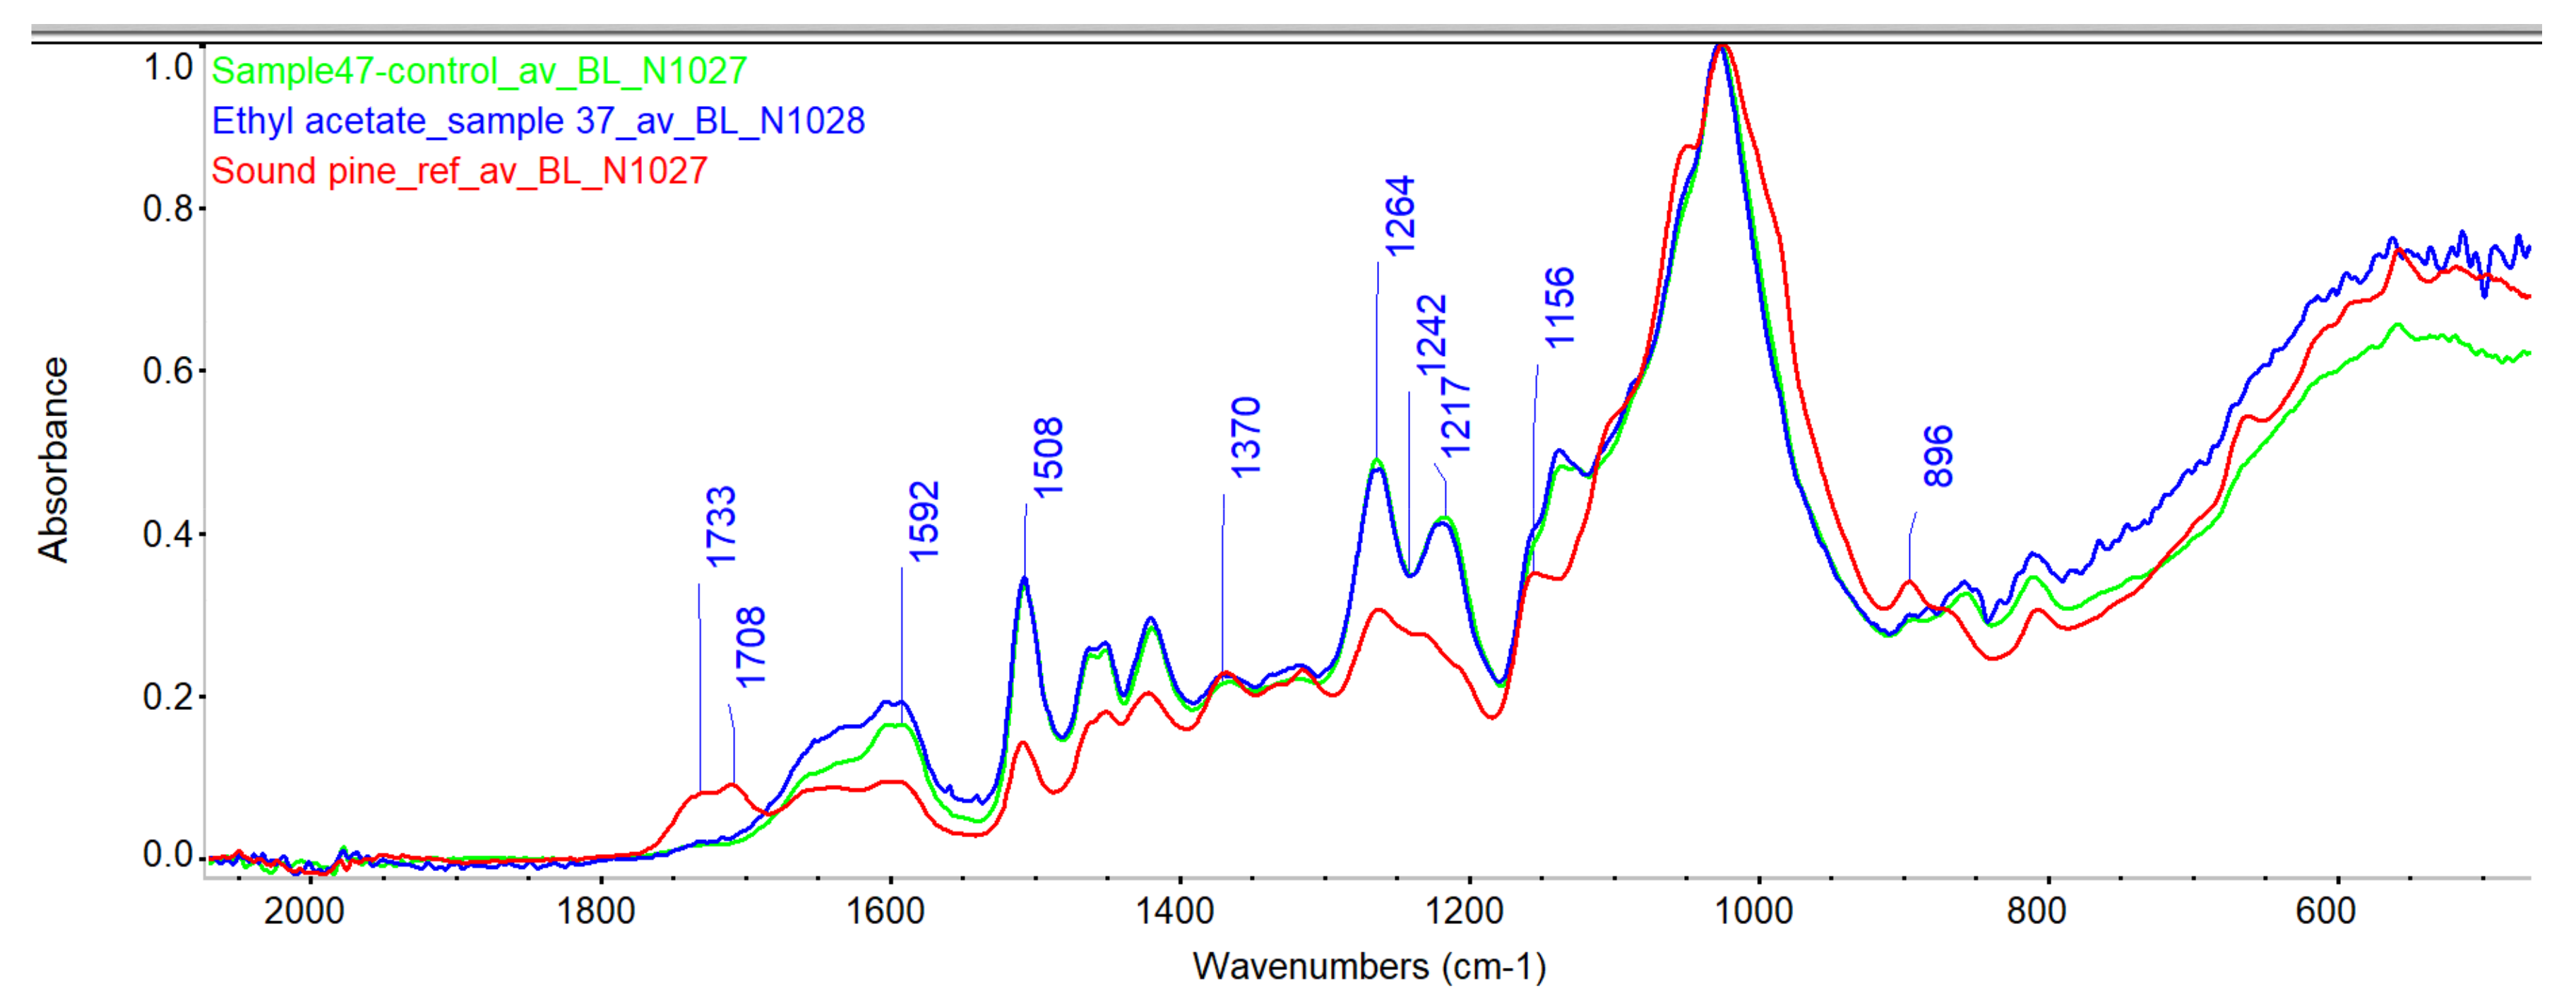
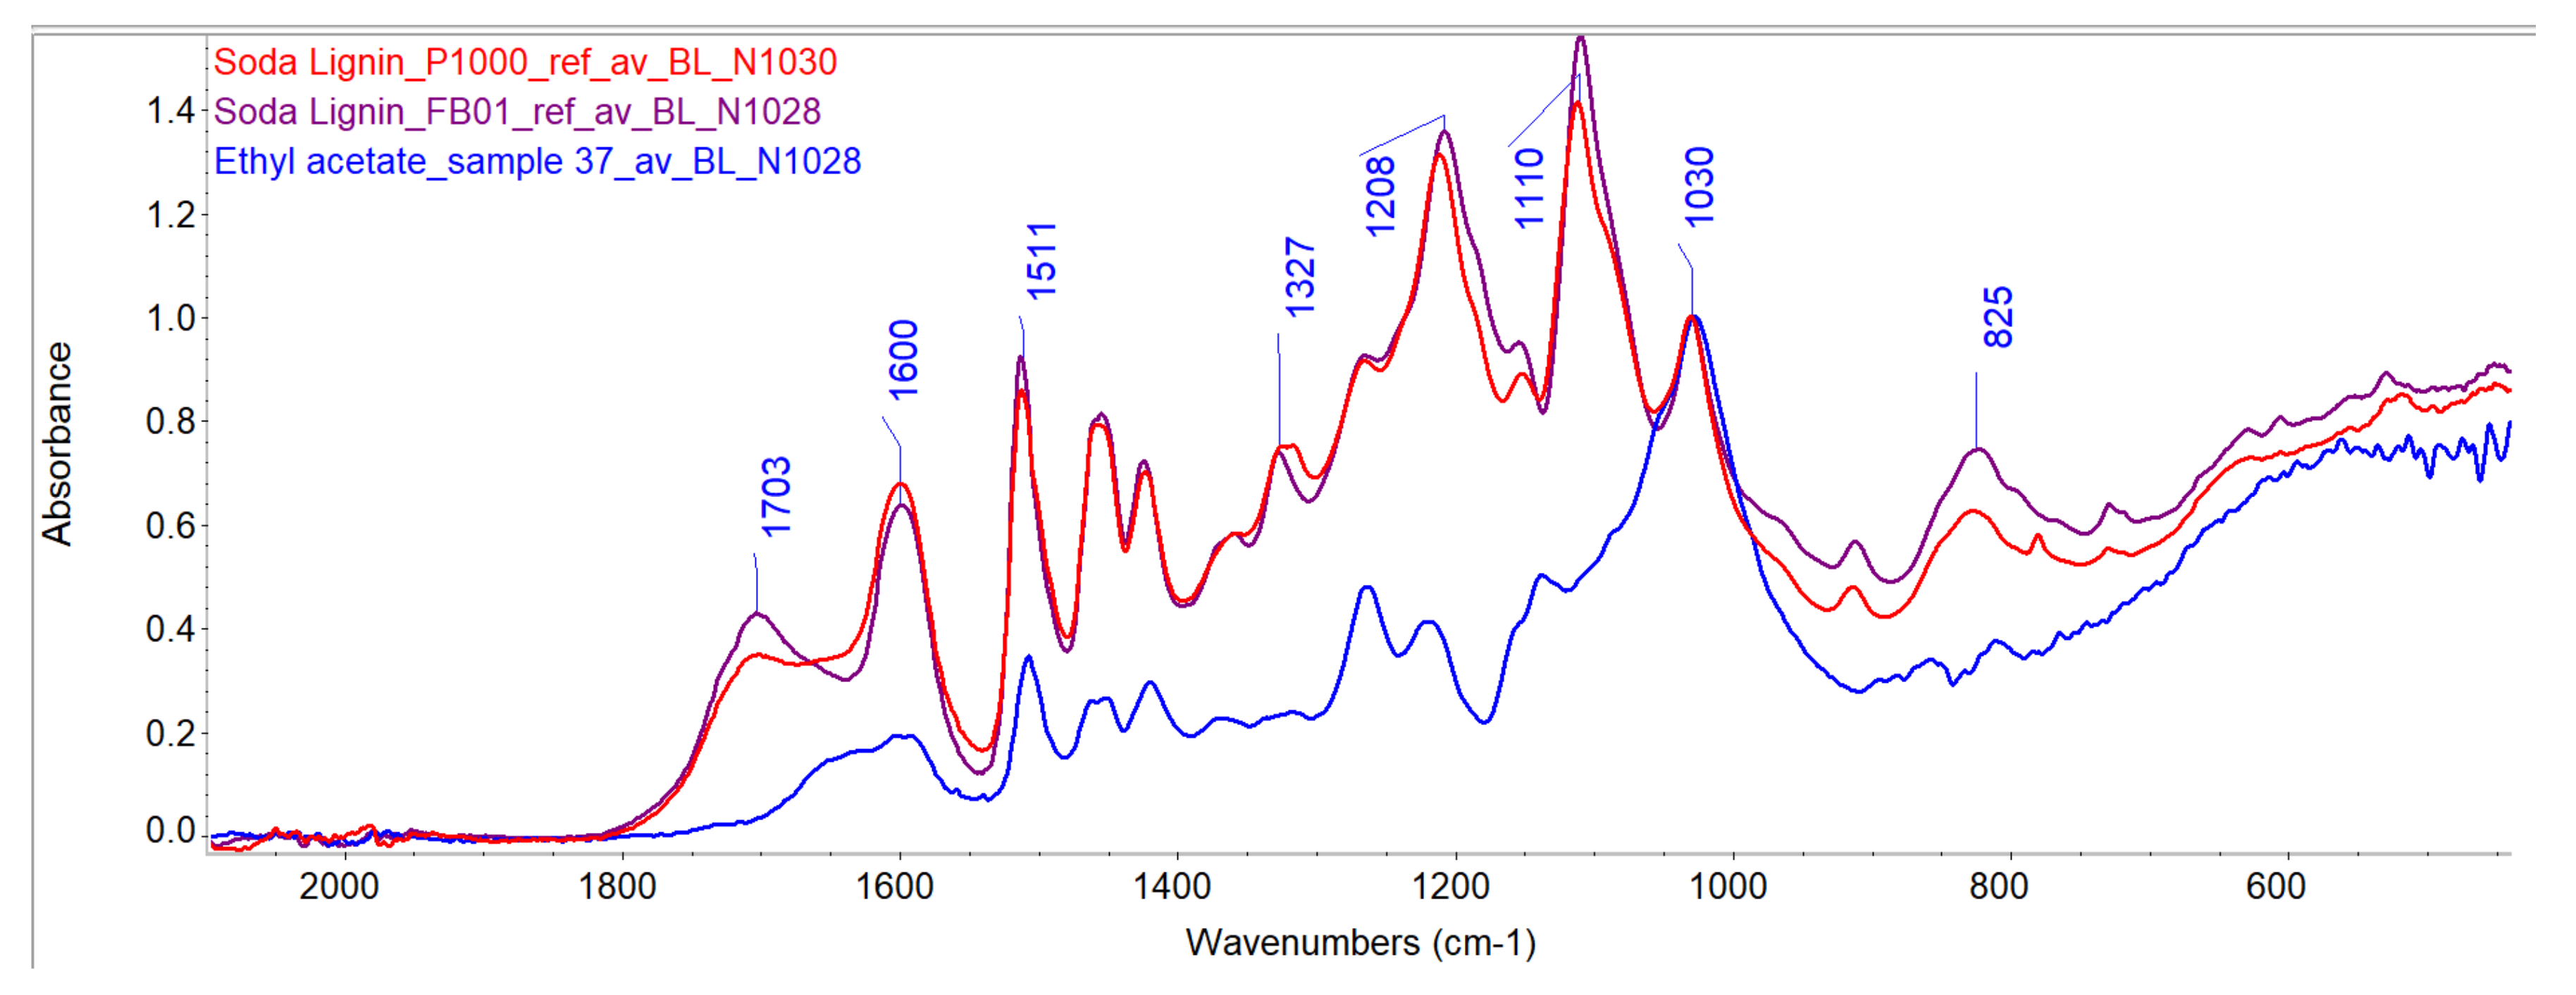
3.1.4. Infrared Spectroscopy (ATR-FTIR)

The chemical state of preservation of all control specimens were investigated by infrared spectroscopy and compared to spectra from sound pine. Variability in archaeological wood substrates was noted in infrared analyses. Figure 3 shows the spectrum from a representative untreated, medium-degraded specimen (nr. 47), an ethyl acetate-treated control (nr. 37) and sound pine. Table 5 gives an overview of the band assignments referred to here. Specimens 37 and 47 showed a decrease in signals from hemicellulose (1733, 1242 cm−1). Signals originating from cellulose (1370, 1156, 896 cm−1) were present in both nrs. 37 and 47, but have lower absorbances than sound pine. In other archaeological specimens, we observed these signals as well, but with varying strength, decreasing with increasing degradation. For nr.s 37 and 47, lignin signals (at 1592, 1508, 1264 and 1217 cm−1) are enhanced due to reduction in signals from hemicellulose and cellulose. We also see that both nrs. 37 and 47 are more oxidized (1605 cm−1). These observations are confirmed by Py-GC/MS, although pyrolysis does not distinguish cellulose from hemicellulose. For both sound pine and archaeological woods, the band with greatest absorbance occurs at 1028 cm−1, which is a combined C-O stretch band containing signals predominantly from carbohydrates (cellulose and hemicellulose). Spectra also show that the untreated specimen (nr. 47) and that which had been treated with ethyl acetate (nr. 37) are very similar to each other. The differences at ca. 1600 cm−1 may be either due to removal of extractive compounds by ethyl acetate or due to natural variability.

3.2. After Treatment

Specimens treated with ethyl acetate, P1000 and FB01 are shown in Figure 4. It is obvious that the introduction of lignin has caused darkening. Different faces of the same specimen cube were unevenly coloured after treatment. The figure also shows the inner wood from specimens 12, 24 and 37. It is clear that P1000 treated wood is much lighter in colour than that treated with FB01, suggesting that the larger P1000 has penetrated less into the specimens.
In many cases such a darkening as seen on surfaces of the lignin-treated specimens would be unacceptably high for objects. However, acceptable colour change depends on the benefits of a particular consolidant and the colour of the starting material. For alum-treated wood from Oseberg, many are very dark to start with, and the colour change may not be unduly large if treated with lignin.

3.2.1. Weight Gain

Both lignin treatments increased weight of specimens (Table 6). It was expected that some weight loss in ethyl acetate controls would occur during immersion due to dissolution of wood resins (which turned the solvent a pale yellow). Weight losses of up to 1.5% were recorded. However, one specimen (41) lost more than 10% of its initial weight after immersion in ethyl acetate. This was due to the loss of material from the knot region during immersion.
P1000 lignin, which has a MW of 4000, had lower weight gain (from 13-19%) compared to FB01 (MW 1000), which ranged from 61–68% (Table 6). However, specimen 11 (P1000 treated) had only 10% weight gain, and specimen 23 (FB01 treated) had 23% weight gain. Both specimens had markedly greater initial weights, indicating better preservation. Thus, more lignin uptake occurred in samples that were in worse condition. Wood with greater degradation has lost more of its polymers, which increases porosity, allowing for more uptake of lignin. This is visible in SEM images, shown in Section 3.2.3.
Mechanical tests were not undertaken in these experiments, but observations during preparation of some specimens for infrared and SEM analyses were noted. The treatment with lignin made some specimens ‘harder to cut’ than those that were untreated (see Comments in Table 6). This was surprising, as the lignin is not a film-forming material on its own, it is a powder, and as such, we did not expect it to increase the specimens’ cutting resistance. However, an increase in hardness is very likely due to non-covalent interactions between the lignin and wood.

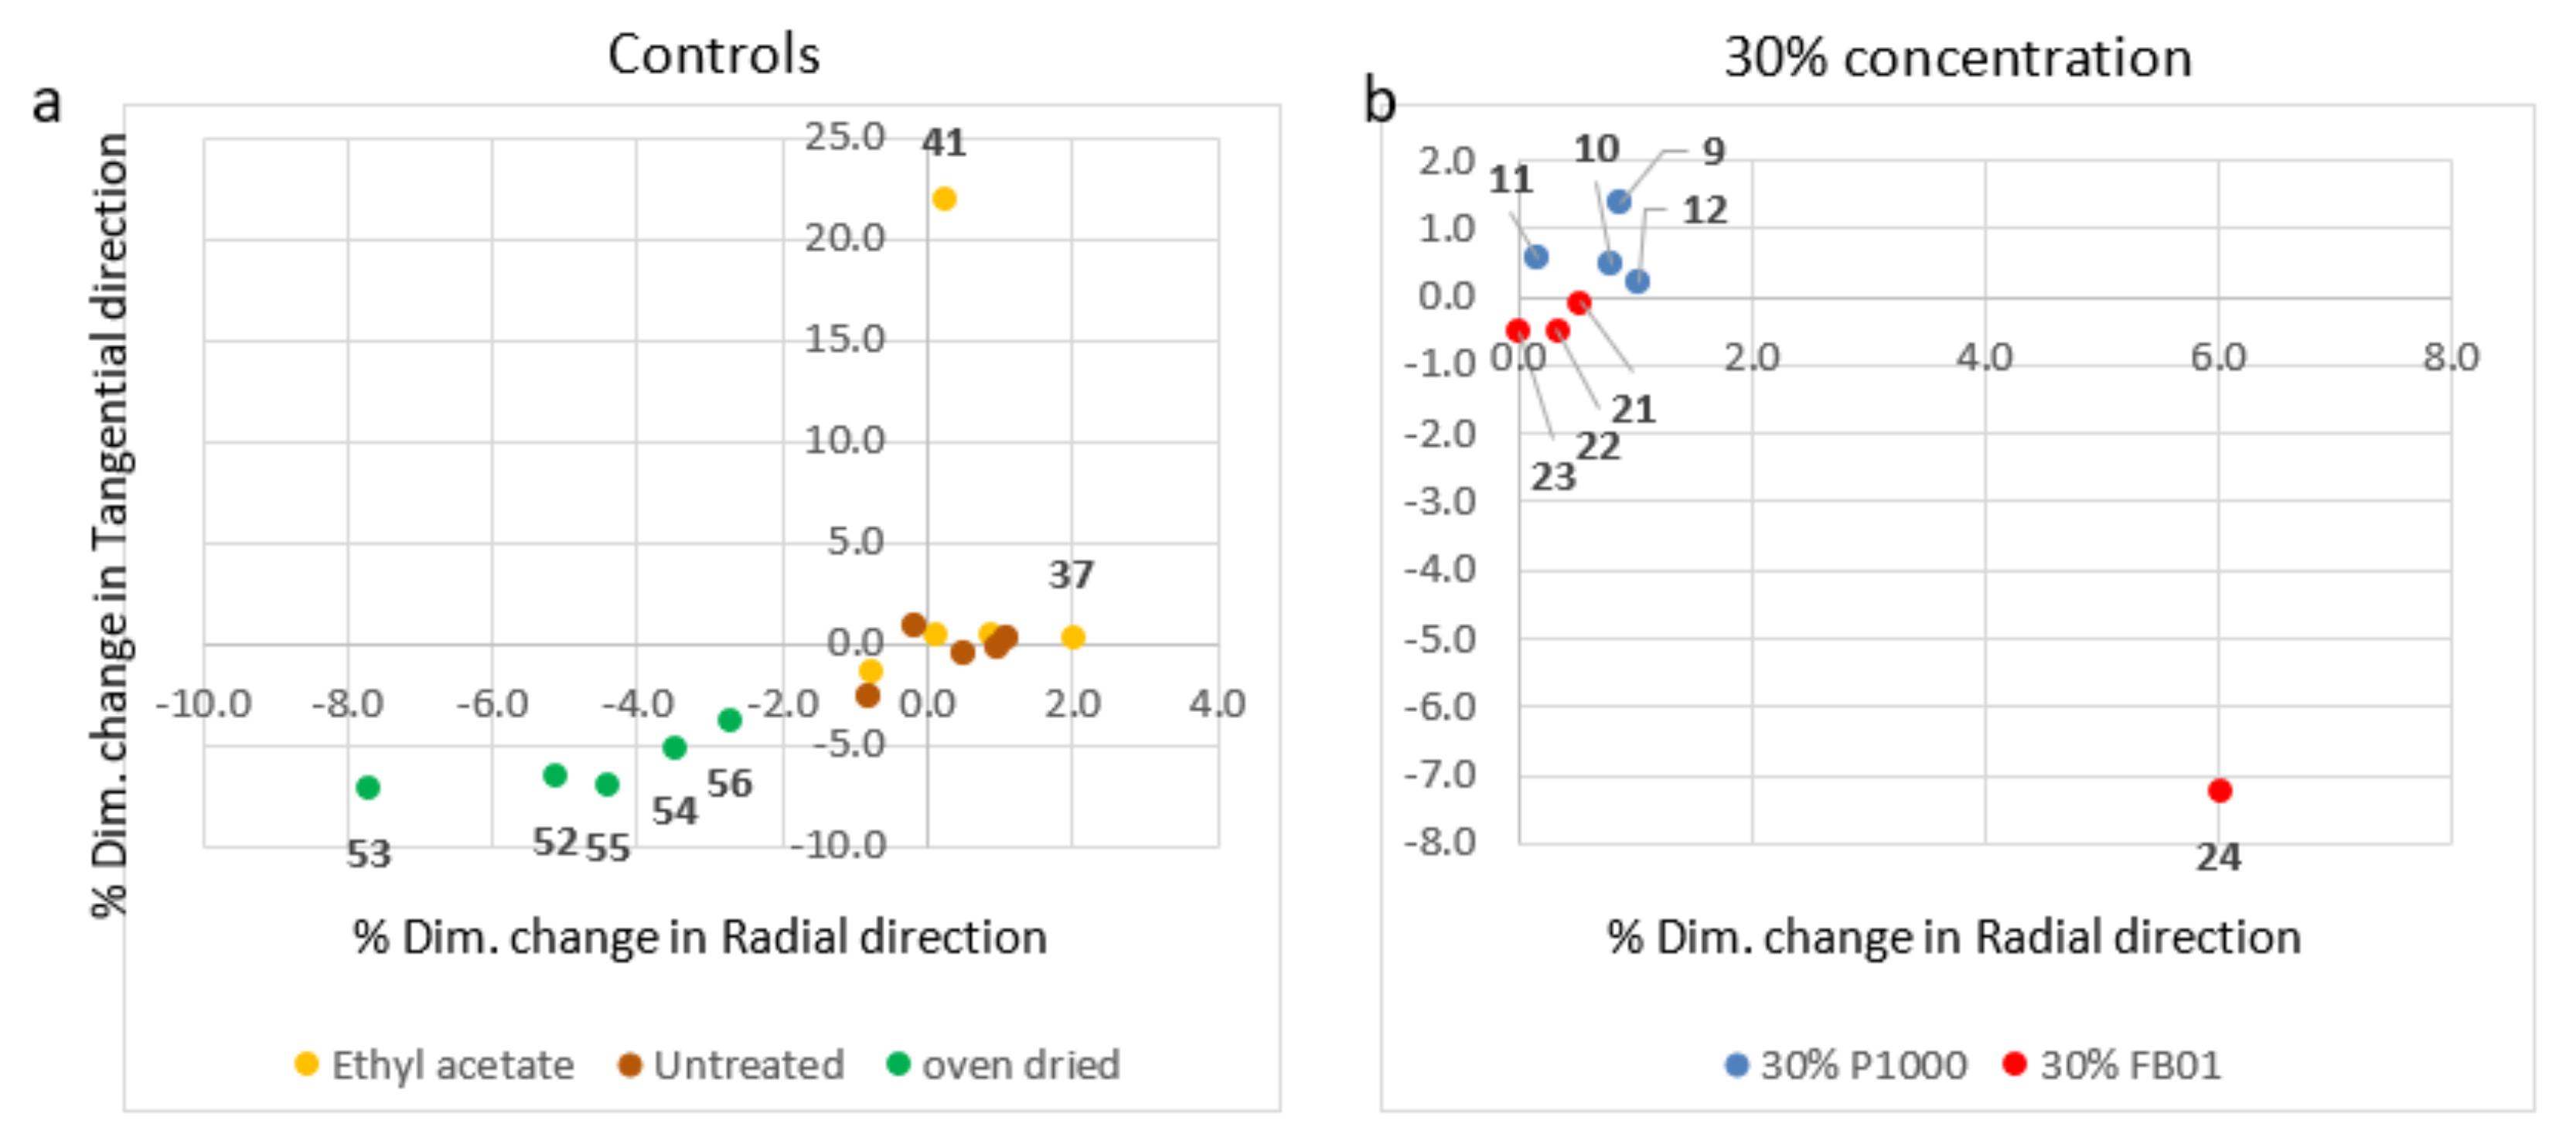
3.2.2. Dimensional Changes
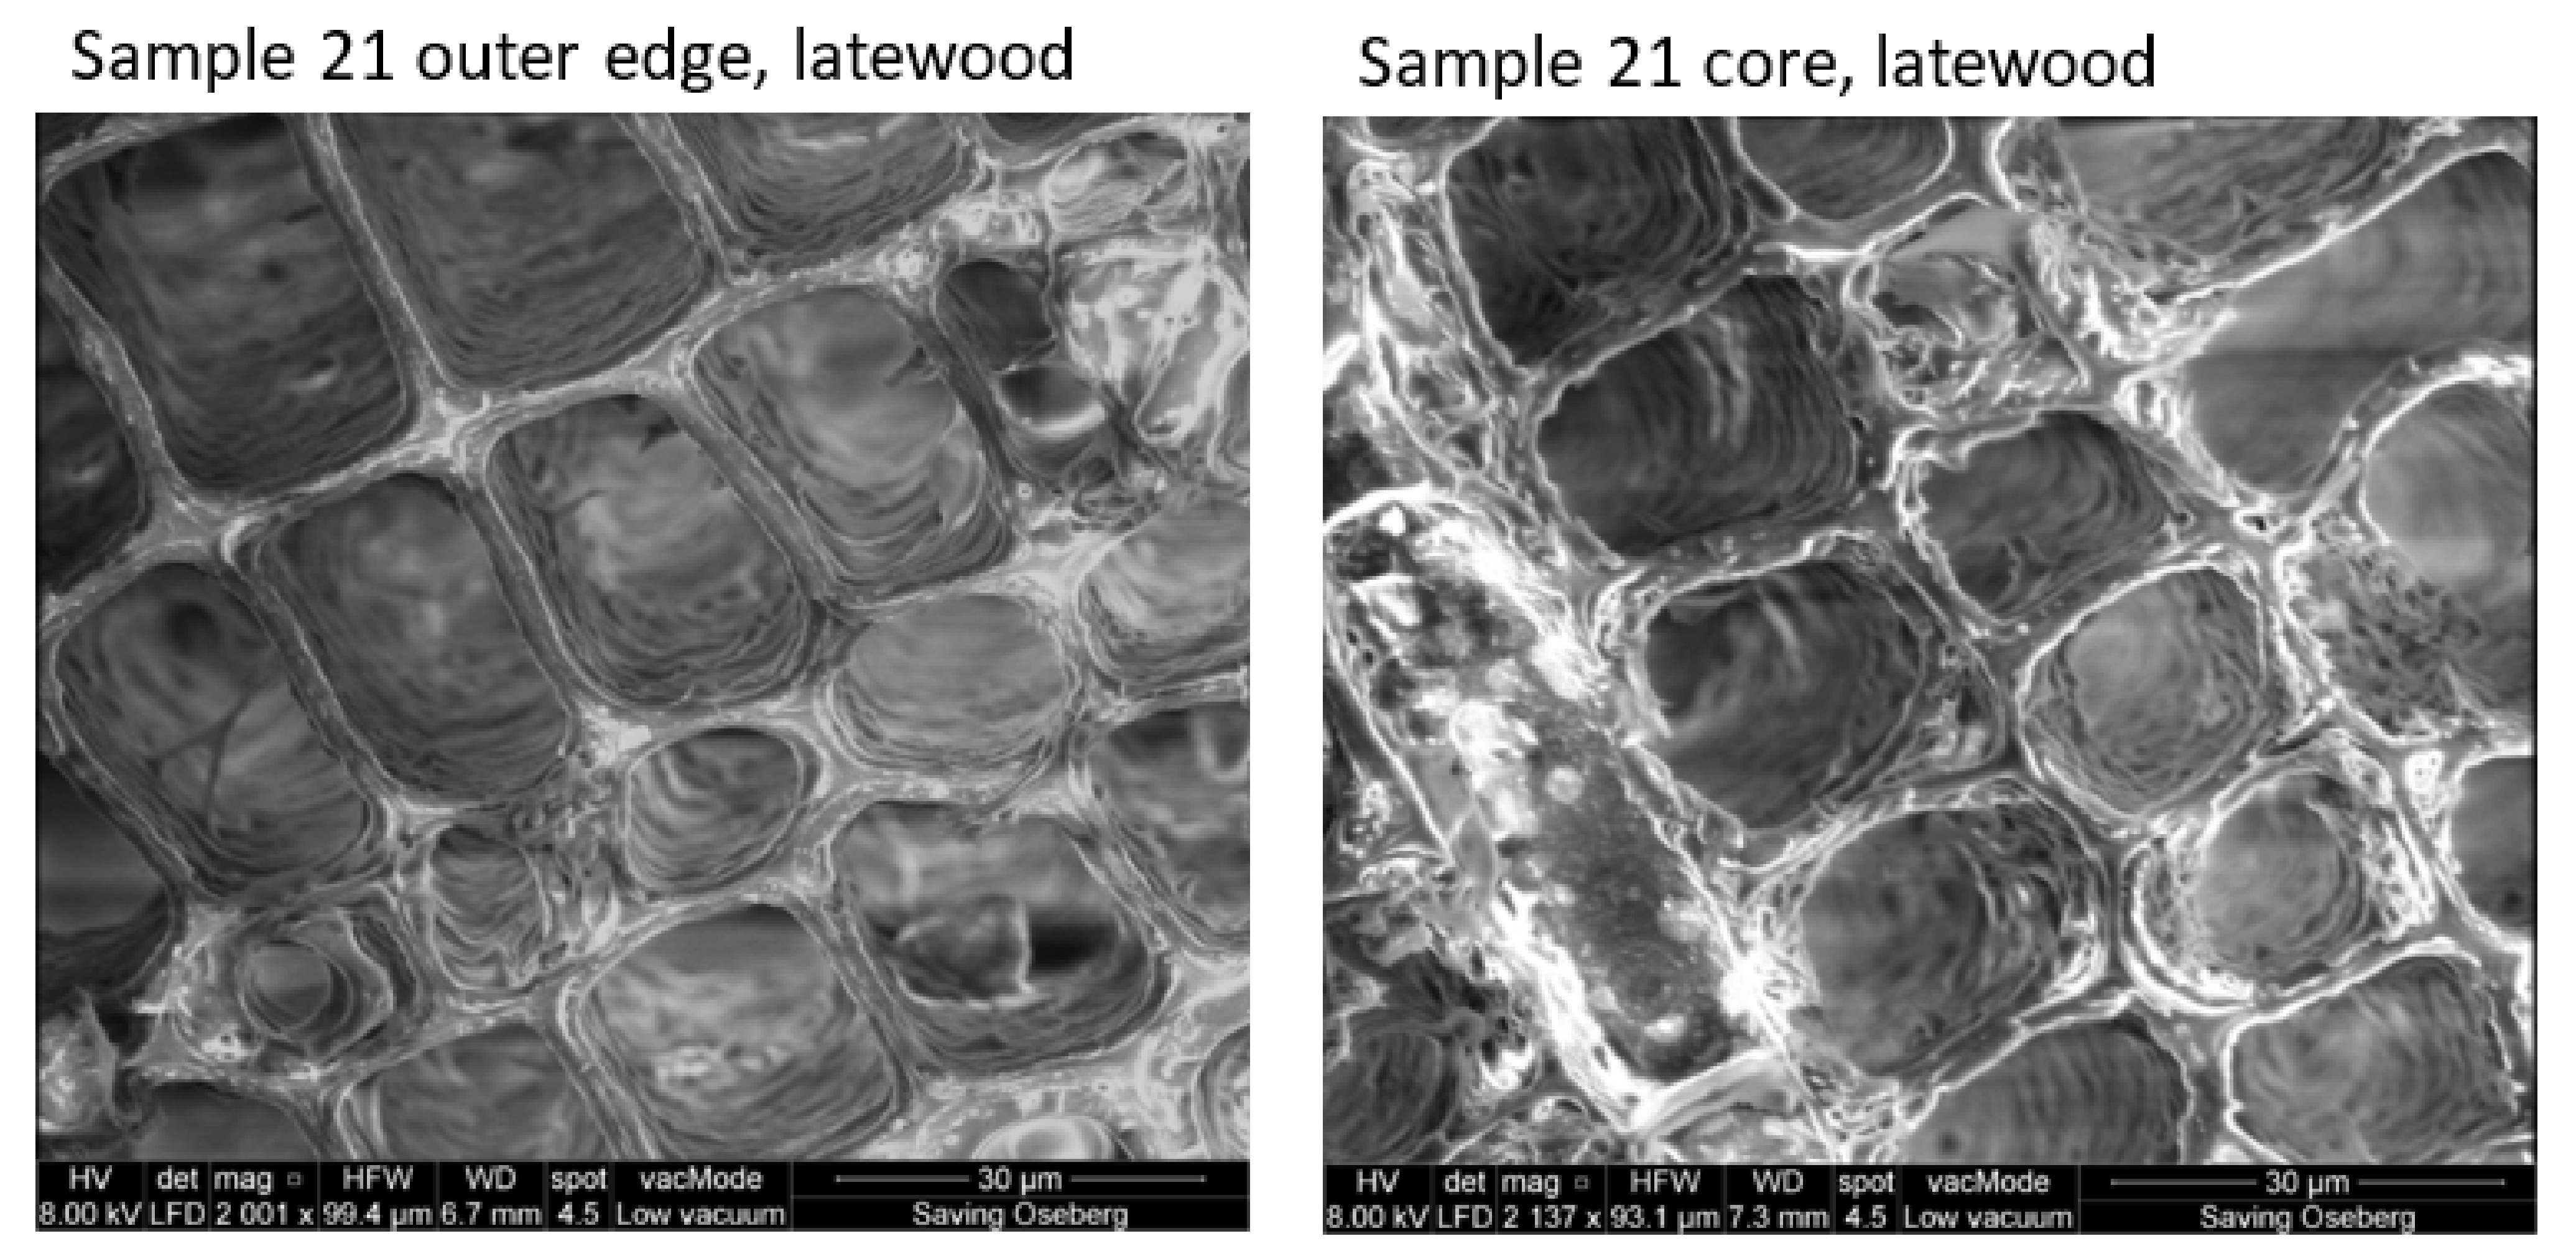
Table 7 and Figure 5 show linear shrinkages for all specimens, expressed as % dimensional change in the tangential and radial directions relative to before treatment, including both oven-dried and the ethyl acetate-treated controls. Untreated controls were measured as well, even though they did not undergo treatment.
For sound pine, one would expect most dimensional change in the radial direction, especially in the larger and thinner earlywood cells. This is because in pine, the tangential direction is more physically reinforced than in the radial direction, due to the low area of overlap between rays and tracheids, which is much lower than in many other woods, such as oak or birch [40]. Furthermore, the shape of cells also plays a role. In pine, thin-walled earlywood cells are elongated in the radial direction, while thick-walled latewood cells are elongated in the tangential direction. This makes earlywood cells more susceptible to compression in the radial direction.
In these experiments, changes in one direction did not predominate over the other. This is likely related to the bacterial degradation the substrates have undergone. For instance, oven-dried specimens (nrs. 52–56) used to characterize the wood had very similar shrinkage values, ranging from −7.7% to −2.7%, in both directions (Figure 5a).
The untreated controls (nrs. 47–51) should theoretically have no dimensional change, as they were kept in the climate chamber during the experiments. Small dimensional changes were, however, measured, ranging from −2.6% to 1.1%, Figure 5a. For these specimens, the changes measured are, therefore, due to the experimental error of the ‘pin method’. This method of measuring dimensional change is affected by the angle of the caliper relative to the pins, such that ‘before’ and ‘after’ dimensions may not be measured in exactly the same way. Different measurement angles can give slightly different distances between pins. Thus, more certain evaluation of change would have been possible to achieve if several repeat measurements were recorded and then averaged. In this experiment, we consider that changes within the error range spanning −2.6% to 1.1% are not significant.
Dimensional changes in ethyl acetate-treated control specimens (nrs. 37–41) are also shown in Figure 5a. For specimen nr. 41, there are very large dimensional changes measured, which are most likely attributable to cracks that had formed during treatment, which were located in the pin measurement area. This specimen had a knot in it, which may have led to cracking. Otherwise, very little dimensional change was measured with ethyl acetate-immersed controls, which ranged between −0.8% and 2%. Low % dimensional change is likely related to ethyl acetate’s low surface tension (similar to ethanol), which reduces the risk of collapse due to capillary forces during evaporation.
Figure 5b shows % dimensional changes for treated specimens. Most dimensional changes were within the range of −0.5% to +2.5%, which is within the measurement limits of the method used, and are, therefore, not significant. However specimen 24 had very high changes (up to 7%), which is most likely due to manual errors in measurement, due to another factor than the error range for the pin method, since this specimen was very similar to nrs. 21 and 22, which showed only ±0.5% change.

3.2.3. Morphology

Wood cellular morphology of untreated controls were compared to sound pine (Figure 6) and treated specimens using the scanning electron microscope (SEM). Figure 7 and Figure 8 show images of 30% concentrations of P1000 and FB01. Images taken from the outer edge are compared to the core of the same specimen.
Comparing the ethyl acetate-treated archaeological pine to sound pine, it was easier to discern morphological differences in the latewood than in the earlywood, likely because there is simply more secondary wall material in latewood (Figure 6). The latewood cells in the archaeological pine are somewhat distorted in shape and have an airy, spongy secondary wall. In sound pine latewood, cells are very regularly shaped and contain very thick, compact walls. Both Py-GC/MS and infrared analyses showed that the archaeological pine mainly suffered from losses in hemicellulose; this loss is likely visualized in the SEM images by this spongy texture.
It is difficult to distinguish organic polymers within another organic material such as wood in the electron microscope. Nonetheless, it was possible to observe slight changes in cell morphology after treatment. For instance, we noted the extent of ‘clogging’ of the typical airy, spongy secondary cell wall material of the latewood after treatment. For 30% P1000, more clogging of the spongy cells are visible on the surface of specimen 9 (Figure 7). The core is similar to the solvent-treated specimen (Figure 6), indicating little or no polymer. This is also reflected in both Py-GC/MS and infrared analyses, discussed in the next section.
In contrast, specimen 21, treated with 30% FB01, the secondary cell walls in both surfaces and cores do not appear as spongy as the control, likely due to the presence of polymer (Figure 8). This was supported by Py-GC/MS and infrared analyses (discussed in the next section), which indicated better penetration of FB01.

3.2.4. Extent of Penetration of Soda Lignins in Treated Specimens

Weight gain informs about the uptake of polymers, but it does not tell us about their distribution within a specimen. Two analytical methods were used to evaluate extent of penetration of the soda lignins: infrared spectroscopy (ATR-FTIR) and Py-GC/MS. Infrared spectra of samples were compared from four different depths of the specimen: from the surface to the core: outer surface, inner surface, core edge and core centre. Py-GC/MS compared two depths: inner surface and core centre (see Figure 1).

Evaluation of Penetration by Py-GC/MS

Wood samples were collected from inner surfaces and core centres of specimens treated with 30% concentrations of P1000 and FB01. Figure 9 shows the chromatographic profiles obtained for wood treated with 30% FB01 (specimen 22) and that obtained for the ethyl acetate-treated reference archaeological wood (specimen 37). Here, we observe an increase in the number and intensity of peaks in the treated wood, due to the presence of compounds formed during pyrolysis of FB01. The pyrolysis products that are written in red script in Table 2 were used to evaluate the penetration effectiveness of the soda lignins.
The semi-quantitative calculations and the composition of the woods treated with lignin materials are shown in Table 8. As expected, the contribution of the added soda lignin results in a lower relative abundance of polysaccharide pyrolysis products. Therefore, higher overall percentages of lignin indicate presence of soda lignin. Surface samples have greater relative abundances of lignin than core samples, due to more accumulation of soda lignin on surfaces.
Pine is a conifer, and its lignin is mainly composed of guaiacyl units. Thus, syringyl (S)-based pyrolysis products are observed only in specimens treated with FB01 and P1000. In treated specimens, it was, thus, possible to calculate the S/G ratio and exploit it as an index of the effectiveness of penetration, where higher S/G ratios indicate greater amounts of S lignin are present. As expected, S/G ratios are higher on the outside (inner surface) than the inside (core centre) parts of the lignin-treated specimens. However this parameter cannot be used to compare extent of penetration between P1000 and FB01, since their S/G ratios are different to begin with; P1000 has an S/G ratio of 1.51, and FB01 has an S/G ratio of 1.80 (Table S1). To see which lignin penetrated better, we must consider % syringyl units.
All lignin pyrolysis products identified in specimens treated with P1000 and FB01 were divided into syringyl (S-lignin), guaiacyl (G-lignin) and p-hydroxyphenyl (H-lignin) units. Figure 10a shows the total relative abundances of lignin units from wood specimens and soda lignins, expressed as a % of total wood. The archaeological pine reference specimen (ethyl acetate treated, 37) is richest in G units. Compounds deriving from H-lignin units are only present in low abundances (2.2% of the total units detected) and products derived from S-lignin units are almost absent in the reference pine specimen (0.4% of the total units detected). In specimens treated with soda lignins, we observe an increase in both H-lignin and S-lignin units and a relative decrease in G-lignin units. This indicates that both lignins P1000 and FB01 were deposited in the cores of treated specimens. However, higher percentages of especially S units, which are almost absent in the reference pine, are present in the cores of FB01 treated specimens. This indicates better penetration than in P1000 treated specimens. Thus, despite the fact that P1000 has a greater % of S type lignin than FB01, the greater percentage of S lignin in cores of FB01-treated specimens indicates that it penetrated much better than the P1000.
The reasons for FB01′s better impregnation may be due to its significantly lower molecular weight (ca. 1000 versus ca. 3000 g/mol), but differences in polarity (functional groups) of the two lignins may also have affected extent of penetration. Therefore, another evaluation of the penetration effectiveness may be based on observing the types of pyrolysis products from the soda lignins, which are present in surfaces and cores. Products which are either absent or are only found in very low amounts in pine (products in red script in Table 2) mainly derive from syringyl and p-hydroxyphenyl lignin, but also include ferulic acid units derived from G-lignin. Figure 10b shows in more detail compounds from the H-lignin and S-lignin groups in treated specimens. Here, we exclude ferulic acid, a G-lignin, as it is only present in low amounts in soda lignin. The relative abundances of carbonyl compounds in both soda lignins increase considerably in the cores of samples treated with both P1000 and FB01. However, greater amounts of carbonyl compounds were found in FB01-treated specimens. As FB01 is more polar, as shown in Figure S2, its better penetration in the specimens may also be due to its greater polarity. Therefore, the extent of penetration in specimens may have been affected by differences in their chemistries, in addition to differences in their molecular weights.
To summarize, Py-GC/MS showed that both soda lignins, P1000 and FB01, penetrated into cores of archaeological pine specimens, but better penetration was achieved with FB01. This was likely due to the lower MW of this lignin, but penetration may also have been enhanced by FB01′s greater polarity.

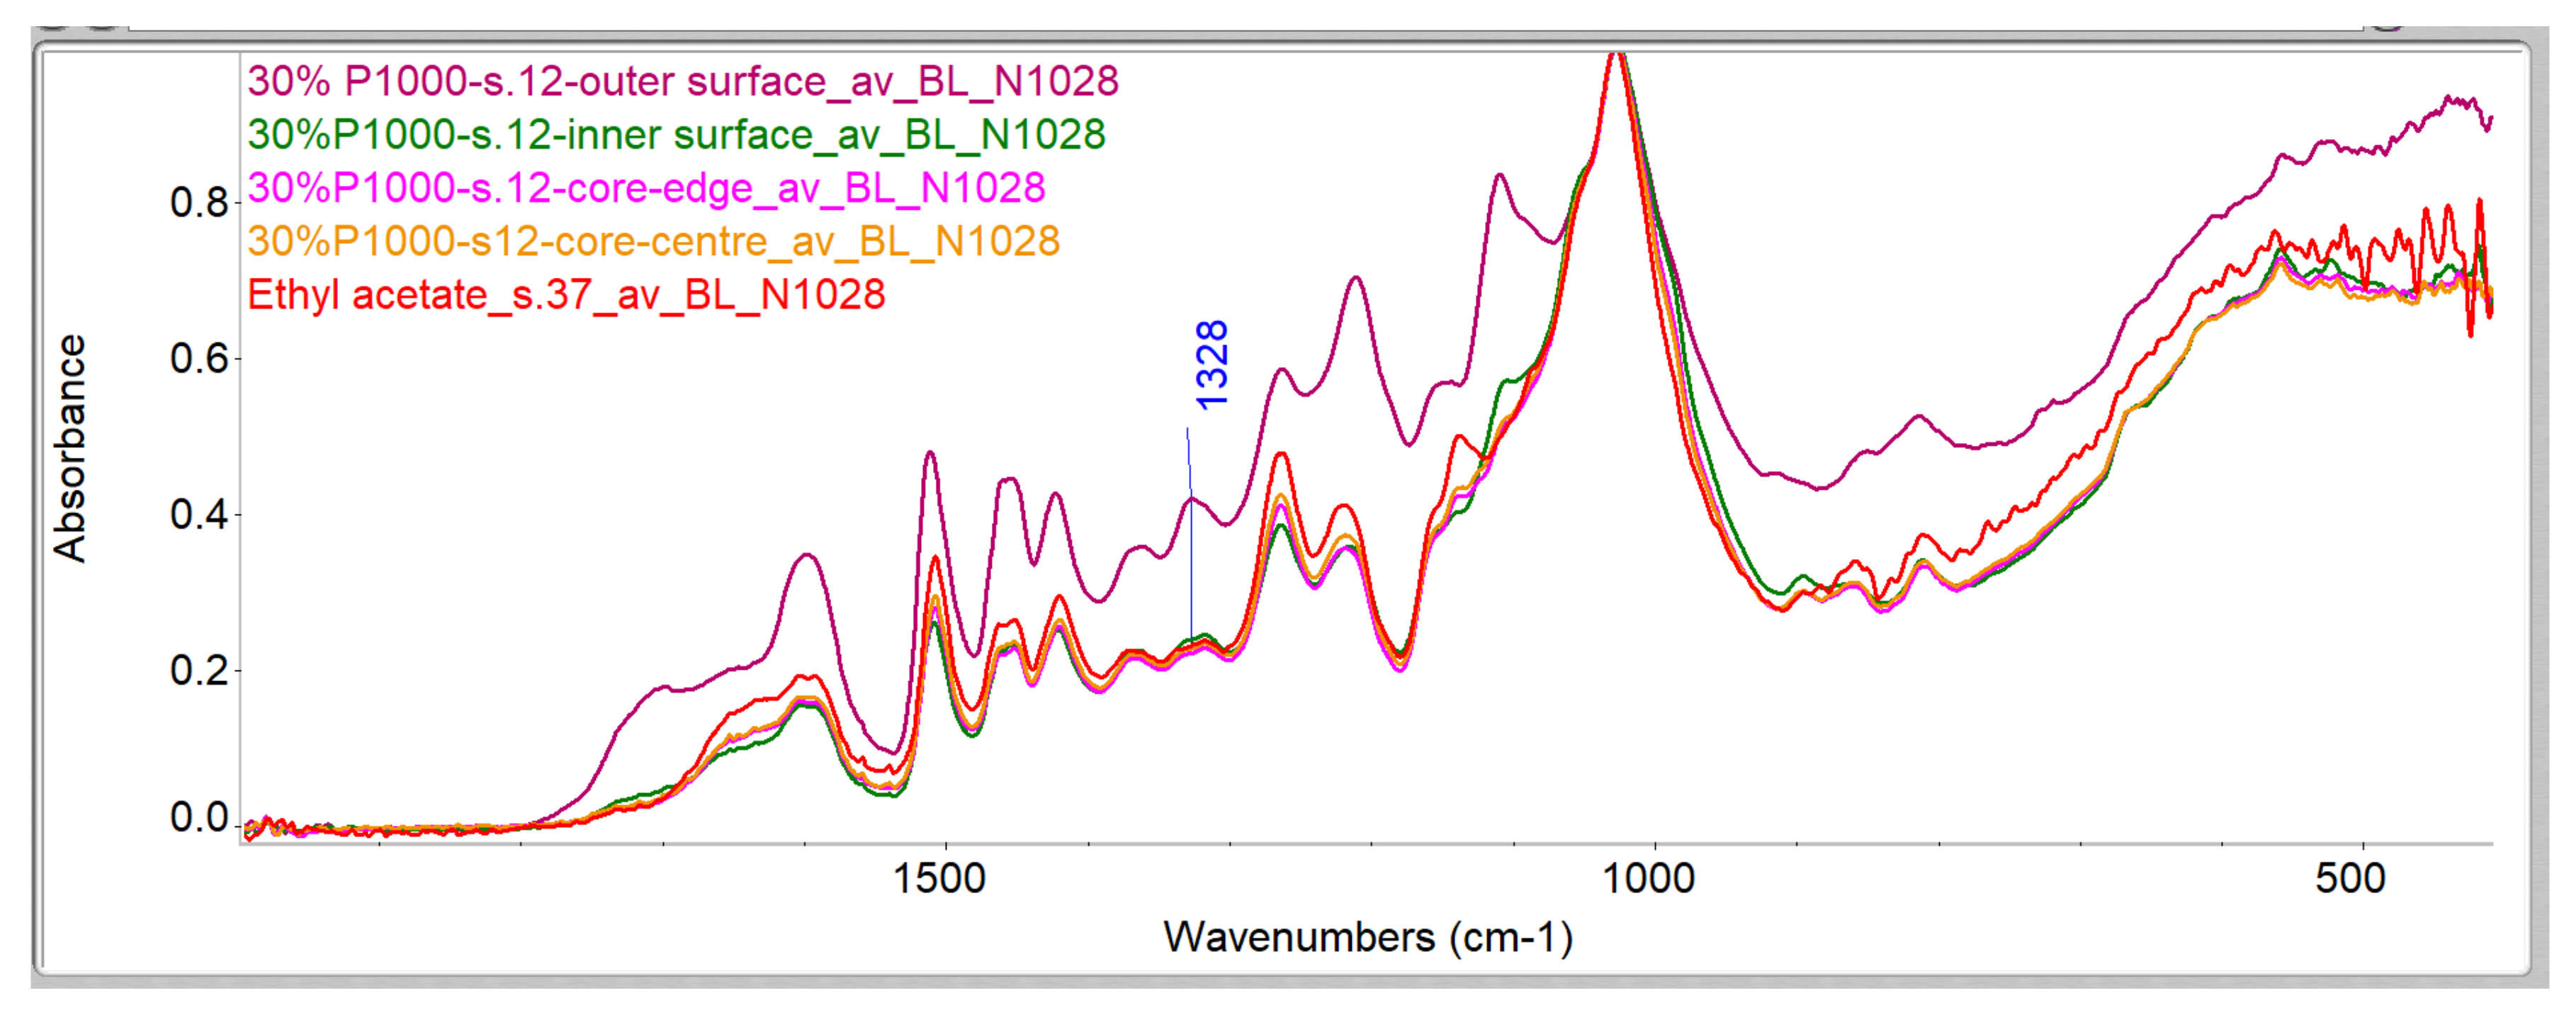
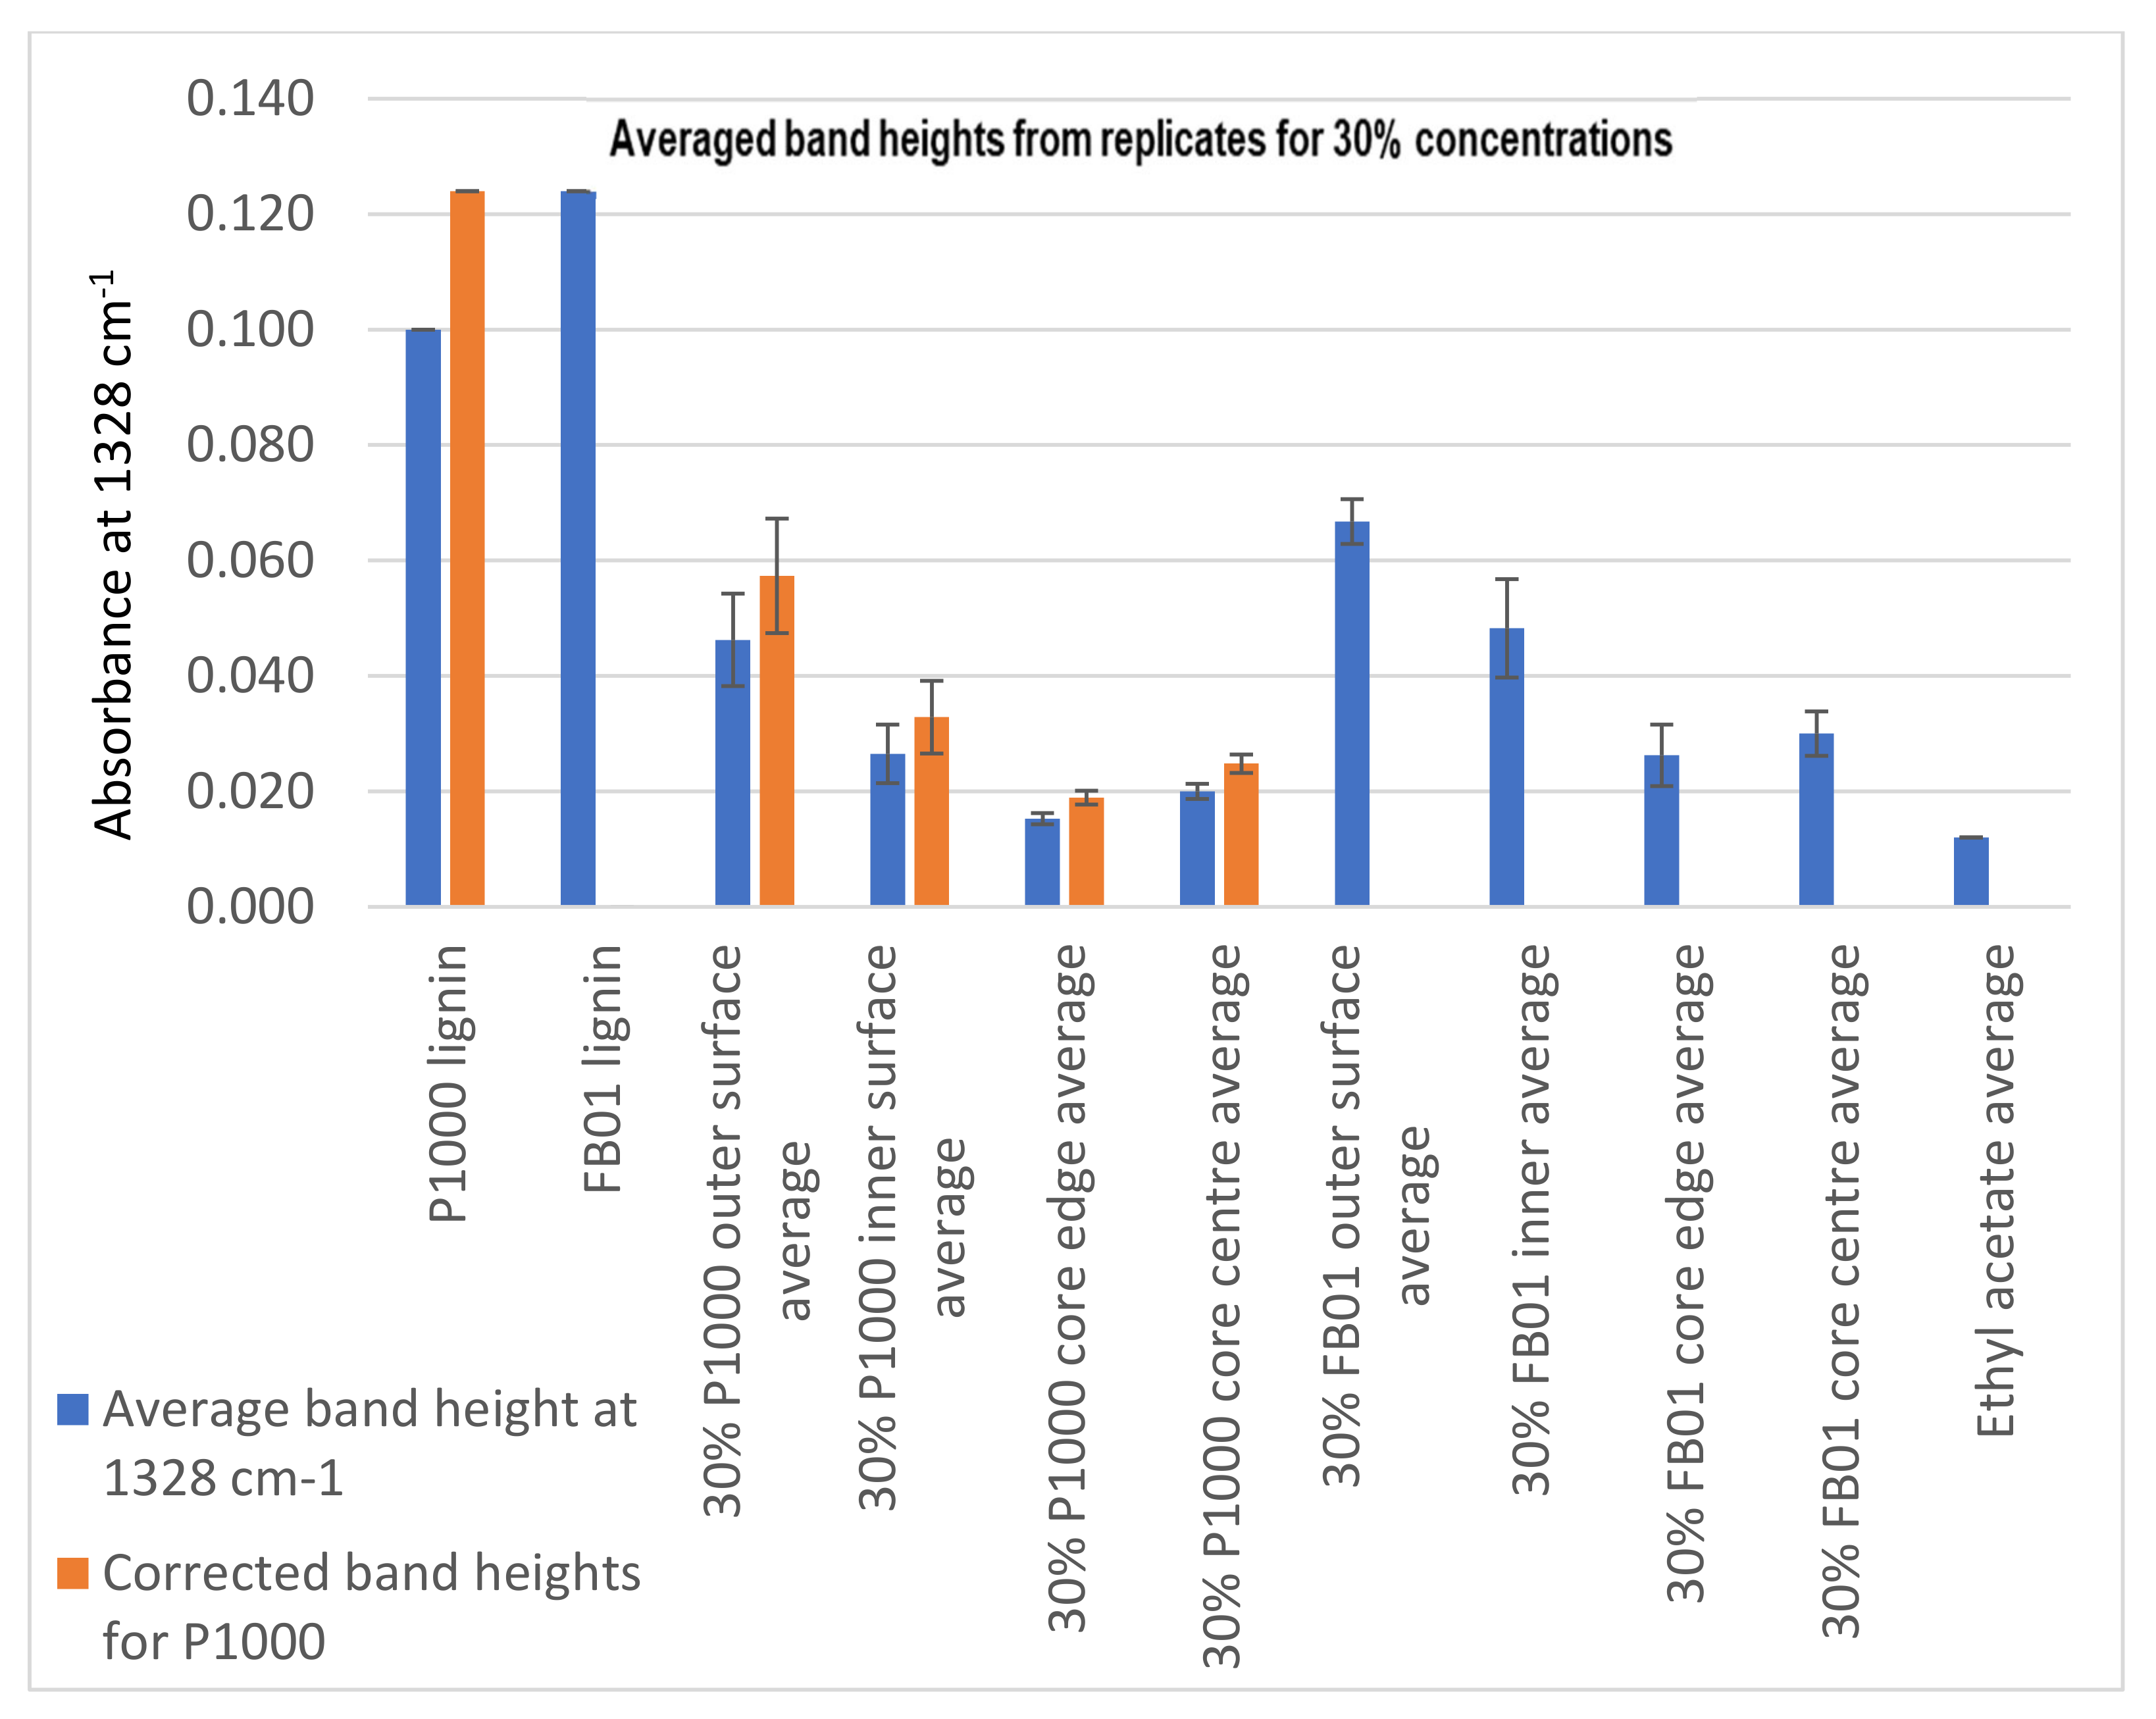
Evaluation of Penetration by ATR-FTIR

Table 5 gives an overview of the infrared band assignments used here. Spectra were baseline corrected and normalized at 1030 cm×1, the same band used to normalize spectra of wood specimens. Both lignins have almost the same bands, with similar intensities (Figure 11). The main difference occurs at 1703 cm−1, which is higher in FB01 than in P1000. This band is assigned to carbonyl and carboxylic groups and, thus, confirms Py-GC/MS analyses, which indicated greater relative abundances of ‘oxidized’ lignin groups.
Figure 11 shows the infrared spectrum of an ethyl acetate-treated reference specimen with medium degradation (nr. 37). Infrared spectra of wood contain many bands, which overlap with signals from the soda lignins. However, we can see that the band at 1327 cm−1 is much more distinct in the soda lignins than in the ethyl acetate-treated wood specimen. This band is due to both S-ring and G-ring condensed vibrations [37]. This band is very low in pine, since S-lignin is present in very low amounts, as shown by Py-GC/MS. Therefore, this band was used as a ‘marker’ for soda lignin in the wood substrate, where greater absorbance indicates more soda lignin is present (Figure 12 and Figure 13). The extent of penetration of soda lignin was evaluated by measuring heights of this band at four depths in each specimen. Band heights from corresponding depths were then averaged from specimens in the same treatment group and are shown in Table S2 and Figure 14.
Both soda lignins have similar absorbances at 1327 cm−1, but it is slightly greater (24%) in FB01 than in P1000. In order to compare the extent of penetration of P1000 against that of FB01, it is necessary to ensure that the absorbance at 1327 cm−1 is the same. This was accomplished by multiplying the absorbance at 1327–1328 cm−1 by 1.24 for P1000-treated specimens. This is shown as ‘corrected band heights for P1000′ in Figure 14 and Table S2.
Wood specimens treated with 30% FB01 showed greater band heights at 1327–1328 cm−1 at all depths compared to reference specimens, indicating that this polymer reached the cores of the specimens (Table S2 and Figure 14). For specimens treated with 30% P1000, the outer and inner surfaces had strong signals (higher band heights), but at depths below the surface, signals were markedly lower. However, the P1000 polymer is likely present, since the band heights are still greater than that for untreated specimens.
These results show the same trends as Py-GC/MS analyses.
In summary, detecting the presence of soda lignin in wood by chemical analyses was straightforward due to the choice of pine as the substrate in these experiments. This is because lignins derived from straw, such as P1000 and FB01, contain units that are not usually present in significant amounts in conifers, such as syringyl, p-hydroxyphenyl and ferulic acid residues. Here, syringyl units could, therefore, be used as ‘markers’ for detection of soda lignin presence.

4. Conclusions and Perspectives

Lignin treatments caused large colour changes in surfaces of treated specimens relative to controls. However, if the starting archaeological wood is very dark, as is, for example, highly degraded alum-treated wood, this colour change may not be as noticeable.
Linear dimensional changes after treatment were small (within 2.5% for most specimens) and did not have preferred radial or tangential directions. Due to the errors involved in the ‘pin method’, changes between −2.6% and 1.1% were not considered as significant.
Specimens treated with FB01 (Mw~1 kDa) gained significantly more weight than those treated with P1000 (Mw~3 kDa). SEM images showed presence of FB01 in cores, but it was difficult to assess the presence of P1000 at the same depth, likely because there was relatively little material. Py-GC/MS and infrared analyses showed that both soda lignins penetrated the cores of 2 × 2 × 2 cm3 specimens, but P1000 to a lesser extent than FB01.
The better penetration of FB01 in the wood core compared to P1000 was likely mainly due to its lower molecular weight; however, other factors, such as polymer-solvent interactions or the lignin’s chemical interactions with wood polymers, may also have played a role [41]. For instance, Py-GC/MS showed that lignins richer in products with carbonyl functionalities penetrated more easily, which may partially explain FB01′s better penetration. This should be kept in mind when evaluating penetration.
The great variability in archaeological wood specimens used here has been highlighted throughout the results, as it is another important factor that can affect penetration and dimensional changes. For example, our results were affected by the initial state of preservation of the wood specimens (based on density measurements) and the presence of knots. Pith, juvenile wood and reaction wood also may affect experimental results. This is the challenge when using archaeological wood as test substrate. On the other hand, archaeological wood is the best substrate for testing materials aimed at preserving it. This is because the slow bacterial decay it undergoes during burial produces wood, which has particular degradation patterns that are difficult to reproduce in the laboratory. Furthermore, objects are not made from ‘perfect’ wood, so it is important to know how defects will react to a treatment.
Based on these experiences, we suggest that experiments designed during the development of new materials for archaeological wood would benefit from several testing phases, with a step-wise increase in specimen number. For example, lower specimen numbers can be used to investigate initial questions about penetration, as in this case, as it would direct further work on polymer development. The next phase would involve larger sample numbers where trends based on measurements (such as dimensional change, weight gain, colour, interaction with moisture) can be understood with better certainty. It is, thus, very important to standardize a testing regime as for example described in Kavvouras, Kostarelou, Zisi, Petrou and Moraitou [42]. This, however, may be difficult to achieve if large amounts of archaeological wood are not available.
Greater numbers of test specimens require that sufficient amounts of polymer are available for testing. Therefore, in the design of new polymers, a scaling-up phase for polymer production is of vital importance to plan, as large-scale production may not be as straightforward as it is at smaller scales.
Finally, if lignin-based treatments prove to be promising, it is our considered opinion that they should be tested on real test objects of alum-treated wood from the Oseberg collection.

Supplementary Materials

The following are available online at https://www.mdpi.com/article/10.3390/f12070911/s1, Figure S1: Distribution of categories of (a) holocellulose and (b) lignin pyrolysis products for sound pine wood, untreated and soaked in ethyl acetate archaeological pine wood specimens. Table S1: Holocellulose(H) and Lignin (L) relative abundances from soda lignins used in the experiments expressed as percentages of all holocellulose and lignin pyrolysis products. Figure S2. Distribution of lignin pyrolysis products from soda lignin P1000 and FB01, shown as % relative abundances of the total lignin pyrolysis products obtained by Py-GC/MS. Table S2. Band heights averaged from each depth analyzed by FTIR.

Author Contributions

Conceptualization, methodology H.K., R.J.A.G., T.M.S., S.B. and J.J.Ł.; writing—original draft preparation, S.B. and J.J.Ł.; formal analysis, S.B., A.d.L. and J.J.Ł.; writing—review and editing, S.B., J.J.Ł., A.d.L., F.A., H.K., S.H., M.P.-J., F.M., T.M.S., R.J.A.G. All authors have read and agreed to the published version of the manuscript.

Funding

This work was carried out as part of the Saving Oseberg project, funded by the Norwegian Ministry of Education and Research and University of Oslo. The EU Erasmus+ program funded Anne de Lamotte’s 3-month traineeship in Oslo. The authors also gratefully acknowledge the contribution of COST Action LignoCOST (CA17128), supported by COST (European Cooperation in Science and Technology), in promoting interaction, exchange of knowledge and collaborations in the field of lignin valorisation.

Acknowledgments

Jacqueline Donkers and Jacinta van der Putten (Wageningen Food and Biobased Research) are gratefully acknowledged for the fractionation work for the soda lignin and the performed analytical characterisation of the lignins using wet chemical methods.

Conflicts of Interest

The authors declare no conflict of interest.

References

  1. Herbst, C.F. Om bevaring af oldsager af træ fundne i törvemoser. In Antiquarisk Tidsskrift; Det Kongelige Nordiske Oldskrift-selskab: Kjøbenhavn, Danmark, 1861; pp. 174–176. [Google Scholar]
  2. Speerschneider, C.A. Behandling af oldsager af træ, som ere fundne i moser for at bevare dem i deres oprindelige form og farve. In Antiquarisk Tidsskrift; Det Kongelige Nordiske Oldskrift-Selskab: Kjøbenhavn, Danmark, 1861; pp. 176–178. [Google Scholar]
  3. Christensen, B.B. The Conservation of Waterlogged Wood in the National Museum of Denmark: With a Report on the Methods Chosen for the Stabilization of the Timbers of the Viking Ships from Roskilde Fjord, and a Report on Experiments Carried out in Order to Improve upen These Methods; The National Museum of Denmark: Copenhagen, Denmark, 1970; Volume 1. [Google Scholar]
  4. Rosenqvist, A.M. The Stabilizing of Wood Found in the Viking Ship of Oseberg: Part I. Stud. Conserv. 1959, 4, 13–22. [Google Scholar]
  5. Eaton, J.W. The preservation of wood by the alum process. Fla. Anthropol. 1962, XV, 115–117. [Google Scholar]
  6. McQueen, C.M.A.; Tamburini, D.; Braovac, S. Identification of inorganic compounds in composite alum-treated wooden artefacts from the Oseberg collection. Sci. Rep. 2018, 8, 2901. [Google Scholar] [CrossRef] [Green Version]
  7. McQueen, C.M.A.; Tamburini, D.; Łucejko, J.J.; Braovac, S.; Gambineri, F.; Modugno, F.; Colombini, M.P.; Kutzke, H. New insights into the degradation processes and influence of the conservation treatment in alum-treated wood from the Oseberg collection. Microchem. J. 2017, 132, 119–129. [Google Scholar] [CrossRef] [Green Version]
  8. Braovac, S.; Tamburini, D.; Łucejko, J.J.; McQueen, C.M.A.; Kutzke, H.; Colombini, M.P. Chemical analyses of extremely degraded wood using analytical pyrolysis and inductively coupled plasma atomic emission spectroscopy. Microchem. J. 2016, 124, 368–379. [Google Scholar] [CrossRef]
  9. Braovac, S.; Kutzke, H. The presence of sulfuric acid in alum-conserved wood—Origin and consequences. J. Cult. Herit. 2012, 13, S203–S208. [Google Scholar] [CrossRef]
  10. Wang, C.; Zhang, L.; Zhou, T.; Chen, J.; Xu, F. Synergy of Lewis and Brønsted acids on catalytic hydrothermal decomposition of carbohydrates and corncob acid hydrolysis residues to 5-hydroxymethylfurfural. Sci. Rep. 2017, 7, 40908. [Google Scholar] [CrossRef] [Green Version]
  11. Zhou, L.; Zou, H.; Nan, J.; Wu, L.; Yang, X.; Su, Y.; Lu, T.; Xu, J. Conversion of carbohydrate biomass to methyl levulinate with Al2(SO4)3 as a simple, cheap and efficient catalyst. Catal. Commun. 2014, 50, 13–16. [Google Scholar] [CrossRef]
  12. Brazdausks, P.; Paze, A.; Rizhikovs, J.; Puke, M.; Meile, K.; Vedernikovs, N.; Tupciauskas, R.; Andzs, M. Effect of aluminium sulphate-catalysed hydrolysis process on furfural yield and cellulose degradation of Cannabis sativa L. shives. Biomass Bioenergy 2016, 89, 98–104. [Google Scholar] [CrossRef]
  13. Chamberlain, D. Anion mediation of aluminium-catalysed degradation of paper. Polym. Degrad. Stab. 2007, 92, 1417–1420. [Google Scholar] [CrossRef]
  14. Baty, J.; Minter, W.; Lee, S. The role of electrophilic metal ions aluminum (III) and magnesium (II) in paper degradation and deacidification. In American Institute for the Conservation of Historic and Artistic Works. In Proceedings of the 38th Annual Meeting, Milwaukee, WI, USA, 11–14 May 2010. [Google Scholar]
  15. Baty, J.; Sinnott, M.L. Efficient electrophilic catalysis of 1,5-anhydrocellobiitol hydrolysis by AlIII; implications for the conservation of ?rosin-alum? sized paper. Chem. Commun. 2004, 2004, 866–867. [Google Scholar] [CrossRef] [PubMed]
  16. Łucejko, J.J.; McQueen, C.M.A.; Sahlstedt, M.; Modugno, F.; Colombini, M.P.; Braovac, S. Comparative chemical investigations of alum treated archaeological wood from various museum collections. Herit. Sci. 2021, 9, 69. [Google Scholar] [CrossRef]
  17. Häggström, C.; Sandström, T.; Lindahl, K.; Sahlstedt, M. Alum-Treated Archaeological Wood: Characterization and Re-Conservation; Riksantikvarieämbetet: Gotland, Sweden, 2013; p. 131. [Google Scholar]
  18. Bojesen-Koefoed, I.M. Re-conservation of wood treated with alum in the 1920s—Challenges and strategies. In Proceedings of the 11th ICOM Group on Wet Organic Archaeological Materials Conference, Greenville 2010, Greenville, NC, USA, 20 April 2012; Strætkvern, K., Williams, E., Eds.; Springer: Berlin/Heidelberg, Germany, 2012; pp. 497–502. [Google Scholar]
  19. Braovac, S.; Wittköpper, M.; Sahlstedt, M. Retreatment testing of alum-treated woods from the Oseberg collection—Results from first trials. In Proceedings of the 14th ICOM-CC Wet Organic Archaeological Materials Conference, Portsmouth, UK, 20–23 May 2019. [Google Scholar]
  20. Brøgger, A.W.; Shetelig, H.; Falk, H. Osebergfundet; Den norske Stat: Kristiania, Norge, 1917. [Google Scholar]
  21. Braovac, S.; McQueen, C.M.A.; Sahlstedt, M.; Kutzke, H.; Łucejko, J.J.; Klokkernes, T. Navigating conservation strategies: Linking material research on alum-treated wood from the Oseberg collection to conservation decisions. Herit. Sci. 2018, 6, 77. [Google Scholar] [CrossRef]
  22. Lora, J. Chapter 10-Industrial Commercial Lignins: Sources, Properties and Applications. In Monomers, Polymers and Composites from Renewable Resources; Elsevier: Amsterdam, The Netherlands, 2008; pp. 225–241. [Google Scholar]
  23. Ang, A.F.; Ashaari, Z.; Lee, S.H.; Tahir, P.M.; Halis, R. Lignin-Based Copolymer Adhesives for Composite Wood Panels—A Review. Int. J. Adhes. Adhes. 2019, 95, 102408. [Google Scholar] [CrossRef]
  24. Ghaffar, S.H.; Fan, M. Lignin in straw and its applications as an adhesive. Int. J. Adhes. Adhes. 2014, 48, 92–101. [Google Scholar] [CrossRef]
  25. Vachon, J.; Assad-Alkhateb, D.; Baumberger, S.; van Haveren, J.; Gosselink, R.J.A.; Monedero, M.; Bermudez, J.M. Use of lignin as additive in polyethylene for food protection: Insect repelling effect of an ethyl acetate phenolic extract. Compos. Part. C Open Access 2020, 2, 100044. [Google Scholar] [CrossRef]
  26. Lora, J.H. Characteristics, Industrial Sources, and Utilization of Lignins from Non-Wood Plants. In Chemical Modification, Properties, and Usage of Lignin; Springer Science and Business Media LLC: Boston, MA, USA, 2002; pp. 267–282. [Google Scholar]
  27. Gosselink, R.J.A.; Putten, J.C.; van Es, D.S. Fractionation of Technical Lignin. Patent WO2015 178771, 26 November 2015. [Google Scholar]
  28. Browning, B.L. Methods of Wood Chemistry; Interscience Publishers: New York, NY, USA, 1967; Volume I–II. [Google Scholar]
  29. Gosselink, R.J.A.; Van Dam, J.E.G.; de Jong, E.; Scott, E.L.; Sanders, J.P.M.; Li, J.; Gellerstedt, G. Fractionation, analysis, and PCA modeling of properties of four technical lignins for prediction of their application potential in binders. Holzforschung 2010, 64, 193–200. [Google Scholar] [CrossRef]
  30. Lu, Y.; Joosten, L.; Donkers, J.; Andriulo, F.; Slaghek, T.M.; Phillips-Jones, M.K.; Gosselink, R.J.A.; Harding, S.E. Characterisation of mass distributions of solvent-fractionated lignins using analytical ultracentrifugation and size exclusion chromatography methods. Sci. Rep. 2021, 11, 1–12. [Google Scholar] [CrossRef]
  31. Tamburini, D.; Łucejko, J.J.; Zborowska, M.; Modugno, F.; Cantisani, E.; Mamoňová, M.; Colombini, M.P. The short-term degradation of cellulosic pulp in lake water and peat soil: A multi-analytical study from the micro to the molecular level. Int. Biodeterior. Biodegrad. 2017, 116, 243–259. [Google Scholar] [CrossRef]
  32. Tamburini, D.; Lucejko, J.J.; Ribechini, E.; Colombini, M.P. New markers of natural and anthropogenic chemical alteration of archaeological lignin revealed by in situ pyrolysis/silylation-gas chromatography-mass spectrometry. J. Anal. Appl. Pyrolysis 2016, 118, 249–258. [Google Scholar] [CrossRef]
  33. Tamburini, D.; Łucejko, J.J.; Zborowska, M.; Modugno, F.; Prądzyński, W.; Colombini, M.P. Archaeological wood degradation at the site of Biskupin (Poland): Wet chemical analysis and evaluation of specific Py-GC/MS profiles. J. Anal. Appl. Pyrolysis 2015, 115, 7–15. [Google Scholar] [CrossRef]
  34. Grattan, D.W.; Clarke, R.W. Conservation of Waterlogged wood. In Conservation of Marine Archaeological Objects; Pearson, C., Ed.; Butterworth-Heinemann: Oxford, UK, 1987; pp. 164–206. [Google Scholar]
  35. Schwanninger, M.; Rodrigues, J.; Pereira, H.; Hinterstoisser, B. Effects of short-time vibratory ball milling on the shape of FT-IR spectra of wood and cellulose. Vib. Spectrosc. 2004, 36, 23–40. [Google Scholar] [CrossRef]
  36. Faix, O.; Bremer, J.; Schmidt, O.; Stevanovic, T.J. Monitoring of chemical changes in white-rot degraded beech wood by pyrolysis—Gas chromatography and Fourier-transform infrared spectroscopy. J. Anal. Appl. Pyrolysis 1991, 21, 147–162. [Google Scholar] [CrossRef]
  37. Boeriu, C.; Bravo, D.; Gosselink, R.J.A.; van Dam, J.E.G. Characterisation of structure-dependent functional properties of lignin with infrared spectroscopy. Ind. Crop. Prod. 2004, 20, 205–218. [Google Scholar] [CrossRef]
  38. Mohebby, B. Attenuated total reflection infrared spectroscopy of white-rot decayed beech wood. Int. Biodeterior. Biodegrad. 2005, 55, 247–251. [Google Scholar] [CrossRef]
  39. Faix, O. Classification of Lignins from Different Botanical Origins by FT-IR Spectroscopy. Holzforschung 1991, 45, 21–28. [Google Scholar] [CrossRef]
  40. Blomberg, J.; Persson, B.; Bexell, U. Effects of semi-isostatic densification on anatomy and cell-shape recovery on soaking. Holzforschung 2006, 60, 322–331. [Google Scholar] [CrossRef]
  41. Horie, V. Materials for Conservation: Organic Consolidants, Adhesives and Coatings, 2nd ed.; Butterworth-Heinemann: Oxford, UK, 2010. [Google Scholar]
  42. Kavvouras, P.K.; Kostarelou, C.; Zisi, A.; Petrou, M.; Moraitou, G. Use of Silanol-Terminated Polydimethylsiloxane in the Conservation of Waterlogged Archaeological Wood. Stud. Conserv. 2009, 54, 65–76. [Google Scholar] [CrossRef]
Figure 1. Areas sampled for infrared analyses: ‘outer surface’, ‘inner surface’, ‘core edge’ and ‘core centre. For Py-GC/MS, only ‘inner surface’ and ‘core centre’ were analysed. These depths were used to evaluate penetration of the polymer.
Forests 12 00911 g001
Figure 2. Samples used for wood characterization after oven-drying. Images show variability in samples: (a) nr. 52 has a knot (dark spot on upper left corner), 54 shows cross-grained cracking after freeze-drying or oven-drying. (b) nr. 53 has orange staining on it transverse section, possibly iron compounds. Additionally, note that the annual rings are not aligned with sample sides. (c) nr. 56 shows cross-grained cracking after freeze- or oven-drying.
Forests 12 00911 g002
Figure 3. Infrared spectra of archaeological wood, untreated specimen nr. 47 (green curve), ethyl acetate-treated control nr. 37 (blue curve) and sound pine (red curve). Main differences are highlighted at indicated bands.
Forests 12 00911 g003
Figure 4. Specimens treatment with 30% lignins P1000, FB01 (w/v) and the control (ethyl acetate-immersed) after air-drying. Specimens 12, 24 and 37 are also shown after they were cut in half for sampling.
Forests 12 00911 g004
Figure 5. % Dimensional change plotted as % tangential change (y-axis) vs. % radial change (x-axis). (a) Controls, where only data points with largest changes are labelled; (b) 30% concentrations of P1000 and FB01 lignins. Data points are labelled with specimen number.
Forests 12 00911 g005
Figure 6. SEM images of the transverse faces of ethyl acetate-immersed sample 37 (control) on the left panel and of sound pine on the right panel. The upper right image shows the earlywood of sound pine, and the bottom right shows latewood cells of sound pine. The lower left image, which magnifies a region of latewood, shows the spongy nature of the secondary walls (arrows) in the archaeological sample.
Forests 12 00911 g006
Figure 7. SEM images of the transverse faces of 30% P1000-treated sample 9. The left image is taken from the outer edge and the right image from the core of the sample. The spongy nature of the secondary walls appears to be reduced in the surface and only slightly reduced in the core, compared to the untreated reference shown in Figure 6. This may be attributed to the polymer within the cell walls in the surface.
Forests 12 00911 g007
Figure 8. SEM images of the transverse faces of 30% FB01-treated sample 21. The left image is taken from the outer edge and the right image from the core of the sample. The spongy nature of the secondary walls appears to be reduced in both the surface and core, compared to the untreated reference shown in Figure 6. This may be attributed to the polymer within the cell walls.
Forests 12 00911 g008
Figure 9. Chromatographic profiles obtained by Py(HMDS)-GC/MS (a) archaeological pine (specimen 47) and (b) archaeological pine treated with FB01 (specimen 22). Lignin pyrolysis products, which were very low or absent in archaeological pine, were used to evaluate lignin penetration in test specimens. These are labelled in red script. Peak numbers refer to Table 2.
Forests 12 00911 g009
Figure 10. Distribution of (a) S-, G- and H-lignin units as percentages of lignin pyrolysis products identified in archaeological pine specimens treated with ethyl acetate (archeo AcOEt) and with P1000 and FB01 lignins, (b) S-lignin and H-lignin units as percentages of lignin pyrolysis products determined in P1000 and FB01 treated specimens are very low or absent in archaeological pine (products in red script in Table 2). Relative abundance is expressed as a percentage of total wood.
Forests 12 00911 g010
Figure 11. Comparing lignins to ethyl acetate-treated archaeological wood (nr. 37). Infrared spectra of lignin P1000 (red curve), FB01 (purple curve) and of wood (blue curve) were baseline corrected and normalized at 1028 cm−1. The band height used to measure extent of penetration of lignins into the wood samples is shown at 1327 cm−1.
Forests 12 00911 g011
Figure 12. Comparing infrared spectra of 30% P1000-treated specimen 12 from different depths. Bands at 1328 cm−1 were measured. The ethyl acetate-treated control is shown in the red curve (nr. 37). The image shows ‘outer surface’ (purple), ‘inner surface (green), ‘core edge’ (pink) and ‘centre core’ (orange). All spectra were baseline corrected and normalized to 1028 cm−1.
Forests 12 00911 g012
Figure 13. Comparing infrared spectra of 30% FB01-treated specimen 24 from different depths to assess penetration from outside to inner core by measuring band heights at 1328 cm−1. The ethyl acetate-treated control (nr. 37) is shown in the red curve. The image shows ‘outer surface’ (orange), ‘inner surface (purple), ‘core edge’ (black) and ‘core centre’ (blue). All spectra were baseline corrected and normalized to 1028 cm−1.
Forests 12 00911 g013
Figure 14. Comparing band heights measured from infrared spectra for 30% concentrations. The band heights from each depth were averaged for each treatment group (4 replicates): ‘outer surface’, ‘inner surface, ‘core edge’ and ‘core centre’.
Forests 12 00911 g014
Table 1. Specimens in each polymer, solvent or control group. Analysis methods are also indicated for each specimen.
Polymer/SolventSampleAnalysis
FTIRPy-GC/MSSEM
30% P1000 (w/v)9xxx
10xx
11xx
12xx
30% FB01 (w/v)21xxx
22xx
23xx
24xx
ethyl acetate control37xxx
38x
39
40
41x
no treatment, control47xx
48x
49x
50x
51x
oven-dry for characterization52x
53x
54x
55x
56x
Table 2. Pyrolysis products identified by Py-GC/MS. Fragment ions’ mass-over-charge ratios (m/z) are also shown, where the m/z in bold indicates the main ion. Compounds were categorized, where H—holocellulose, L—lignin, lignin units: p-hydroxyphenyl (H-lignin), guaiacyl (G-lignin) and syringyl (S-lignin). Lignin pyrolysis products in red script were identified in lignin preparations (P1000, FB01). These were either very low or absent in archaeological pine and were used to evaluate lignin penetration in test specimens.
CompoundFragment Ions (m/z)CategoryOrigin
11,2-dihydroxyethane (2TMS)73, 103, 147, 191small moleculesH/L
22-hydroxymethylfuran (TMS)53, 73, 81, 111, 125, 142, 155, 170furanH
3phenol (TMS)75, 151, 166short chainH-lignin
42-hydroxypropanoic acid (2TMS)73, 117, 147, 190small moleculesH/L
52-hydroxyacetic acid (2TMS)73, 147, 177, 205small moleculesH/L
61-hydroxy-1-cyclopenten-3-one (TMS)53, 73, 81, 101, 111, 127, 155, 169cyclopentenoneH
73-hydroxymethylfuran (TMS)53, 75, 81, 111, 125, 142, 155, 170furanH
8o-cresol (TMS)73, 91, 135, 149, 165, 180short chainH-lignin
92-furancarboxylic acid (TMS)73, 95, 125, 169, 184furanH
10unknown I73, 152, 167small moleculesH
11m-cresol (TMS)73, 91, 165, 180short chainH-lignin
122-hydroxy-1-cyclopenten-3-one (TMS)53, 73, 81, 101, 111, 127, 155, 170cyclopentenoneH
13p-cresol (TMS)73, 91, 165, 180short chainH-lignin
143-hydroxy-(2H)-pyran-2-one (TMS)75, 95, 125, 151, 169, 184pyranH
15unknown II59, 73, 85, 101, 115, 131, 159small moleculesH
16unknown III59, 73, 85, 103, 115, 129, 145, 173, 188small moleculesH
17Z-2,3-dihydroxy-cyclopent-2-enone (TMS)59, 73, 115, 143, 171, 186cyclopentenoneH
18E-2,3-dihydroxy-cyclopent-2-enone (TMS)75, 101, 143, 171, 186cyclopentenoneH
191,2-dihydroxybenzene (TMS)75, 91, 136, 151, 167, 182hydroxybenzeneH/L
203-hydroxy-(4H)-pyran-4-one (TMS)75, 95, 139, 151, 169, 184pyranH
215-hydroxy-2H-pyran-4(3H)-one (TMS)59, 75, 101, 129, 143, 171, 186pyranH
222-hydroxymethyl-3-methy-2-cyclopentenone (TMS)73, 103, 129, 173, 183, 198cyclopentenoneH
231-hydroxy-2-methyl-1-cyclopenten-3-one (TMS)73, 97, 125, 139, 169, 184cyclopentenoneH
241-methy-2-hydroxy-1-cyclopenten-3-one (TMS)73, 97, 125, 139, 169, 184cyclopentenoneH
251,3-dihydroxyacetone (2TMS)73, 103, 147, 189, 219small moleculesH/L
26guaiacol (TMS)73, 151, 166, 181, 196short chainG-lignin
27ethyl phenol TMS73, 135, 179, 194short chainH-lignin
283-hydroxy-6-methyl-(2H)-pyran-2-one (TMS)73, 109, 139, 168, 183, 198pyranH
29vinyl phenol (TMS)73, 151, 177, 192short chainH-lignin
302-methyl-3-hydroxy-(4H)-pyran-4-one (TMS)73, 101, 153, 183, 198pyranH
312-methyl-3-hydroxymethyl-2-cyclopentenone (TMS)73, 103, 129, 173, 183, 198cyclopentenoneH
322,3-dihydrofuran-2,3-diol (2TMS)73, 147, 231, 246furanH
332-furyl-hydroxymethylketone (TMS)73, 81, 103, 125, 183, 198furanH
345-hydroxymethyl-2-furaldehyde (TMS)73, 81, 109, 111, 139, 169, 183, 198furanH
354-methylguaiacol (TMS)73, 149, 180, 195, 210short chainG-lignin
361,2-dihydroxybenzene (2TMS)73, 151, 239, 254hydroxybenzeneH/L
372-hydroxymethyl-2,3-dihydropyran-4-one (TMS)73, 142, 170, 185, 200pyranH
381,4:3,6-dianhydro-α-D-glucopyranose (TMS)73, 103, 129, 155, 170, 171, 186anhydrosugarsH
39Z-2,3-dihydroxy-cyclopent-2-enone (2TMS)73, 147, 230, 243, 258cyclopentenoneH
40p-hydroxy benzaldehyde TMS73, 151, 179, 194carbonylH-lignin
414-methylcatechol (2TMS)73,180, 253, 268demethylatedG-lignin
424-ethylguaiacol (TMS)73, 149, 179, 194, 209, 224short chainG-lignin
43syringol (TMS)73, 153, 181, 196, 211, 226short chainS-lignin
441,4-dihydroxybenzene (2TMS)73, 112, 239, 354hydroxybenzeneH/L
45arabinofuranose (4TMS)73, 147, 217, 230 H
464-vinylguaiacol (TMS)73, 162, 177, 192, 207, 222short chainG-lignin
473-hydroxy-2-hydroxymethyl-2-cyclopentenone (2TMS)73, 147, 257, 272cyclopentenoneH
48E-2,3-dihydroxy-cyclopent-2-enone (2TMS)73, 147, 243, 258cyclopentenoneH
494-ethylcatechol (2TMS)73, 147, 179, 231, 267, 282demethylatedG-lignin
503-hydroxy-2-(hydroxymethyl) cyclopenta-2,4-dienone (2TMS)73, 147, 255, 270cyclopentenoneH
51eugenol (TMS)73, 147, 179, 206, 221, 236long chainG-lignin
524-methylsyringol (TMS)73, 167, 210, 225, 240short chainS-lignin
533-methoxy-1,2-benzenediol (2TMS)73, 153, 254, 269, 284demethylatedG-lignin
543,5-dihydroxy-2-methyl-(4H)-pyran-4-one (2TMS)73, 128, 147, 183, 271, 286pyranH
551,6-anydro-beta-D-glucopyranose (TMS at position 4)73, 103, 117, 129, 145, 155, 171anhydrosugarsH
561,6-anydro-beta-D-glucopyranose (TMS at position 2)73, 101, 116, 129, 132, 145, 155, 171anhydrosugarsH
57Z-isoeugenol (TMS)73, 179, 206, 221, 236long chainG-lignin
58vanillyl alcohol (2TMS)73, 151, 210, 253, 268, 283, 298long chainG-lignin
59vanillin (TMS)73, 194, 209, 224carbonylG-lignin
60methyl 4-hydroxy-3,5-dimethoxybenzoate TMS73, 223, 254, 269, 284esterS-lignin
611,2,3-trihydroxybenzene (3TMS)73, 133, 147, 239, 327, 342hydroxybenzeneH
624-ethylsyringol (TMS)73, 191, 209, 224, 239, 254short chainS-lignin
63E-isoeugenol (TMS)73, 179, 206, 221, 236long chainG-lignin
641,4-anydro-D-galactopyranose (2TMS)73, 101, 116, 129, 145, 155, 171, 217anhydrosugarsH
651,6-anydro-D-galactopyranose (2TMS)73, 101, 116, 129, 145, 161, 189, 204, 217anhydrosugarsH
662-hydroxymethyl-5-hydroxy-2,3-dihydro-(4H)-pyran-4-one (2TMS)73, 129, 147, 155, 183, 273, 288pyranH
674-vinylsyringol (TMS)73, 179, 222, 237, 252short chainS-lignin
681,4-anydro-D-glucopyranose (2TMS at position 2 and 4)73, 101, 116, 129, 155, 191, 204, 217anhydrosugarsH
691,2,4-trihydroxybenzene (3TMS)73, 133, 147, 239, 327, 342hydroxybenzeneH
70acetovanillone (TMS)73, 193, 208, 223, 238carbonylG-lignin
714-hydroxy benzoic acid (2TMS)73, 147, 193, 223, 267, 282acidH-lignin
721,6-anydro-beta-D-glucopyranose (2TMS at position 2 and 4)73, 101, 116, 129, 155, 191, 204, 217anhydrosugarsH
73propenyl-syringol (TMS)73, 205, 236, 251, 266long chainS-lignin
741,4-anydro-D-galactopyranose (3TMS)73, 129, 147, 157, 191, 204, 217, 243, 332anhydrosugarsH
75syringaldehyde (TMS)73, 224, 239, 254carbonylS-lignin
762,3,5-trihydroxy-4H-pyran-4-one (3TMS)73, 133, 147, 239, 255, 270, 330, 345, 360pyranH
771,6-anydro-beta-D-glucopyranose (3TMS)73, 103, 129, 147, 191, 204, 217, 243, 333anhydrosugarsH
781,4-anhydro-D-glucopyranose (3TMS)73, 103, 129, 147, 191, 204, 217, 243, 332anhydrosugarsH
79E-propenylsyringol (2TMS)73, 205, 236, 251, 266long chainS-lignin
801,6-anydro-beta-D-glucofuranose (3TMS)73, 103, 129, 147, 191, 204, 217, 243, 319anhydrosugarsH
81vanillic acid (2TMS)73, 253, 282, 297, 312acidG-lignin
82acetosyringone (TMS)73, 223, 238, 253, 268carbonylS-lignin
83vanillylpropanol (2TMS)73, 179, 206, 221, 236, 311, 326long chainG-lignin
84Z-coniferyl alcohol (2TMS)73, 204, 252, 293, 309, 324monomerG-lignin
85coumaryl alcohol (2 TMS)73, 189, 205, 267, 279, 294monomerH-lignin
86coniferylaldehyde (TMS)73, 192, 220, 235, 250carbonylG-lignin
87syringic acid (2TMS)73, 253, 297, 312, 327, 342acidS-lignin
88E-coniferyl alcohol (2 TMS)73, 204, 252, 293, 309, 324monomerG-lignin
893,4-dihydroxy cinnamyl alcohol (3TMS)73, 205, 293, 355, 382demethylatedG-lignin
90E-synapyl alcohol (2TMS)73, 234, 323, 339, 354monomerS-lignin
91Ferulic acid (2TMS)73, 249, 308, 323, 338acidG-lignin
Table 3. Characterization of wood specimens by density and maximum moisture content. For the oven-dried specimens, density is based on oven-dried weight and waterlogged volume. For the specimens acclimatized to 50% RH and 20 °C, the density is based on weight at 50% RH and volume at 50% RH.
Specimen Nr.Density (g/cm3)Max MC, %
Archaeological pine, oven-dried
520.443140
530.431153
540.217393
550.225381
560.210410
Archaeological pine, freeze-dried, acclimatized to 50% RH, 20 °C
470.258
480.237
490.361
500.244
510.381
Table 4. Percentage composition of pine reference woods determined by Py-GC/MS, collected from external and internal parts of the cubes. H = holocellulose, L = lignin, H/L = ratio of holocellulose over lignin.
Sound PineArchaeological Pine UntreatedArchaeological Pine Ethyl Acetate Treated
Specimen/4737
H%60.749.940.1
L%39.350.159.9
H/L1.5410.67
Table 5. Overview of band assignments for infrared spectroscopy.
Band Position (cm−1)AssignmentReference
1738–1709C=O stretch in unconjugated ketones, carbonyls and in ester groups, frequently of carbohydrate origin; conjugated aldehydes and carboxylic acids absorb around and below 1700 cm−1[35]
1646conjugated C=O groups, mainly originating from lignin[36]
1635adsorbed water[35]
1605–1593aromatic skeletal vibrations plus C=O stretch[35]
1515–1505aromatic skeletal vibrations
1375–1374CH deformation vibration (cellulose)
1326syringyl plus guaiacyl ring condensed[37]
1270–1266G ring plus C=O stretch[35]
1235–1225OH plane deformation, also COOH
1230–1221C-C plus C-O plus C=O stretch; G-condensed > G-etherified
1162–1125C-O-C asymmetric valence vibration (cellulose)
1151C-O-C asymmetric valence vibration in cellulose and hemicelluloses[38]
1110–1107ring asymmetric valence vibration[35]
1024C-O stretch in cellulose and hemicelluloses; C-O of primary alcohol[38]
892C-H deformation in cellulose; C1 group frequency in cellulose and hemicelluloses
835–834C-H out-of-plane in position 2 and 6 of S and in all positions of H units[39]
832–817C-H out-of-plane in positions 2, 5 and 6 of G units
Table 6. Changes in weight relative to start weight.
Polymer/SolventSampleBefore Treatment (g) *After Treatment (g) *% Change Relative to StartComment
30% P1000 (w/v)92.15802.436912.9
102.21112.609918.0hard to cut
113.53353.87349.6hard to cut
122.18902.610119.2
30% FB01 (w/v)212.11473.554168.1
222.35843.805761.4very hard to cut
233.79854.681923.3very hard to cut
242.18443.604465.0
ethyl acetate control372.25832.2555−0.1easy to cut
382.57202.5306−1.6easy to cut
394.22034.1607−1.4orange end grain (corrosion)
402.17032.1559−0.7easy to cut
415.18354.5726−11.8knot
* weight after freeze-drying and conditioning at 50% RH, 20 °C.
Table 7. Dimensional change in samples relative to before treatment. ‘Rad’ is the distance in the radial direction, and ‘Tan’ is the distance in the tangential direction on the transverse face.
Polymer/SolventSampleBefore Treatment (Dry State)After Impregnation and Drying% Change Relative to Start
(mm)(mm)
RadTanRadTanRadTan
30% P1000 (w/v)97.978.748.048.860.91.4
108.9910.399.0610.440.80.5
116.1910.256.2010.310.20.6
128.7710.668.8610.681.00.2
30% FB01 (w/v)217.6412.497.6812.480.5−0.1
229.1210.769.1510.710.3−0.5
239.4010.199.4010.140.0−0.5
249.009.679.548.976.0−7.2
ethyl acetate control377.0611.657.2011.682.00.3
386.508.536.458.41−0.8−1.4
398.267.368.337.390.80.4
409.3011.409.3111.450.10.4
418.724.588.745.590.222.1
no treatment, control479.289.539.389.551.10.2
4810.4011.1710.3811.26−0.20.8
495.107.915.157.891.0−0.3
506.1210.406.1510.340.5−0.6
5111.1713.7211.0813.36−0.8−2.6
oven-dry for characterization5212.2813.0111.6512.16−5.1−6.5
539.0915.038.3913.96−7.7−7.1
5410.3213.049.9612.38−3.5−5.1
5510.4415.369.9814.30−4.4−6.9
5613.9214.8313.5414.28−2.7−3.7
Table 8. Percentage composition of pine determined by Py-GC/MS. The average values were obtained from four specimens analysed for each P1000 and FB01. Here, the percentages are based on total pyrolysis products identified, including those from the impregnating materials.
Specimens Treated with P1000 Specimens Treated with FB01
Core Centre Inner Surface Core Centre Inner Surface
H%41.335.533.625.9
L%58.764.566.474.1
H/L0.7 ± 0.13 0.6±0.090.5 ± 0.030.4 ± 0.04
H-lignin6.8 8.310.813.7
S-lignin12.321.926.634.1
G-lignin81.069.862.652.1
S/G0.2 ± 0.010.3 ± 0.04 0.4 ± 0.070.7 ± 0.10
Publisher’s Note: MDPI stays neutral with regard to jurisdictional claims in published maps and institutional affiliations.

