Abstract
In natural environments, plants develop adaptive mechanisms at the cellular and molecular levels to cope with many external factors, e.g., insects and soil pathogens. We studied physiological stress induced by different levels of foliage removal (defoliation 30% and 60%) and by infection of root rot pathogen Phytophthora plurivora on the common Polish tree species, Betula pendula, grown in an open greenhouse. This study showed that P. plurivora damaged the root system which negatively impacted all morphological parameters. However the loss of 30% of the leaves had a positive effect on defense responses. Chlorophyll-a fluorescence parameters indicated a decrease in photosynthetic efficiency in defoliated plants, but plants inoculated with the pathogen had a higher performance index showing increased vigor of the infected plant than birches. The study demonstrated the intense immunity response of birch to P. plurivora through the expression of Hsp90 and Hsp83 genes. The trees weakened by P. plurivora became more susceptible to infection by Erysiphe ornata var. ornata.
1. Introduction
Silver birch (Betula pendula Roth.) is a common deciduous tree species in the temperate and boreal climates of the Northern Hemisphere [1]. The varied ecotype conditions impact Silver birch trees growing in forests by exposing them to different biotic and abiotic stresses that negatively affect tree growth and development [2].
Infections caused by pathogenic fungi are significant biotic factors leading to the phenomenon of birch dieback [3]. Phytophthora species are important plant pathogens that infect many forest, ornamental, and crop plants [4]. Phytophthora pathogens cause over 66% of all fine root diseases and 90% of all collar rot [5]. One of the most common species of pathogens in the genus Phytophthora is Phytophthora plurivora (T. Jung & T.I. Burgess) [6]. Its zoospores are easily dispersed along aquatic systems in agriculture and forestry and transmitted by birds during their migration [7]. The first reports of P. plurivora infecting birch in the wild came from Finland [8]. In Poland, P. plurivora has caused significant damage to oak stands in the east and south of the country, mainly at Krotoszyn Plateau [9]. In addition, there are reports on the negative impact of P. plurivora on the loss of infected plant roots [10,11]. At the same time, there is no information on defense responses that occur at the level of gene expression, photosynthetic activity, and susceptibility to other pathogens.
There is also insufficient data on the effect of defoliation on the above mechanisms. Insect feeding weakens trees and may increase the possibility of pathogen invasion. Various primary insects often attack birch trees, the most common being Eriocrania spp, Lymantria dispar (L.), Deporaus betulae (L.), Phyllobius betulae F., Ph. arborator, and Scolioneura betuleti Zdd [12]. Defoliation of birch crowns by Lymantria dispar (L.) can cause a reduction in immunity and is the most common cause of infection with the pathogen Erwinia multivora (Scz.-Parf.) [13].
Plants routinely face various biotic (e.g., nematodes, herbivores, and pathogens) stresses, sometimes simultaneously. Plant responses to the cumulative impact of several different biotic stressors are often synergistic and cannot be extrapolated directly from combining the responses to each individual stressor, so it is important to characterize plant acclimation responses to a combination of biotic stressors [14]. Examining the cumulative impact of stressors and their effect on survival and productivity is important because the plant has a network of interconnected cellular stress response systems [15]. A thorough understanding of this network is important for developing new methods to improve plant stress tolerance. Overall, pathogen infection and defoliation cause a number of changes in morphology, physiology, biochemical and molecular processes. Heat shock proteins (Hsps) play an extensive role in many cellular processes, giving them a general role in tolerance to different environmental stress treatments. Maintaining proteins in their functional conformation and preventing aggregation of non-native proteins are particularly important for cell survival under stress [16,17,18]. Under stress, these stress-responsive biomolecules act as molecular chaperones through up- or down-regulation [19,20]. Stress has a significant impact on the expression of Hsp [20,21,22]. Increased expression of the Hsp genes has been observed in birch (Betula platyphylla (Sukaczev) exposed to drought stress [23]. To assess the molecular response to plant damage caused by phytopathogens, we examined the expression of two selected Hsp genes, Hsp90 and Hsp83.
To evaluate the level of damage caused by defoliation and infection, we analyzed сhlorophyll fluorescence to detect changes in the photosynthetic apparatus. The chlorophyll fluorescence technique is a rapid and economical method for measurements of photosynthetic activity of plants without disturbing or destroying the structure of the studied object [24].
To examine the presence or absence of synergies or cumulative effects of multiple biotic stressors, we tested the impact of one soil-borne pathogen, P. plurivora, on seedlings of silver birch (B. pendula) subjected to stress caused by mechanical defoliation, simulating primary insect feeding. We compared expectations of synergy in the impact on seedling growth and physiological performance (H1) against the absence of any multiplicative, countervailing, or otherwise nonlinear influences, i.e., the total effects were a linear summation of the individual, single-factor effects (H0).
2. Materials and Methods
2.1. General Experiment Design
Two-year-old seedlings of silver birch (Betula pendula Roth.) served as study materials. The seedlings were planted in pots and grown under semi-natural conditions, in an open greenhouse in the Forest Research Institute in Sękocin Stary (Poland) (52°06′03.4″ N 20°52′56.5″ E). In spring 2018, 60 trees were infected with P. plurivora NCBI KX618501; the inoculum was identified according to the methodology of Jung et al. [25]. We manually removed leaves to mimic 30% and 60% insect infestation. In the second growing season (2019), to stimulate sporangia, we flooded the pots with seedlings with water for 72 h and repeated the defoliation. The experiment has six treatments with 20 replicates each:
- Control—uninfected and non-defoliated trees
- P. plurivora—plants infected with pathogen P. plurivora without defoliation;
- P. plurivora + defoliation 30%—pathogen P. plurivora infected plants slightly stressed caused by removing 30% of the leaves;
- P. plurivora + defoliation 60%—pathogen P. plurivora infected plants with severe stress caused by removing 60% of the leaves;
- Defoliation 30%—uninfected plants and slightly stressed caused by removing 30% of the leaves, and
- Defoliation 60%—uninfected plants and severely stressed caused by removing 60% of the leaves.
2.2. Verification of the Infection of the Seedlings
In October 2019, soil samples were collected from each variant, and qPCR assays were performed to verify the presence of the pathogen P. plurivora. We extracted DNA from rhizospheric soil and root tissues using NucleoSpin Soil Mini Kit (Macherey-Nagel, Duren, Germany) according to the manufacturer’s instructions. DNA was eluted in 50 μL H2O for each sample, and the extracted DNA was stored at −20 °C.
We confirmed the presence of P. plurivora in the soil using real-time PCR with species-specific primers for P. plurivora, i.e., P. plurivora-f, P. plurivora-r, and probe P. plurivora-probe (Sigma-Aldrich, St. Louis, MO, USA) (Table 1) [26].

Table 1.
List of primers.
Real-time PCR was performed in a total volume of 20 µL and consisted of 10 μL LuminoCt (Sigma-Aldrich, St. Louis, MO, USA), 2 μL of forward and reverse 0.5 μM primers, 1 μL 0.5 μM probe, 2 μL DNA, 7 μL water. PCR amplification was performed using the 7500 Real-Time PCR system (ThermoFisher Scientific, Waltham, MA, USA). Thermocycling conditions consisted of initial denaturation at 95 °C for three minutes, and 40 cycles of 95 °C for 30 s, 55 °C for 30 s, and 72 °C for 30 s.
2.3. Biometric Parameters
At the end of the experiment, in October 2019, all plants were removed from the pots. We measured the stem length and the diameter at the root collar. The stems were separated from the roots and collected in labeled envelopes. The stems were dried in the Termaks Series 2000 cabinet at a temperature of 60 °C for 72 h.
2.4. Measurement of the Root Systems
To thoroughly clean the roots, they were first floated (about 60 min) in large containers (50 L) filled with 3/4 of their volume with tap water. When the adhered soil to the fine roots was softened and dissolved, they were washed under a light stream of water. The clean roots were placed in EPSON Perfection V700 scanner Photo Scanner, and the image files generated were processed using WinRHIZO 32-bit software (Regent Instruments Inc., Ltd., Quebec, QC, Canada). It was necessary to spread the roots properly in the scanner to avoid overlapping and crossing. We replaced the water in the scanner’s water pool after each measurement to avoid contamination of the subsequent samples.
We measured the following parameters:
- TRL—total root length;
- MRL—length of the mother roots (2–5 mm);
- FRL—length of fine roots (0–2 mm), and
- FRSA—area of fine roots.
2.5. Chlorophyll Fluorescence
Photosynthetic efficiency was assessed by measuring chlorophyll fluorescence parameters, which can provide detailed information about the state of the photosystem II (PSII) [28]. Measurements were performed using a Handy PEA (Handy Plant Efficiency Analyzer) fluorimeter, following instructions from Hansatech Instruments Ltd. (King’s Lynn, Norfolk, UK). Measurements were performed twice: immediately after defoliation (1 May 2019) and five months later (27 September 2019). Five randomly selected leaves from each tree and in each treatment were used for chlorophyll fluorescence measurements. The first step was to adapt the leaves to darkness with light leaf clamps for 30 min. After dark adaptation, a single strong 1 s light pulse (3500 µmol/m2/s) was applied to the leaf using three light-emitting diodes (650 nm). All elements were normalized to the control treatment. We examined several photosynthetic parameters: the total performance index of photosystem II (PI total), the time at which the maximum fluorescence value was reached (Tfm), the initial fluorescence representing the emission by excited chlorophyll molecules in the antenna structure of the photosystem II (Fo), the maximum fluorescence value (Fm), variable fluorescence (Fv), the maximum photochemical quantum yield of PSII (Fv/Fm), the area across the fluorescence curve between Fo and Fm (Area), ABS/RC—absorption flux (of antenna Chls) per RC, TR0/RC—trapped energy flux (leading to QA reduction) per RC, ET0/RC—electron transport flux (further than QA−) per RC, DI0/RC—total energy dissipated per reaction center [28].
The maximum quantum yield of PSII (Fv/Fm) shows the probability that a trapped photon will end up in the reaction center and cause a photochemical event. The value of Fv/Fm for unstressed leaves is about 0.83 [29]. Variable fluorescence Fv was calculated by subtracting the Fo value from the Fm value. The lower value of the Fv parameter, the lower the PSII performance [30].
Parameter Area is the area above the Chl fluorescence curve between Fo and Fm, and it quantifies the pool of electron transporters in the electron transport chain. This parameter displays any change in the shape of the induction kinetic between Fo and Fm, which would not be evident from the other parameters. A decrease in the parameter Area reveals blocking the electron transfer from the reaction centers to the quinone pool (for example, in herbicide action) [29].
Healthy plants channel part of the flux of absorbed photons (ABS) as trapping flux (TR) to the reaction center (RC), and other photons of this excitation energy are dissipated (DI), mainly as heat. An electron transport (ET) will be created within the reaction centers (RC) and further to PSI (RE), ultimately leading to CO2 fixation. These specific fluxes refer to the beginning of fluorescence induction (time zero): ABS/RC, TR0/RC, DI0/RC, and ET0/RC [31]. We focused on the total performance index (PI total) parameter because it essentially is an indicator of sample vitality. It indicates an internal force of the sample to resist constraints from outside [32].
2.6. Analysis of Heat Shock Proteins Gene Expression
To study the plant’s response to stress, two genes were selected—Hsp90 (KP245816.1) and Hsp83 (KP245815.1). A previous analysis of the cellular location of their encoded proteins using DeepLock software [33] found that they are in different areas in the cells. The protein Hsp90 is located in the cytoplasm, while Hsp83 in mitochondria or chloroplasts. Total RNA was extracted using Plant RNA Mini Kit (Syngen Biotech, Wrocław, Poland), following the manufacturer’s protocol. The total RNA extracted and its purification from protein and polysaccharides were determined using a NanoDrop 2000 spectrophotometer (Thermo Fisher Scientific, Waltham, MA, USA). RNA integrity was checked electrophoretically in a 1.5% agarose gel stained with ethidium bromide. Only samples that met both quality and integrity requirements were used in subsequent experiments. Three high-quality RNA samples (i.e., biological replicates) were obtained for each condition. Reverse transcription was performed using GoScriptTM Reverse Transcription System (Promega GmbH, Walldorf, Germany) according to the manufacturer’s instructions. Primers for analysis of Hsps gene expression were designed using Primer-BLAST [34] under default parameters. α-Tubulin (FJ228477.1) was used as a reporter gene in our experiment. Real-time PCR reactions were performed in 20 μL volume: 10 μL 2× qPCR SYBR Master Mix (Sigma Aldrich, Milwaukee, WI, USA), 2 μL cDNA, 2 µL each primers (5 µM forward and reverse) (Genomed, Poland), 6 µL H2O. Thermocycling conditions consisted of the initial denaturation step at 95 °C for 3 min and 40 cycles at 95 °C for 10 s, annealing at 55 °C for 20 s, and elongation at 72 °C for 20 s. Real-time PCRs were performed in Mic Real-Time PCR Cycler (Bio Molecular Systems, Australia). Based on obtained Ct values, the 2ΔΔCt method was used to calculate the relative ratio of Hsps’ expression, but the correct amplification efficiency was used instead of the value 2 [35]. We used a noise-resistant iterative nonlinear regression algorithm (Real-time PCR miner; www.miner.ewindup.info, accessed on 1 January 2005) to determine the efficiency of the PCR reaction [36].
2.7. Observation and Identification of Parasitic Organisms on Birch Leaves
As the plants grew, they were monitored for changes in health status like infections of leaves by unwanted parasitic microorganisms. The degree of fungal infection on leaves was assessed twice: in August (3 August 2019) and in September (15 September 2019) using a five-point powdery mildew damage scale [37] as follows:
- 0—healthy leaves (no symptoms),
- 1—little disease (25% of leaf surface),
- 2—medium disease (26% to 50% of leaf surface),
- 3—strong disease (51% to 75% of the leaf surface),
- 4—severe disease (more than 76% of the leaf surface).
At the same dates as the plant health observations (the appearance of fungal on the leaves), we removed samples of symptomatic birch leaves to identify the species of pathogens by Sanger sequencing using forward ITS1 and reverse ITS4 primers [27]. Samples taken on 3 August 2019 were marked M1, and those taken on 15 September 2019 marked as M2 and M3.
Genomic DNA extraction was performed using NucleoSpin Plant II Kit (Macherey-Nagel, Düren, Germany) following the manufacturer’s instructions. The 20 µL PCR mixture consisted of: buffer 2 μL, primers 2 μL, DNA 2 μL, dNTPs 4 μL, polymerase 1 μL, H2O 9 μL. Thermocycling conditions consisted of an initial denaturation step of 95 °C for 30 min, followed by 30 cycles of 95 °C for 30 s, 55 °C for 30 s, elongation at 72 °C for 30 s, and a final extension step. After purification of PCR products by Clean-Up (A&A Biotechnology, Poland), the obtained amplicons were sequenced with an ABI 3500 × L genetic analyzer (ThermoFisher Scientific, Waltham, MA, USA) following the manufacturer’s procedure. The species affiliation of the analyzed samples was determined using a BLAST algorithm.
2.8. Chemical Analysis of Birch Shoots Extracts
Birch shoots up to 5 mm in thickness were selected and into a 0.5 mm fraction to facilitate chemical analysis. Raw material (5 g) was extracted three times with 50 mL of diethyl ether and filtered through a paper filter. The solvent was removed using a rotary evaporator. Ether extract (10 mg) from birch shoots was dissolved with 1 mL of pyridine, 100 μL of BSTFA was added, and the sample was heated for 30 min at 60 °C, according to a previously developed method of silylation [38,39].
Silylated extract from birch shoots was analyzed with an Agilent 7890A gas chromatograph with an Agilent 5975C mass spectrometer. Injection of 1 μL sample was done using an autosampler. Chromatographic separation was performed on a capillary column HP-5MS (30 m, 0.25 mm, 0.25 μm) at a helium flow rate of 1 mL min−1. The injector worked in a split (1:10) mode at a temperature of 300 °C. The initial column temperature was 50 °C, rising to 325 °C, at 3 °C min−1, and the final temperature was held for 10 min. The detection was performed in a full scan mode from 41 to 800 amu, according to a previously developed method of GC-MS analysis [40,41,42].
For the identification of extracted compounds, both mass spectra and retention indices were used. After integration, the percentage content of each component in the total ion current (% of TIC) was calculated. All measurements for shoots extracts were performed in 3 replicates to determine the detection error.
2.9. Statistical Analysis
All responses were modeled as two-way factorial designs using Generalized Linear Mixed Models (GLMMs) that included the main effects of P. plurivora infection (yes/no) and defoliation level (0%, 30%, and 60%) and infection x defoliation interaction. A random heteroscedasticity component for each infection x defoliation combination was also included in all of the models. Each model utilized the appropriate conditional distribution of the response based on the response range. Specifically, TRL, MRL, FRL, FRSA, Root Collar, and Stem Dry Mass were modeled as Gamma with a log link, and the mildew damage scale was modeled as a cumulative logit link response or ordered logit [43].
All model prediction confidence bounds were controlled for family-wise experiment rate using the Sidak adjustment method with α = 0.05 [44]. Multiple comparisons were adjusted for the family-wise experiment rate using Tukey’s HSD method with α = 0.05 [45]. Data were analyzed using the R statistical environment version 4.0.5 (R Core Team, 2021) using R libraries glmmTMB [46], MASS [47], and emmeans [48].
3. Results
3.1. Detection of Phytophthora plurivora
A year after inoculation, the real-time PCR reaction confirmed the successful infection of plants by P. plurivora in the treatments: P. plurivora, P. plurivora + defoliation 30%, and P. plurivora + defoliation 60% (Ct for values ranged from 26.53 to 27.38). As expected, the Control, Defoliation 30%, and Defoliation 60% treatments yielded negative results (Ct > 40).
3.2. Biometric Parameters
The height of trees in infected and defoliated treatments was low compared to the control, but the differences were not statistically significant (p = 0.15) (Table S1 and Figure S1). The pathogen alone (p < 0.01) or in combination with both levels of defoliation (p = 0.04 and p < 0.01) negatively affected the diameters of the root collar, significantly decreasing its width compared to the control (Figure 1, Tables S2 and S3).
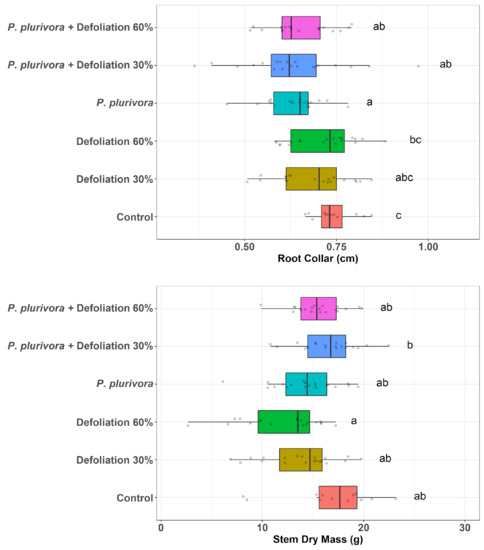
Figure 1.
Diameters of the root collar and dry biomass of stems. The lower and upper hinges correspond to the first and third quartiles (the 25th and 75th percentiles), and the center line corresponds to the median. The upper whisker extends from the upper hinge to the largest value no further than 1.5 * IQR from the hinge (where IQR is the inter-quartile range or distance between the first and third quartiles). Likewise, the lower whisker extends from the lower hinge to the smallest value no further than 1.5 * IQR from the hinge. Treatments with different letters in the notation are significantly different. Points were jittered in order to avoid overplotting of identical values.
The fresh biomass of non-leafy stems ranged from 12.96 to 18.1 g. After drying, the biomass decreased on average 1.25 g, compared to fresh biomass (data not shown). Stem dry biomass of severely defoliated trees (60%) without pathogen was significantly lower than the biomass of the P. plurivora infected trees with defoliation 30% (p = 0.01). However, treatments were not statistically different from the control.
3.3. Morphological Parameters of the Root System
Analysis of the 5 morphological roots parameters revealed a significantly negative impact of P. plurivora soil inoculation on the root system health (Figure 2, Figures S2–S5, Tables S4–S8). However, Defoliation 30% (without pathogen) did not cause significant changes of all monitored parameters compared to the control.
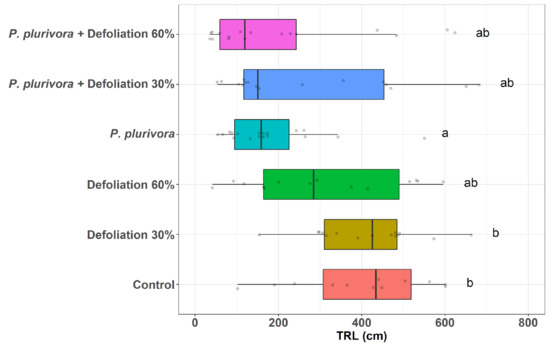
Figure 2.
Root morphology parameters depending on the treatments. Total root length. The lower and upper hinges correspond to the first and third quartiles (the 25th and 75th percentiles), and the center line corresponds to the median. The upper whisker extends from the upper hinge to the largest value no further than 1.5 * IQR from the hinge (where IQR is the inter-quartile range or distance between the first and third quartiles). Likewise, the lower whisker extends from the lower hinge to the smallest value no further than 1.5 * IQR from the hinge. Treatments with different letters in the notation are significantly different. Points were jittered in order to avoid overplotting of identical values.
Total root length (TRL) significantly decreased in treatments P. plurivora compared to the Defoliation 30% (p < 0.01) and control (p < 0.01). Graphs and tables with sample statistics for the length of the mother roots, length of fine roots, and fine root area are presented in the Supplementary Materials. The comparison of mother roots’ length (MRL) between all P. plurivora inoculated plants and treatment Defoliation 30% indicated statistically significant differences (p < 0.01) (Figure S1). The most severe effects of the pathogen were found on the fine roots. P. plurivora decreases fine root length (Figure S2) and fine root surface areas (FRSA) by 59% (Figure S3). Nevertheless, the combined impact of the pathogen and defoliation resulted in higher values of these growth parameters than the pathogen itself. Half of the treatment combinations—Defoliation 60% (p < 0.01), P. plurivora (p < 0.01), and P. plurivora + defoliation 60% (p < 0.01)—had significantly less root biomass than the control.
3.4. Chlorophyll-a Fluorescence Measurements
Measurement of chlorophyll fluorescence signals on birch trees after treatments of defoliation and root infection with P. plurivora pathogen were conducted in May, right after defoliation, and in September 2019. The results are displayed in Figure 3 and Figure 4 and expressed as a percentage of the control, with higher values indicating more efficient photosynthesis. Estimates and statistical comparisons are presented in Tables S9 and S10.
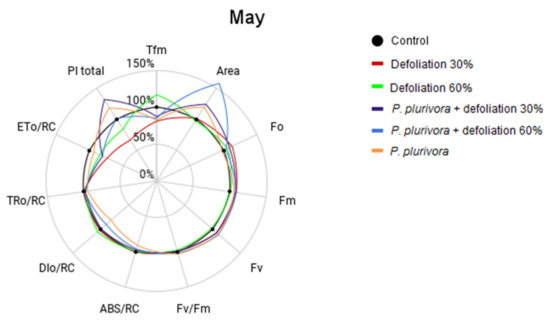
Figure 3.
Comparison of chlorophyll fluorescence parameters in different treatments in May. Parameters: PI total—the total performance index of photosystem II, Tfm—the time at which the maximum fluorescence value was reached, Fo—the initial fluorescence representing the emission by excited chlorophyll molecules in the antenna structure of the photosystem II, Fm—the maximum fluorescence value, Fv—variable fluorescence, Fv/Fm—maximum photochemical quantum yield of PSII, Area—the area across the fluorescence curve between Fo and Fm, ABS/RC—absorption flux of antenna Chls per RC (RC—reaction center), TR0/RC—trapped energy flux per RC, ET0/RC—electron transport flux per RC, DI0/RC—total energy dissipated per reaction center.
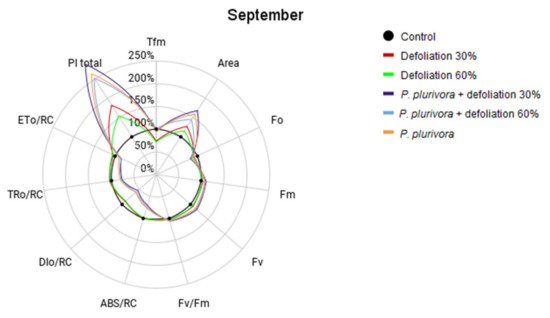
Figure 4.
Comparison of chlorophyll fluorescence parameters in different treatments in September. Parameters: PI total—the total performance index of photosystem II, Tfm—the time at which the maximum fluorescence value was reached, Fo—the initial fluorescence representing the emission by excited chlorophyll molecules in the antenna structure of the photosystem II, Fm—the maximum fluorescence value, Fv—variable fluorescence, Fv/Fm—maximum photochemical quantum yield of PSII, Area—the area across the fluorescence curve between Fo and Fm, ABS/RC—absorption flux of antenna Chls per RC (RC—reaction center), TR0/RC—trapped energy flux per RC, ET0/RC—electron transport flux per RC, DI0/RC—total energy dissipated per reaction center.
The measurement results obtained in May (Figure 3) showed the negative effects of defoliation by the values of the total performance index (PI total) in comparison to the control plants.
Total performance index parameter decreased by 35% for treatment Defoliation 30% and 17% for Defoliation 60%. However, treatments of P. plurivora with 30% defoliation and without defoliation demonstrated a positive response of the photosynthetic activity. PI total increased by 18% for P. plurivora itself and by 31% for combination P. plurivora + defoliation 30%. The difference between P. plurivora + defoliation 30% and Defoliation 30% was 66% (p < 0.01).
The treatments of defoliation 30% (p < 0.01) and defoliation 60% decreased their Fv/Fm by 2%, whereas P. plurivora and P. plurivora + defoliation 60% increased it by 2%. While Tfm for all treatments decreased compared to the control, Tfm for defoliation 60% increased by 17%. The rise in Fo was observed in all treatments, except for the treatment with P. plurivora alone. The Fm and Fv were higher than the control in all treatments. The value of the Area parameter increased in all P. plurivora infected trees, with the greatest effect for P. plurivora + defoliation 60%, increased by 57% in comparison to the control (p = 0.02). The specific energy fluxes in one of the active reaction centers ABS/RC, TR0/RC, ET0/RC, DI0/RC were decreased for treatments with P. plurivora. Parameter ABS/RC for P. plurivora treatment ABS/RC was 10% less than the control (p = 0.04), ET0/RC decreased by 20% for P. plurivora + defoliation 30% (p < 0.01) and for P. plurivora + defoliation 60% (p < 0.01).
The results of measurements carried out in September (Figure 4) point to an increase in the total performance index compared to May’s results.
The largest change was observed in the P. plurivora + defoliation 30%, increasing 158% over the control (p < 0.01). Moreover, in May, the total PI for defoliated trees without P. plurivora was lower than in the control group, while in September, they had higher results than the control group.
September’s results of the Tfm value decreased for the Defoliation 30% and Defoliation 60% (p = 0.01) groups but increased for P. plurivora, P. plurivora + defoliation 30%, and P. plurivora + defoliation 60% groups. The Fo slightly decreased in all groups. On the other hand, Fv/Fm increased compared to the results obtained five months ago. The parameters ABS/RC, TR0/RC, ET0/RC, DI0/RC for treatments with P. plurivora were still less than the values for the control group.
3.5. Heat Shock Protein Gene Expression Analysis
For the analysis of Hsp90, BpHsp90-f and BpHsp90-r were used, and for the analysis of Hsp83, BpHsp83-f and BpHsp83-r primer pairs were used. The primer pair for amplification of the tubulin gene was BpTub-f and BpTub-r. Each amplicon was found only in a single peak in melt curves indicating no dimer or multiple products.
Analysis of the expression of the Hsp90 gene in birch leaves showed that P. plurivora infection combined with 60% defoliation increased Hsp90 expression about seven times (Figure 5), though other combinations with P. plurivora were not higher than the control.
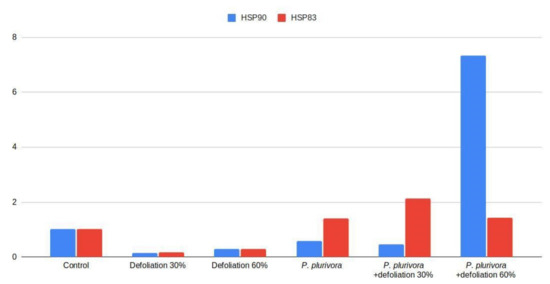
Figure 5.
Relative expression level of Hsp90 and Hsp83.
Birch root infection by P. plurivora in combination with partial loss of leaves (30% defoliation) led to a two-fold increase in the expression of the Hsp83 gene. Other treatments with P. plurivora also exhibited greater Hsp83 than the control. Stress caused by defoliation without the pathogen responded by down-regulation of both Hsp90 and Hsp83.
3.6. Interactions with Other Species of Pathogens on Birch Leaves
At the beginning of August 2019, symptoms of infestation by leaf parasites appeared on the leaves for the first time (Figure 6). Sequencing of ITS from sample M1 revealed that this sequence has 100% identity to Erysiphe ornata var. ornata (U. Braun) (HM057441.1). Erysiphe ornata var. ornata is a species of powdery mildew. The ITS sequence from sample M2, taken in September, also has 100% identity to Erysiphe ornata var. ornata. However, the ITS sequence from the sample M3 has 98.24% identity to Ampelomyces quisqualis (Ces.) (JX681067.1). A. quisqualis is a mycoparasite and the natural antagonist of powdery mildew fungi. Although the seedlings in all variants were infected by powdery mildew, birch trees inoculated with P. plurivora showed a much greater degree of damage (Figure 7, Table S11).
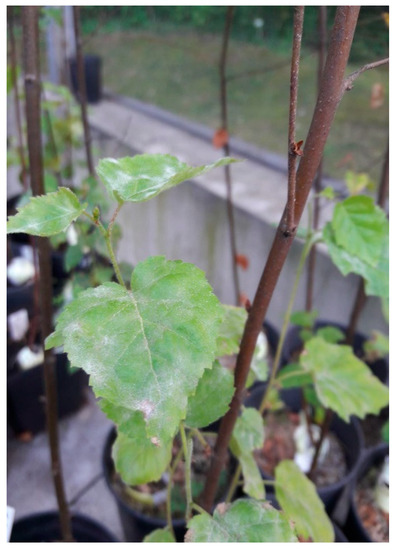
Figure 6.
Mildew on birch leaves.
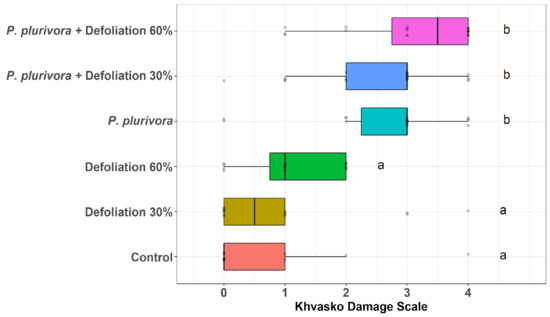
Figure 7.
The degree of leaf damage according to the Khvasko scale. The lower and upper hinges correspond to the first and third quartiles (the 25th and 75th percentiles), and the center line corresponds to the median. The upper whisker extends from the upper hinge to the largest value no further than 1.5 * IQR from the hinge (where IQR is the inter-quartile range or distance between the first and third quartiles). Likewise, the lower whisker extends from the lower hinge to the smallest value no further than 1.5 * IQR from the hinge. Points were jittered in order to avoid overplotting of identical values.
3.7. Chemical Composition of Birch Shoots Extracts in the Different Treatments
Birch shoots from P. plurivora + defoliation 60% treatment (6) had the highest flavonoid content but the lowest quantity of other phenolic compounds. Flavonoids, such as catechine, 3-methylluteoilin, 3,7-dimethylquercitin, santin, and cirsimaritin, were detected only in sample 6. Betuligenol and 1-docosyl p-coumarate were identified in all investigated extracts, while tyrosol and 2-(4-hydroxyphenyl) propionate in samples 1–5 solely (Table 2). Shoots subjected to defoliation 60% (3) were poorer in triterpenes and richer in sterols than the other variants of the experiment (1, 2, 4–6). 3,4-Seco-dammara-4(29),20(21),24(25)-trien-3-oic acid, dammaradien-3-one, dipterocarpol, and 3,4-seco-urs-4(23),20(30)-dien-3-oic acid were triterpenes with highest concentration. The main phytosterol was β-sitosterol (Table 2). Fatty acids + fatty acids esters, fatty alcohols, and alkanes content ranged from 13.79–39.73, 5.44–12.83, and 3.80–7.84, respectively (Table 2). In birch shoots extracts, volatile organic compounds, such as 2-methylpentane-2,4-diol, 2-phenylethanol, or linalool were also identified. Furthermore, all investigated samples contain glycerol and phytol (Table 2). Statistical comparison presents in Table S3.
Table 2.
The chemical composition of extracts from birch shoots in the treatments: Control (1), Defoliation 30% (2), Defoliation 60% (3), P. plurivora (4), P. plurivora + defoliation 30% (5), P. plurivora + defoliation 60% (6). More details are given in Table S12. Detection error does not exceed 5% of a given value.
4. Discussion
This work reveals silver birch fine root damage by P. plurivora and confirms earlier observations [8]. Necrosis of fine roots’ length and surface area are typical symptoms of Phytophthora root rot [49]. Tissues infected by Phytophthora show root rot which reduces proper absorption of water and nutrients [50]. Scars formed on maternal roots after the death of fine roots raise the risk of penetration of other microorganisms causing secondary infections [51]. There was a visible reduction of the diameters of the root collar in all the treatments with P. plurivora which may be explained by lesions spreading from the roots up to the root collar. The results of the fine root length and the fine root area suggest slight mitigation of the P. plurivora effect on the roots under 30% defoliation. Moreover, non-infected trees with defoliation 30% had the same or higher length of the root parameters than the control. One of the possibilities is that moderate stress induces plant resistance [40]. Considering the increasing aboveground biomass and the damaging effect on the underground mother root, the cumulative effect of both stressors could lead to a higher risk of tree failure. The attenuating effect of P. plurivora infection on growing stem biomass under defoliation could be explained by the observed activation of defense gene expression and increasing photosynthetic activity due to pathogen treatment.
Analysis of photosynthetic activity after 72 h immersion in water and defoliation revealed negative photosynthetic reactions to the defoliation and positive to the pathogen. The PI total parameter, which is essentially an indicator of tree vitality, was the lowest in defoliated trees without pathogens, but treatments with P. plurivora had higher values, which suggests some sort of compensation mechanism [31,52]. The presence of the pathogen significantly increases the photosynthetic activity of the plant compared to the control. Considering that P. plurivora consumes sugars produced by the tree in its parasitic activity, this is a positive response of the tree to the pathogen. On the other hand, defoliation reduces sugar production, which could mitigate the effects of the pathogen.
The high Tfm values in Defoliation 60% mean that a longer period of time is needed to reach a full reduction state of the primary electron acceptors that indicate a low tolerance to stress caused by loss of many leaves [53]. Besides, the high values of Fo of defoliated trees point to low efficiency of excitation energy transfer between chlorophyll molecules. They could be the result of the partial dissociation of chlorophyll in PSII [54]. The area above the fluorescence transient (Area) reflects the size of the plastoquinone pool. This Area variable for the plants which were infected by P. plurivora increased, indicating the presence of a larger quinone pool. Though this parameter was decreased in the case of the 60% defoliation plants, this might be involved in blocking the transport of electrons from reaction centers to the pool of plastoquinone [55]. However, September’s performance index results were higher in all treatments than May’s, indicating the adaptation of plants to stress over time. Additionally, plants have complex adaptive mechanisms at the cellular and molecular levels. Under stress, plants transcribe and translate heat shock proteins. Hsps’ genes from distinct plant species respond differently to various types of stress [22]. While their response to heat, cold, osmotic, and salt stress is relatively well studied [56,57], information about their response to pathogen infection is rather scarce. This study revealed an intense response of silver birch immune mechanisms to P. plurivora infections and defoliation by activating the expression of the Hsp90 and Hsp83 genes. The maximum level of expression for these genes as the response to the pathogen was observed in different treatments, Hsp90 dramatically increased in the group P. plurivora + defoliation 60%, and Hsp83 in the group P. plurivora + defoliation 30%. Phytopathogenic fungi of the genus Phytophthora have an impact on the expression of other Hsp genes. Phytophthora infestans ((Mont.) de Bary) led to up-regulation of Hsp70 genes and increased synthesis of Hsp70 proteins in tomatoes [58] and Solanum tuberosum (L.) [59], which indicates that it could participate in mediating the disease resistance in plants in response to biotic stresses. Lee et al. [60] investigated the mode of action of a P. infestans effector, Pi23226, which induces cell death in Nicotiana benthamiana (Domin), and found that the effector interacts with two isoforms of heat shock protein 70. Infection of avocado (Persea americana (Mill.)) by Phytophthora cinnamomi (Rands) downregulated 17.3-kDa small heat-shock protein [61]. Hsp90 also participates in plant disease resistance; together with the co-chaperones RAR1 and SGT1, Hsp90 modulates many cytosolic R proteins, such as MLA, RPM1, RPS2, and RPS4. Hsp90 activates cytosolic R protein, which contains a nucleotide-binding site (NB) and leucine-rich repeats (LRRs), mediating the defense of plants against many pathogens [62]. It was shown that the RXLR cytoplasmic effector AVR3a of P. infestans confers avirulence on potato plants carrying the R3a gene. R3a activation by AVR3aKI is dependent on the ubiquitin ligase-associated protein SGT1 and heat-shock protein Hsp90 [63]. Hsp90 also interacts with necrosis-inducing Nep1-like proteins (NLPs) [64].
The synthesis of biologically active substances by plants is an effective method to reduce the attack of insects and the spread of pathogens. Biochemical compounds, such as volatile substances (belonging to secondary metabolites produced by the synthesis of terpenes and phenylpropanoid compounds), as well as growth inhibitors and some hormones, are involved in plant defense responses to stress. Plants under the stress of defoliation generally reduce the production of sugars, proteins, starch, lignin, and hemicellulose while increasing the synthesis of secondary metabolites, including phenols, terpenes, and sterols [65]. Defoliation 60% increased the emission of sterols, fatty alcohols, fatty acids, and fatty acid esters; however, the contents of these substances in plants with a lower degree of defoliation (defoliation 30%) were similar to the control group. The combination of P. plurivora infection and defoliation increased the production of triterpenes, which was a defensive stress response. In previous research [66,67,68], we found that birch tissues contain different groups of biologically active substances, e.g., flavonoids, triterpenes, and sterols. We proved that birch tissues secrete VOC, such as 2-phenylethanol or linalool [69,70]. We detected that P. plurivora emits volatiles also [71]. Moreover, in previous investigations, we studied the effect of other species from the Phytophthora genus, i.e., P. cactorum [72,73], on the composition of bioactive compounds in birch shoots.
Additionally, weakening of birch immunity caused by infection of the roots by P. plurivora predisposes them to other diseases. The seedlings grew in the forest in the open air, in conditions close to natural, which made their leaves vulnerable to infections of other pathogens. In August, we observed the parasitic fungus Erysiphe ornata var. ornata on the leaves. This leaf parasite belongs to the group of biotrophic pathogens, which use nutrients obtained from the host plant, leading to the loss of carbohydrates and other substances in the plant [74]. As the level of damage by powdery mildew was significantly higher in the group plants with P. plurivora than control and defoliated-only trees, this may mean that P. plurivora increases susceptibility to other. Moreover, a month later, hyperparasite Ampelomyces quisqualis appeared, a natural biocontrol agent for powdery mildew.
5. Conclusions
This study demonstrates different responses to P. plurivora depending on degrees of defoliation. Defoliation of 60% leads to damage of the assimilatory apparatus and promotes pathogenic infection, while a lower degree of defoliation (defoliation 30%) seems to counteract the pathogen’s influence. The oomycete P. plurivora is a dangerous pathogen for silver birch, causing considerable damage to the root system. However, the combination of stress from P. plurivora and defoliation 30% results in a much healthier root morphology than trees infected with P. plurivora without defoliation or trees infected with P. plurivora in combination with 60% defoliation. Although defoliation significantly reduced total photosynthetic activity, the P. plurivora treatments still showed high vitality of the photosynthetic apparatus, as expressed by an increase in the total performance index (PI total).
We examined the molecular response to plant injury and found that defoliation-induced stress down-regulates, whereas P. plurivora infection caused up-regulates of Hsps’ gene expression. Exploring Hsp gene expression under a combination of different stresses was also one of our targets. We discovered that Hsps responded differently to various combinations of stressors. The highest expression of Hsp83 was obtained with P. plurivora + defoliation 30% treatment, and the highest expression of Hsp90 was obtained with P. plurivora + defoliation 60%. This outcome may also result from Hsps localized in the cytoplasm (Hsp90) and chloroplast (Hsp83) responding differently to stressors.
Moreover, defoliation 60% increased the production of sterols and fatty acids, fatty acid esters by 2.5-fold compared to the control group. The combination of defoliation with inoculation of P. plurivora increased the content of triterpenes. The highest content of flavonoids was found in the treatment P. plurivora + defoliation 60%.
In addition, we found the parasitic fungus Erysiphe ornata var. ornata on the leaves of all trees. Moreover, we also detected the presence of the hyperparasite Ampelomyces quisqualis on Erysiphe ornata var. ornata. To our knowledge, this is the first record of a host-parasite relationship between Erysiphe ornata var. ornata on Betula pendula and Ampelomyces quisqualis in Poland. However, we do not yet know whether this natural biological control agent can maintain the hyperparasite population at an adequate level.
This study documented the combined outcomes at the biochemical, physiological, and biochemical levels of simultaneous defoliation and fungal infection upon birch tree seedlings, a first of its kind. We confirmed our hypothesis that combined forest pest attacks created an effect that is not simply the linear summation of the individual stressors. Some of these harmful influences had immediate negative impacts, whereas others initially counteracted these negative impacts until the combined physiological toll overwhelmed the plant’s natural defenses. As more and more ecosystems face attacks from various biological organisms and abiotic influences such as warming climate and increasing drought, integrated studies such as this one which parses out the constituent influences upon plant health will become more and more valuable.
Supplementary Materials
The following are available online at https://www.mdpi.com/article/10.3390/f12070910/s1, Table S1. Height of the seedlings of silver birch, Table S2: Root collar diameter sample statistics, Table S3: Stem dry mass sample statistics, Table S4: Total root length sample statistics, Table S5: Mother roots length sample statistics, Table S6: Fine roots length sample statistics, Table S7: Fine root area sample statistics, Table S8: Root dry mass sample statistics, Table S9: Measurement values for parameters of chlorophyll fluorescence in May, Table S10: Measurement values for parameters of chlorophyll fluorescence in September, Table S11: Sample statistic of the degree of leaf damage according to the Khvasko, Table S12: Detailed chemical composition of extracts from birch seedling. Figure S1. Height of the seedlings of silver birch, Figure S2. Root morphology parameters depending on the treatment: MRL -length of the mother roots 2–5 mm), Figure S3. Root morphology parameters depending on the treatment: FRL—length of fine roots (0–2 mm), Figure S4. Root morphology parameters depending on the treatment: FRSA—fine root area, Figure S5. Root dry mass.
Author Contributions
Conceptualization, J.A.N., T.O. and D.B.; methodology, D.B., J.A.N., T.O. and T.M.; software, L.S.B. and D.B.; validation, D.B., T.O., T.M., M.S. and N.S.; formal analysis, D.B., T.M., M.S., L.S.B. and T.O.; investigation, D.B., T.O., T.M., M.S. and J.A.N.; resources, J.A.N., T.O., M.S. and A.M.; writing—original draft preparation, D.B., J.A.N., T.O. and T.M.; editing, W.K.M. and L.B.; supervision, D.B., T.O. and J.A.N.; project administration, T.O.; funding acquisition, M.S. and A.M. All authors have read and agreed to the published version of the manuscript.
Funding
This work was funded by the Ministry of Science and Higher Education through a Forest Research Institute statutory activity no. 240327.
Institutional Review Board Statement
Not applicable.
Informed Consent Statement
Not applicable.
Conflicts of Interest
The authors declare no conflict of interest. The funders had no role in the study’s design, in the collection, analyses, or interpretation of data, in the writing of the manuscript, or in the decision to publish the results.
References
- Hynynen, J.; Niemistö, P.; Viherä-Aarnio, A.; Brunner, A.; Hein, S.; Velling, P. Silviculture of Birch (Betula pendula Roth and Betula pubescens Ehrh.) in Northern Europe. For. Int. J. For. Res. 2010, 83, 103–119. [Google Scholar] [CrossRef]
- Silfver, T.H.; Roininen, H.; Oksanen, E.; Rousi, M. Genetic and Environmental Determinants of Silver Birch Growth and Herbivore Resistance. For. Ecol. Manag. 2009, 257, 2145–2149. [Google Scholar] [CrossRef]
- Green, S. Fungi Associated with Shoots of Silver Birch (Betula pendula) in Scotland. Mycol. Res. 2004, 108, 1327–1336. [Google Scholar] [CrossRef]
- Hansen, E.M.; Reeser, P.W.; Sutton, W. Phytophthora Beyond Agriculture. Annu. Rev. Phytopathol. 2012, 50, 359–378. [Google Scholar] [CrossRef] [PubMed]
- Jung, T.; Stukely, M.J.C.; Hardy, G.E.S.J.; White, D.; Paap, T.; Dunstan, W.A.; Burgess, T.I. Multiple New Phytophthora Species from ITS Clade 6 Associated with Natural Ecosystems in Australia: Evolutionary and Ecological Implications. Persoonia 2011, 26, 13–39. [Google Scholar] [CrossRef]
- Jung, T.; Burgess, T.I. Re-Evaluation of Phytophthora Citricola Isolates from Multiple Woody Hosts in Europe and North America Reveals a New Species, Phytophthora plurivora Sp. Nov. Persoonia 2009, 22, 95–110. [Google Scholar] [CrossRef]
- Malewski, T.; Brzezińska, B.; Belbahri, L.; Oszako, T. Role of Avian Vectors in the Spread of Phytophthora Species in Poland. Eur. J. Plant. Pathol. 2019, 155, 1363–1366. [Google Scholar] [CrossRef]
- Rytkönen, A.; Lilja, A.; Vercauteren, A.; Sirkiä, S.; Parikka, P.; Soukainen, M.; Hantula, J. Identity and Potential Pathogenicity of Phytophthora Species Found on Symptomatic Rhododendron Plants in a Finnish Nursery. Can. J. Plant Pathol. 2012, 34, 255–267. [Google Scholar] [CrossRef]
- Jankowiak, R.; Stępniewska, H.; Bilański, P.; Kolařík, M. Occurrence of Phytophthora plurivora and Other Phytophthora Species in Oak Forests of Southern Poland and Their Association with Site Conditions and the Health Status of Trees. Folia Microbiol. 2014, 59, 531–542. [Google Scholar] [CrossRef] [PubMed]
- Orlikowski, L.B.; Trzewik, A.; Ptaszek, M.; Orlikowska, T. Relationship between Source of Water, Occurrence, and Pathogenicity of Phytophthora plurivora. Acta Mycol. 2012, 47, 3–9. [Google Scholar] [CrossRef][Green Version]
- Corcobado, T.; Cech, T.L.; Brandstetter, M.; Daxer, A.; Hüttler, C.; Kudláček, T.; Jung, M.H.; Jung, T. Decline of European Beech in Austria: Involvement of Phytophthora spp. and Contributing biotic and Abiotic factors. Forests 2020, 11, 895. [Google Scholar] [CrossRef]
- Michalska, Z.; Myssura, M.; Walczak, U. Owady Minujące Gór Polski/Mining Insects of Polish Mountains. Wiadomości Entomol. 2010, 29, 73–82. [Google Scholar]
- Koltunov, E.V. Насекoмые-Фитoфаги Лесных Биoгеoценoзoв в Услoвиях Антрoпoгеннoгo Вoздействия. Available online: https://www.elibrary.ru/item.asp?id=26002068 (accessed on 9 May 2021).
- Foyer, C.H.; Rasool, B.; Davey, J.W.; Hancock, R.D. Cross-Tolerance to Biotic and Abiotic Stresses in Plants: A Focus on Resistance to Aphid Infestation. J. Exp. Bot. 2016, 67, 2025–2037. [Google Scholar] [CrossRef] [PubMed]
- Scharf, K.-D.; Berberich, T.; Ebersberger, I.; Nover, L. The Plant Heat Stress Transcription Factor (Hsf) Family: Structure, Function and Evolution. Biochim. Biophys. Acta Gene Regul. Mech. 2012, 1819, 104–119. [Google Scholar] [CrossRef] [PubMed]
- Wang, W.; Vinocur, B.; Shoseyov, O.; Altman, A. Role of Plant Heat-Shock Proteins and Molecular Chaperones in the Abiotic Stress Response. Trends Plant Sci. 2004, 9, 244–252. [Google Scholar] [CrossRef]
- Kotak, S.; Larkindale, J.; Lee, U.; von Koskull-Döring, P.; Vierling, E.; Scharf, K.-D. Complexity of the Heat Stress Response in Plants. Curr. Opin. Plant Biol. 2007, 10, 310–316. [Google Scholar] [CrossRef]
- Haq, S.U.; Khan, A.; Ali, M.; Khattak, A.M.; Gai, W.-X.; Zhang, H.-X.; Wei, A.-M.; Gong, Z.-H. Heat Shock Proteins: Dynamic Biomolecules to Counter Plant Biotic and Abiotic Stresses. Int. J. Mol. Sci. 2019, 20, 5321. [Google Scholar] [CrossRef]
- Zhang, B.; Pan, X.; Cobb, G.P.; Anderson, T.A. Plant MicroRNA: A Small Regulatory Molecule with Big Impact. Dev. Biol. 2006, 289, 3–16. [Google Scholar] [CrossRef]
- Hartl, F.U.; Bracher, A.; Hayer-Hartl, M. Molecular Chaperones in Protein Folding and Proteostasis. Nature 2011, 475, 324–332. [Google Scholar] [CrossRef]
- Khateeb, W.A.; Muhaidat, R.; Alahmed, S.; Zoubi, M.S.A.; Al-Batayneh, K.M.; El-Oqlah, A.; Gamar, M.A.; Hussein, E.; Aljabali, A.A.; Alkaraki, A.K. Heat Shock Proteins Gene Expression and Physiological Responses in Durum Wheat (Triticum durum) under Salt Stress. Physiol. Mol. Biol. Plants 2020, 26, 1599–1608. [Google Scholar] [CrossRef]
- Chaudhary, R.; Baranwal, V.K.; Kumar, R.; Sircar, D.; Chauhan, H. Genome-Wide Identification and Expression Analysis of Hsp70, Hsp90, and Hsp100 Heat Shock Protein Genes in Barley under Stress Conditions and Reproductive Development. Funct. Integr. Genom. 2019, 19, 1007–1022. [Google Scholar] [CrossRef] [PubMed]
- Wen, X.; Wang, J.; Zhang, D.; Wang, Y. A Gene Regulatory Network Controlled by BpERF2 and BpMYB102 in Birch under Drought Conditions. Int. J. Mol. Sci. 2019, 20, 3071. [Google Scholar] [CrossRef] [PubMed]
- Kalaji, M.H.; Goltsev, V.N.; Żuk-Gołaszewska, K.; Zivcak, M.; Brestic, M. Chlorophyll Fluorescence: Understanding Crop Performance—Basics and Applications, 1st ed.; CRC Press: Boca Raton, FL, USA, 2017; ISBN 9781315153605. [Google Scholar]
- Jung, T.; Blaschke, H.; Neumann, P. Isolation, Identification and Pathogenicity of Phytophthora Species from Declining Oak Stands. For. Pathol. 1996, 26, 253–272. [Google Scholar] [CrossRef]
- Nowakowska, J.A.; Malewski, T.; Tereba, A.; Oszako, T. Rapid Diagnosis of Pathogenic Phytophthora Species in Soil by Real-Time PCR. For. Pathol. 2017, 47, e12303. [Google Scholar] [CrossRef]
- White, T.J.; Bruns, T.; Lee, S.; Taylor, J. Amplification and Direct Sequencing of Fungal Ribosomal RNA Genes for Phylogenetics. In PCR Protocols; Innis, M.A., Gelfand, D.H., Sninsky, J.J., White, T.J., Eds.; Academic Press: San Diego, CA, USA, 1990; pp. 315–322. ISBN 9780123721808. [Google Scholar]
- Caligiani, A.; Tonelli, L.; Palla, G.; Marseglia, A.; Rossi, D.; Bruni, R. Looking beyond Sugars: Phytochemical Profiling and Standardization of Manna Exudates from Sicilian Fraxinus excelsior L. Fitoterapia 2013, 90, 65–72. [Google Scholar] [CrossRef]
- Banks, J.M. Continuous Excitation Chlorophyll Fluorescence Parameters: A Review for Practitioners. Tree Physiol. 2017, 37, 1128–1136. [Google Scholar] [CrossRef]
- Cetner, M.; Dąbrowski, P.; Samborska, I.; Łukasik, I.; Swoczyna, T.; Pietkiewicz, S.; Bąba, W.; Kalaji, H. Chlorophyll fluorescence measurements in environmental studies (Zastosowanie pomiarów fluorescencji chlorofilu w badaniach środowiskowych). Kosmos 2016, 65, 197–205. [Google Scholar]
- Živčák, M.; Brestič, M.; Olšovská, K.; Slamka, P. Performance Index as a Sensitive Indicator of Water Stress in Triticum aestivum L. Plant Soil Environ. 2008, 54, 133–139. [Google Scholar] [CrossRef]
- Kalaji, H.M.; Jajoo, A.; Oukarroum, A.; Brestic, M.; Zivcak, M.; Samborska, I.A.; Cetner, M.D.; Łukasik, I.; Goltsev, V.; Ladle, R.J. Chlorophyll a Fluorescence as a Tool to Monitor Physiological Status of Plants under Abiotic Stress Conditions. Acta Physiol. Plant 2016, 38, 1–11. [Google Scholar] [CrossRef]
- Armenteros, J.J.A.; Sønderby, C.K.; Sønderby, S.K.; Nielsen, H.; Winther, O. DeepLoc: Prediction of Protein Subcellular Localization Using Deep Learning. Bioinformatics 2017, 33, 3387–3395. [Google Scholar] [CrossRef]
- Ye, J.; Coulouris, G.; Zaretskaya, I.; Cutcutache, I.; Rozen, S.; Madden, T.L. Primer-BLAST: A Tool to Design Target-Specific Primers for Polymerase Chain Reaction. BMC Bioinform. 2012, 13, 134. [Google Scholar] [CrossRef] [PubMed]
- Livak, K.J.; Schmittgen, T.D. Analysis of Relative Gene Expression Data Using Real-Time Quantitative PCR and the 2−ΔΔCT Method. Methods 2001, 25, 402–408. [Google Scholar] [CrossRef] [PubMed]
- Zhao, S.; Fernald, R.D. Comprehensive Algorithm for Quantitative Real-Time Polymerase Chain Reaction. J. Comput. Biol. 2005, 12, 1047–1064. [Google Scholar] [CrossRef]
- Khvasko, A.V. Осoбеннoсти Развития Мучнистoй Рoсы Дуба в Услoвиях Беларуси и Усoвершенствoвание Защитных Мерoприятий[Peculiarities of Oak Powdery Mildew in the Conditions of Belarus and Improvement of Protective Measures]. Ph.D. Thesis, Belarusian State Technological University, Minsk, Belorusia.
- Kraska, S.A.P.; Dziki, D.; Stocki, M.; Stocka, N.; Różyło, K. Green Grain of Spelt (Triticum aestivum Ssp. Spelta) Harvested at the Stage of Milk-Dough as a Rich Source of Valuable Nutrients. Emir. J. Food Agric. 2019. [Google Scholar] [CrossRef]
- Łaska, G.; Sieniawska, E.; Świątek, Ł.; Zjawiony, J.; Khan, S.; Boguszewska, A.; Stocki, M.; Angielczyk, M.; Polz-Dacewicz, M. Phytochemistry and Biological Activities of Polemonium Caeruleum L. Phytochem. Lett. 2019, 30, 314–323. [Google Scholar] [CrossRef]
- Keča, N.; Tkaczyk, M.; Żółciak, A.; Stocki, M.; Kalaji, H.; Nowakowska, J.; Oszako, T. Survival of European Ash Seedlings Treated with Phosphite after Infection with the Hymenoscyphus fraxineus and Phytophthora Species. Forests 2018, 9, 442. [Google Scholar] [CrossRef]
- Sadowska, A.; Zapora, E.; Sawicka, D.; Niemirowicz-Laskowska, K.; Surażyński, A.; Sułkowska-Ziaja, K.; Kała, K.; Stocki, M.; Wołkowycki, M.; Bakier, S.; et al. Heterobasidion Annosum Induces Apoptosis in DLD-1 Cells and Decreases Colon Cancer Growth in In Vivo Model. Int. J. Mol. Sci. 2020, 21, 3447. [Google Scholar] [CrossRef]
- Sajkowska-Kozielewicz, J.J.; Kozielewicz, P.; Makarova, K.; Stocki, M.; Barnes, N.M.; Paradowska, K. Geissospermiculatine, a New Alkaloid from Geissospermum Reticulatum Bark. Molecules 2020, 26, 143. [Google Scholar] [CrossRef]
- Agresti, A. Categorical Data Analysis; Wiley Series in Probability and Statistics; John Wiley & Sons, Inc.: Hoboken, NJ, USA, 2002; ISBN 9780471360933. [Google Scholar]
- Westfall, P.H.; Wolfinger, R.D. Multiple Tests with Discrete Distributions. Am. Stat. 1997, 51, 3–8. [Google Scholar] [CrossRef]
- Kramer, C.Y. Extension of Multiple Range Tests to Group Means with Unequal Numbers of Replications. Biometrics 1956, 12, 307. [Google Scholar] [CrossRef]
- Mollie, E.B.; Kristensen, K.; Koen, J.; Magnusson, A.; Casper, W.B.; Nielsen, A.; Hans, J.S.; Mächler, M.; Benjamin, M.B. GlmmTMB Balances Speed and Flexibility Among Packages for Zero-Inflated Generalized Linear Mixed Modeling. R J. 2017, 9, 378. [Google Scholar] [CrossRef]
- Venables, W.N.; Ripley, B.D. Modern Applied Statistics with S.; Statistics and Computing; Springer: New York, NY, USA, 2002; ISBN 9781441930088. [Google Scholar]
- Lenth, R.V. Estimated Marginal Means, Aka Least-Squares Means [R Package Emmeans Version 1.6.1]. Available online: https://CRAN.R-project.org/package=emmeans (accessed on 10 June 2021).
- Strouts, R.G. Phytophthora diseases of trees and shrubs. In Arboricultural Leaflet; HMSO: London, UK, 1981; Volume 8, p. 16. [Google Scholar]
- Erwin, D.C.; Ribeiro, O.K. Phytophthora Diseases Worldwide; The American Phytopathological Society: St Paul, MA, USA, 1996; p. 562. ISBN 0890542120. [Google Scholar]
- Akhler, M.; Tobocka, M.; Oszako, T. Pathogenic Oomycetes of Phytophthora Genus—A New Threat to Forests in Europe. Sylwan 2017, 161, 870–880. [Google Scholar]
- Barry, K.M.; Pinkard, E.A. Growth and Photosynthetic Responses Following Defoliation and Bud Removal in Eucalypts. For. Ecol. Manag. 2013, 293, 9–16. [Google Scholar] [CrossRef]
- Kalaji, H.M.; Bosa, K.; Kościelniak, J.; Hossain, Z. Chlorophyll a Fluorescence—A Useful Tool for the Early Detection of Temperature Stress in Spring Barley (Hordeum vulgare L.). OMICS 2011, 15, 925–934. [Google Scholar] [CrossRef]
- Garab, G.; Cseh, Z.; Kovács, L.; Rajagopal, S.; Várkonyi, Z.; Wentworth, M.; Mustárdy, L.; Dér, A.; Ruban, A.V.; Papp, E.; et al. Light-Induced Trimer to Monomer Transition in the Main Light-Harvesting Antenna Complex of Plants: Thermo-Optic Mechanism. Biochemistry 2002, 41, 15121–15129. [Google Scholar] [CrossRef]
- Aldea, M.; Hamilton, J.G.; Resti, J.P.; Zangerl, A.R.; Berenbaum, M.R.; Frank, T.D.; DeLucia, E.H. Comparison of Photosynthetic Damage from Arthropod Herbivory and Pathogen Infection in Understory Hardwood Saplings. Oecologia 2006, 149, 221–232. [Google Scholar] [CrossRef]
- Swindell, W.R.; Huebner, M.; Weber, A.P. Transcriptional Profiling of Arabidopsis Heat Shock Proteins and Transcription Factors Reveals Extensive Overlap between Heat and Non-Heat Stress Response Pathways. BMC Genom. 2007, 8, 125. [Google Scholar] [CrossRef] [PubMed]
- Guo, M.; Liu, J.-H.; Ma, X.; Luo, D.-X.; Gong, Z.-H.; Lu, M.-H. The Plant Heat Stress Transcription Factors (HSFs): Structure, Regulation, and Function in Response to Abiotic Stresses. Front. Plant Sci. 2016, 7, 114. [Google Scholar] [CrossRef] [PubMed]
- Kubienová, L.; Sedlářová, M.; Vítečková-Wünschová, A.; Piterková, J.; Luhová, L.; Mieslerová, B.; Lebeda, A.; Navrátil, M.; Petřivalský, M. Effect of Extreme Temperatures on Powdery Mildew Development and Hsp70 Induction in Tomato and Wild solanum spp. Plant Prot. Sci. 2013, 49, S41–S54. [Google Scholar] [CrossRef]
- Liu, J.; Pang, X.; Cheng, Y.; Yin, Y.; Zhang, Q.; Su, W.; Hu, B.; Guo, Q.; Ha, S.; Zhang, J.; et al. The Hsp70 Gene Family in Solanum tuberosum: Genome-Wide Identification, Phylogeny, and Expression Patterns. Sci. Rep. 2018, 8, 16628. [Google Scholar] [CrossRef]
- Lee, J.H.; Lee, S.E.; Oh, S.; Seo, E.; Choi, D. HSP70s Enhance a Phytophthora infestans Effector-Induced Cell Death via an MAPK Cascade in Nicotiana benthamiana. Mol. Plant Microbe Interact. 2018, 31, 356–362. [Google Scholar] [CrossRef]
- Acosta-Muñiz, C.H.; Escobar-Tovar, L.; Valdes-Rodríguez, S.; Fernández-Pavia, S.; Arias-Saucedo, L.J.; de la Cruz Espindola Barquera, M.; Lim, M.Á.G. Identification of Avocado (Persea americana) Root Proteins Induced by Infection with the Oomycete Phytophthora Cinnamomi Using a Proteomic Approach. Physiol. Plant. 2012, 144, 59–72. [Google Scholar] [CrossRef] [PubMed]
- Kadota, Y.; Shirasu, K. The HSP90 Complex of Plants. Biochim. Biophys. Acta Mol. Cell Res. 2012, 1823, 689–697. [Google Scholar] [CrossRef] [PubMed]
- Bos, J.I.B.; Kanneganti, T.-D.; Young, C.; Cakir, C.; Huitema, E.; Win, J.; Armstrong, M.R.; Birch, P.R.J.; Kamoun, S. The C-Terminal Half of Phytophthora infestans RXLR Effector AVR3a Is Sufficient to Trigger R3a-Mediated Hypersensitivity and Suppress INF1-Induced Cell Death in Nicotiana benthamiana. Plant J. 2006, 48, 165–176. [Google Scholar] [CrossRef]
- Kanneganti, T.-D.; Huitema, E.; Cakir, C.; Kamoun, S. Synergistic Interactions of the Plant Cell Death Pathways Induced by Phytophthora infestans Nep1-Like Protein PiNPP1.1 and INF1 Elicitin. Mol. Plant Microbe Interact. 2006, 19, 854–863. [Google Scholar] [CrossRef] [PubMed]
- Haukioja, E.; Neuvonen, S. Induced Long-Term Resistance of Birch Foliage against Defoliators: Defensive or Incidental? Ecology 1985, 66, 1303–1308. [Google Scholar] [CrossRef]
- Stocki, M. Recovering Biologically Active Compounds from Logging Residue of Birch (Betula spp.) with Supercritical Carbon Dioxide. Chem. Rev. 2018, 1, 120–124. [Google Scholar] [CrossRef]
- Stocki, M. Study on Extraction of Biologically Active Compounds from Birch (Betula) Buds with Supercritical Carbon Dioxide. Chem. Rev. 2019, 1, 154–157. [Google Scholar] [CrossRef]
- Szoka, Ł.; Isidorov, V.; Nazaruk, J.; Stocki, M.; Siergiejczyk, L. Cytotoxicity of Triterpene Seco-Acids from Betula pubescens Buds. Molecules 2019, 24, 4060. [Google Scholar] [CrossRef]
- Isidorov, V.A.; Stocki, M.; Vetchinikova, L. Inheritance of Specific Secondary Volatile Metabolites in Buds of White Birch Betula pendula and Betula pubescens Hybrids. Trees 2019, 33, 1329–1344. [Google Scholar] [CrossRef]
- Stocki, M.; Banaszczak, P.; Stocka, N.; Borowik, T.; Zapora, E.; Isidorov, V. Taxonomic Implications of Volatile Secondary Metabolites Emitted from Birch (Betula L.) Buds. Biochem. Syst. Ecol. 2020, 92, 104132. [Google Scholar] [CrossRef]
- Loulier, J.; Lefort, F.; Stocki, M.; Asztemborska, M.; Szmigielski, R.; Siwek, K.; Grzywacz, T.; Hsiang, T.; Ślusarski, S.; Oszako, T.; et al. Detection of Fungi and Oomycetes by Volatiles Using E-Nose and SPME-GC/MS Platforms. Molecules 2020, 25, 5749. [Google Scholar] [CrossRef]
- Oszako, T.; Żółciak, A.; Tulik, M.; Tkaczyk, M.; Stocki, M.; Nowakowska, J.A. Wpływ Bacillus subtilis i Trichoderma asperellum na rozwój sadzonek brzóz zainfekowanych patogenem drobnych korzeni Phytophthora plurivora. Sylwan 2019, 163, 1006–1015. [Google Scholar] [CrossRef]
- Nowakowska, J.A.; Stocki, M.; Stocka, N.; Ślusarski, S.; Tkaczyk, M.; Caetano, J.M.; Tulik, M.; Hsiang, T.; Oszako, T. Interactions between Phytophthora cactorum, Armillaria gallica and Betula pendula Roth. Seedlings Subjected to Defoliation. Forests 2020, 11, 1107. [Google Scholar] [CrossRef]
- Braun, U. A Monograph of the Erysiphales (Powdery Mildews), 89th ed.; Beihefte Zur Nova Hedwigia: Cramer, Weinheim, 1987. [Google Scholar]


Publisher’s Note: MDPI stays neutral with regard to jurisdictional claims in published maps and institutional affiliations. |
© 2021 by the authors. Licensee MDPI, Basel, Switzerland. This article is an open access article distributed under the terms and conditions of the Creative Commons Attribution (CC BY) license (https://creativecommons.org/licenses/by/4.0/).