Perspective

Quantifying the Annual Cycle of Water Use Efficiency, Energy and CO2 Fluxes Using Micrometeorological and Physiological Techniques for a Coffee Field in Costa Rica

by
Cristina Chinchilla-Soto
1,
Ana María Durán-Quesada
2,3,
Mayela Monge-Muñoz
1 and
Marco V. Gutiérrez-Soto
4,*
1
Centro de Investigación en Contaminación Ambiental (CICA), Universidad de Costa Rica, San José 11501-2060, Costa Rica
2
Departamento de Física Atmosférica, Oceánica y Planetaria & Laboratorio de Observación del Sistema Climático, Escuela de Física, Universidad de Costa Rica, San José 11501-2060, Costa Rica
3
Centro de Investigaciones Geofísicas (CIGEFI), Universidad de Costa Rica, San José 11501-2060, Costa Rica
4
Estación Experimental Fabio Baudrit, Universidad de Costa Rica, Alajuela 20102-2060, Costa Rica
*
Author to whom correspondence should be addressed.
Forests 2021, 12(7), 889; https://doi.org/10.3390/f12070889
Submission received: 25 January 2021 / Revised: 13 June 2021 / Accepted: 1 July 2021 / Published: 7 July 2021

Abstract

:
Coffee is one of the most commonly traded agricultural commodities globally. It is important for the livelihoods of over 25 million families worldwide, but it is also a crop sensitive to climate change, which has forced producers to implement management practices with effects on carbon balance and water use efficiency (WUE) that are not well understood due to data scarcity. From this perspective, we propose crop canopy coupling to the atmosphere (Ώ) as an index of resilience and stability. We undertook an integrated observational approach for the scaling-up of measurements along the soil–plant–atmosphere continuum at different stages of the coffee crop phenological cycle. Additionally, we develop this perspective under pronounced climatic seasonality and variability, in order to assess carbon balance, WUE, and agroecosystem resilience in a sun-grown coffee field. Further, we devised a field layout that facilitates the measurement of intrinsic, instantaneous, and actual water use efficiency and the assessment of whether coffee fields differ in canopy structure, complexity, and agronomic management and whether they are carbon sources or sinks. Partitioning soil and canopy energy balances and fluxes in a sun-grown coffee field using eco-physiological techniques at the leaf and whole plant levels (i.e., sap flow and gas exchange), as proposed here, will allow the scaling-up to whole fields in the future. Eddy covariance was used to assess real-time surface fluxes of carbon, gross primary productivity (GPP), and evapotranspiration, as well as components of the energy balance and WUE. The preliminary results support the approach used here and suggested that coffee fields are CO2 sinks throughout the year, especially during fruit development, and that the influence of seasonality drives the surface–atmosphere coupling, which is dominant prior to and during the first half of the rainy season. The estimated WUE showed consistency with independent studies in coffee crops and a marked seasonality driven by the features of the rainy season. A plan for the arborization of the coffee agroecosystem is suggested and the implications for WUE are described. Future comparison of sun- and shade-grown coffee fields and incorporation of other variables (i.e., crop coefficient-KC for different leaf area index (LAI) values) will allow us to better understand the factors controlling WUE in coffee agroecosystems.

1. Introduction

Coffee is one of the most popular beverages, consumed by about one-third of the world’s population; it is also one of the most commonly traded agricultural commodities worldwide [1]. The world coffee trade is based on two species, Coffea arabica L. (Arabica coffee) and C. canephora (Robusta coffee), which account for 99% of coffee production worldwide. The crop is grown in approximately 80 tropical countries and it is estimated that about 25 million families worldwide are coffee producers, mostly smallholders and families whose livelihoods largely depend on this crop [2,3]. Coffee production is a significant contributor to agricultural gross domestic product (GDP) and export earnings in Latin America [4]. In Costa Rica, coffee is recognized for its high quality and, as a “social crop”, it has a direct impact on the socioeconomic development of the country, representing 0.29% of the national GDP [5]. Coffee production covers more than 25,000 ha [6] and impacts more than 40,000 families directly, while thousands of people participate in associated processes, such as harvesting, processing, and marketing.
The intensification of extreme events under global warming scenarios threatens the sustainability of agricultural production on a global scale, with consequences on the amount and quality of harvestable crops for the current production areas, with coffee being no exception [7]. Coffee is considered a crop that is sensitive to climate change [8,9] and particularly to the impact of temperatures (as its optimum temperature range is 18–25 °C) [10]. The impact of climate change on coffee production has been analyzed for the main producing regions [11,12]. General projections suggest reductions in productive areas of up to 88% by 2050 [13] and losses (and drift) of suitable areas in most coffee-producing countries [3,4]. Yield reductions, lower bean quality, and even higher pressures for disease development (e.g., coffee rust) [14] are already being cited as causes of major economic losses [15,16]. The impacts described so far are often attributed to the inherent sensitivity of coffee physiology to temperature, rainfall, and CO2 changes [3]. As coffee originated in the shady understory of North African forests, it is considered a shade plant and such sensitivity to temperature is expected.
Common strategies that producers have adopted to adapt coffee crops to changing climate conditions include the introduction of new varieties, modifications of the field layout, and the use of overstory vegetation for shading [17]. The use of new genotypes is challenging, as they must be productive without neglecting quality parameters [18] and must show stability across environments. Shading, on the other hand, an ancient practice, is likely a more suitable practice, as shade buffers the microclimate and temperature fluctuations [19]. Shading improves WUE because it modulates stomatal conductance and protects the soil from direct solar radiation, reducing soil temperature and water evaporation [20]. Despite its potential impact on fruit load, shading is considered beneficial when kept around 30% (leaf area index of shade < 1), [21,22], which adds value to the production given the associated additional ecosystem services [21,23].
To better understand the effects of climate change and variability on coffee production systems, we need to face the limitations imposed by data scarcity. At this point, meteorological data to link environmental dynamism and climatic changes to crop productivity are scant, and it is crucial to upscale the analysis to include the physiological responses to environmental changes. To fill these gaps, a multi-scale approach is necessary so that the soil–plant–atmosphere continuum (SPAC) can be used as a framework to understand the impacts of climate and the feedback at the crop scale, and thus to enhance our capacity to deliver an integral model of climate-smart agriculture to producers. In this prospective article, we use a case study of a sun-grown coffee field to set up a basis for the design and study of resilient coffee agroecosystems, with an emphasis on the SPAC, the decoupling mechanisms between plants and the atmosphere, and their impact on ecosystem performance and yield stability.
Here we present the theoretical framework behind our study (Section 2) and use preliminary results of the first year of measurements from the experimental field setup (Section 3) to establish important considerations for this long-term experiment and the potential uses of our data. Although the current perspective was only focused on a sun-grown coffee field, the same setup will be implemented in a shade-grown coffee field in the near future so that the impact of shade on WUE and the coupling between plants and the atmosphere can be addressed (Section 4).

2. Theoretical Considerations

2.1. Feedback in the Soil–Plant–Atmosphere Continuum

Plant canopies modify and regulate their own microclimate [24]. Radiation, temperature, air humidity, wind speed, and mass exchange (e.g., CO2) near the canopy surface change rapidly over short timescales (from seconds to daily cycles) and distances (e.g., canopy height). Mass and energy transfer at the crop scale is dominated by advection because convective transport is less effective, and the influence of the canopy can extend upwards for 10 m or more into the atmosphere in the form of turbulence. The thickness of this canopy boundary layer fluctuates diurnally in a manner dependent on the physiological activity of the canopy, which can be measured as fluxes of heat (H), evapotranspiration (E), and CO2 assimilation (A). These changes in turn modulate the crop surface fluxes through feedback mechanisms whose geographic influence depends on the extension of the vegetation canopy [24] and environmental considerations. The importance of mechanistically understanding these dynamic processes extends to hydrological and climatological models which require precise methods that enable the closure of the energy and mass balance from vegetation and crop surfaces. To achieve this objective, research on evapotranspiration must connect observations at the physiological and meteorological scales through a series of hierarchical models [24,25,26,27].

2.1.1. Gas Exchange at the Canopy Scale

Recent progress in understanding the control of fluxes in plant canopies has established that gas exchange from leaves (transpiration and photosynthesis) are controlled by the interplay between plant physiological (i.e., stomatal responses) and environmental (i.e., boundary layer properties) conditions [28]. When water flows from the soil to the atmosphere, the SPAC is treated as a catenary system, in which liquid sap moves down through a gradient of water potential (ψW) from the soil to the leaves, facing mostly frictional resistances. The stomata, situated at the largest ψW drop at the leaf–air interphase, have been assumed to comprise the main controlling resistance for transpirational water loss from plants. However, if there is a significant drop in the atmospheric saturation deficit (D) at the leaf–air interphase, the stomata, when open, will exercise little control on gas exchange. This seems to be the case for leaves, whole plants, and canopies in their natural environments (i.e., crops and forests), where they can influence their ambient surroundings; what generates important feedback mechanisms between leaves and the atmosphere [26,28].
Gas exchange is dependent on net radiation (an equilibrium component) and on the atmospheric saturation deficit (a component imposed at the canopy). It is more appropriate to formulate the control of gas exchange as the balance between stomatal and environmental effects, where the sensitivity of transpiration to a fractional change in stomatal conductance (GS) depends on the degree of decoupling of leaves from the atmosphere, known as the omega factor (Ω) [25,26]. Decoupling between plants and the atmosphere depends largely on the ratio of stomatal to boundary layer conductance (GS/GBL) and the relative importance of stomatal vs. boundary layer control of transpiration [29]. Stomatal control of transpiration is high when GBL is also high in relation to GS. When GBL is low in relation to GS, local equilibration near the leaf within the boundary layer uncouples evaporative demand at the leaf surface from the bulk air. Following Jarvis and McNaughton’s [26] approach (Equation (1)), Ω can be estimated for an amphistomatous canopy as follows:
Ω = 1 1 ± Γ Δ G C G B L
where Γ is the psychometric constant (kPa T−1), ∆ is the slope of saturation vapor pressure versus temperature (kPa T−1), and GC and GBL are the canopy and aerodynamic boundary layer conductance, respectively.
The decoupling coefficient Ω ranges from 0 to 1 and quantifies the linkage of the conditions (principally humidity and temperature) at the canopy surface to the ambient air. Values close to 0 indicate well-coupled conditions characterized by high physiological (i.e., stomatal opening) control on transpiration and similar conditions at the canopy surface compared to the atmosphere above the canopy. Values close to 1 indicate the opposite (decoupled conditions) and a low or weaker stomatal control on transpiration [26]. For a given species, Ω is a range of values that provides the means to model the influence of the GC of leaf canopies per unit leaf area (i.e., the leaf area index (LAI)) and at the scale of whole plants and crop stands.

2.1.2. Canopy–Atmosphere Coupling

E and A, and thus actual water use efficiency (WUE = A/E), depend on stomatal conductance, net radiation, the air saturation deficit, temperature, and wind speed, all of which vary across leaves, canopies, and the atmosphere above. Although abundant physiological measurements at the single leaf and individual plant levels have suggested that stomata constitute the main regulators of leaf transpiration, the availability of a variety of models to estimate evaporation from non-water-stressed vegetation based on weather variables, which do not consider species composition or stomatal properties of the transpiring vegetation, indicate that WUE is rather controlled by the relative importance of stomatal and environmental factors under different cropping conditions. Understanding the sensitivity of E (dE) to changes in GC is critical to model the main components of the water cycle [27,30]. Hence, the quantification of processes involved in scaling across large gaps, from the leaf to the ecosystem, is needed. If the combined GC and GBL are low enough to promote local equilibration near the leaf surface within the boundary layer, water vapor pressure at the leaf surface will be uncoupled from that in the bulk air mass above the canopy.
Except for large leaves, leaf GBL is usually one to two orders of magnitude larger than GS, and therefore its influence on the transpiration rate is small compared to stomatal control. However, if low GBL decouples leaves within canopies from the bulk air, air measurements made at reference points located above the crop will yield misleading, often overestimated results. Integrated approaches with concurrent measurements of fluxes, driving forces, and conductance across scales should reveal patterns of stomatal regulation and underlying mechanisms, which show only when considering several scales of observations [28]. This is a conceptual and technical requisite to support specific design models for sustainable coffee agroecosystems, which ideally must behave as sinks of CO2 and feature a higher WUE.
When individual coffee leaves are well-coupled to the atmosphere (low Ω) they are usually characterized by E, A, and WUE rates driven by ambient light, vapor pressure saturation deficit, and CO2 at the leaf level, strong signals that gas exchange is effectively controlled by stomata. Coffee, as a species native to the understory of humid tropical forests, is known to display direct stomatal responses to air humidity, temperature, and light. Sun and shade coffee plants and fields differ in several aspects, which span from the biochemistry and the physiology of the plants to the energy balance and microclimatic conditions of whole fields. However, it is the degree of agroecosystem decoupling from the atmosphere which determines the main drivers and the most effective ways to act agronomically upon these processes. Sun-grown coffee monocrops are expected to be more coupled to the atmosphere than shaded, more uncoupled trees (large Ω). Gas exchange of shaded crops would be strongly dependent on radiation receipt and approach equilibrium rates quickly at a relatively low leaf area index (LAI).
Furthermore, coffee crops in the understory are strongly decoupled, even more than sun-grown monocrops (Figure 1). As transpiration of shade trees increases with increasing age and leaf area, the E of coffee trees in the understory is expected to decline because of falling radiation penetration. Shade trees also reduce dew deposition on coffee leaves in the understory, resulting in lower incidence of major diseases, such as coffee rust. These diverse coffee agroecosystems should exhibit greater interspecific variations in coupling and in the extent of stomatal control of transpiration. In these poorly coupled canopies, the thick boundary layer becomes enriched with water vapor and relatively depleted in CO2. In addition, it may exhibit homeostasis and resilience under atmospheric conditions such as the temperature, humidity, and CO2 levels expected to occur under current climate change. This would support the idea that the E of coffee agroecosystems with a variable understory is conservative, and that the mix of shade trees and coffee plants transpires the same amount of water as the sum of two individual stands. Figure 1 provides a diagram of the interplay of the key variables across the SPAC and shows the differences based on Ω extremes.
However, major questions remain about the extent of coupling down the canopy and the dependence of E and A on tree leaf area, which is subject to periodic fluctuations due to phenological rhythms, management practices such as pruning and thinning, and pests and diseases that cause leaf loss, such as coffee leaf rust and anthracnose, among others.

3. Preliminary Results

In the field, we used the eddy covariance (EC) method and focused on the quantification of the water and carbon balance, as well as the estimation of evapotranspiration, in order to determine the general components of the energy balance and their associated fluxes, RN, H (latent Heat), E, S (Soil heat flux), and FC (Carbon assimilation), in this case, E is estimated based on the surface fluxes balance approximation. For the partitioning of canopy and soil surfaces, the EC was based on high (temporal) resolution micrometeorological data at the crop scale. In such a context, it is well-known that this kind of coupling can modulate processes ranging from surface environmental conditions (e.g., temperature and precipitation) to plant growth and development [31].
Partitioning the contributions of crop canopy and soil surface to H, E, and FCO2 requires the deployment of instrumentation at strategic sampling points. A variety of eco-physiological techniques (water relations, sap flow, and gas exchange) are available to assess each of the contribution to the E of the whole field. Observations of this kind are important to understand the effects of soil conditions on crop microclimate, water use, biomass production, and yield. Thus, the observational setup described here was composed of an arrangement of instruments to measure key variables in the canopy, leaves, and soil components of the SPAC.

3.1. The Study Site

We used a 30-year-old coffee plantation (renewed by full pruning 5 years ago) to assess the effect of coffee management on decoupling from the atmosphere. Different aspects were assessed: quantifying the annual cycle of mass, energy and water balances, theoretical considerations, and the practical deployment of instruments at several scales of observation. This entailed simultaneously measuring the system using a combination of micrometeorological and eco-physiological techniques across the SPAC.
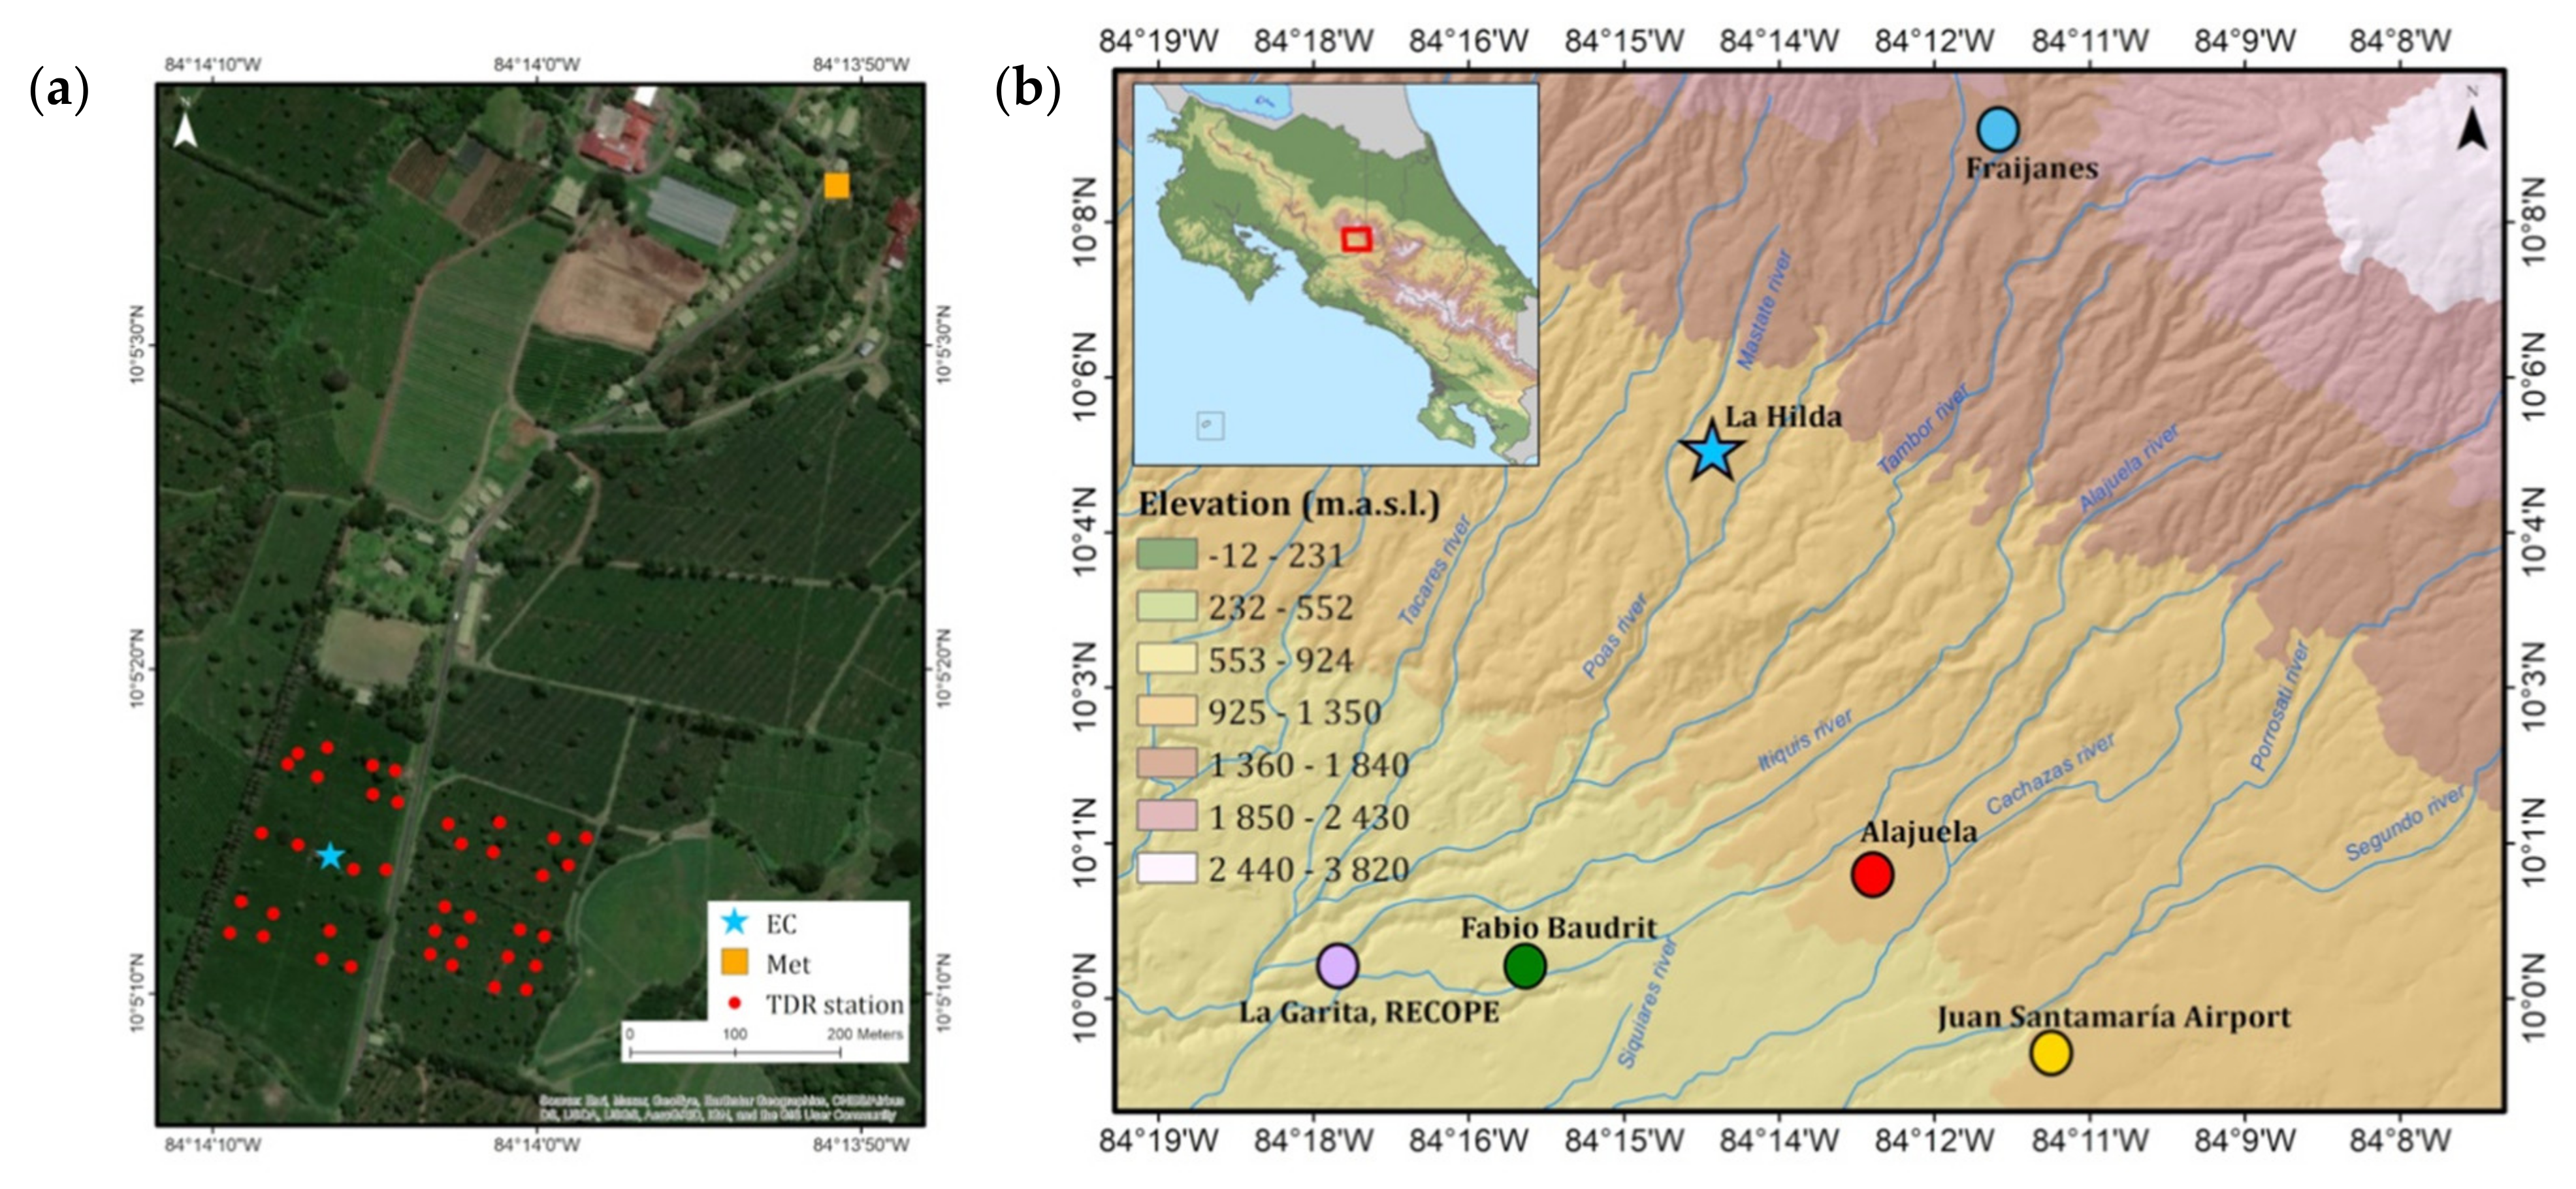
The study site was located at Finca La Hilda in San Pedro de Poás, Aajuela (10.0893″ N 84.235088″ W), Costa Rica (Figure 2), between 1000 to 1500 m.a.s.l., with optimal conditions for coffee cultivation. The soils are mostly Andosols. The farm has coffee fields with different varieties (Catuaí, Caturra, Costa Rica-95, Obatá).

3.2. Long Term Climatology

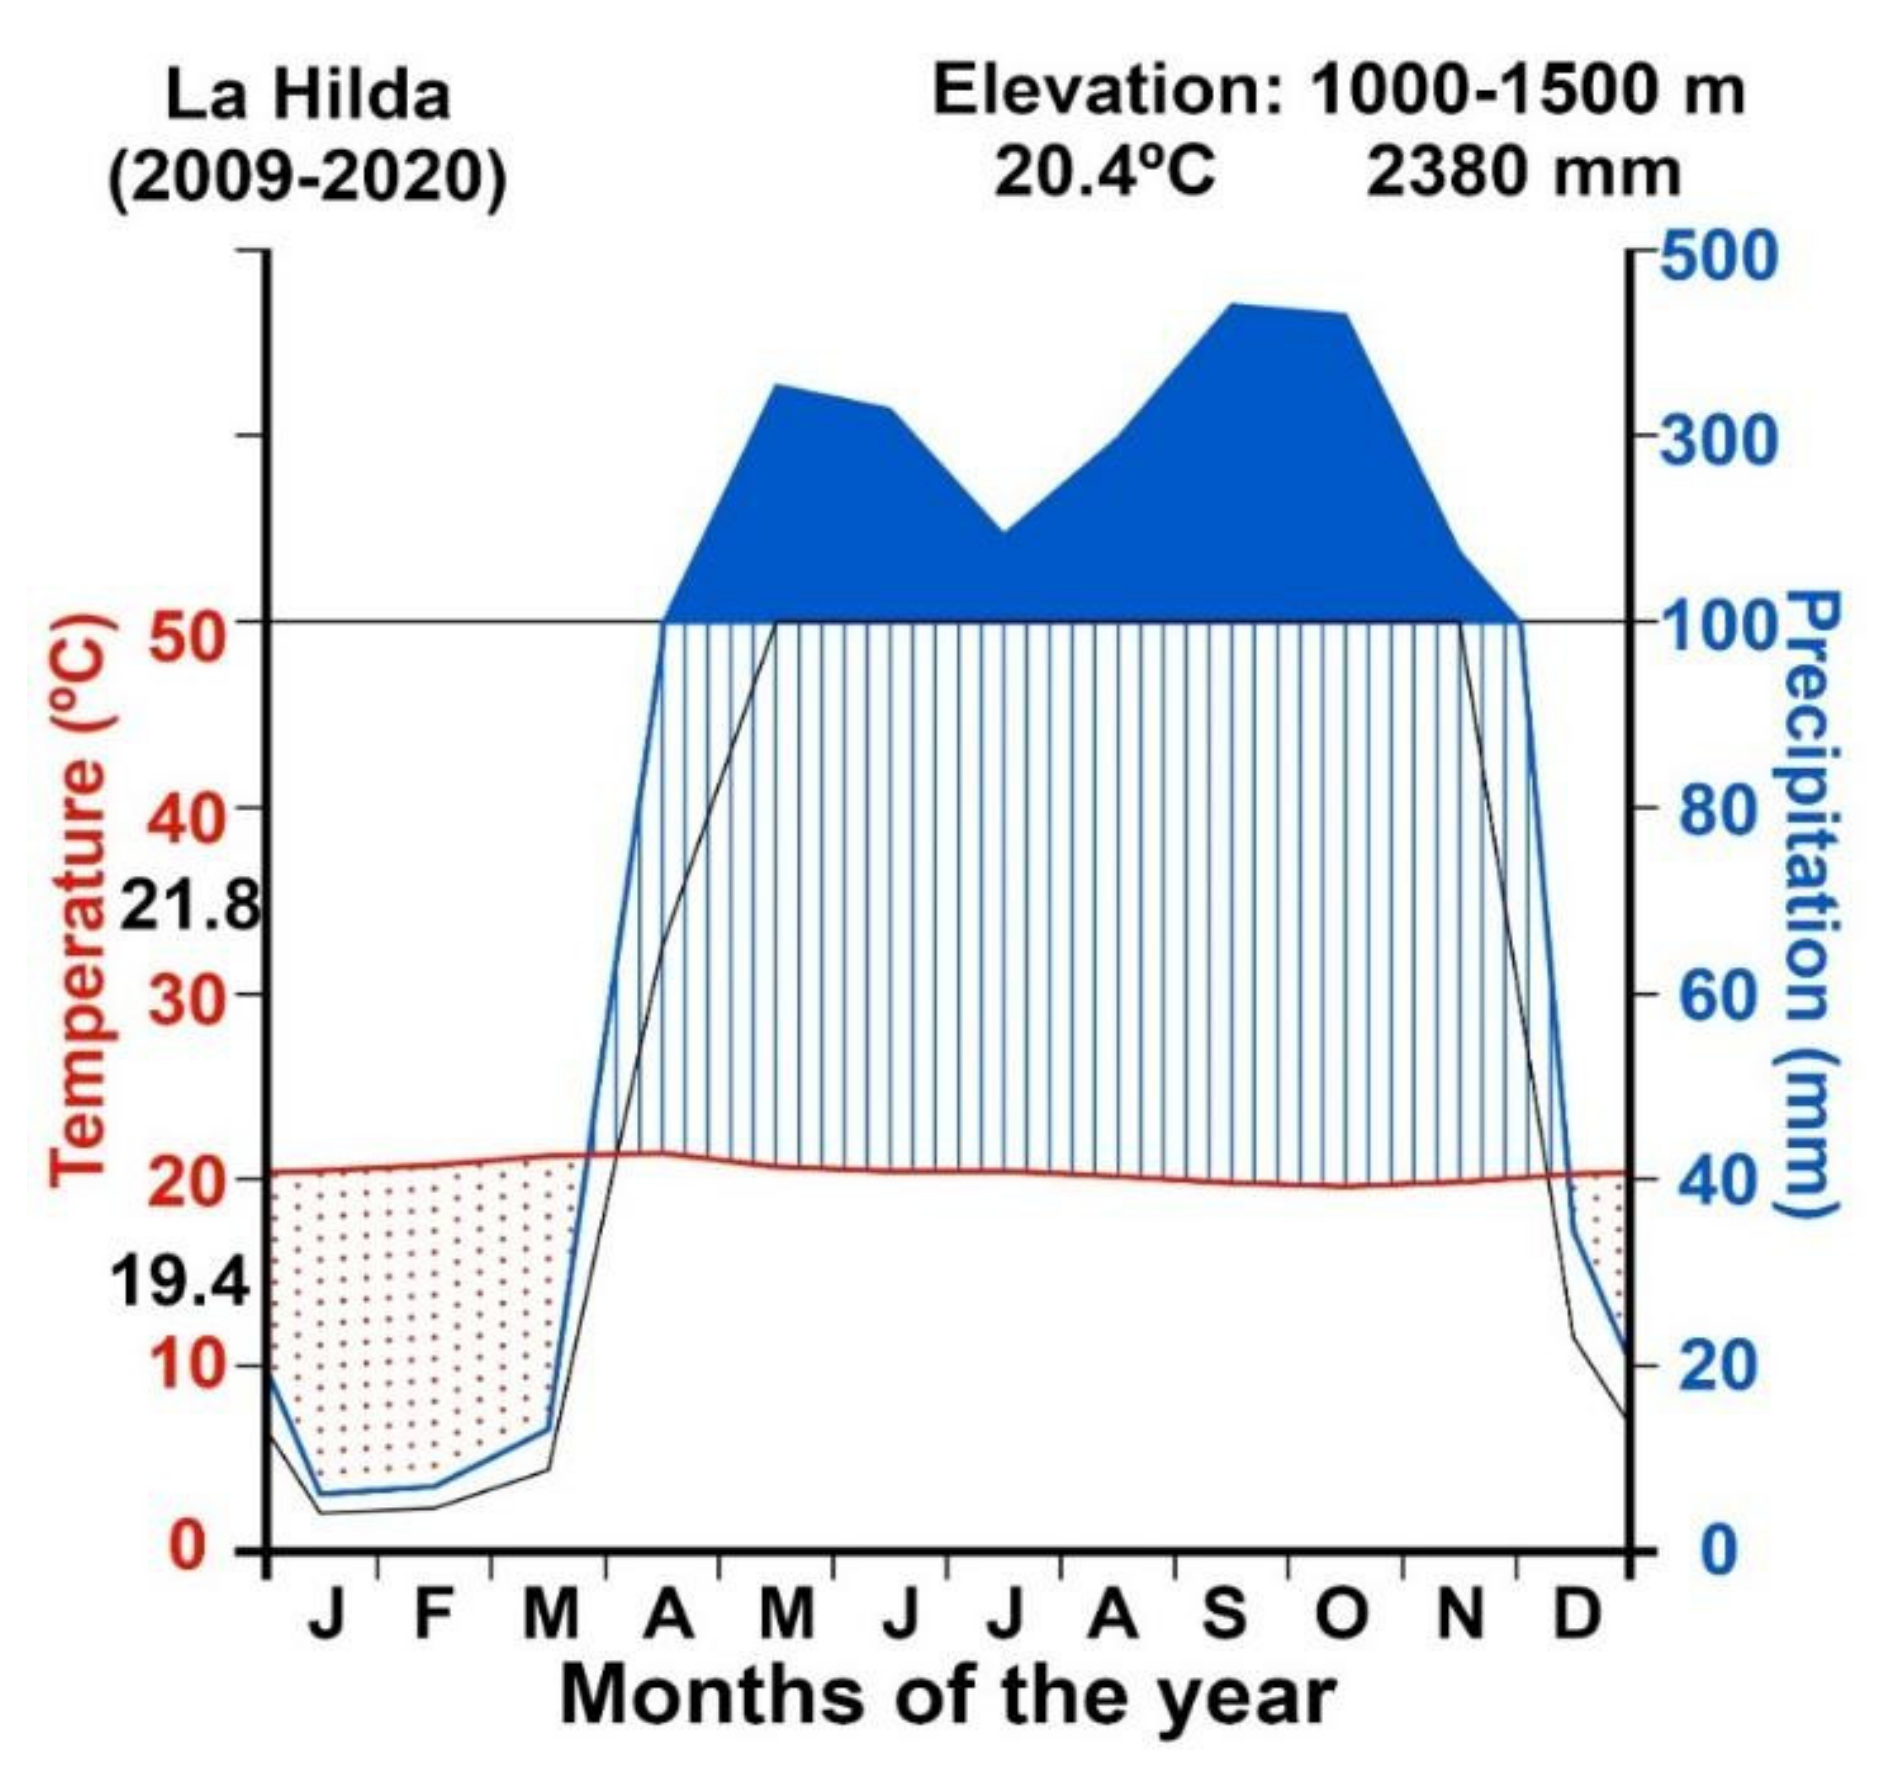
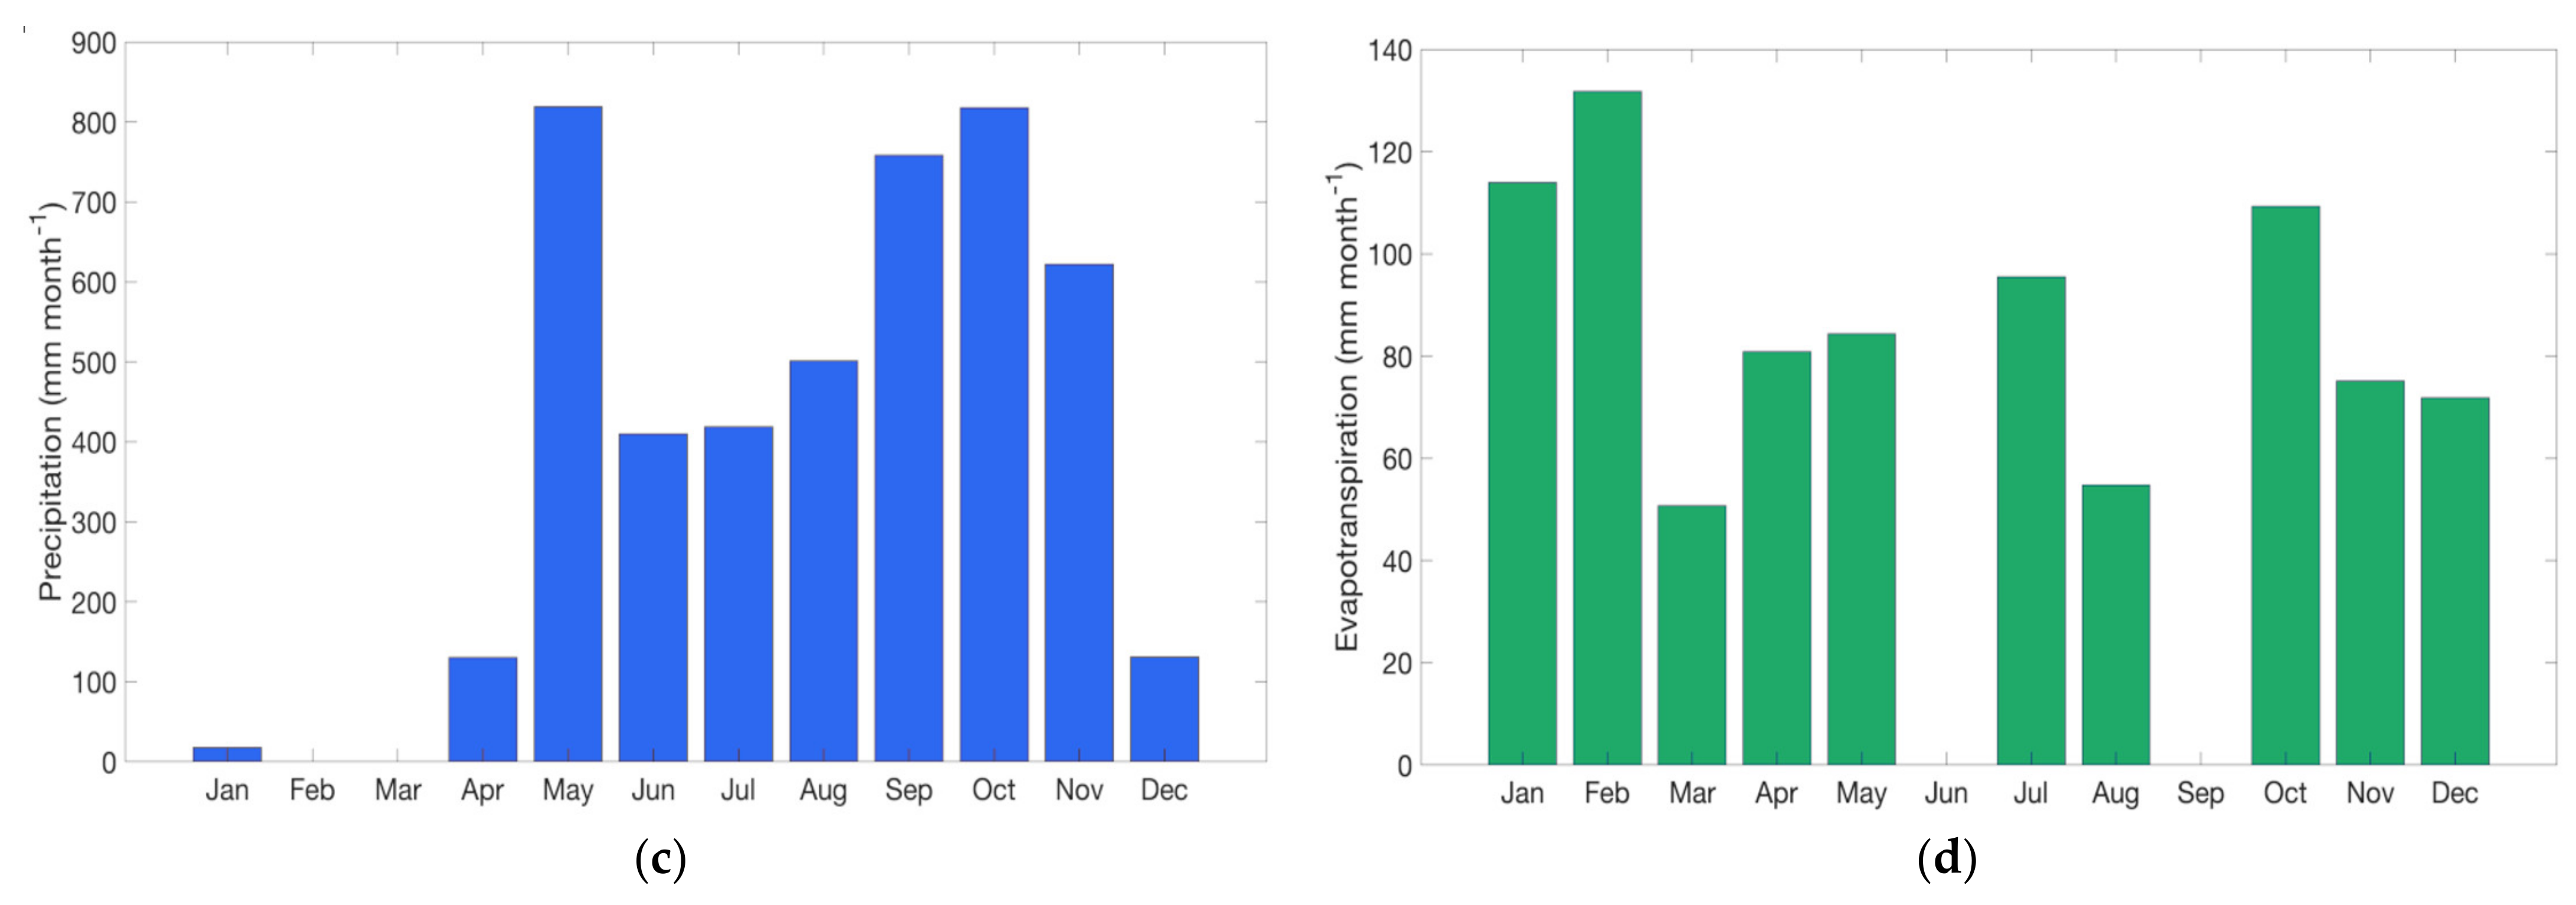
The site is located to the west of the Central Valley of Costa Rica, under strong influence from the ITCZ, with a pronounced dry season (December to April) and a bimodal rainy season (May to November), interrupted in July by the MSD (Figure 3). The average total annual rainfall is 2380 mm. The driest month is January (<15 mm) and the rainiest is October (>500 mm). The average temperature is 20.4 °C with little annual variation. Rainfall and temperature patterns are the result of the interaction of low-level winds with local topography and the influence of the main synoptic scale systems that contribute to regional rainfall [32].
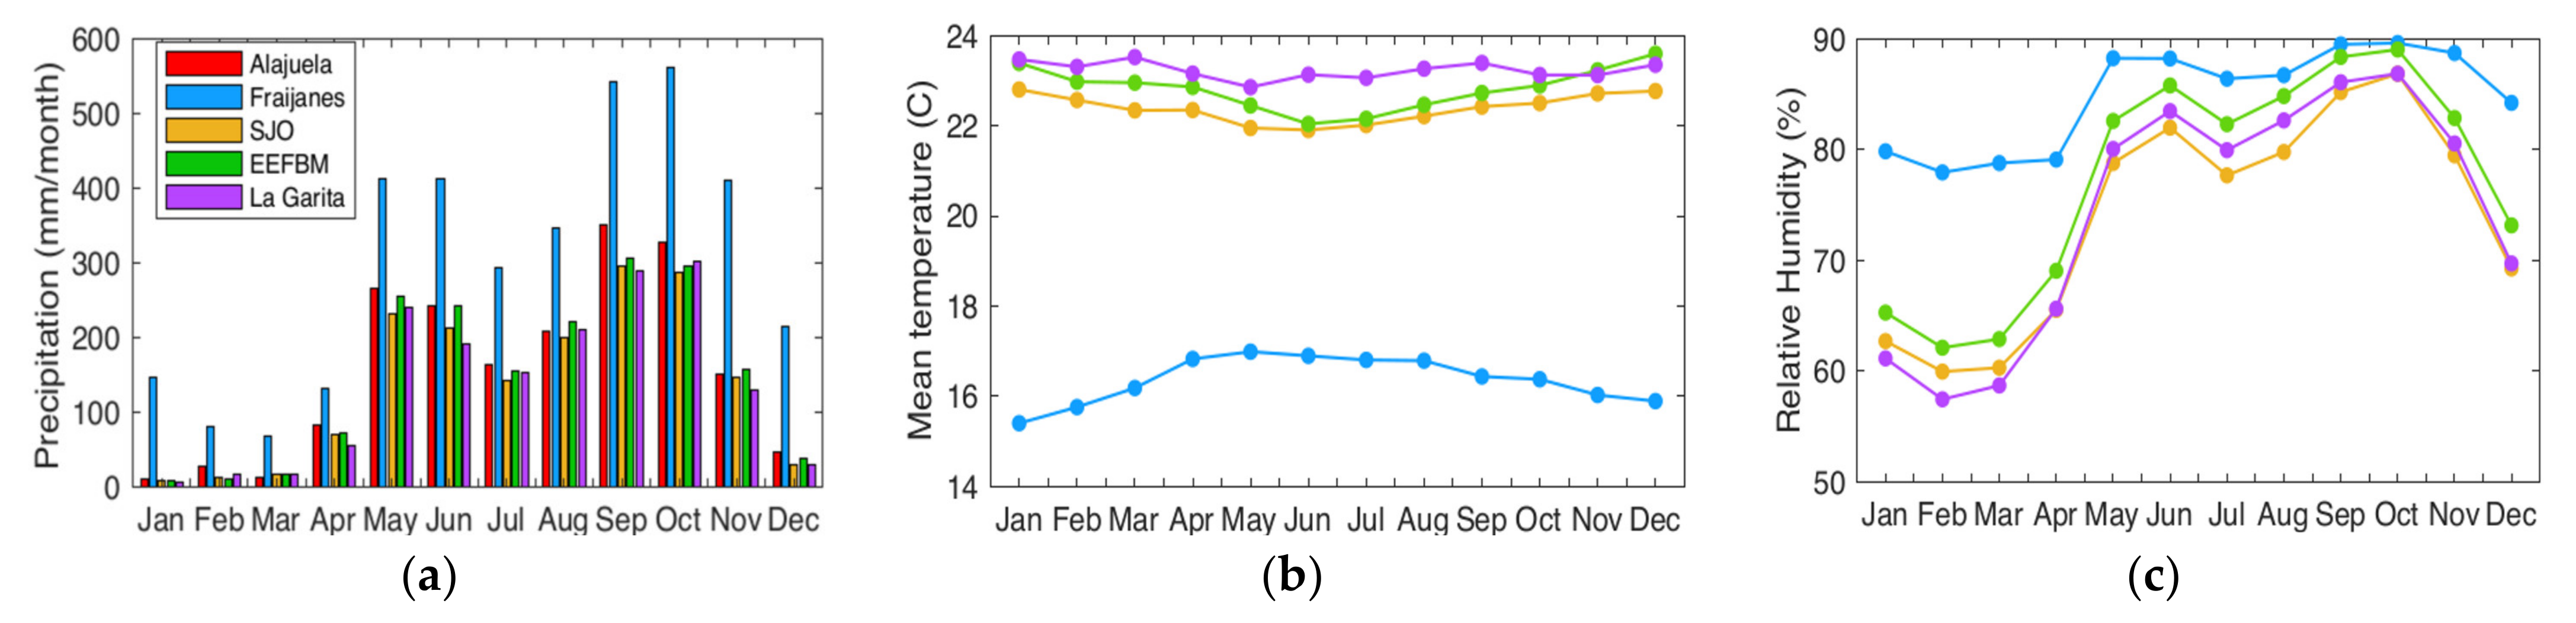
The experimental site is influenced by an elevation gradient on the slopes of the Poás volcano. Records of average environmental conditions in the farm are provided by a Davis vantage automatic weather station. The analysis of the long-term climate was based on reference sites at the Fabio Baudrit experiment station (EFB, 10°01′ N, 84°16′ W, 840 m.a.s.l) and Fraijanes experiment station (10°05′ N, 84°16′ W, 1500 m.a.s.l); both sites belong to the University of Costa Rica and are equipped with Campbell automatic meteorological equipment from the National Meteorological Institute (Figure 2b). Additional stations across the Alajuela province were also considered for the analysis (all sites shown in Figure 2b). The 1999–2019 hourly data were used to generate averages for the annual cycle of monthly accumulated rainfall (Figure 4a), mean temperature (Figure 4b), and relative humidity (Figure 4c) for 5, 4, and 4 stations, respectively. Rainfall had a marked bimodal distribution (Figure 4a) characteristic of the influence of the so-called midsummer drought (MSD) [33]. The mean temperature was 21–24 °C, with higher temperatures in the drier months for the lower elevation site. This pattern was reversed at the higher elevation site at Fraijanes (Figure 4b), where temperature increased after the onset of the rainy season and declined as the dry season was established at the end of the year. The relative humidity at Fraijanes was higher by approximately 20%, which implies that a larger amount of moisture was available in the system.

3.3. Coffee Field Structure

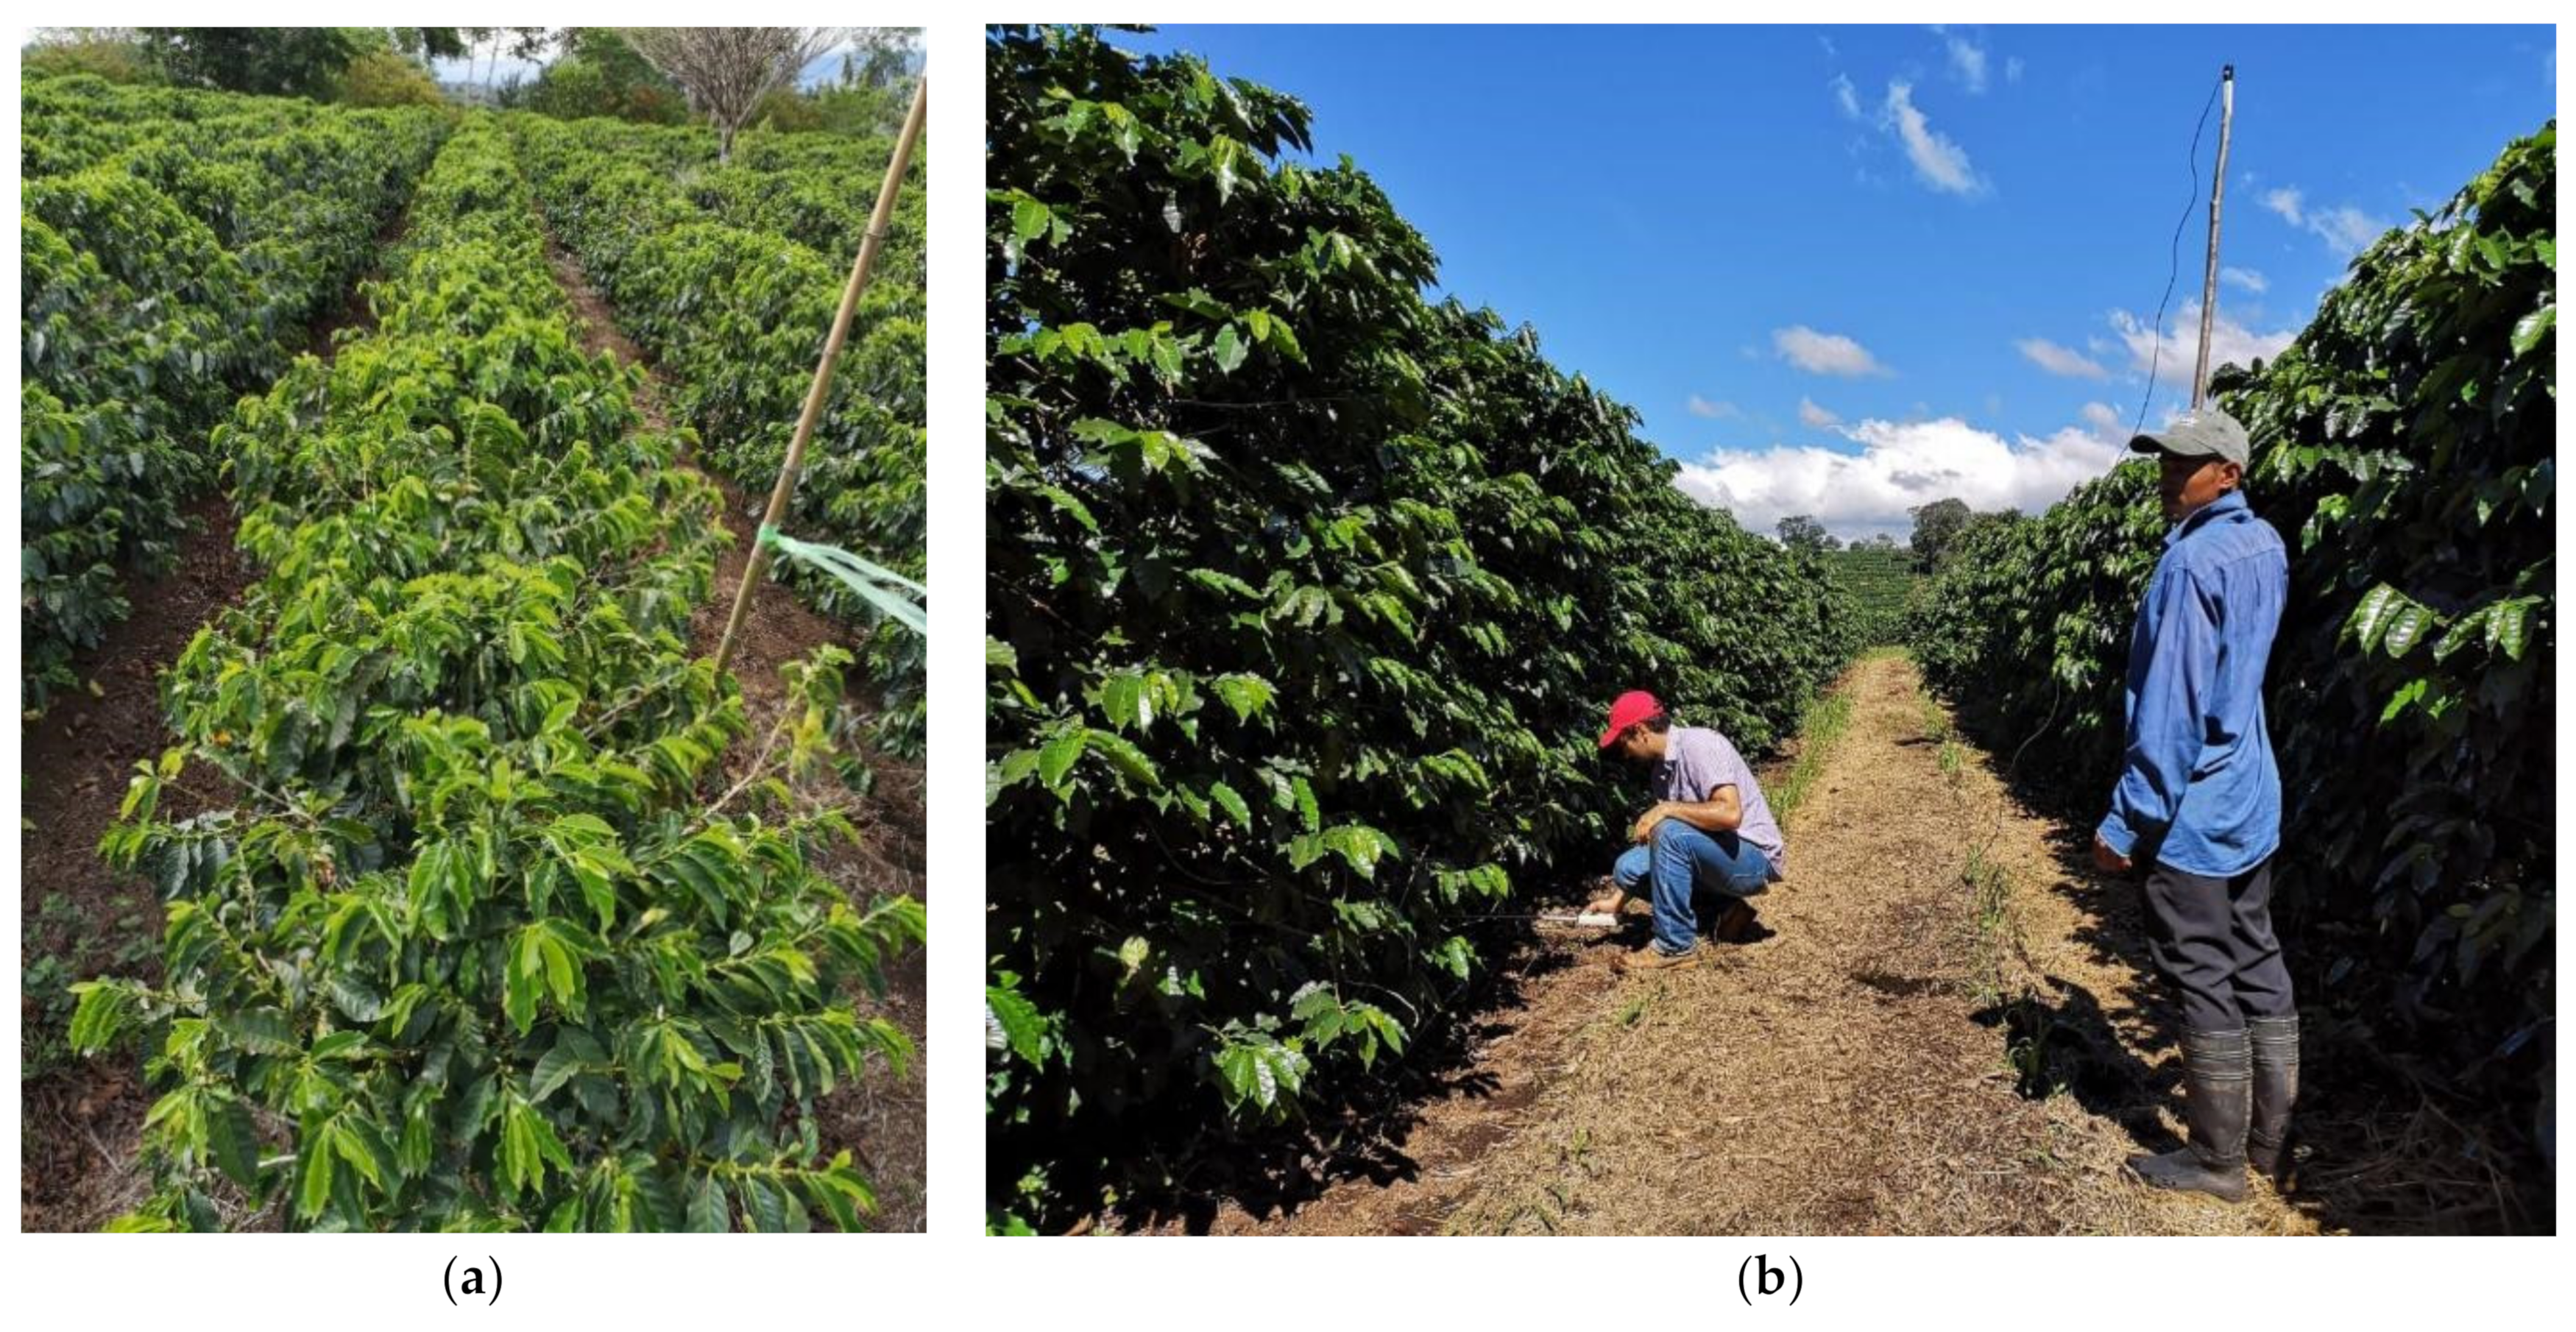
Sun-grown coffee fields in the experimental area were restructured to increase light interception, thus improving radiation use efficiency, and to allocate more biomass, thus providing higher and more stable yields. This was achieved by substantially increasing inter-row spacing compared with more traditional spacings, whereas the distance between plants was significantly reduced (
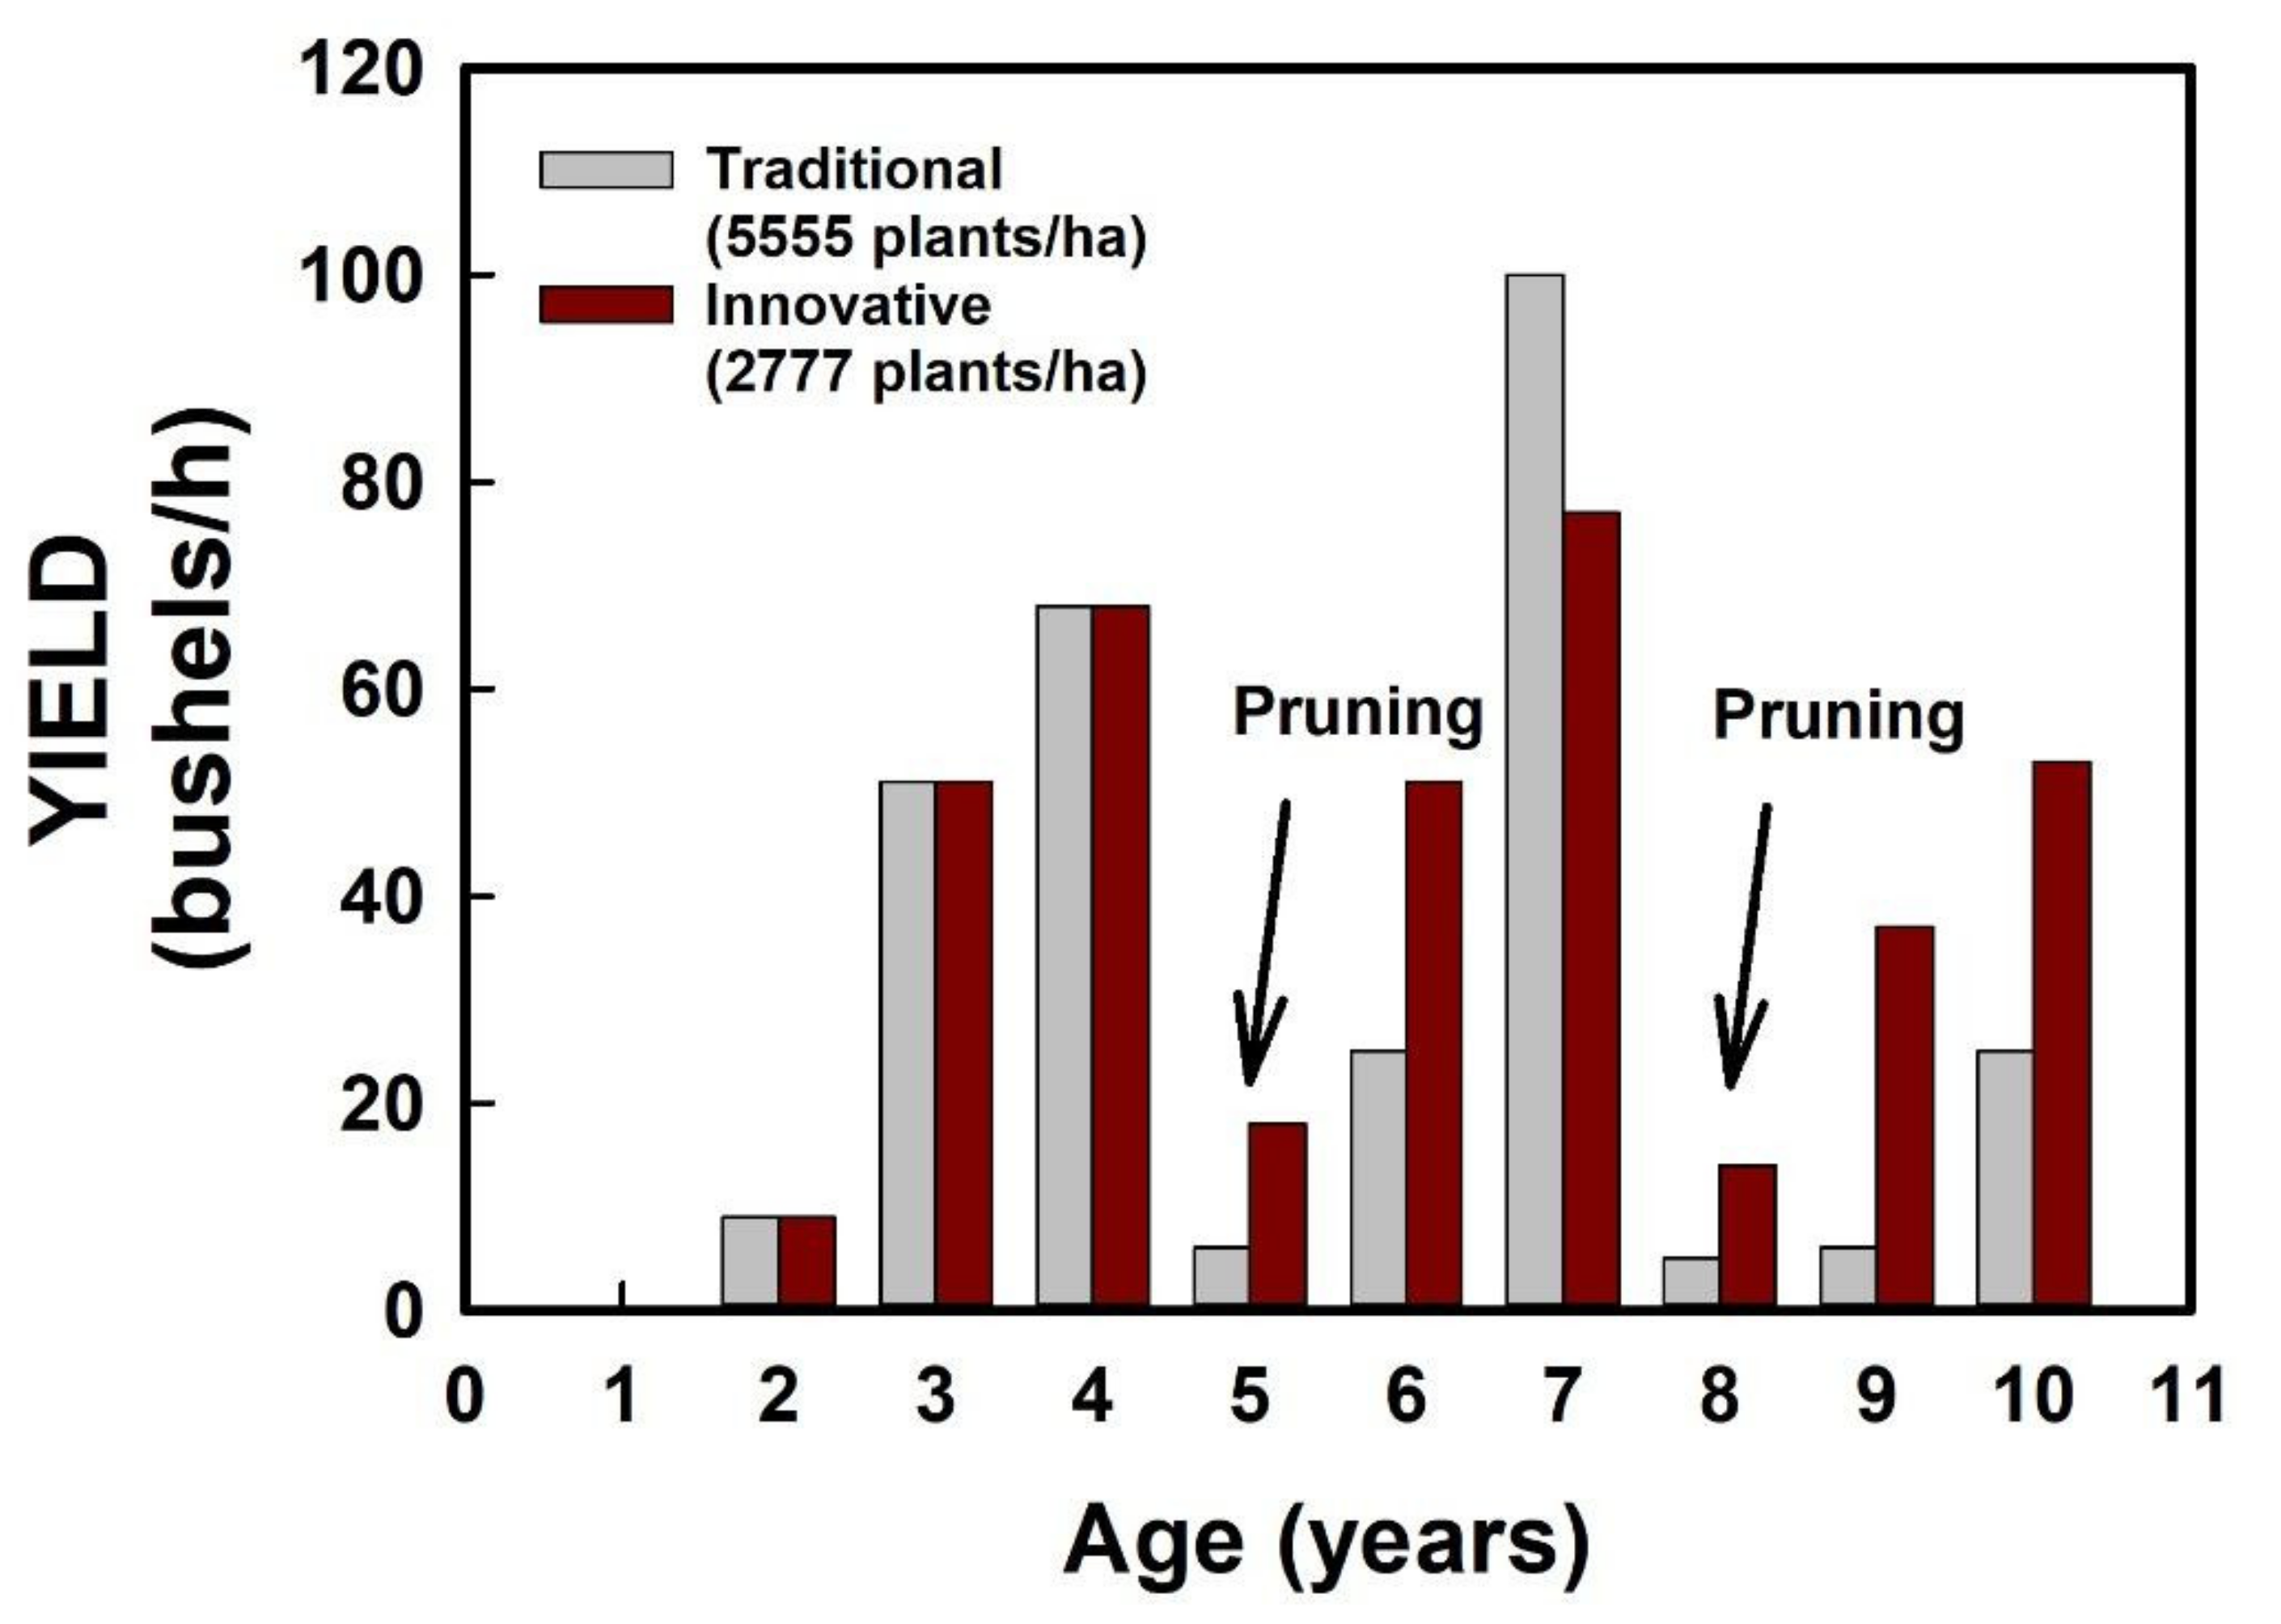
Figure 5). This resulted in substantial differences in plant density, with 5555 vs. 2777 plants/ha in the traditional vs. innovative agroecosystems, respectively. Pruning strategies were also modified by introducing training techniques and frequent pruning of plagiotropic branch tips (i.e., “hedging”) to promote lateral branch growth and a long-lasting tigmo-morphogenetic response that could easily reconstitute the hedgerow leafy surfaces after every pruning pass.
The result was a re-distribution of the LAI and the development of dense, homogeneous leafy walls that extended virtually all the way down to the soil surface and displayed high and uniform photosynthetic rates and high yields, comparable to those obtained with conventional densities (Figure 5). Moreover, our long-term results showed that mature, fully productive coffee fields (hedged fields) recover faster, especially after the third pruning, and their yields remain more stable than in fields subjected to conventional, more severe pruning of the whole shoot (Figure 6).

3.4. Surface Fluxes

As previously mentioned, the analysis of mass and energy balance requires higher frequency information (ca. 10 Hz or higher) and a larger number of variables. The experimental setup considered in this experiment to monitor the lower atmosphere was integrated by an automated weather station and an eddy covariance (EC) system, amplified with measurements at the leaf level (leaf temperature, D, GS, and GBL), as explained below. A closed path Li-7200 EC system (LI-COR, NE) was deployed in the sun-grown coffee field. EC was used to compute the mass and energy budgets to estimate evapotranspiration (latent heat, E), net CO2 fluxes (FC), gross primary productivity (GPP), ecosystem respiration (RECO), and, most importantly, the carbon balance of entire fields during different climatic conditions.

3.4.1. Annual Cycle of Surface Fluxes

Here we present the preliminary results of the EC-derived measurements for 2020, for latent and sensible heat flux, and for evapotranspiration (Figure 7). Due to power issues in the field, the flux system was not continuously working during April and September, so the data for those months were excluded, given that missing data exceeded 15%, which was the missing data threshold used. Quality assurance and quality control of data were carried out according to Foken et al. [34].
During 2020, latent heat flux (LE) presented a monthly average of nearly 40–70 Wm−2 with significant daily variability (Figure 7a). The largest daily variability was observed for March, the month in which the transition to the rainy season starts (Figure 7c). Surface–atmosphere coupling was expected to show major activity during this transition period. As the rainy season ends, soil moisture availability declines and one of the responses tends to be a decline in the latent heat flux, given that the area has previously experienced high evapotranspiration rates (Figure 7d).
The sensible heat flux (H) annual cycle (Figure 7b) showed variations of 20–80 Wm−2 and peaks towards the end of the dry season. In this period of warmer conditions, vertical temperature gradients are maximized by the contrast between the hot surrounding air and the cooling effect that coffee transpiration has on the surfaces underneath (the soil and lower leaves). As the rainy season was established in April (Figure 7c), H started to decrease and a reduction in the temperature gradient was to be expected. The secondary peak of H was approximately 50% of the value for the first peak and this suggests that surface–atmosphere coupling differed during the two peaks of the rainy season. Furthermore, the surface plays a major role in the establishment of the first half of the rainy season, in contrast with the larger (synoptic)-scale force that dominates the second, stronger half of the rainy season.
Water flux is dominated by precipitation which shows an annual cycle featured by the climatological dry and wet seasons characteristic of the region while E shows the response to variations in precipitation (Figure 7d). Monthly cumulative E indicate that it accounted for approximately 25% of the total rainfall (April and September were not considered in the estimation). E was largest during the dry season, showing a large net rate of surface water loss, in agreement with the annual cycle of the surface fluxes (LE and H). After the onset of the rainy season, surface water availability was enough to maintain high soil water content despite the high E rates observed. Hence, the severity of crop water stress was at a maximum during the dry season and prior to the establishment of the rainy season.

3.4.2. Annual Cycle of CO2 Fluxes and Productivity

If surface fluxes provide a measure of the connectivity between the surface and the atmosphere, CO
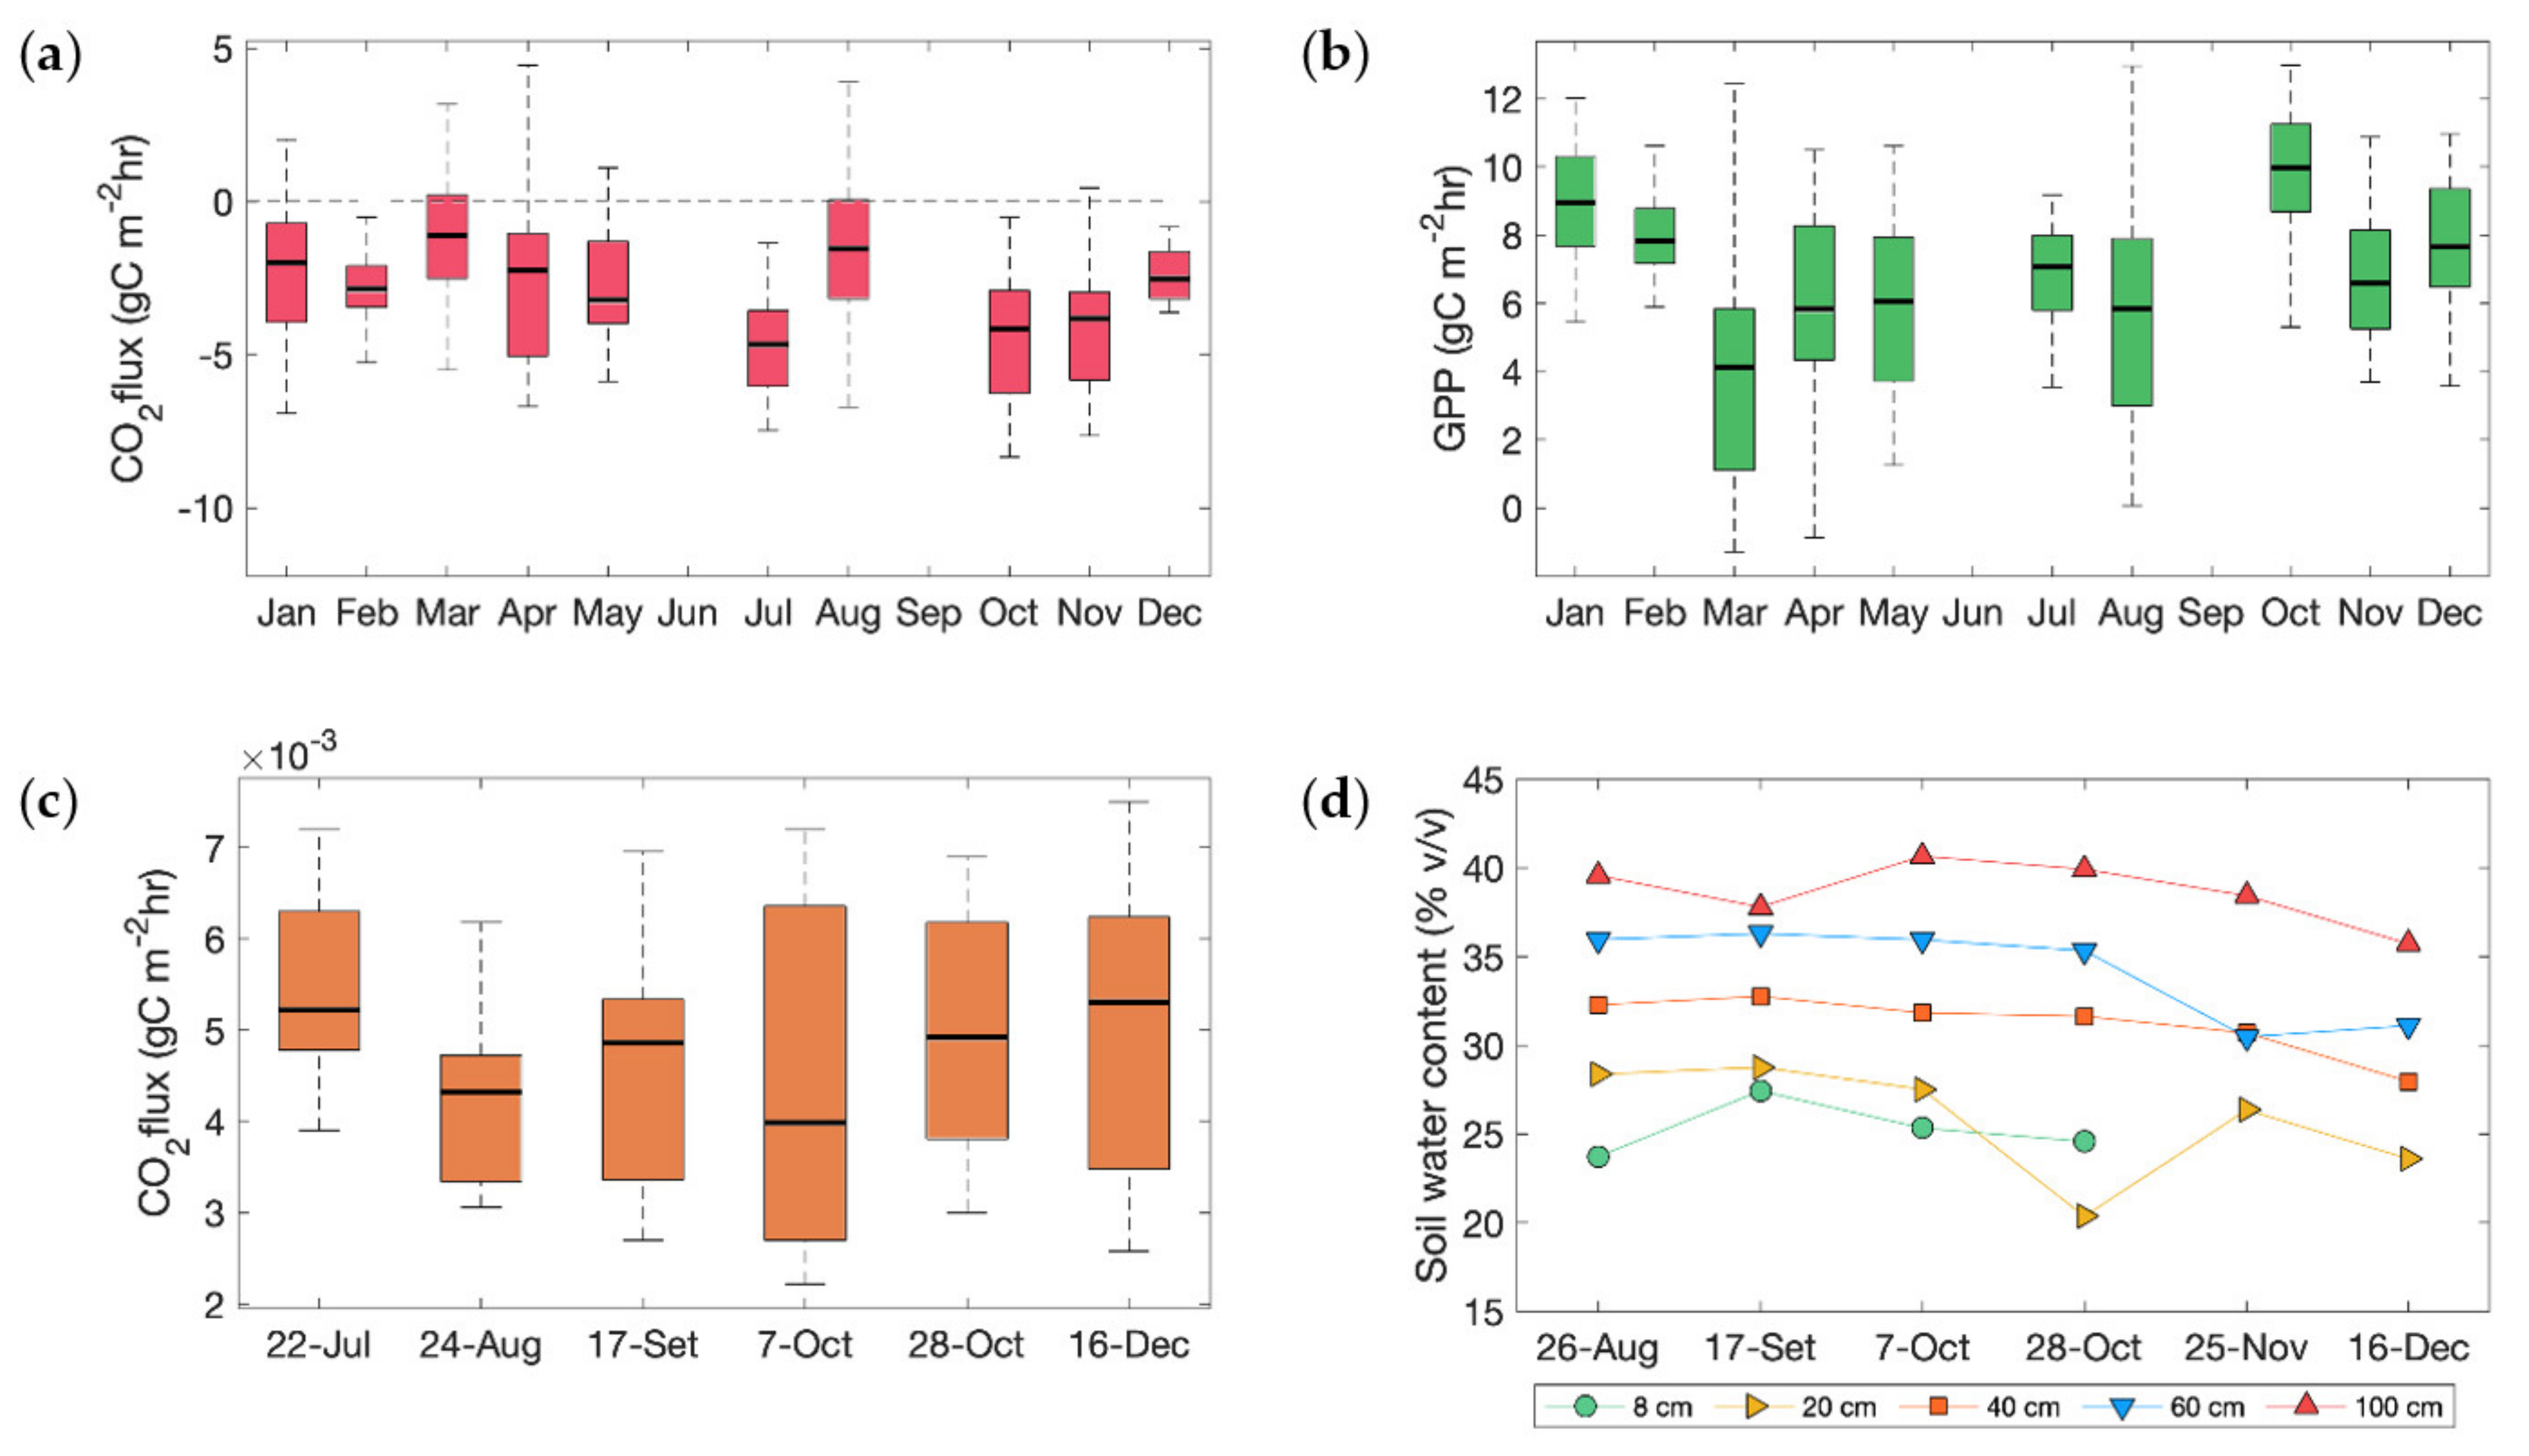
2 flux and GPP are essential to explain the dynamics of C capture, long-term ecosystem carbon balance, and yield production. On average, the sun-grown coffee field behaved consistently as a CO2 sink during the year (Figure 8a). CO2 fixation was enhanced during the second half of the rainy season, consistent with the high rainfall and high soil water content. However, such behavior was not observed during the first half of the rainy season. The annual cycle of GPP (Figure 8b) shows that productivity also peaked during the second half of the rainy season, coinciding with the most active phase of growth and storage of the developing fruit crop, which is known to cause increases in the photosynthetic rates of leaves in response to increased sink demand for assimilated carbon [35]. This implies that CO2 capture dynamics could be driven by coupling of the surface and the atmosphere at higher levels.

3.5. Soil CO2 Fluxes and Water Content

Soil CO2 efflux accounts for the 50–70% of ecosystem respiration (RECO) [36] and is highly variable at the temporal and spatial scales due to the complexity of the different components that contribute to this flux (i.e., ground surface organic litter, live roots, and soil organic matter pools) [37]. In our experimental setup, the strategic deployment and placement of stations for soil measurements (soil water content, CO2) allowed the separation of soil fluxes from whole coffee field fluxes. Soil CO2 flux measurements provide information about the factors driving soil respiration (Rs) and aid the evaluation of the component processes in models, particularly belowground processes that are not entirely understood. Furthermore, data from chamber measurements are also useful to fill gaps in EC datasets, particularly when a (large) representative portion of the ecosystem is included in the measurements [36]. The Rs rate (the sum of autotrophic respiration by roots and heterotrophic respiration by microorganisms) is also affected by the other elements that influence microbial activity, such as temperature, soil moisture [20,38,39], organic matter, and the supply of photoassimilates from the shoot (determined by plant type, phenology, and assimilation rate). Thus, soil CO2 measurements are highly responsive to linkages and feedback between above- and belowground components in the SPAC [40].
For soil flux measurements, CO2 fluxes are measured using a closed chamber system with a Li-Cor 8100 (Li-Cor Inc., Lincoln, NE, USA). A total of 20 PVC anchors were installed in the soil at depth of 12 cm, following standard recommendations for an expected error acceptance of 10% [41]. Fluxes were measured monthly from July 2020. CO2 measurements were carried out with a chamber deployment of 90 s and three repetitions per anchor, and fluxes were calculated with the standard flux equation using SoilFluxPro™. For each sampling point, volumetric water content was determined at five different depths (8, 20, 40, 60, 80, and 100 cm) with a HandiTrase TDR Soilmoisture Meter, model 6085K3 (Soilmoisture Equipment Corp., Santa Barbara, CA, USA).
Soil at La Hilda was expected to present a good water-holding capacity due to its volcanic origin; accordingly, soil moisture did not change dramatically throughout the measurement period (Figure 8b), which allowed for microbial activity and other processes responsible for soil respiration to continue relatively unchanged during the rainy season. The preliminary results showed a maximum in July (Figure 8a) and little variation within the remaining months of the rainy season. As expected, our CO2 results showed high spatial variability (coefficient of variation (CV) of 20.95–39.87%), which is usually explained by spatial heterogeneity in soil water, temperature, and organic carbon content [20]. The spatial variability for the dataset tended to increase towards the end of the year, which was perhaps linked to variations in soil moisture (Figure 8b) that might have created responses in the CO2 at the microscale level. Several recommendations have been made regarding the number of samples needed to achieve a required uncertainty [42]; however, the number of chambers needed to reduce the uncertainty can be impractical and unrealistic for many ecosystems and field situations [36], so new approaches were explored to reduce the variability in CO2 flux for the site in the near future.

3.6. Sap Flow Measurements and Latent Heat Flux Partitioning

Whole plant transpiration can be estimated through sap flow sensors, which allow measurements of water use and actual transpiration in real time [43,44]. Because canopy transpiration (canopy latent heat flux) is estimated as EC = GCD, normalization of EC by the leaf area distal to the location of the sap flow sensors yields the actual canopy conductance and transpiration rate. Simultaneous deployment of sensors to measure sap flow in thinner shoots of coffee and in thicker woody trunks of shade trees facilitates the simultaneous measurement of EC components in sun-grown and shaded coffee fields. Sap flow measurements were carried out in six plants using the Dynamax Sap Flow sensors SGB 25 and SGB 35 (Dynamax Inc., Houston, TX, USA). In this method, a resistance is used to heat the stem and the heat fluxes that leave the system are calculated from measured temperature gradients using the energy balance method [45].
Leaf gas exchange can be reliably measured in the field using steady-state automated porometers, which allow rapid and precise measurements of stomatal conductace. In this study, we used an AP4 Porometer (Delta-T Devices Ltd., Cambridge, UK). For the measurement at leaf level, a part of a leaf was enclosed at the base of a cup containing a humidity sensor and dry air was flushed through the cup until a preselected lower level of relative humidity was achieved, as described in detail by Montheit et al. [46]. Usually, the plant is sectioned into shade and sun leaves and the newest fully expanded leaf is selected for the measurement.
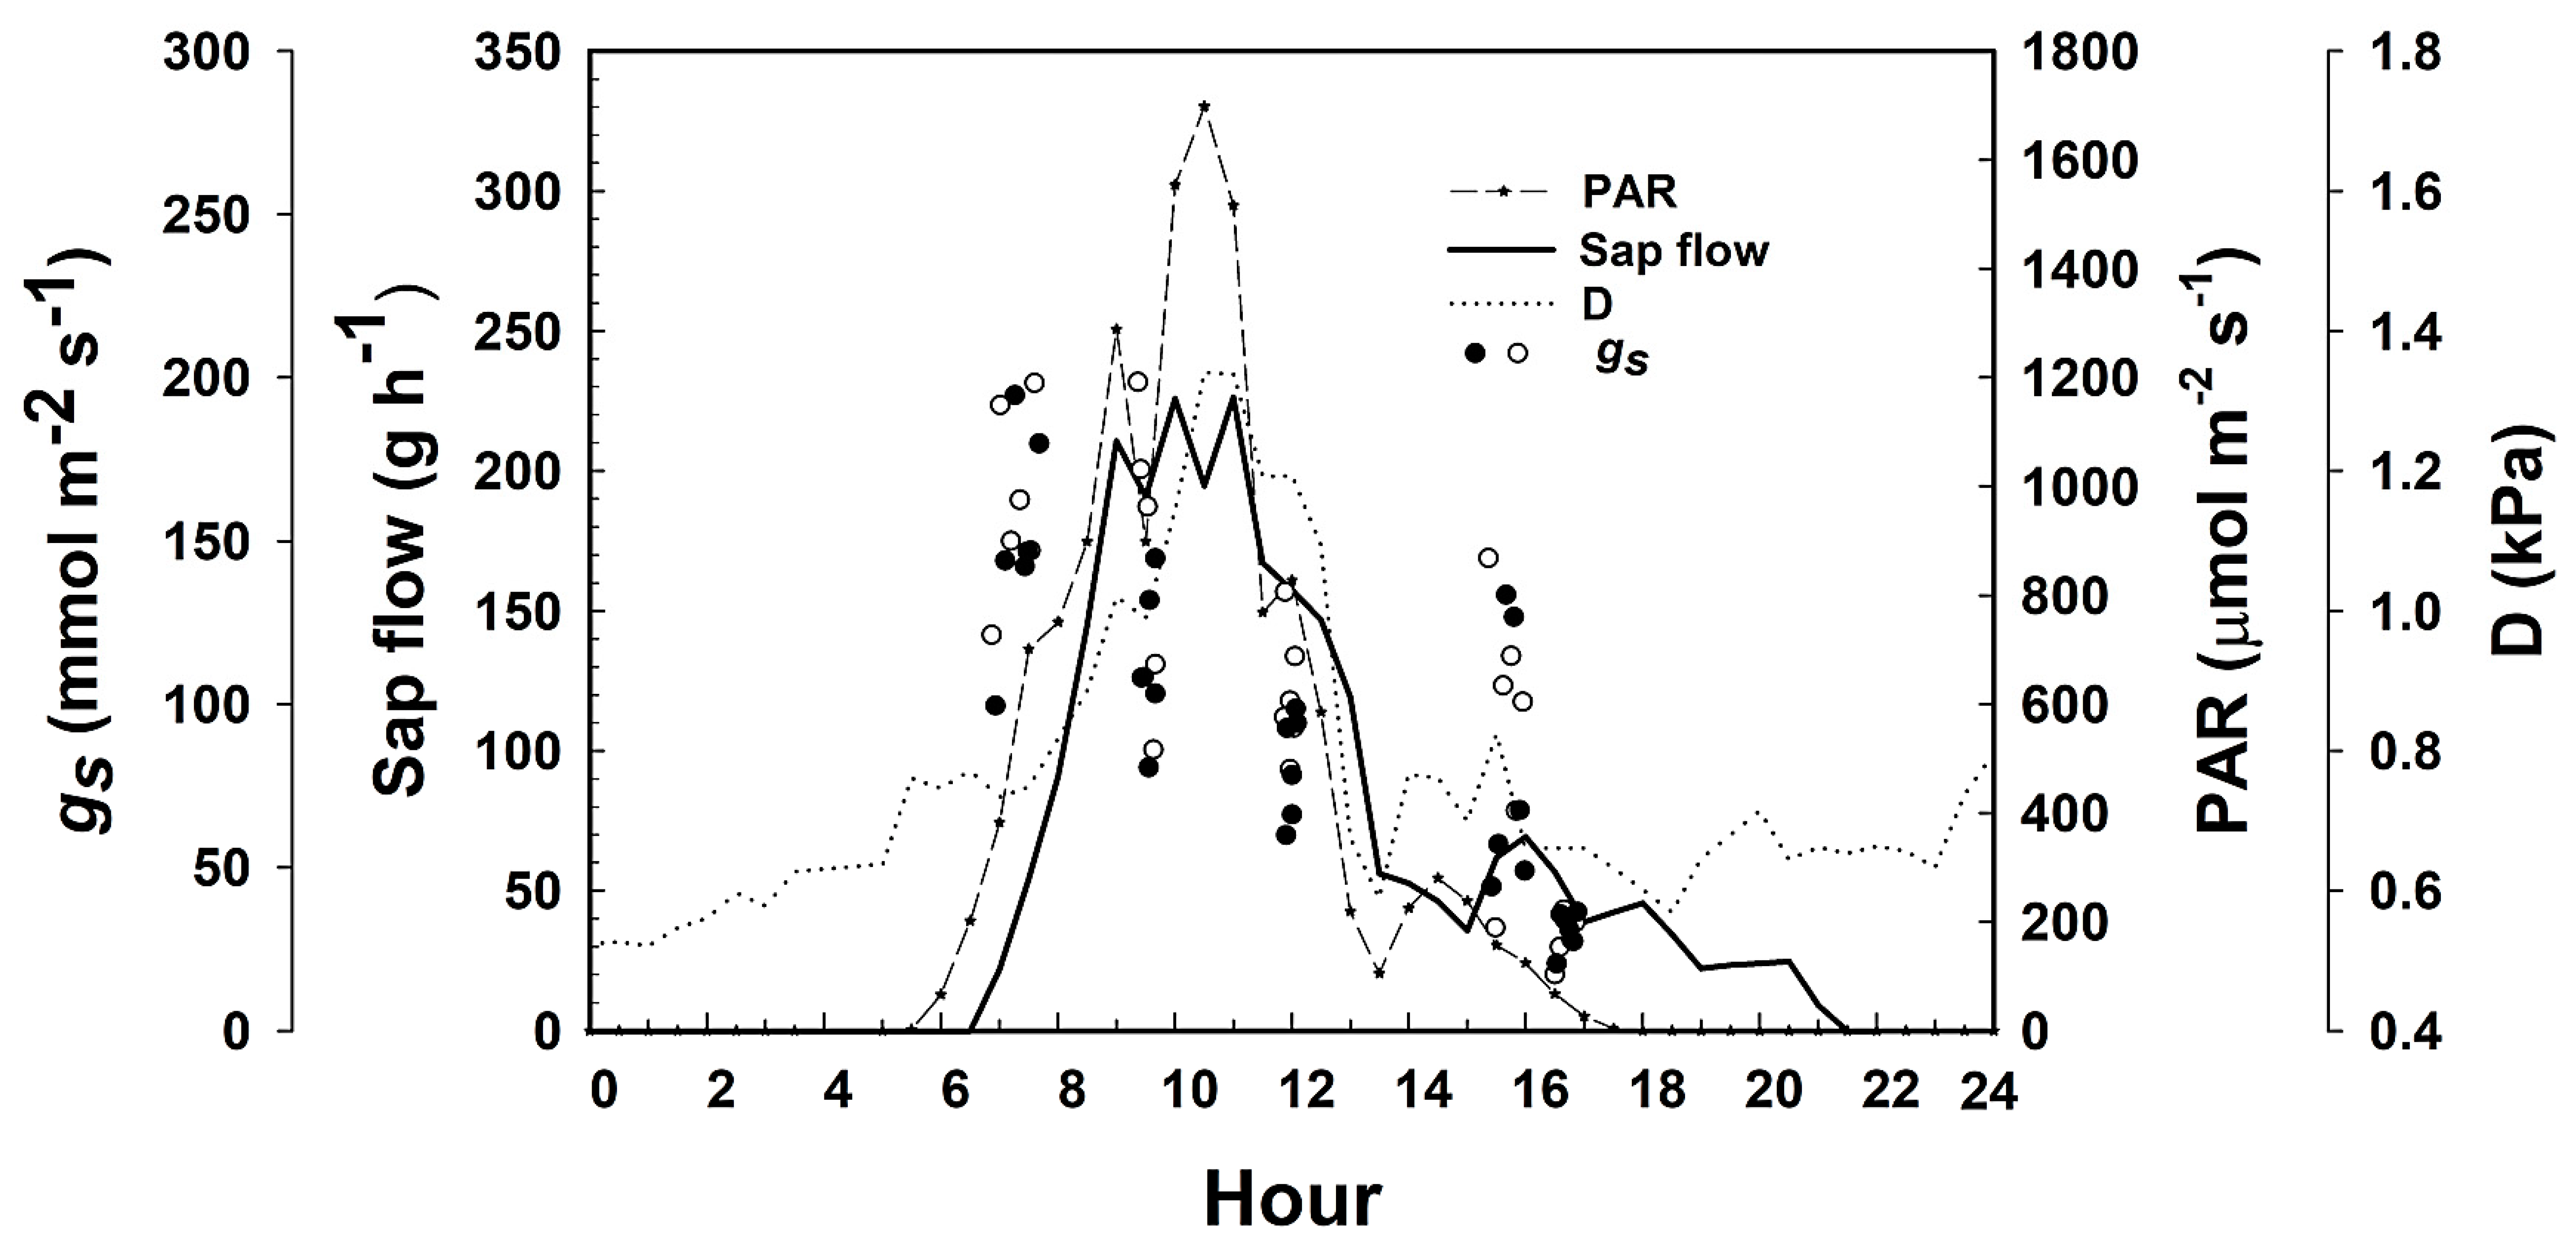
A day during the peak of the rainy season (Figure 9) is presented here as an example of the typical daily course for the simultaneous measurements of sap flow and stomatal conductance in relation to environmental variables in the field in order to demonstrate the close dependance of transpiration on photosynthetic active radiation (PAR) and vapor pressure deficit (D). There was a flattening of stomatal activity around mid-day when PAR was close to 1500 umol m−2 s−1 and atmospheric conditions were drier. High D is likely to trigger direct stomatal responses to air humidity in coffee, resulting in stronger stomatal control of transpiration [47]). The close correspondence of sap flow with PAR levels also indicates the reduced storage capacity of coffee plants and strong coupling between daily PAR availability and water use. It is important to point out that PAR and D have opposite effects on stomatal conductance throughout the day (see [47]). However, the low flows observed between 1700 and 2200 h suggest that some stem recharge may have been taking place, or that nocturnal transpiration at high D during the early night hours was driving transpiration at this time. The transpiration rate can be obtained by normalizing the sap flow rate by the leaf area, while the canopy boundary layer conductance can be calculated using Ohm’s analogy along the plant–air interphase, as stomatal and boundary layer conductances are connected in series during the transpirational process. The data obtained were used to feed the canopy decoupling model described above in order to produce information about the relative importance of stomatal and environmental factors in the control of canopy fluxes.

3.7. Water Use Efficiency in the Agroecosystem

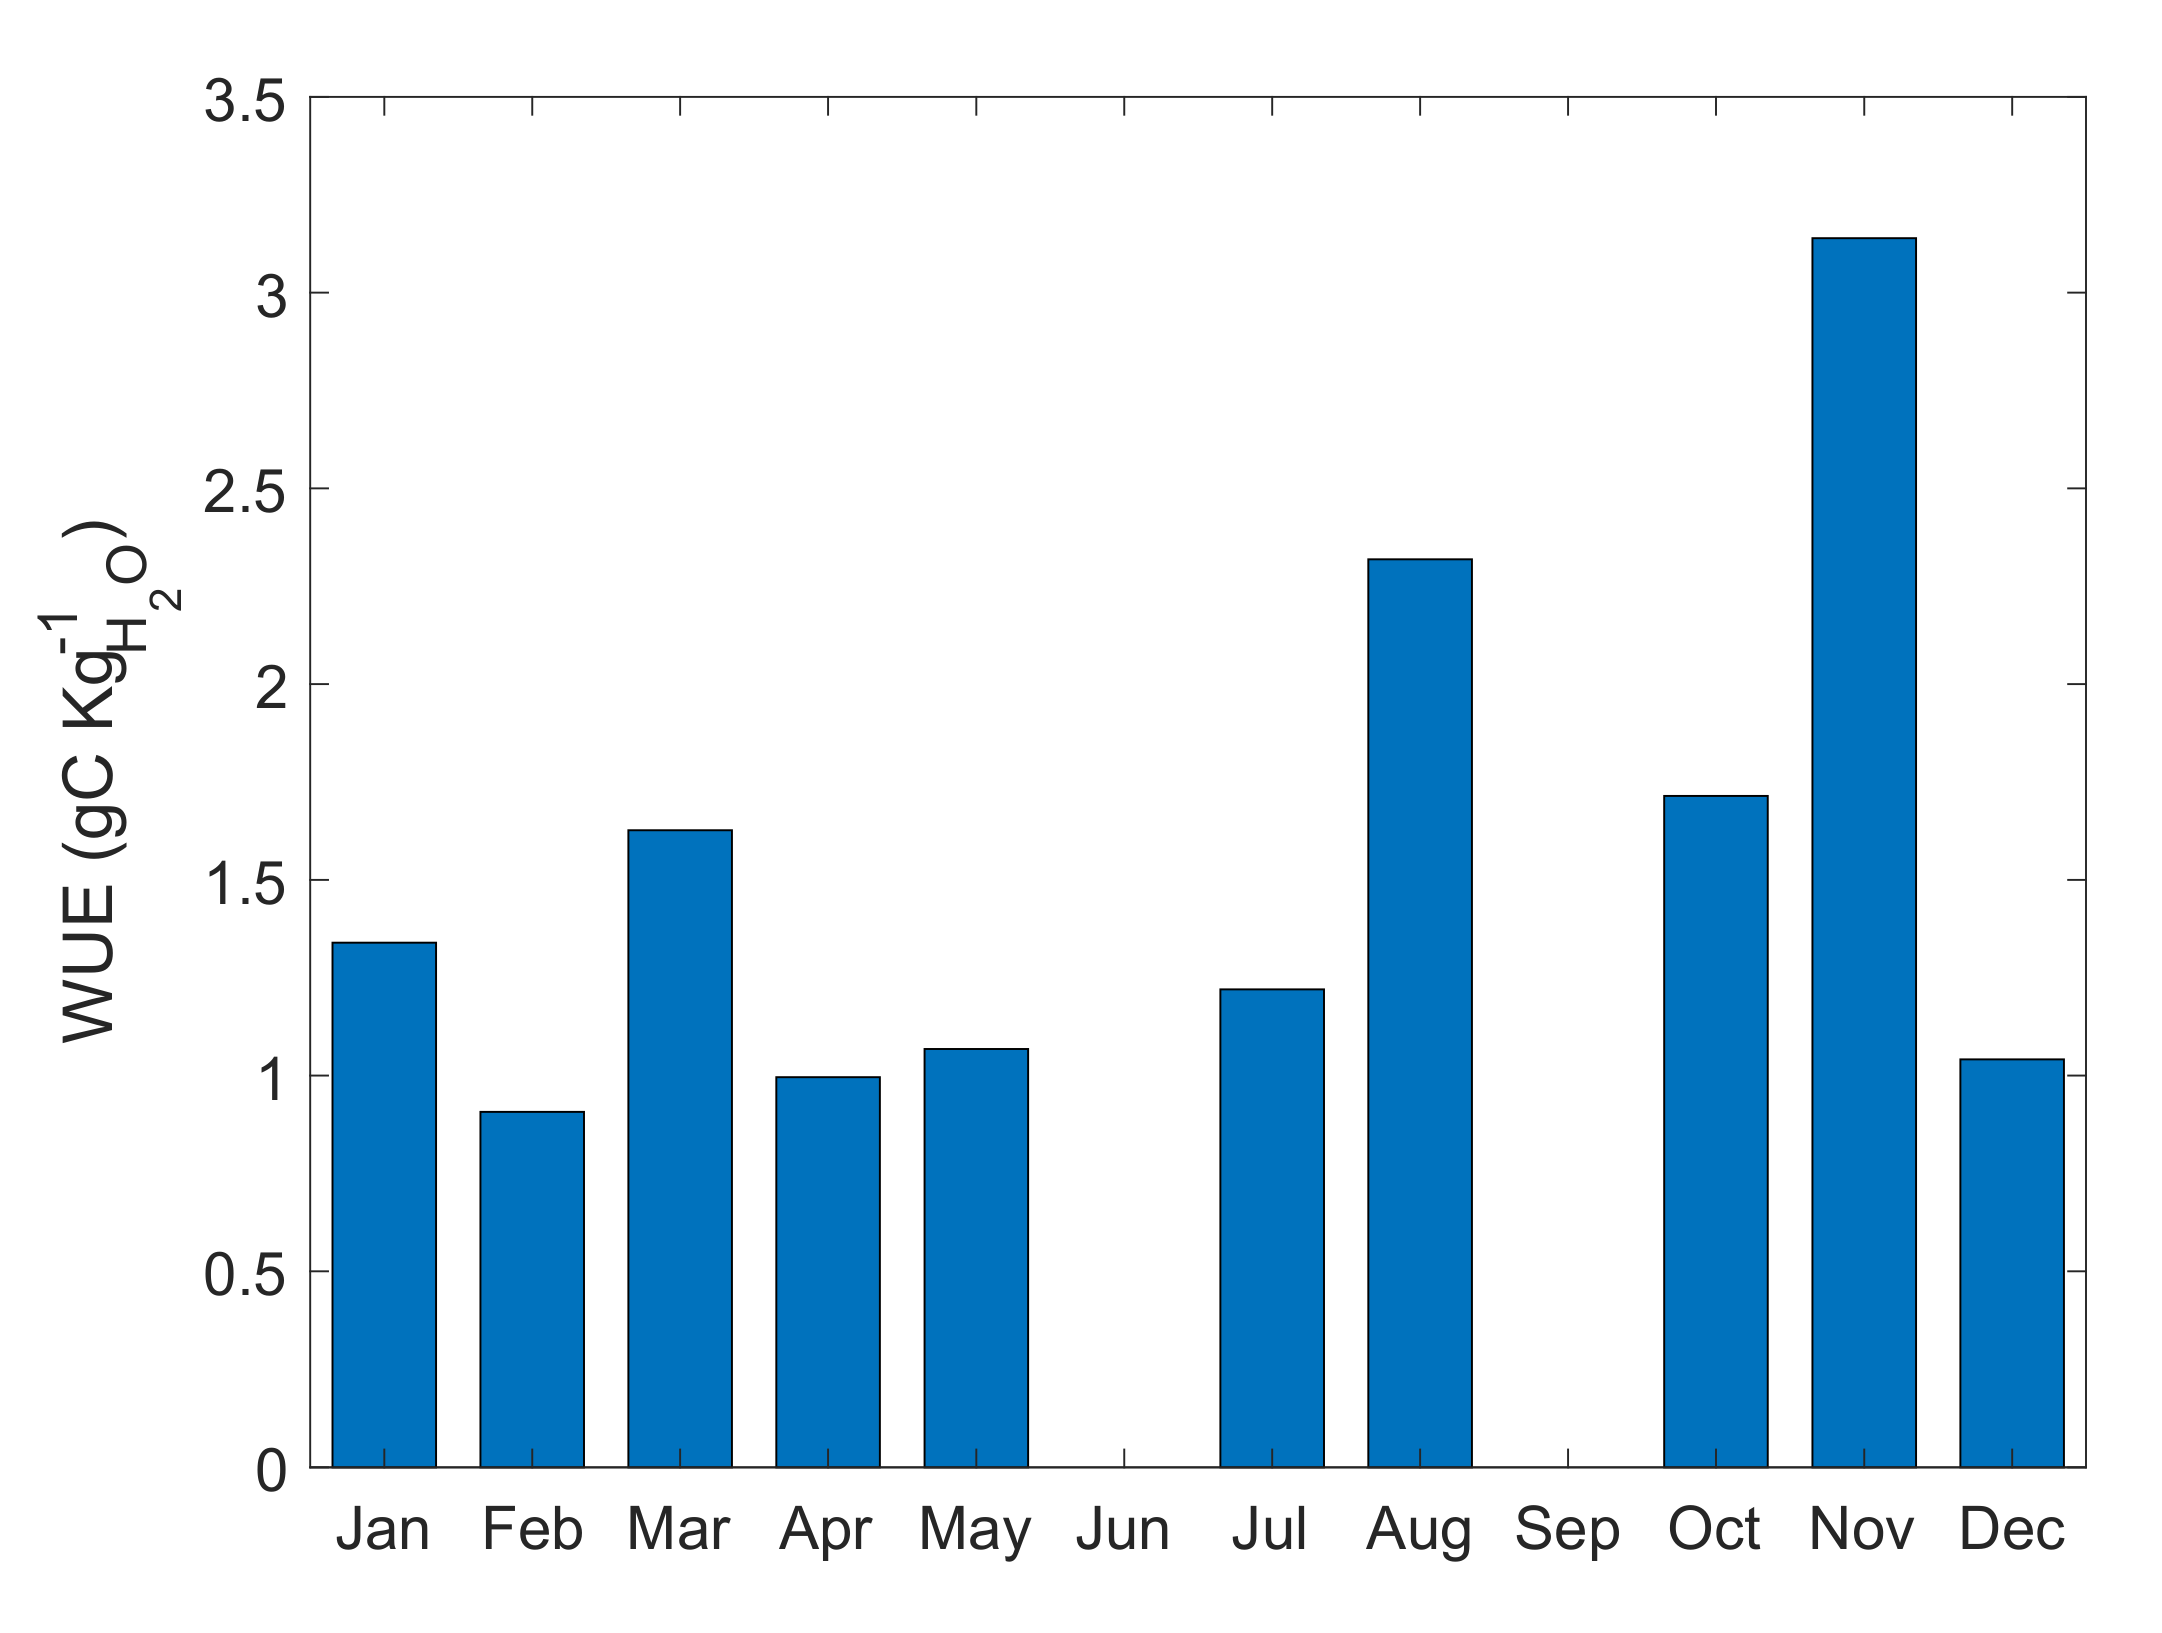
As one of the main concerns of this study was the impact of climate variability and change on coffee production, a link between the productivity in terms of water availability and use was established, given that the rainfall amount and seasonality are known to be affected by climate variability and change. WUE is related to GPP as it is modulated by water, C, and energy feedback between the canopy and the atmosphere. In this case, we used a traditional approach based on the EC-derived GPP and evapotranspiration, with the WUE defined as the ratio between the GPP and E (Figure 10). As we were interested in the annual cycle of WUE, half hourly EC output was used to estimate daily GPP and E to generate monthly averages of WUE.
WUE varied between 1 and 3 gC Kg−1 H2O, with largest WUE values for the months featuring larger numbers of heavy rainfall days. It increased prior to the onset of the first leg of the rainy season and during the second leg of the rainy season. The seasonal behaviour observed for WUE suggests that it is subject to larger intraseasonal variability as a result of the influence of heavy rainfall events for which the surface fluxes present the largest variations, which is consistent with other studies in coffee under full sun exposure [48]. As can be noticed from Figure 10, WUE does not exhibit the largest values as expected during the drier periods. In this case further aspects should be considered as the monitoring continues including the soil moisture storage, the effect of dew as a secondary water input in the system at the beginning of the dry season as well as the impact of irrigation. Such aspects are relevant to be considered in further research utilizing a longer period for the observational EC data, as future climate scenarios project a likely increase in the number of extreme precipitation events, so a direct impact on the WUE seasonal distribution may be expected as a result of warming scenarios.

4. Shading the Coffee Agroecosystem

It is expected that agroforestry systems will enable higher efficiency and the ability to complement the use of the resources available for the coffee plant [41]. Thus, use of shade in coffee systems has been promoted as a strategy for mitigating and adapting to future climates, not only due to such systems’ abilities to regulate mean and maximum air temperature [49] but also because shaded systems are expected to store more carbon than their sun-grown counterparts, thereby contributing to the reduction of greenhouse gases.
To assess the effects of shade trees on WUE and other fluxes in the investigated field site, an EC tower will be installed in a shaded coffee field. We hope to assess not only the existing shade of Erythrina sp. (very common in coffee fields due to their N2 fixation capacity) but also the effect of the arborization of a sparsely shaded coffee field through the employment of diverse native shade trees, planted to imitate the local forest structure and with consideration of natural succession and differences in growth form and longevity. Early successional species with rapid growth and high biomass production and turnover will be planted early (Cecropia sp., Carica papaya. Musa sp., Trema sp., and Acnistus sp., among others), in combination with slow-growing trees that will progressively reach maturity at different heights (Inga sp., Gliricidia sp., Miconia sp., Croton sp., etc). Early agroecosystem arborization can also be assisted by planting “instant trees” (large cuttings; see [50]). Tall, long-lived trees, like Erythrina sp., Diphysa sp., and 
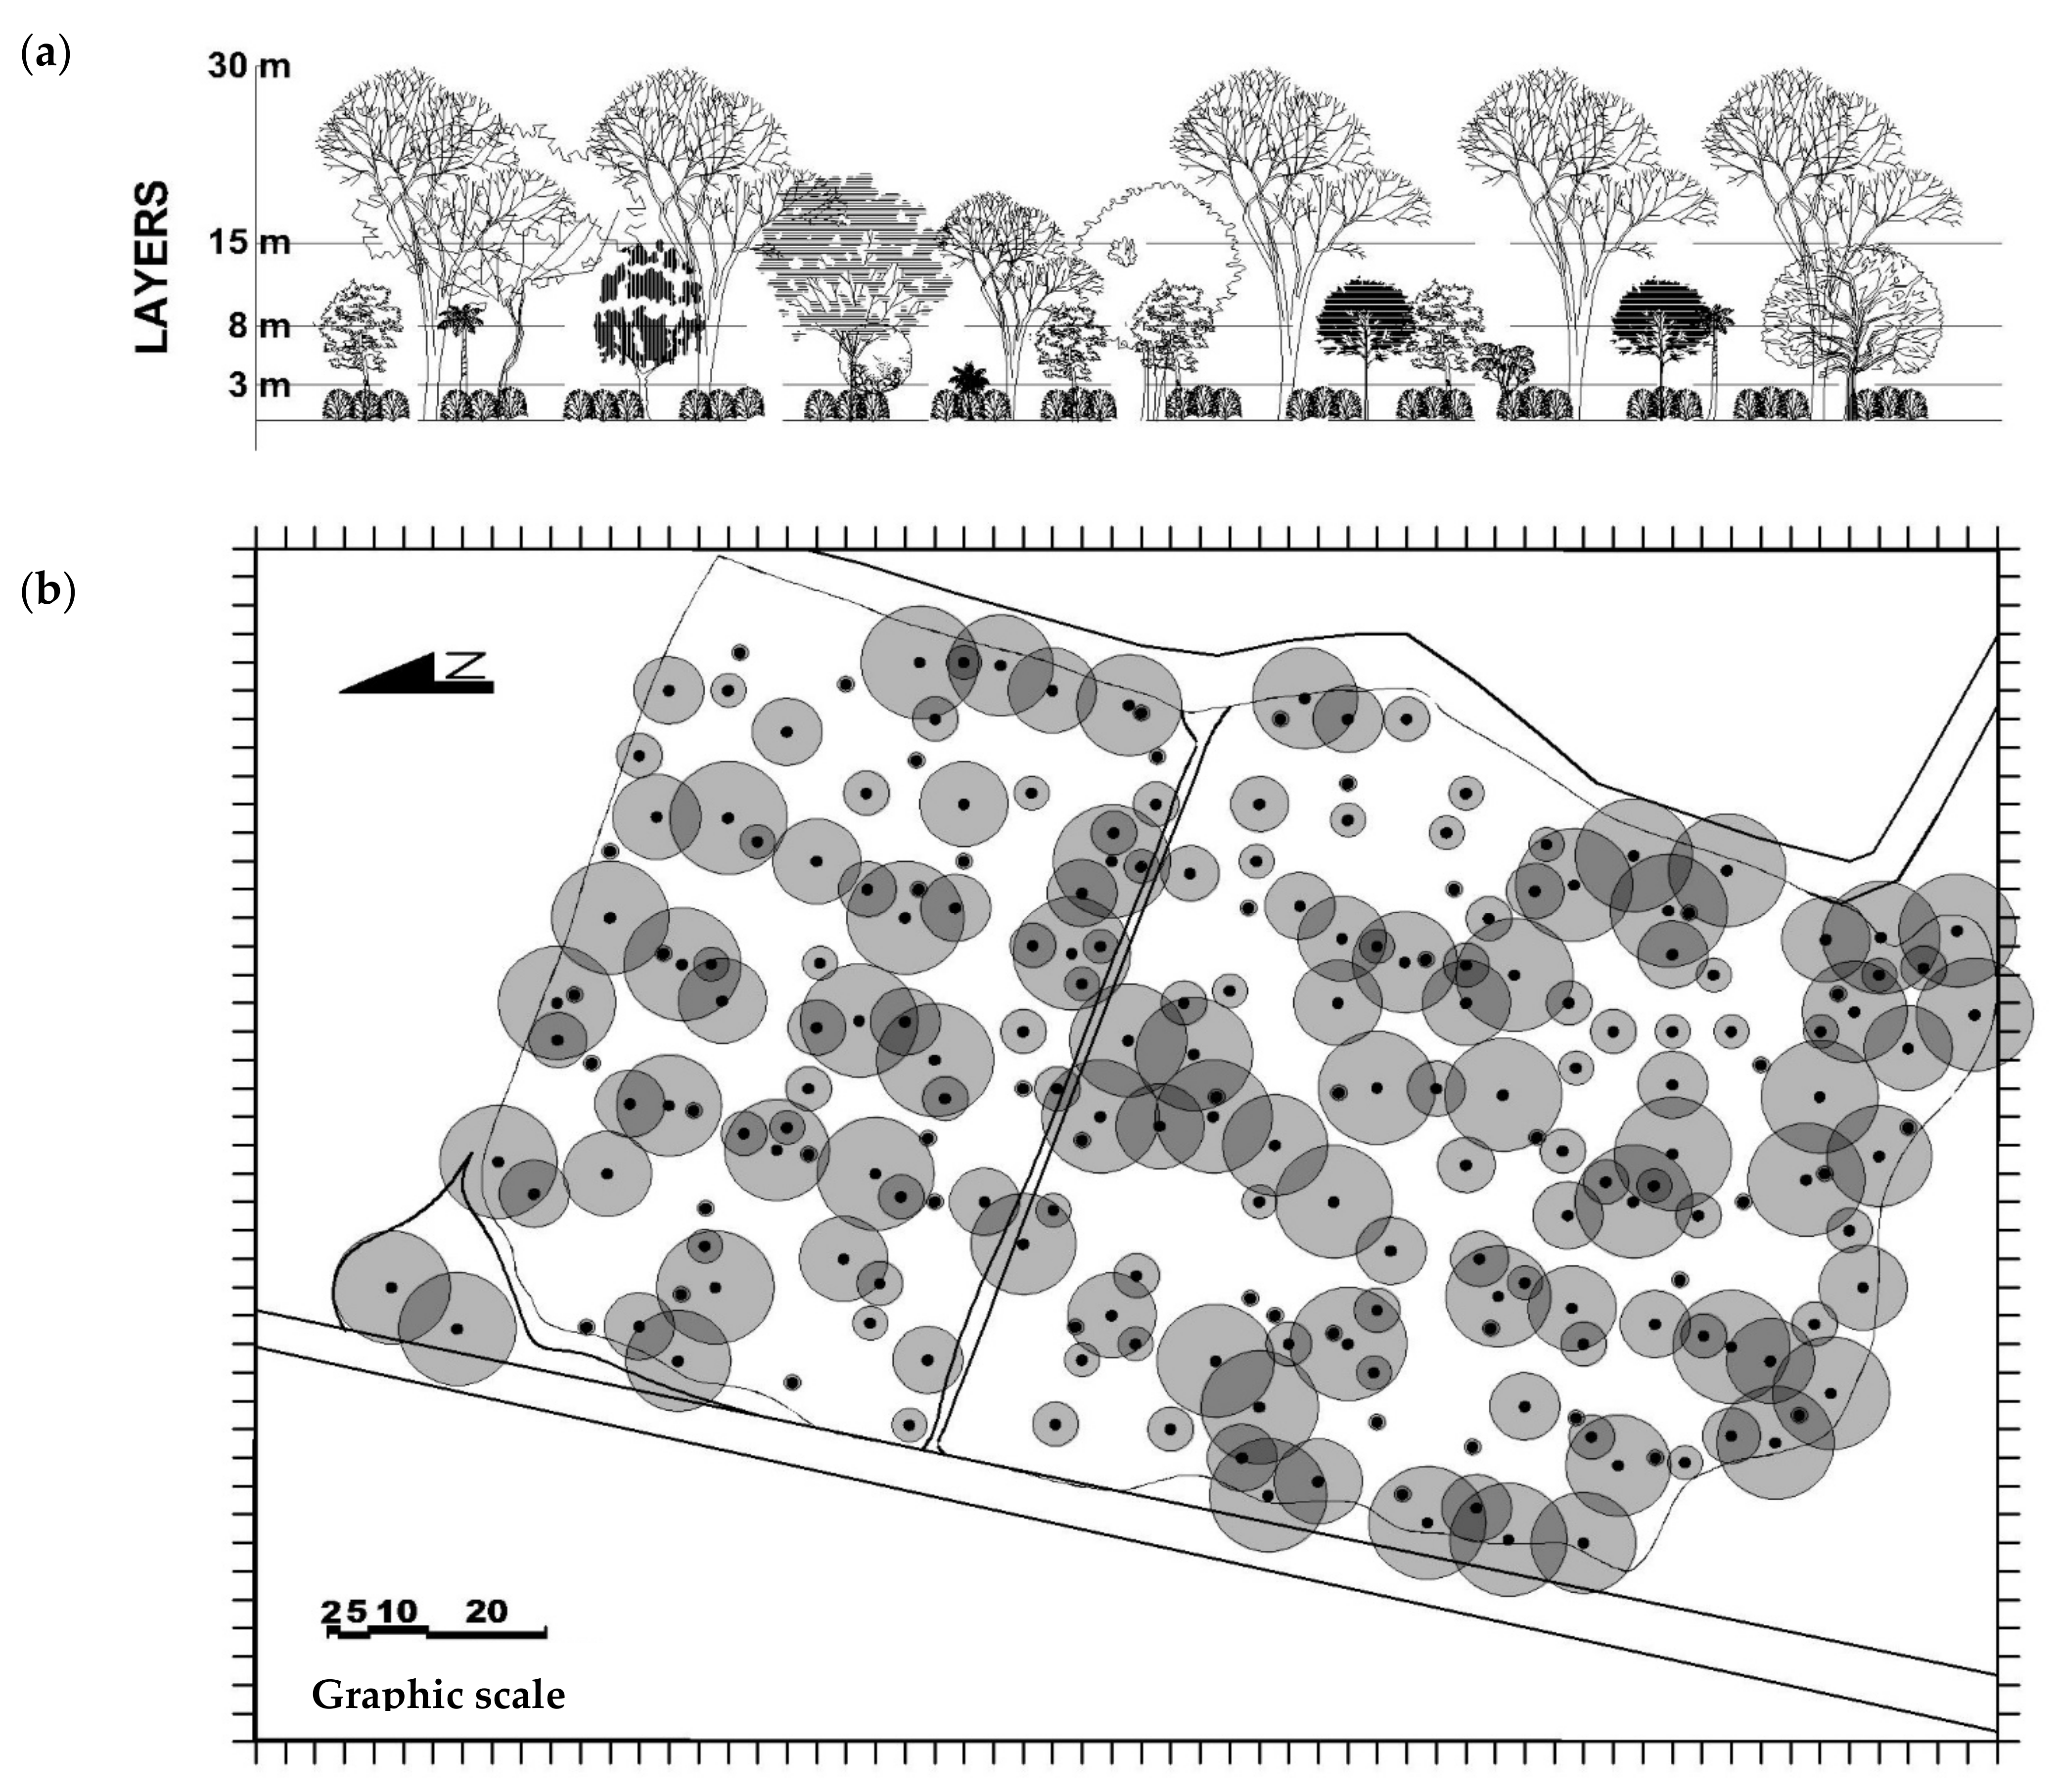
Juglans sp., among others, will later constitute the emergent canopy layer. Shaded agroecosystems may include mixtures of significantly different species, producing a vertically stratified canopy (Figure 11).
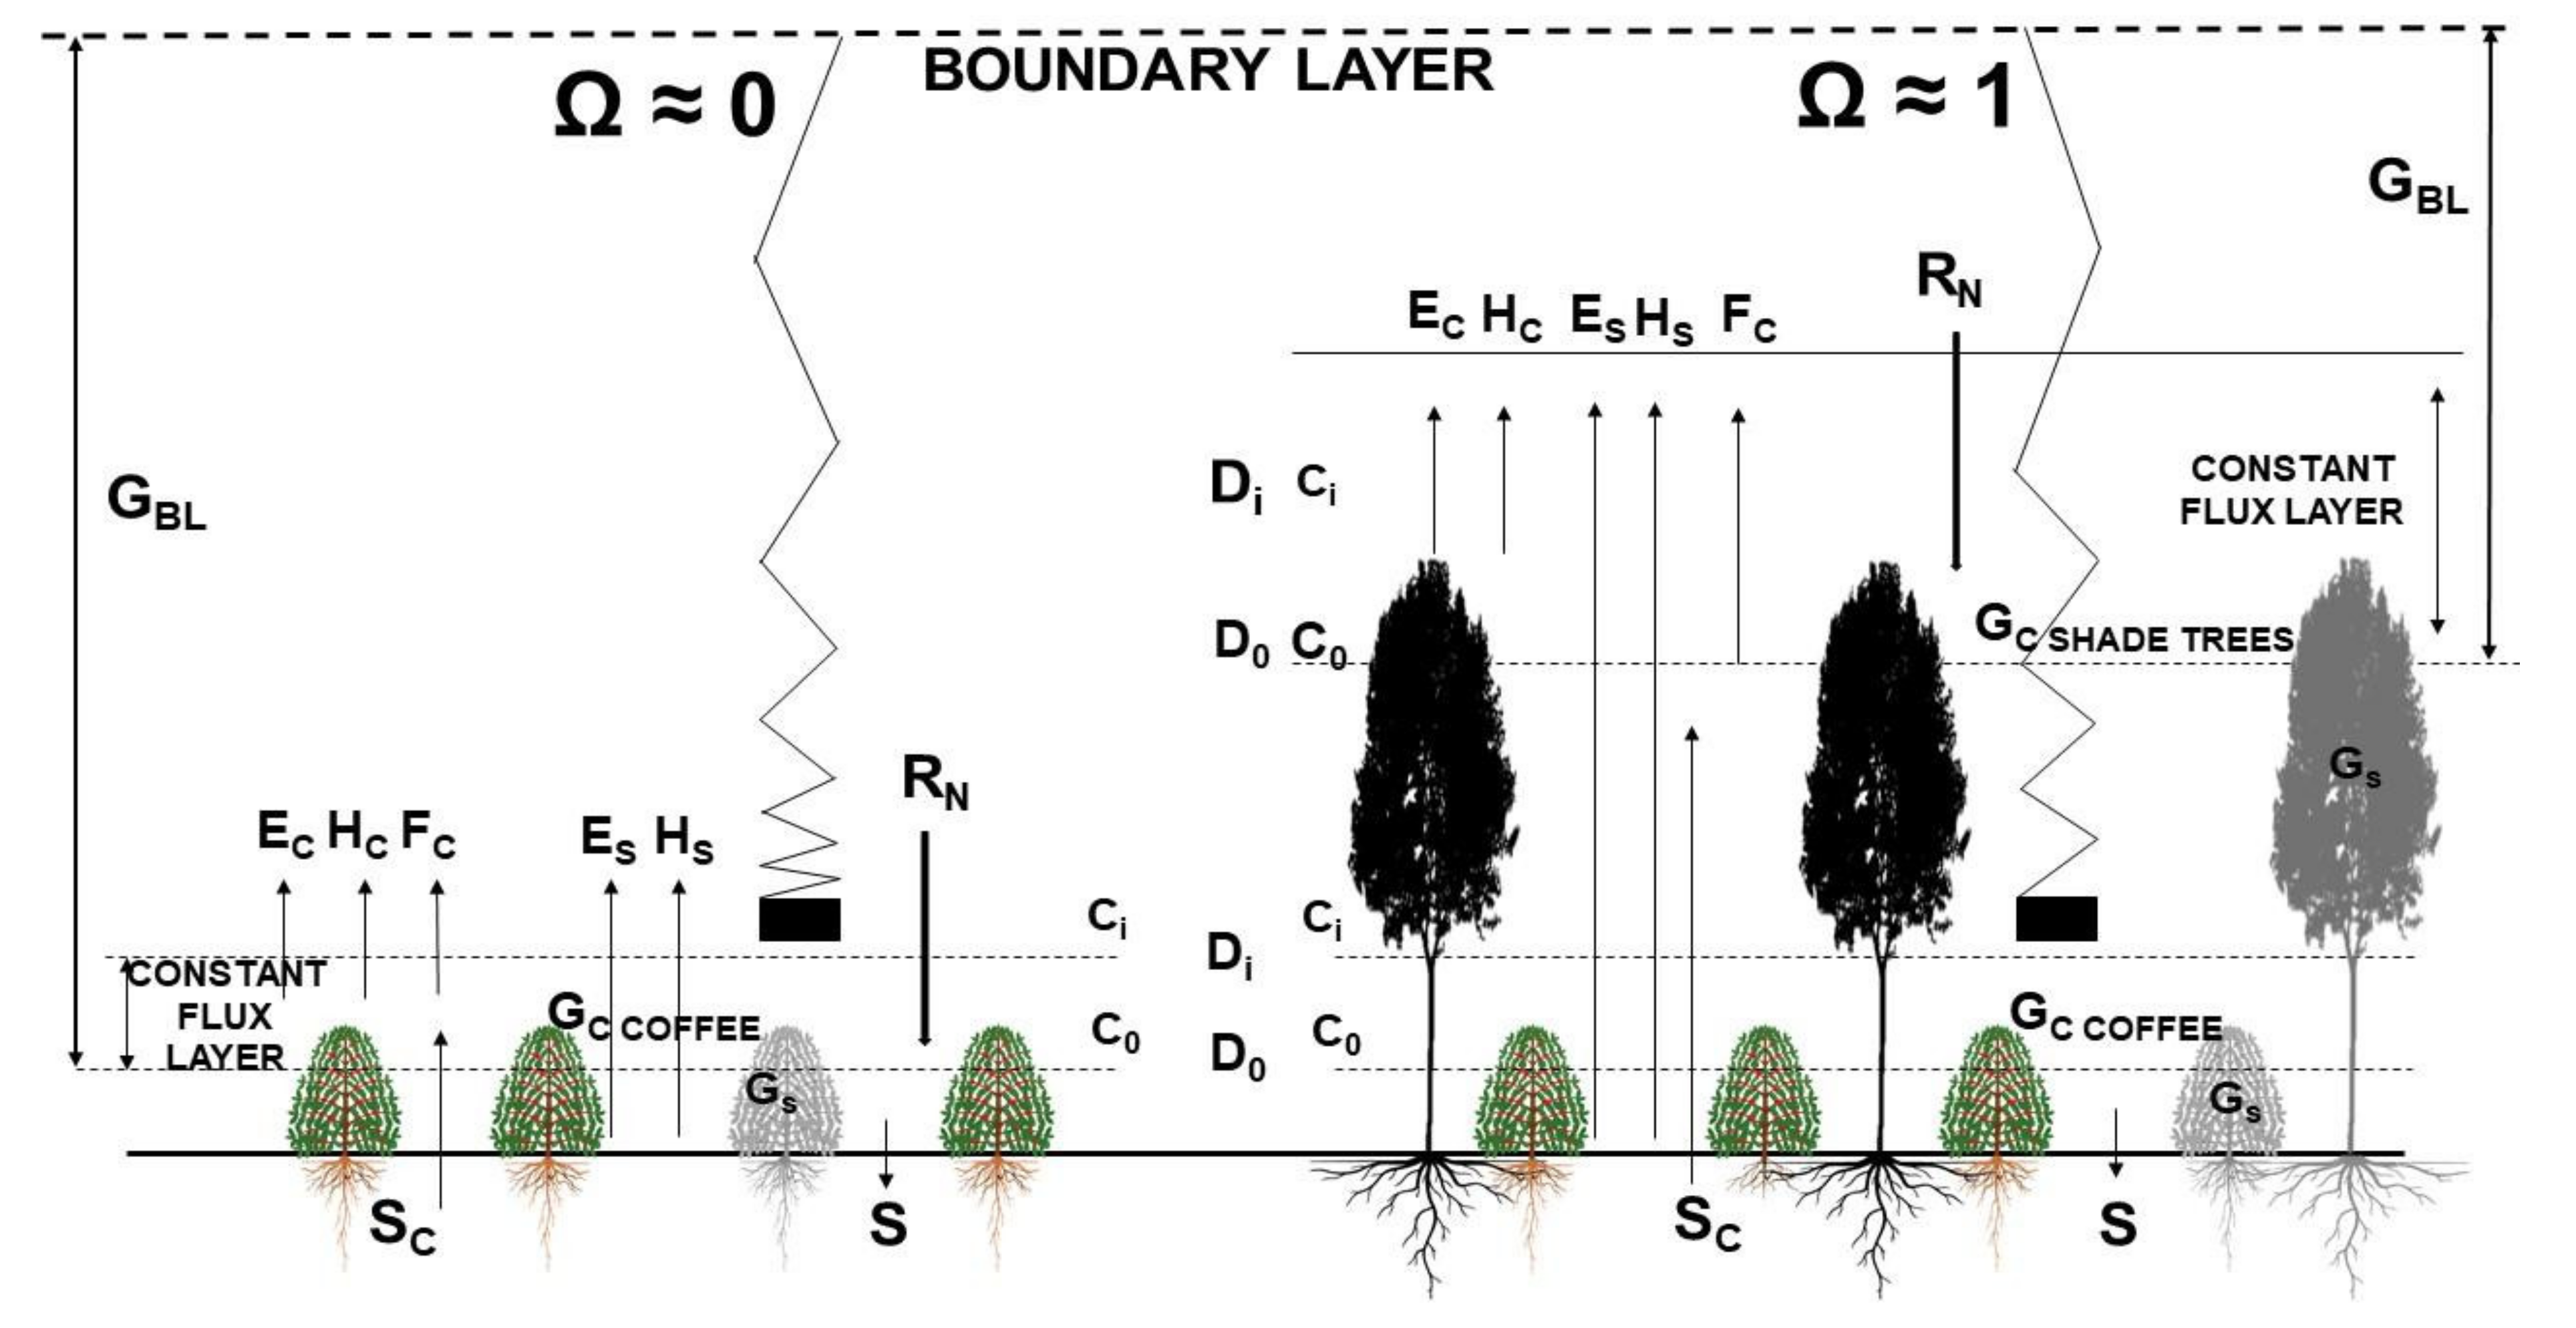
It is expected that shade trees will have a direct impact on WUE as tall shade trees employed as permanent, long-term components of agroforestry systems are aerodynamically rough, generate more turbulence than the short coffee monocrops (2.5–3 m), and have larger roughness lengths and low dragging coefficients [25]. The wind speed experienced by shade trees is also higher because their tops are located higher in the wind speed profile, which results in a high GBL and high coupling (low Ω) with the above-canopy air. Emergent shade trees within a coffee agroecosystem should be well-coupled to the atmosphere above and should easily exchange mass and energy. We argue that tall, overstory shade trees will be tightly coupled to the atmosphere, exert strong stomatal control on E and A, and use CO2 efficiently, especially when compared with the low GBL and high Ω of intensive sun-grown monocrops (Figure 1).
The progressive development of the arborization of the shaded field, and the rapidly increasing shade provided by the fast-growing trees, is expected to progressively decouple the coffee plants from the bulk atmosphere and produce highly resilient, stable agroecosystems, supported, from a yield and climatic perspective, by quantitate carbon balance assessments.

5. Concluding Remarks

The preliminary analysis showed the strong influence of the local climate conditions on the partitioning of energy among the dominant fluxes in productive coffee fields. The data indicated that the sun-grown coffee described in this paper consistently functioned as a C sink, depending on the stage of canopy development, the phenology of the crop—especially the reproductive phase—and the prevailing climatic conditions. Canopy development and structure determine the LAI, light interception, and crop productivity, and they greatly affect the partitioning of the radiative flux between evapotranspiration, heat, and soil heat fluxes. Due to its comparatively small magnitude, FC is often excluded from energy balance analyses, but our results are crucial to the management and the design of coffee agroecosystems and the quest to achieve resilience, sustainability, and high-quality yields. It is reasonable to expect high dynamism in the capacity of the coffee crop to fix carbon, a probable result of the high phenotypic plasticity of this species, which allows its cropping under contrasting sun and shade conditions. For example, during more benign years with reduced water and high temperature stress (i.e., La Niña), we can expect coffee fields to behave as C sinks, while in drier, more stressful years (i.e., El Niño), coffee fields can be rather expected to behave as C sources and experience an overall negative C balance for the year. We can also expect crop canopy coupling with the atmosphere to vary seasonally and phenologically, with more decoupled fields during less stressful periods.
The experimental design allows the collection of fundamental data that can be leveraged for different applications within agrometeorology and agronomy. The future directions for this experiment comprise the comparison with the shade coffee field described in Section 4 and measurement during a period long enough to account for both El Niño–Southern Oscillation (ENSO) phases in order to directly measure the impact of this variability mode for the SPAC coupling and its relationship with WUE and yield... Future directions also include contributions to the modeling community as we are seeking a suitable environment to improve and advance the development of a better boundary layer and hydrological parameterizations based on the observations.
The preliminary results indicate that the evaluation of crops in terms of C fluxes should be considered instead of the use of in situ measurements and that the role of the crop as a C sink should be incorporated to guarantee consumers a more environmentally responsible product. Given the scale of the crops in the Costa Rica and the orography, the performance of climate models is often under-discussion. Surface fluxes remain among the most challenging variables to model because of surface complexity. An initial modeling application on the site was developed by Pateromichelaki [42], who used the surface observations to evaluate the capacities of the soil–vegetation–energy transfer (SVEN) model. The progress facilitates the integral comprehension of the SPAC and motivates the further improvement of surface parameterizations that could be beneficial for the development of regional climate models and also the validation of satellite-derived products.
The preliminary results of the first observed full annual cycle showed the marked seasonality of the surface fluxes and the strong response of the WUE to the establishment of the rainy seasons, as well as the intraseasonal variations in terms of the rainfall intensity of the events. Such results are promising for the exploration of further aspects of the SPAC feedback and of the interaction with rain-producing systems as potential elements to modulate the WUE and likely LUE in coffee plantations. It has been shown how relevant the deployment of this type of experimental setup is for leveraging knowledge on the SPAC and, moreover, for linking the crop with larger scale meteorological conditions. We expect to continue our experimental analysis in order to better inform models and contribute to the development of more robust frameworks to interpret the potential impacts of warming on coffee production.

Author Contributions

C.C.-S., A.M.D.-Q. and M.V.G.-S. developed the ideas and designed the field experiment deployment; M.V.G.-S. contributed to writing—original draft preparation and review; C.C.-S. contributed to writing—review and editing; A.M.D.-Q. processed and analyzed the EC and meteorological data and contributed to writing—review; M.M.-M. contributed to the case study and soil respiration data processing and analysis. All authors have read and agreed to the published version of the manuscript.

Funding

We thank the University of Costa Rica Special Funding for Working Groups 2020 for providing the core funding for this research under grant C0-454.

Acknowledgments

We thank José Miguel Araya, Cristian Porras, Giovanni Mora, Yamilka Corrales, Allan Marín, Federico Montero, Raquel Ramírez-Carranza, and other staff at the Fabio Baudrit experiment station. Special thanks to Mariano Vargas and Grupo Santa Eduviges for their field support. The authors acknowledge the support of the UCR special grant for research groups under project C0454, and the Vice Chancellor Office of Research and of Administration for additional support for equipment installation on the field. The authors acknowledge the contribution of IMN which provided historical data for the Alajuela province as part of the contract IMN-DIM-CM-117-0917.

Conflicts of Interest

The authors declare no conflict of interest.

References

  1. Deshpande, S.; Singh, S.; Panneerselvam, A.; Rajeswari, V.D. 11–Nutrients in Caffeinated Beverages—An Overview. In Caffeinated and Cocoa Based Beverages; Grumezescu, A., Holban, A., Eds.; Woodhead Publishing: Sawston, UK, 2019; pp. 367–389. ISBN 9780128158647. [Google Scholar]
  2. Platteeuw, M. Working for Home: Seasonal Migration and Social Capital as Coping Strategies of Cabecar Coffee Harvesters in Los Santos, Costa Rica. Bachelor’s Thesis, Universiteit Utrecht, Utrecht, The Netherlands, Universidad Nacional, Heredia, Costa Rica, June 2009. Available online: http://dspace.library.uu.nl/bitstream/handle/1874/45213/Maria%20Platteeuw%20-%20final%20bachelor%20thesis%20dig%20vers2.pdf?sequence=1&isAllowed=y (accessed on 16 December 2020).
  3. DaMatta, F.M.; Rahn, E.; Läderach, P.; Ghini, R.; Ramalho, J.C. Why Could the Coffee Crop Endure Climate Change and Global Warming to a Greater Extent than Previously Estimated? Clim. Chang. 2019, 152, 167–178. [Google Scholar] [CrossRef] [Green Version]
  4. Läderach, P.; Ramirez-Villegas, J.; Navarro-Racines, C.; Zelaya, C.; Martinez-Valle, A.; Jarvis, A. Climate Change Adaptation of Coffee Production in Space and Time. Clim. Chang. 2017, 141, 47–62. [Google Scholar] [CrossRef] [Green Version]
  5. ICAFE (Instituto Costarricense del Café). Informe sobre la Actividad Cafetalera de Costa Rica. Available online: http://www.icafe.cr/sector-cafetalero/informacion-de-mercado/informes-de-la-actividad-cafetalera/ (accessed on 16 December 2020).
  6. INEC (Instituto Nacional de Estadística y Censos). VI Censo Nacional Agropecuario. Atlas Estadístico Agropecuario. Available online: http://www.mag.go.cr/bibliotecavirtual/U40-10581.pdf (accessed on 16 December 2020).
  7. DaMatta, F.M.; Grandis, A.; Arenque, B.C.; Buckeridge, M.S. Impacts of Climate Changes on Crop Physiology and Food Quality. Food Res. Int. 2010, 43, 1814–1823. [Google Scholar] [CrossRef]
  8. Bunn, C.; Läderach, P.; Ovalle-Rivera, O.; Kirschke, D. A Bitter Cup: Climate Change Profile of Global Production of Arabica and Robusta Coffee. Clim. Chang. 2015, 129, 89–101. [Google Scholar] [CrossRef] [Green Version]
  9. Pham, Y.; Reardon-Smith, K.; Mushtaq, S.; Cockfield, G. The Impact of Climate Change and Variability on Coffee Production: A Systematic Review. Clim. Chang. 2019, 156, 609–630. [Google Scholar] [CrossRef]
  10. Kath, J.; Byrareddy, V.M.; Craparo, A.; Nguyen-Huy, T.; Mushtaq, S.; Cao, L.; Bossolasco, L. Not so Robust: Robusta Coffee Production Is Highly Sensitive to Temperature. Glob. Chang. Biol. 2020, 26, 3677–3688. [Google Scholar] [CrossRef] [PubMed]
  11. Da Silva Tavares, P.; Giarolla, A.; Chou, S.C.; de Paula Silva, A.J.; de Arruda Lyra, A. Climate Change Impact on the Potential Yield of Arabica Coffee in Southeast Brazil. Reg. Environ. Chang. 2018, 18, 873–883. [Google Scholar] [CrossRef]
  12. Ramírez-Villegas, J.; Salazar, M.; Jarvis, A.; Navarro-Racines, C.E. A Way Forward on Adaptation to Climate Change in Colombian Agriculture: Perspectives Towards 2050. Clim. Chang. 2012, 115, 611–628. [Google Scholar] [CrossRef]
  13. Imbach, P.; Fung, E.; Hannah, L.; Navarro-Racines, C.E.; Roubik, D.W.; Ricketts, T.H.; Harvey, C.A.; Donatti, C.I.; Läderach, P.; Locatelli, B.; et al. Coupling of Pollination Services and Coffee Suitability under Climate Change. Proc. Natl. Acad. Sci. USA 2017, 114, 10438–10442. [Google Scholar] [CrossRef] [Green Version]
  14. Ovalle-Rivera, O.; Läderach, P.; Bunn, C.; Obersteiner, M.; Schroth, G. Projected Shifts in Coffea Arabica Suitability among Major Global Producing Regions Due to Climate Change. PLoS ONE 2015, 10, e0124155. [Google Scholar] [CrossRef] [Green Version]
  15. Avelino, J.; Cristancho, M.; Georgiou, S.; Imbach, P.; Aguilar, L.; Bornemann, G.; Läderach, P.; Anzueto, F.; Hruska, A.J.; Morales, C. The Coffee Rust Crises in Colombia and Central America (2008–2013): Impacts, Plausible Causes and Proposed Solutions. Food Secur. 2015, 7, 303–321. [Google Scholar] [CrossRef] [Green Version]
  16. Moat, J.; Williams, J.; Baena, S.; Wilkinson, T.; Gole, T.W.; Challa, Z.K.; Demissew, S.; Davis, A.P. Resilience Potential of the Ethiopian Coffee Sector under Climate Change. Nat. Plants 2017, 3, 17081. [Google Scholar] [CrossRef]
  17. Defrenet, E.; Roupsard, O.; Van den Meersche, K.; Charbonnier, F.; Perez-Molina, J.P.; Khac, E.; Prieto, I.; Stokes, A.; Roumet, C.; Rapidel, B.; et al. Root Biomass, Turnover and Net Primary Productivity of a Coffee Agroforestry System in Costa Rica: Effects of Soil Depth, Shade Trees, Distance to Row and Coffee Age. Ann. Bot. 2016, 118, 833–851. [Google Scholar] [CrossRef] [PubMed] [Green Version]
  18. Marie, L.; Abdallah, C.; Campa, C.; Courtel, P.; Bordeaux, M.; Navarini, L.; Lonzarich, V.; Bosselmann, A.S.; Turreira-García, N.; Alpizar, E.; et al. G × E Interactions on Yield and Quality in Coffea Arabica: New F1 Hybrids Outperform American Cultivars. Euphytica 2020, 216, 78. [Google Scholar] [CrossRef] [Green Version]
  19. Vaast, P.; Bertrand, B.; Perriot, J.-J.; Guyot, B.; Génard, M. Fruit Thinning and Shade Improve Bean Characteristics and Beverage Quality of Coffee (Coffea Arabica L.) under Optimal Conditions. J. Sci. Food Agric. 2006, 204, 197–204. [Google Scholar] [CrossRef]
  20. Gomes, L.D.C.; Cardoso, I.M.; Mendonça, E.D.S.; Fernandes, R.; Lopes, V.S.; Oliveira, T.S. Trees modify the dynamics of soil CO2 efflux in coffee agroforestry systems. Agric. For. Meteorol. 2016, 224, 30–39. [Google Scholar] [CrossRef]
  21. Sarmiento-Soler, A.; Vast, P.; Hoffmann, M.P.; Jassogne, L.; van Asten, P.; Graefe, S.; Rotter, R.P. Effect of Cropping System, Shade Cover and Altitudinal Gradient on Coffee Yield Components at Mt. Elgon, Uganda. Agric. Ecosyst. Environ. 2020, 295, 12. [Google Scholar] [CrossRef]
  22. Rigal, C.; Xu, J.; Hu, G.; Qiu, M.; Vaast, P. Coffee Production during the Transition Period from Monoculture to Agroforestry Systems in near Optimal Growing Conditions, in Yunnan Province. Agric. Syst. 2020, 177, 102696. [Google Scholar] [CrossRef]
  23. Cerda, R.; Alline, C.; Gary, C.; Tixier, P.; Harvey, C.A.; Krolczyk, L.; Mathiot, C.; Clément, E.; Aubertot, J.-N.; Avelino, J. Effects of Shade, Altitude and Management on Multiple Ecosystem Services in Coffee Agroecosystems. Eur. J. Argon. 2017, 82, 308–319. [Google Scholar] [CrossRef]
  24. McNaughton, K.G. Regional interactions between canopies and the atmosphere. In Plant Canopies: Their Growth Form and Function; Russell, G., Marshall, B., Jarvis, P.G., Eds.; Cambridge University Press: Cambridge, UK, 1989; pp. 63–81. ISBN 0521328381. [Google Scholar]
  25. Jarvis, P.G. Transpiration and assimilation of tree and agricultural crops: The ‘omega factor’. In Proceedings of the Conference on the Attributes of Trees as Crop Plants, Gorebridge, Scotland, UK, 15–21 July 1984; Institute of Terrestrial Ecology: Abbots Huntingdon, UK, 1985. [Google Scholar]
  26. Jarvis, P.G.; McNaughton, K.G. Stomatal Control of Transpiration: Scaling Up from Leaf to Region. Adv. Ecol. Res. 1986, 15, 1–49. [Google Scholar] [CrossRef]
  27. De Kauwe, M.G.; Medlyn, B.E.; Knauer, J.; Williams, C.A. Ideas and Perspectives: How Coupled Is the Vegetation to the Boundary Layer? Biogeosciences 2017, 14, 4435–4453. [Google Scholar] [CrossRef] [Green Version]
  28. Meinzer, F.C.; Goldstein, G. Scaling up from Leaves to Whole Plants and Canopies for Photosynthetic Gas Exchange. In Tropical Forest Plant Ecophysiology; Mulkey, S.S., Chazdon, R.L., Smith, A.P., Eds.; Springer: Boston, MA, USA, 1996; pp. 114–138. [Google Scholar]
  29. Meinzer, F.C. Stomatal control of transpiration. Trends Ecol. Evol. 1993, 8, 289–294. [Google Scholar] [CrossRef]
  30. Martin, P. The Significance of Radiative Coupling between Vegetation and the Atmosphere. Agric. For. Meteorol. 1989, 49, 45–53. [Google Scholar] [CrossRef]
  31. Moureaux, C.; Ceschia, E.; Arriga, N.; Béziat, P.; Eugster, W.; Kutsch, W.L. Eddy Covariance Measurements over Crops. In Eddy Covariance: A Practical Guide to Measurement and Data Analysis; Aubinet, M., Vesala, T., Papale, D., Eds.; Springer: Dordrecht, The Netherlands, 2012; pp. 319–331. ISBN 978-94-007-2351-1. [Google Scholar]
  32. Durán Quesada, A.M.; Sorí, R.; Ordoñez, P.; Gimeno, L. Climate Perspectives in the Intra–Americas Seas. Atmosphere 2020, 11, 959. [Google Scholar] [CrossRef]
  33. Maldonado, T.; Rutgersson, A.; Alfaro, E.; Amador, J.; Claremar, B.; Jose, S.; Rica, C. Interannual Variability of the Midsummer Drought in Central America and the Connection with Sea Surface Temperatures. Adv. Geosci. 2016, 42, 35–50. [Google Scholar] [CrossRef] [Green Version]
  34. Foken, T.; Göockede, M.; Mauder, M.; Mahrt, L.; Amiro, B.; Munger, W. Post-Field Data Quality Control. In Handbook of Micrometeorology; Lee, X., Massman, W., Law, B., Eds.; Springer: Dordrecht, The Netherlands, 2004; Volume 29, pp. 181–208. [Google Scholar] [CrossRef]
  35. Aparecido, L.E.D.O.; Rolim, G.D.S. Forecasting of the annual yield of Arabic coffee using water deficiency. Pesqui. Agropecu. Bras. 2018, 53, 1299–1310. [Google Scholar] [CrossRef]
  36. Loescher, H.W.; Law, B.; Mahrt, L.; Hollinger, D.Y.; Campbell, J.; Wofsy, S.C. Uncertainties in, and interpretation of, carbon flux estimates using the eddy covariance technique. J. Geophys. Res. 2006, 111, 19. [Google Scholar] [CrossRef] [Green Version]
  37. Metcalfe, D.B.; Meir, P.; Aragão, L.E.O.C.; Malhi, Y.; Da Costa, A.C.L.; Braga, A.; Gonçalves, P.H.L.; De Athaydes, J.; De Almeida, S.S.; Williams, M. Factors controlling spatio-temporal variation in carbon dioxide efflux from surface litter, roots, and soil organic matter at four rain forest sites in the eastern Amazon. J. Geophys. Res. Biogeosci. 2007, 112, 9. [Google Scholar] [CrossRef] [Green Version]
  38. Fan, L.; Yang, M.-Z.; Han, W.-Y. Soil respiration under different land uses in Eastern China. PLoS ONE 2015, 10, e0124198. [Google Scholar] [CrossRef] [Green Version]
  39. Righi, C.A.; Lunz, A.M.P.; Bernardes, M.S.; Pereira, C.R.; Dourado-Neto, D.; Favarin, J.L. Radiation availability in agro-forestry system of coffee and rubber trees. Rev. Árvore 2008, 32, 781–792. [Google Scholar] [CrossRef]
  40. Kuzyakov, Y.; Gavrichkova, O. Time lag between photosynthesis and carbon dioxide efflux from soil: A review of mechanisms and controls. Glob. Chang. Biol. 2010, 16, 3386–3406. [Google Scholar] [CrossRef]
  41. LI-COR Biosciences. Soil CO2 Flux Measurements: Addressing Spatial Variability: Determining the Number of Readings Required. 8100 App Note. 2006. Available online: https://www.licor.com/documents/l6f6kasdr2ouhxhxo14u (accessed on 13 June 2021).
  42. Pateromichelaki, I.M. Effects of Shading on the Radiation Budget and Water Use Efficiency of Coffee Plantations in Costa Rica. Master’s Thesis, Denmark Technical University, Lyngby, Denmark, 2020, unpublished. [Google Scholar]
  43. Ham, J.M.; Heilman, J.L.; Lascano, R.J. Soil and Canopy Energy Balances of a Row Crop at Partial Cover. Agron. J. 1991, 83, 744–753. [Google Scholar] [CrossRef]
  44. Gutiérrez, M.V.; Meinzer, F.C. Energy Balance and Latent Heat Flux Partitioning in Coffee Hedgerows at Different Stages of Canopy Development. Agric. For. Meteorol. 1994, 68, 173–186. [Google Scholar] [CrossRef]
  45. Dynamax. 2007. Dynagage Sap Flow Sensor User Manual. Available online: https://dynamax.com/images/uploads/papers/Dynagage_Manual.pdf (accessed on 13 June 2021).
  46. Monteith, J.; Campbell, G.; Potter, E. Theory and performance of a dynamic diffusion porometer. Agric. For. Meteorol. 1988, 44, 27–38. [Google Scholar] [CrossRef]
  47. Gutiérrez, M.V.; Meinzer, F.C. Regulation of transpiration in coffee hedgerows: Covariation of environmental variables and apparent responses of stomata to wind and humidity. Plant Cell Environ. 1994, 17, 1305–1313. [Google Scholar] [CrossRef]
  48. Castaño-Marín, A.M. Dinámica de la Energía, el agua y el Carbono en Agroecosystemas Cafeteros. Ph.D. Thesis, Universidad del Cauca, Cauca, Columbia, 2017; 139p. (In Spanish). [Google Scholar]
  49. Gutiérrez, M.V.; Meinzer, F.C. Carbon Isotope Discrimination and Photosynthetic Gas Exchange in Coffee Hedgerows during Canopy Development. Aust. J. Plant Physiol. 1994, 21, 207–219. [Google Scholar] [CrossRef]
  50. Zahawi, R.A. Instant Trees: Using Giant Vegetative Stakes in Tropical Forest Restoration. For. Ecol. Manag. 2008, 255, 3013–3016. [Google Scholar] [CrossRef]
Figure 1. Schematic representation of canopy structure, driving forces, main fluxes, and conductances along the soil–plant–atmosphere continuum in a coffee monoculture exposed to full sun radiation (left side) and an agroforestry system (right side) with coffee as the main crop and several species of shade trees in Costa Rica. GC is the canopy conductance, GBL is the boundary layer conductance, D is the vapor pressure deficit of air, H is the latent heat from plant canopies and soil (HC and HS, respectively), E is the evaporation from plant canopies and soil (EC and ES, respectively), FC is the carbon assimilation by coffee shrubs and shade trees, FS is the CO2 emissions from soil (soil respiration), S is the soil heat flux, C is the CO2 concentration, and Ω is the omega factor. X0 and XI denote localization of measurements at the leaf surface or within the boundary layer, respectively.
Forests 12 00889 g001
Figure 2. Geographic location of the study site, Finca La Hilda San Pedro de Poás, Alajuela, Costa Rica. (a) Map with the distribution of the instrumentation (fluxes tower, sky blue star; meteorological station, orange square) and in situ measurement sites (soil respiration and moisture in red circles); (b) locations of the long-term weather stations used for the climate analysis based on the 1999–2019 period; the experiment site is marked with a star symbol that refers to the site marked by the same symbol in (a). The orography in the area is such that relatively short distances (~10 km) have enough slope to cause relevant temperature differences between the sites.
Forests 12 00889 g002
Figure 3. Climate diagram of la Hilda study site in San Pedro de Poás, Alajuela, Costa Rica; average for the 2009–2019 period. The ordinate represents the monthly mean temperature and black numbers on the temperature axis correspond to mean daily minimum and mean daily maximum values within the total period. The solid blue shaded area represents months with more than 100 mm rainfall. The red dotted area represents dry months.
Forests 12 00889 g003
Figure 4. Data from the period from 1999 to 2020 showing (a) average accumulated precipitation, (b) mean temperature, and (c) relative humidity for the weather stations near La Hilda site in Alajuela. Alajuela, SJO, and La Garita are low elevation sites, while EEAFBM and Fraijanes are in the lower and upper limits of the elevation gradient at La Hilda. For the Alajuela site, only rainfall data were available for the selected period. Monthly accumulates and averages were estimated based on hourly data provided by the National Meteorological Institute.
Forests 12 00889 g004
Figure 5. Views of sun-grown coffee fields exposed to full radiation at La Hilda (10.0893″ N, 84.235088″ W). (a) Coffee hedgerows were re-designed from spacings of 1.8 m between hedgerows and 1 m between plants (5555 plants/ha) to (b) 3.6 m between hedgerows and 0.8 m between plants (2777 plants/ha). In this innovative production system, emphasis is on hedgerow structure and functioning and the re-distribution of the leaf area index, with relatively less attention paid to individual coffee plants. The interrow space is planted with deep-rooted Brachiaria sp., which promotes soil and ecosystem health.
Forests 12 00889 g005
Figure 6. Yields of conventional (5555 plants/h) and innovative (2777 plants/h) sun-exposed coffee fields at La Hilda. Two production systems are shown for a period of eleven years. The arrows indicate pruning of fields. The first and second pruning events occurred in years 5 and 8, respectively.
Forests 12 00889 g006
Figure 7. Preliminary results for the annual cycle of the average (a) latent heat flux (LE) and (b) sensible heat flux (H) and the monthly accumulated (c) precipitation and (d) evapotranspiration (E) for 2020 in the sun-grown coffee crop, according to EC measurements. Flux responses to the establishment of the rainy season around May can be observed. In the fluxes convention used, positive (negative) represents the up (down) direction.
Forests 12 00889 g007aForests 12 00889 g007b
Figure 8. Preliminary results showing the annual cycle and variability of average (a) CO2 flux and (b) gross primary productivity for the sun-exposed coffee plantation based on the EC measurements for 2020. Thick black lines in plot (a) are the means. (c) Average soil CO2 fluxes (μmol m−2 s−1) from direct soil measurements with the LI-8100 and (d) soil water content (% v/v) of the sun-grown coffee field. The measurement period for plots (c,d) was from July to December 2020 (n = 20).
Forests 12 00889 g008
Figure 9. Example of a representative diurnal course of sap flow and stomatal conductance in relation to photosynthetically active radiation (PAR) and vapor pressure deficit (D) during the rainy season (29 October 2020) in a sun-grown coffee field in Costa Rica. Sap flow was measured in six coffee plants simultaneously; the average stem diameter was 28 mm and leaf area distal to the gauge was 2.5 m2. Stomatal conductance was measured during the day in sun and shade, for upper and lower leaves, in plants with (o) and without () sap flow gauges installed on their stems.
Forests 12 00889 g009
Figure 10. Annual cycle of monthly averages of WUE (gC Kg−1 H2O) for the sun-exposed coffee plantation based on the EC measurements for 2020. Note that the largest WUE values were observed for the months in which the number of heavy rainfall events was larger.
Forests 12 00889 g010
Figure 11. Arborization plan for a shaded coffee field employing diverse native shade trees, planted to imitate the local forest structure. (a) Layer 1, showing the soil surface to 3 m aboveground, is composed of coffee shrubs and short-stature plants, such as ground covers (e.g., Brachiaria) and insect-friendly species. Layers 2 and 3 (3–8 m and 8–15 m) are made up of low-stature trees and shrubs. Layer 4 corresponds to large-stature emergent canopy trees, which constitute the permanent backbone of the agroforestry system. (b) General view of the arborized plot. Circle sizes represent the expected shade size.
Forests 12 00889 g011
Publisher’s Note: MDPI stays neutral with regard to jurisdictional claims in published maps and institutional affiliations.

