Article

Under-Canopy UAV Laser Scanning Providing Canopy Height and Stem Volume Accurately

1
Department of Remote Sensing and Photogrammetry, Finnish Geospatial Research Institute, 02430 Masala, Finland
2
Department of Built Environment, School of Engineering, Aalto University, P.O. Box 11000, 00076 Aalto, Finland
3
Department of Geography and Geology, University of Turku, 20014 Turku, Finland
*
Author to whom correspondence should be addressed.
Forests 2021, 12(7), 856; https://doi.org/10.3390/f12070856
Submission received: 31 March 2021 / Revised: 24 May 2021 / Accepted: 23 June 2021 / Published: 29 June 2021
(This article belongs to the Special Issue Forestry Applications of Unmanned Aerial Vehicles (UAVs) 2020)

Abstract

:
The automation of forest field reference data collection has been an intensive research objective for laser scanning scientists ever since the invention of terrestrial laser scanning more than two decades ago. In this study, we demonstrated that an under-canopy UAV laser scanning system utilizing a rotating laser scanner can alone provide accurate estimates of canopy height and stem volume for the majority of trees in a boreal forest. We mounted a rotating laser scanner based on a Velodyne VLP-16 sensor onboard a manually piloted UAV. The UAV was commanded with the help of a live video feed from the onboard camera. Since the system was based on a rotating laser scanner providing varying view angles, all important elements such as treetops, branches, trunks, and ground could be recorded with laser hits. In an experiment including two different forest structures, namely sparse and obstructed canopy, we showed that our system can measure the heights of individual trees with a bias of −20 cm and a standard error of 40 cm in the sparse forest and with a bias of −65 cm and a standard error of 1 m in the obstructed forest. The accuracy of the obtained tree height estimates was equivalent to airborne above-canopy UAV surveys conducted in similar forest conditions or even at the same sites. The higher underestimation and higher inaccuracy in the obstructed site can be attributed to three trees with a height exceeding 25 m and the reduced point density of these tree tops due to occlusion and the limited ranging capacity of the scanner. Additionally, we used our system to estimate the stem volumes of individual trees with a standard error at the level of 10%. This level of error is equivalent to the error obtained when merging above-canopy UAV laser scanner data with terrestrial point cloud data. The results show that we do not necessarily need a combination of terrestrial point clouds and point clouds collected using above-canopy UAV systems in order to accurately estimate the heights and the volumes of individual trees in reference data collection.

Graphical Abstract

1. Introduction

Since the adaptation of airborne laser scanning for operative forest inventories, especially in the boreal zone, research in remote sensing of forests has moved towards automating forest field reference data collection at the plot level with the goal of using this reference data for the calibration of airborne lidar surveys. Conventional plot-level field inventories are mainly based on calipers, measuring tapes and hypsometers, and the consistency and accuracy of such measurements has been reported to be variable [1]. For example, tree heights can be obtained with 2–3% errors using conventional instruments (clinometer, hypsometer, rangefinder) when well-trained staff are used. The biometric (e.g., density of the forest) and topographic factors explain most of the remaining errors [1,2]. In Luoma et al. [1], the largest difference within repeated conventional measurements of the same tree was less than 1.5 m for 73.3% of the trees.
The need for forest information varies. However, increasingly, there are multiple uses that require the optimization of forest resources. In field reference data collection, a selective sampling of trees is needed, and the most important forest parameters to measure include, e.g., tree position, diameter at breast height (DBH), tree height, stem form, and other physical traits. When it comes to the amount of wood, the stem volume for each species is the most important parameter to be measured. The most accurate way to estimate the stem volume is based on an accurate definition of stem curve/form as a function of the height from ground.
Airborne laser scanning (ALS) has been known to provide the height of trees with a good accuracy for more than 20 years [3]. In many studies and reviews, the quality of the field reference data used to judge ALS-based tree heights has been questioned [3,4,5]. Since the advent of unmanned aerial vehicle (UAV)-based laser scanning systems, with most enabling a high point density (Jaakkola et al. [6]), tree height estimates with a high accuracy have been reported. In Jaakkola et al. [6], tree heights were obtained with 40 cm accuracy using mini-UAV laser scanning. A similar system was developed by Wallace et al. [7], and they showed that the standard error of tree height was reduced to 0.15 m when the higher density data were used.
Lovell et al. [8] pioneered the research on terrestrial laser scanning (TLS) for forest inventory. With TLS, the capacity to provide tree heights has been significantly limited. In a review of TLS technology by Liang et al. [9], tree height estimation accuracies were broadly reported during 2004–2014. Using the single scan approach and 16 plots of varying density, a root-mean-square error (RMSE) of 4.9 m was reported for tree height estimation in Olofsson et al. [10]. Recently, Wang et al. [11] concluded that TLS has a limited capacity to measure tree height for trees taller than 15 m in dense stands, mainly due to the occlusion of the upper crowns. According to them, the TLS point clouds completely captured most of the suppressed trees, for which the TLS-measured tree heights were highly accurate. Furthermore, they reported that the root-mean-square deviation between TLS-measured tree heights and field-measured tree heights was 1.4 m for trees with a height of 15–20 m and 2.4 m for trees with a height exceeding 20 m. Multi-scan approaches increase the height estimation accuracy. As a summary, the density of the forest canopy and the number of scans determine the obtained accuracy for tree height when using a TLS system for the measurement.
Despite the need for accurate tree height estimates, the accuracy of tree height estimation has only been discussed in a few previous studies utilizing a mobile laser scanning (MLS) system. In Liang et al. [12], a phase-based mobile laser scanner operated from an all-terrain vehicle and from a backpack was used to measure tree heights. RMSEs of 3.7 m, 5.3 m and 5.3 m were reported for tree height in easy, medium and difficult forests. Such categories were based on the amount of occlusion at the ground level, the spatial stem density, and the distribution of the diameter at breast height [12]. Cabo et al. [13] and Gianneti et al. [14] reported that the tree height estimation of trees taller than 15 m is considerably hindered by the limited range measurement capacity of the hand-held laser scanner. In our previous studies [15,16,17], we observed that MLS (backpack/hand-held laser scanner with SLAM (Simultaneous Localization and Mapping)) can provide tree heights with an accuracy of 1 m. Recently, Ko et al. [18] showed that backpack laser scanning can provide the individual tree heights with an error less than 2 m using the Velodyne VLP-16 sensor.
Even though stem volume is one of the most important tree attributes to be derived in a forest inventory, only a few published mobile laser scanning studies have reported accurate stem volume estimates until recently [12,19,20]. These studies have reported relative RMSEs ranging from 20% to 50% in easy, medium and difficult boreal forests, which are not yet sufficient for operational field reference data collection. Operational work requires a relative RMSE of approximately 10% based on Finnish forest conditions and current practices [21]. In our recent paper using under-canopy UAV laser scanning [16], we were able to obtain high-quality stem volume estimates (error 10.1%) by combining stem curves estimated from the under-canopy UAV data with tree heights estimated from above-canopy UAV data.
An under-canopy flying UAV for forest measurements was first proposed by Vandapel et al. [22]. Vian and Przylbylko [23] visioned a remote sensing sensor system to generate measurement information using under-canopy flights. Chisholm et al. [24] prototyped a UAV-mounted lidar flying along the forest road and they showed that the UAV-mounted lidar system was capable of measuring diameters of trees along this road. The first forest informatics study using under-canopy UAV laser scanning was conducted by Hyyppä et al. [16]. In the paper, we were able to compute stem volume estimates for the detected trees with a relative RMSE of 10% in both sparse and obstructed forest sites by combining stem curves extracted from the under-canopy UAV laser scanner data with tree heights obtained from separate high-density above-canopy UAV laser scanning data. Wang et al. (2021) tested the single-flight integration of above- and under-canopy UAV laser scanning for forest investigation in order to obtain accurate canopy height estimates [25]. Recent developments in under-canopy navigation include Higuti et al. [26], Schultz et al. [27], Cui et al. [28], and Lin and Stol [29]. The development of a miniaturized robotic mobile mapping system for under-canopy phenotyping was recently presented by Manish et al. [30]. Under-canopy UAV imaging and photogrammetry has been reported by, e.g., Krisanski et al. [31], in which the point cloud-based tree diameter measurements resulted in an RMSE of 1.1 cm and 2.1 cm compared with manual reference diameters for two test sites.
In this study, we show that an under-canopy UAV laser scanning system using a rotating laser scanner can provide both the canopy height and the stem volume for mature trees in boreal forest conditions with an accuracy sufficient for operational field reference data collection (i.e., 10% error). Additionally, we discuss whether single-sensor under-canopy UAV laser scanning will remove the need to combine above-canopy UAV-derived point clouds with TLS point clouds.

2. Materials and Methods

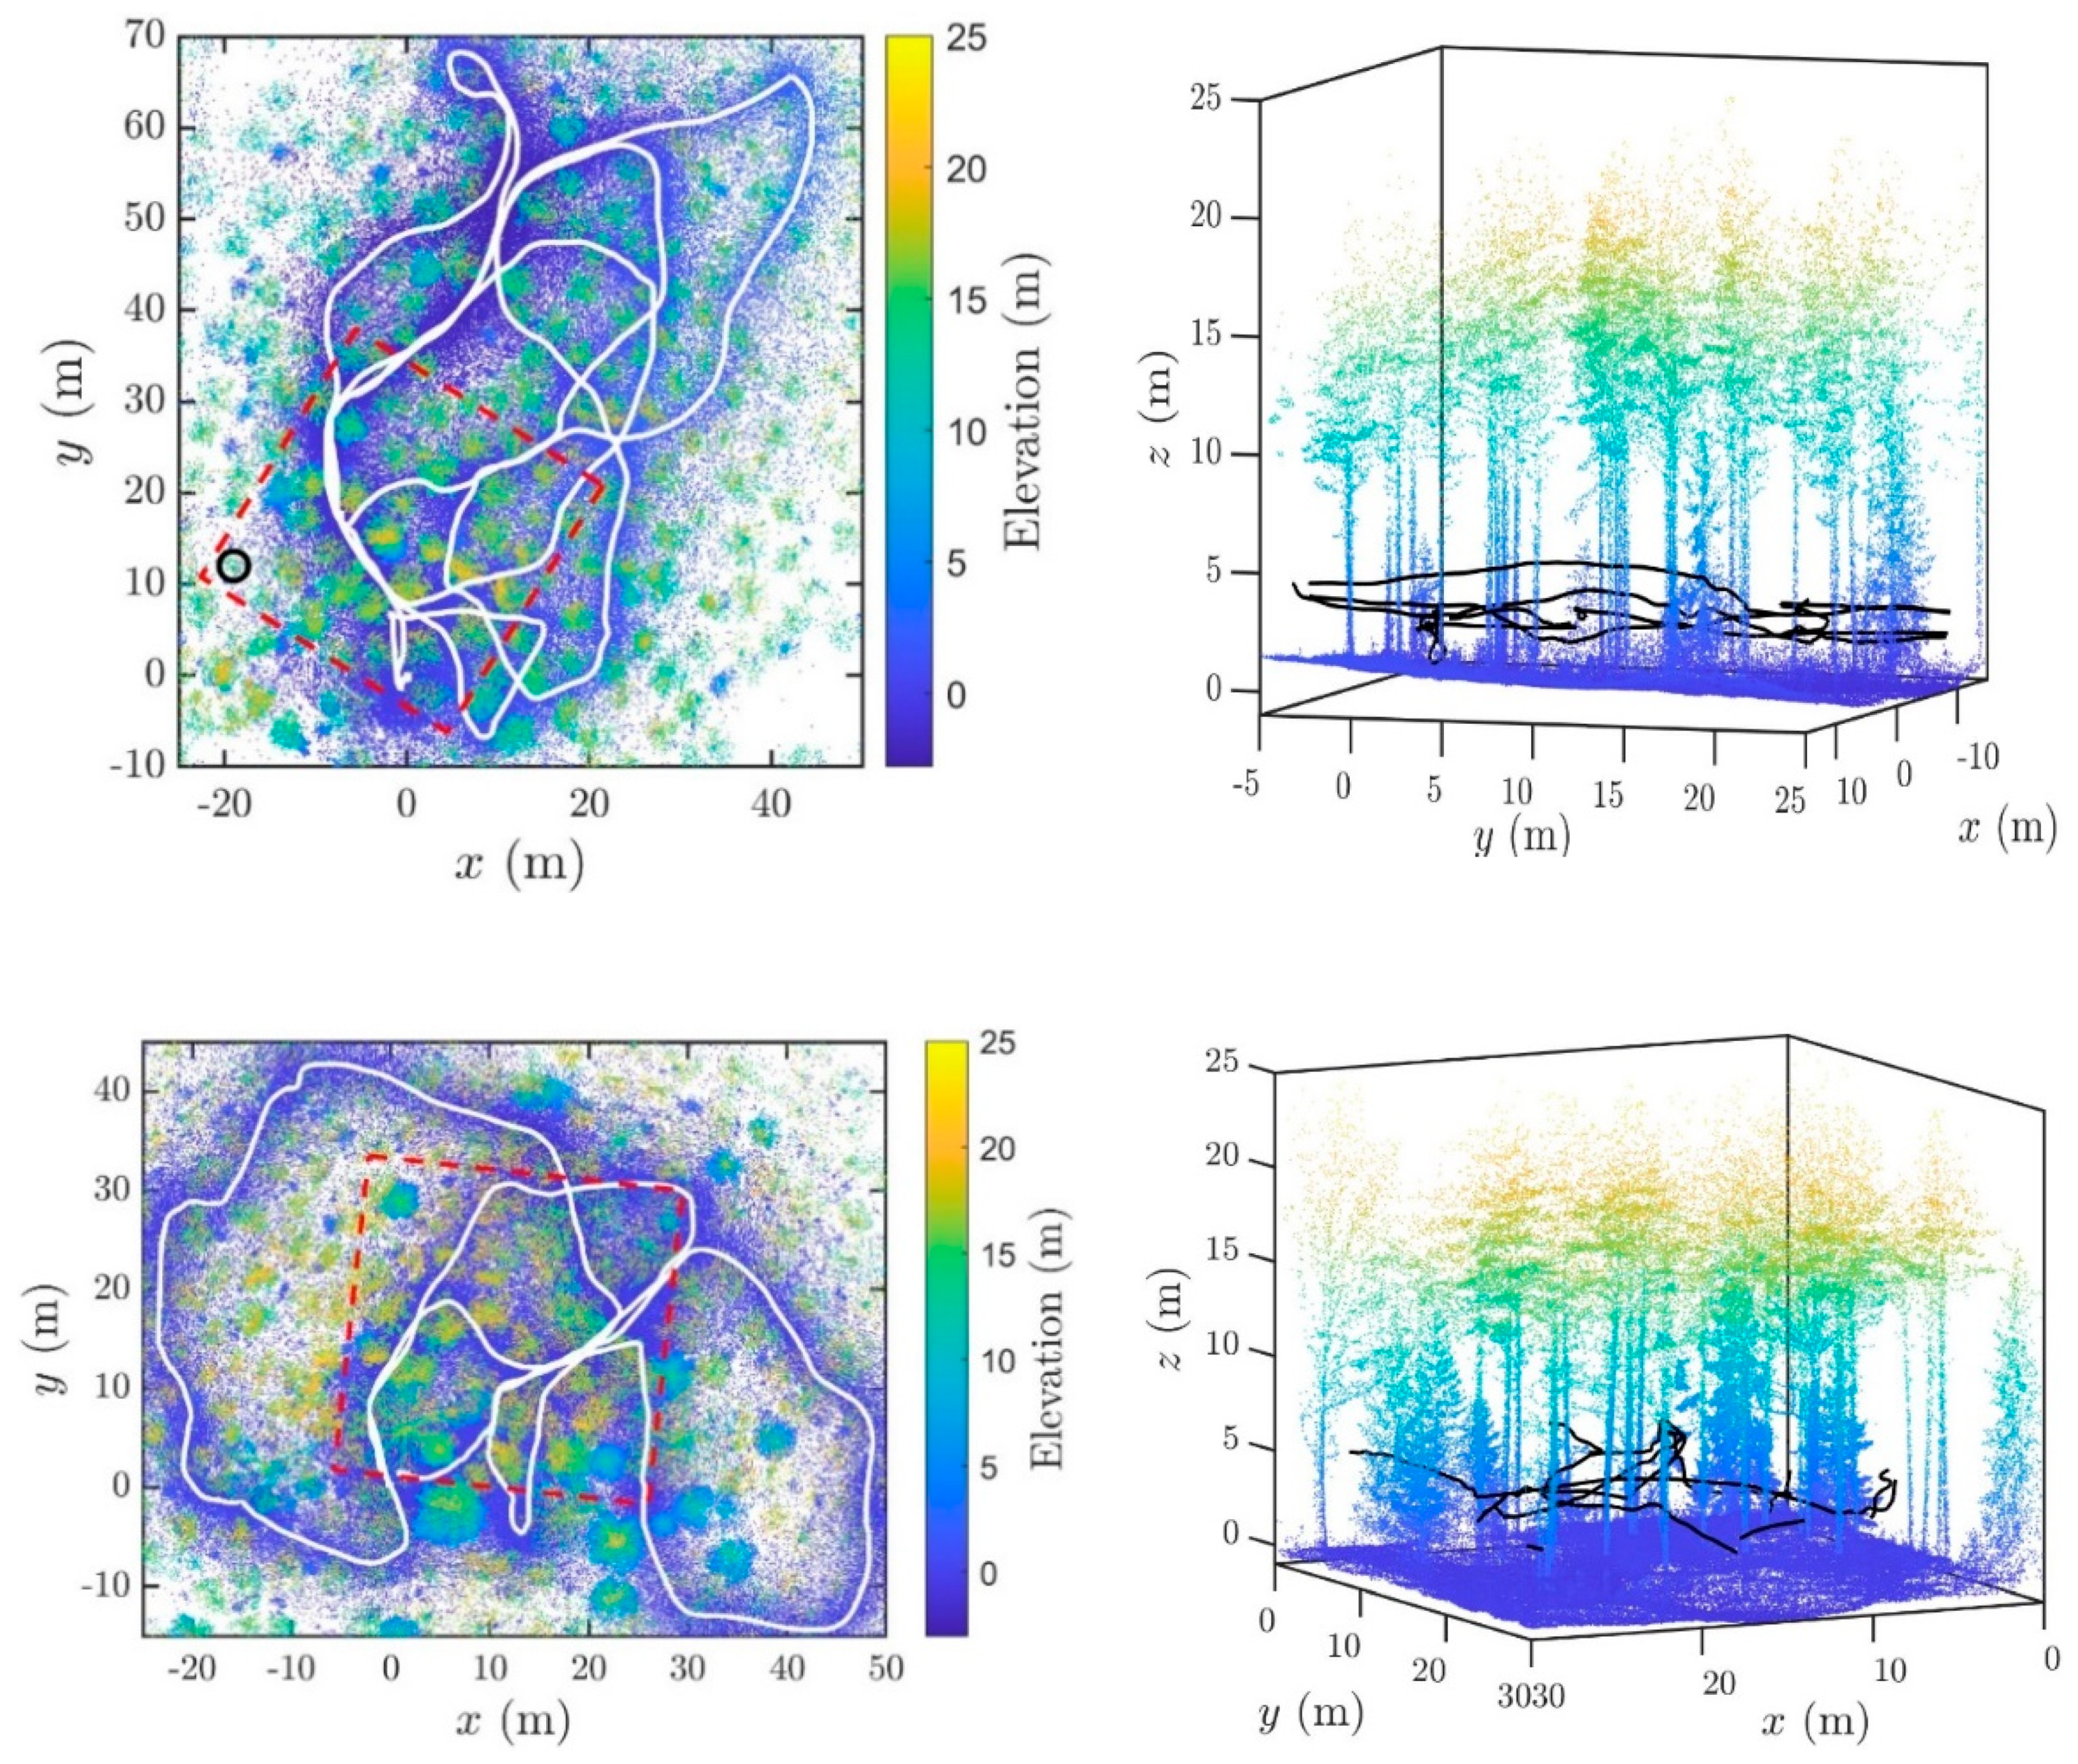
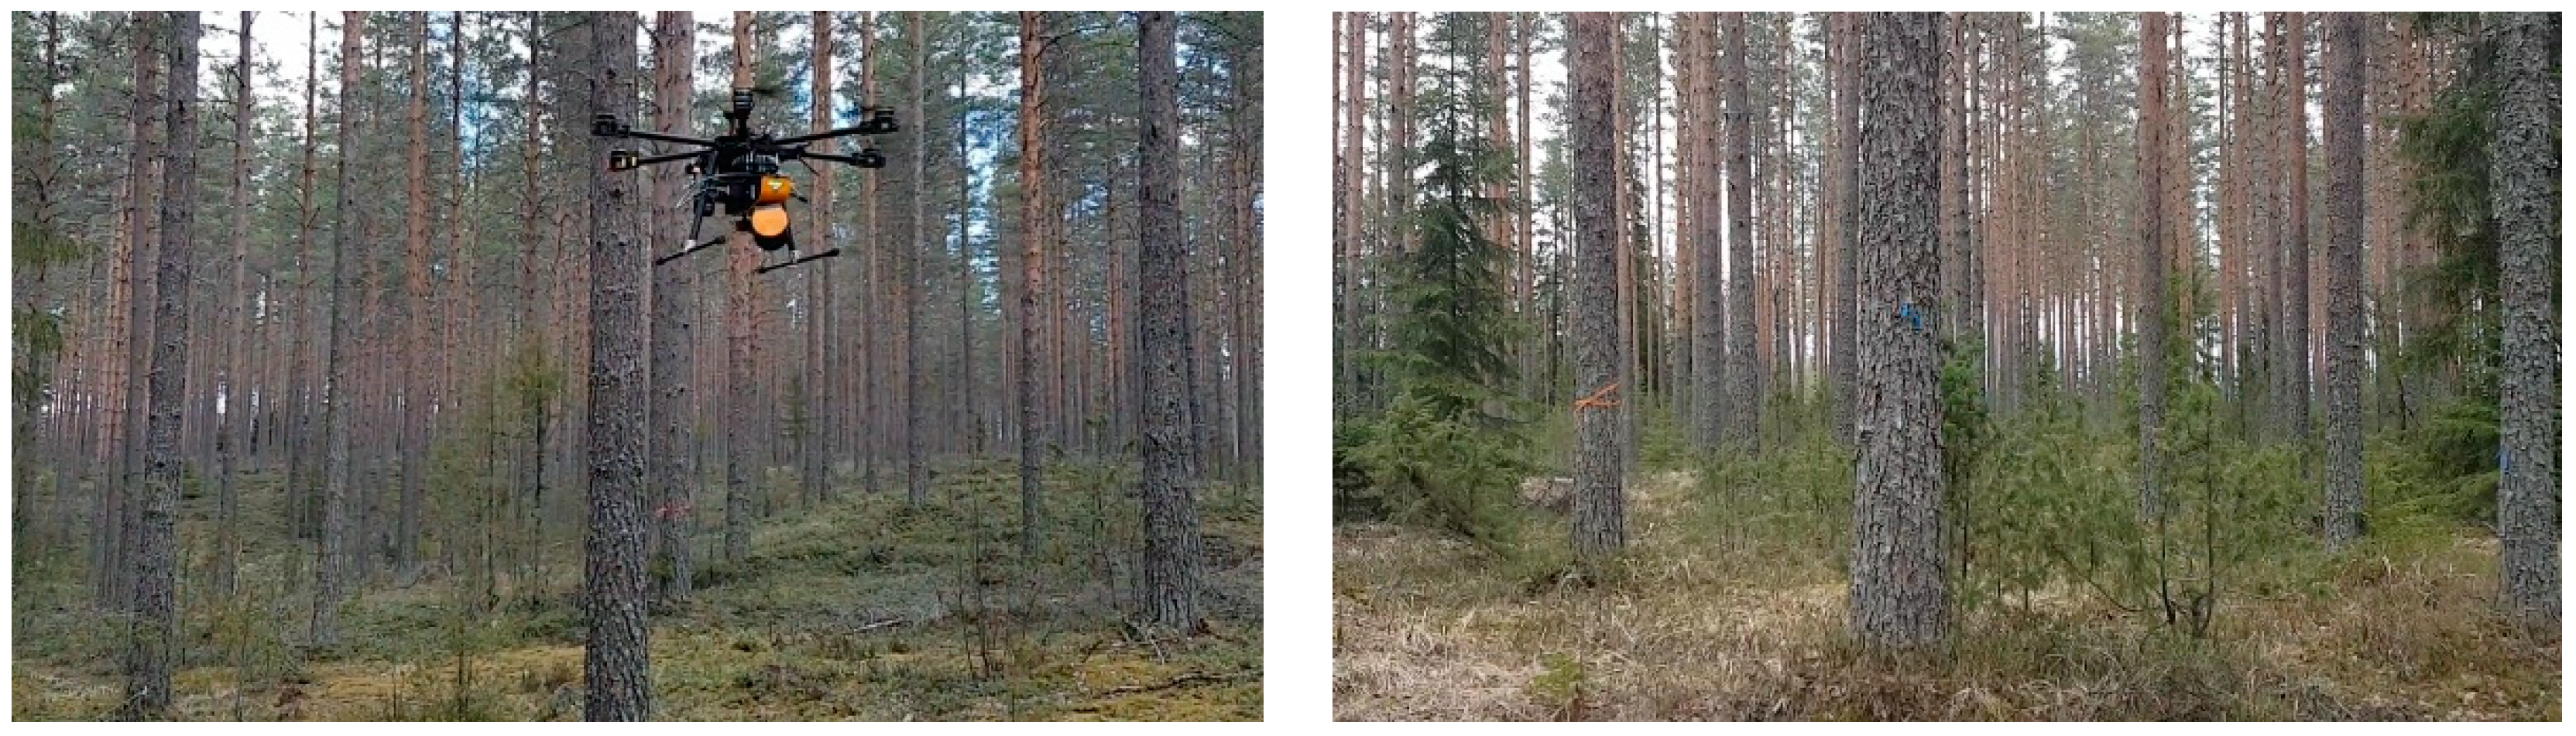
2.1. Study Area and Reference Data

A boreal forest in Evo, Finland (61.19° N, 25.11° E) was used as the study area. The measurements were conducted on a cloudy and calm day on 27 November 2020 on two test sites of size 32 m × 32 m, representing sparse and obstructed forests. The classification of forest type was based on the stem density, amount of occlusion of the tree stems and the amount of understory vegetation. The sparse site consisted mainly of pines that had a visible and straight stem. The obstructed site represented a mixed stand consisting of pines, spruces and birches, and the stem density varied inside the plot but was at the same level as in the sparse site (slightly over 400 trees per hectare). In the obstructed site, small spruces occluded the visibility of near-by tree stems, and the stems of such spruces were hardly visible in the field and from the point clouds. Descriptive statistics of the test sites are provided in Table 1 and photos of test sites are shown in Figure 1.
The field reference data were collected with multi-scan TLS in 2014 (sparse site on 27 June, obstructed site on 8 July) and stem curves were obtained from the data with the following process: point clusters corresponding to individual trees were detected by eye from the point cloud, and semi-manual circle fitting was performed at various heights to obtain a reference stem curve. The accuracy of the reference stem curves was at the level of 0.5 cm. Stem curves were updated by manual diameter measurements taken at various heights from each tree on 13 June 2019. Reference tree heights used in the study were obtained for each tree with hypsometer measurements conducted in September 2019. Trees with a diameter at breast height (DBH) exceeding 5 cm were included in the set of reference trees. Using the stem curve information and the tree heights, we were able to calculate reference stem volumes with the help of parabolic and square root functions fitted to the reference stem curves using the method described in our previous paper [16].

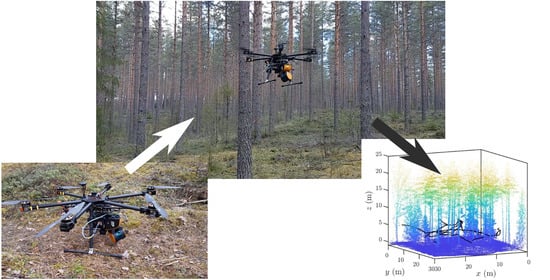
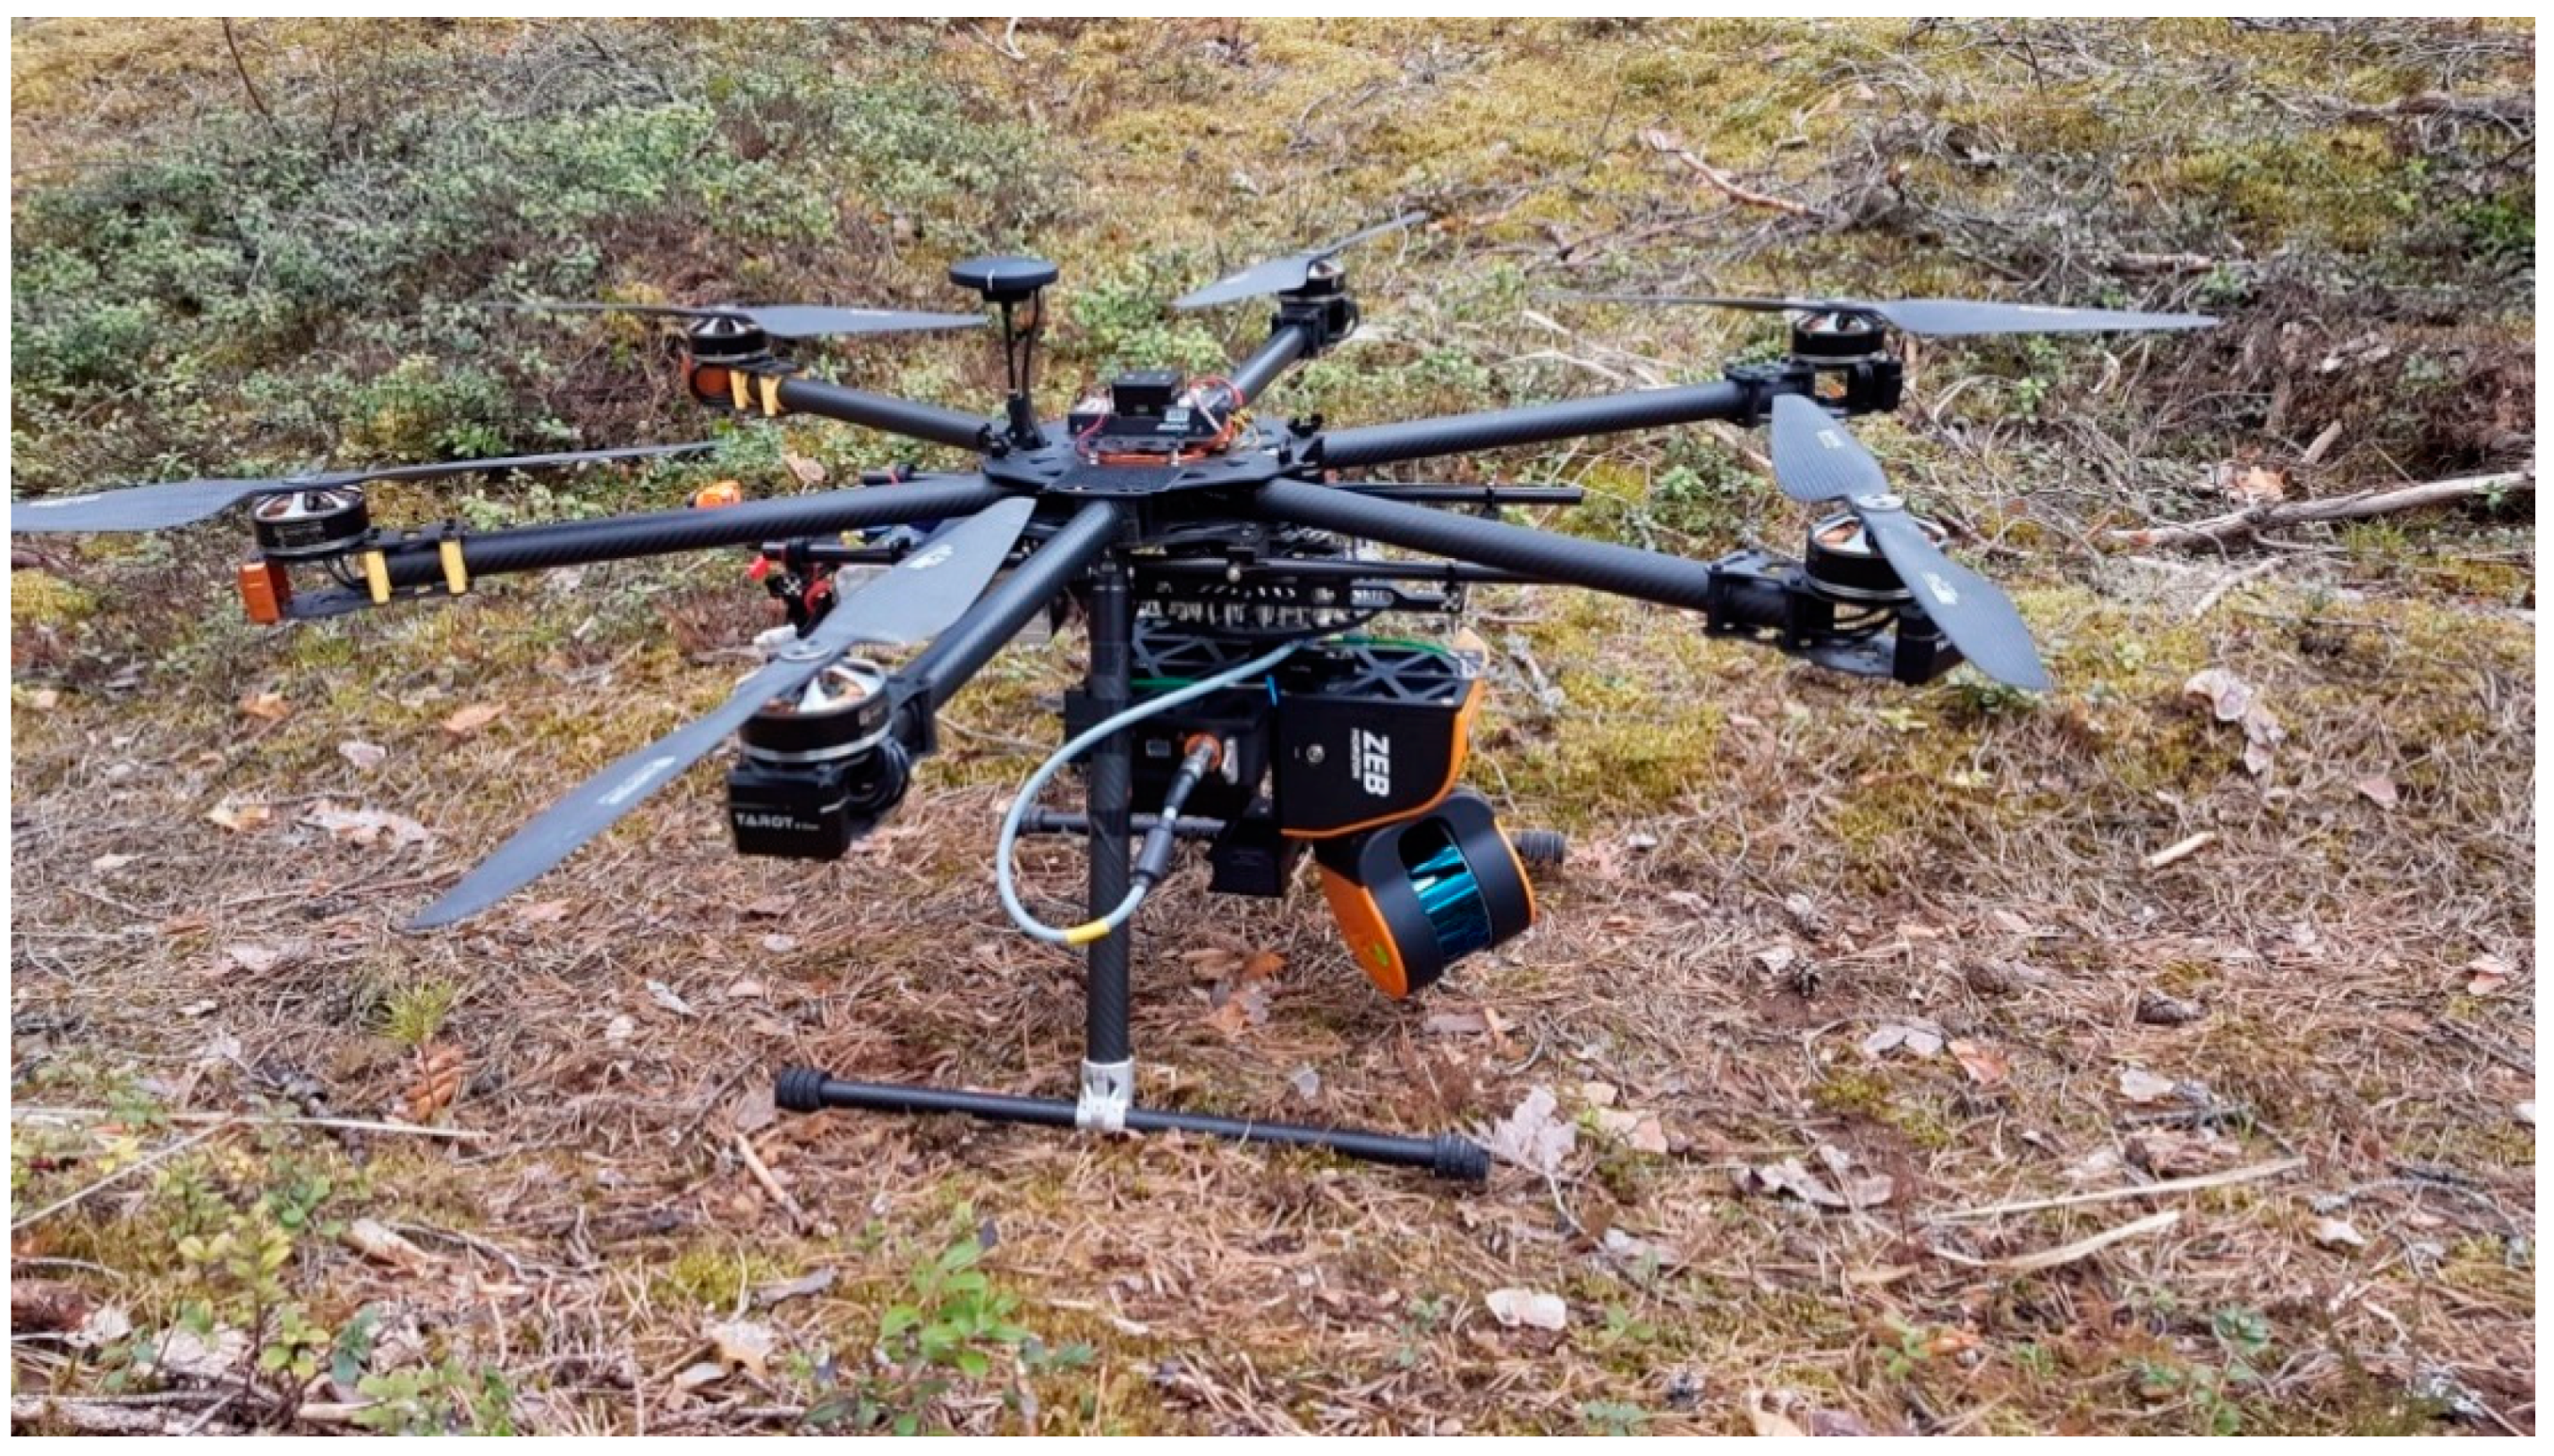
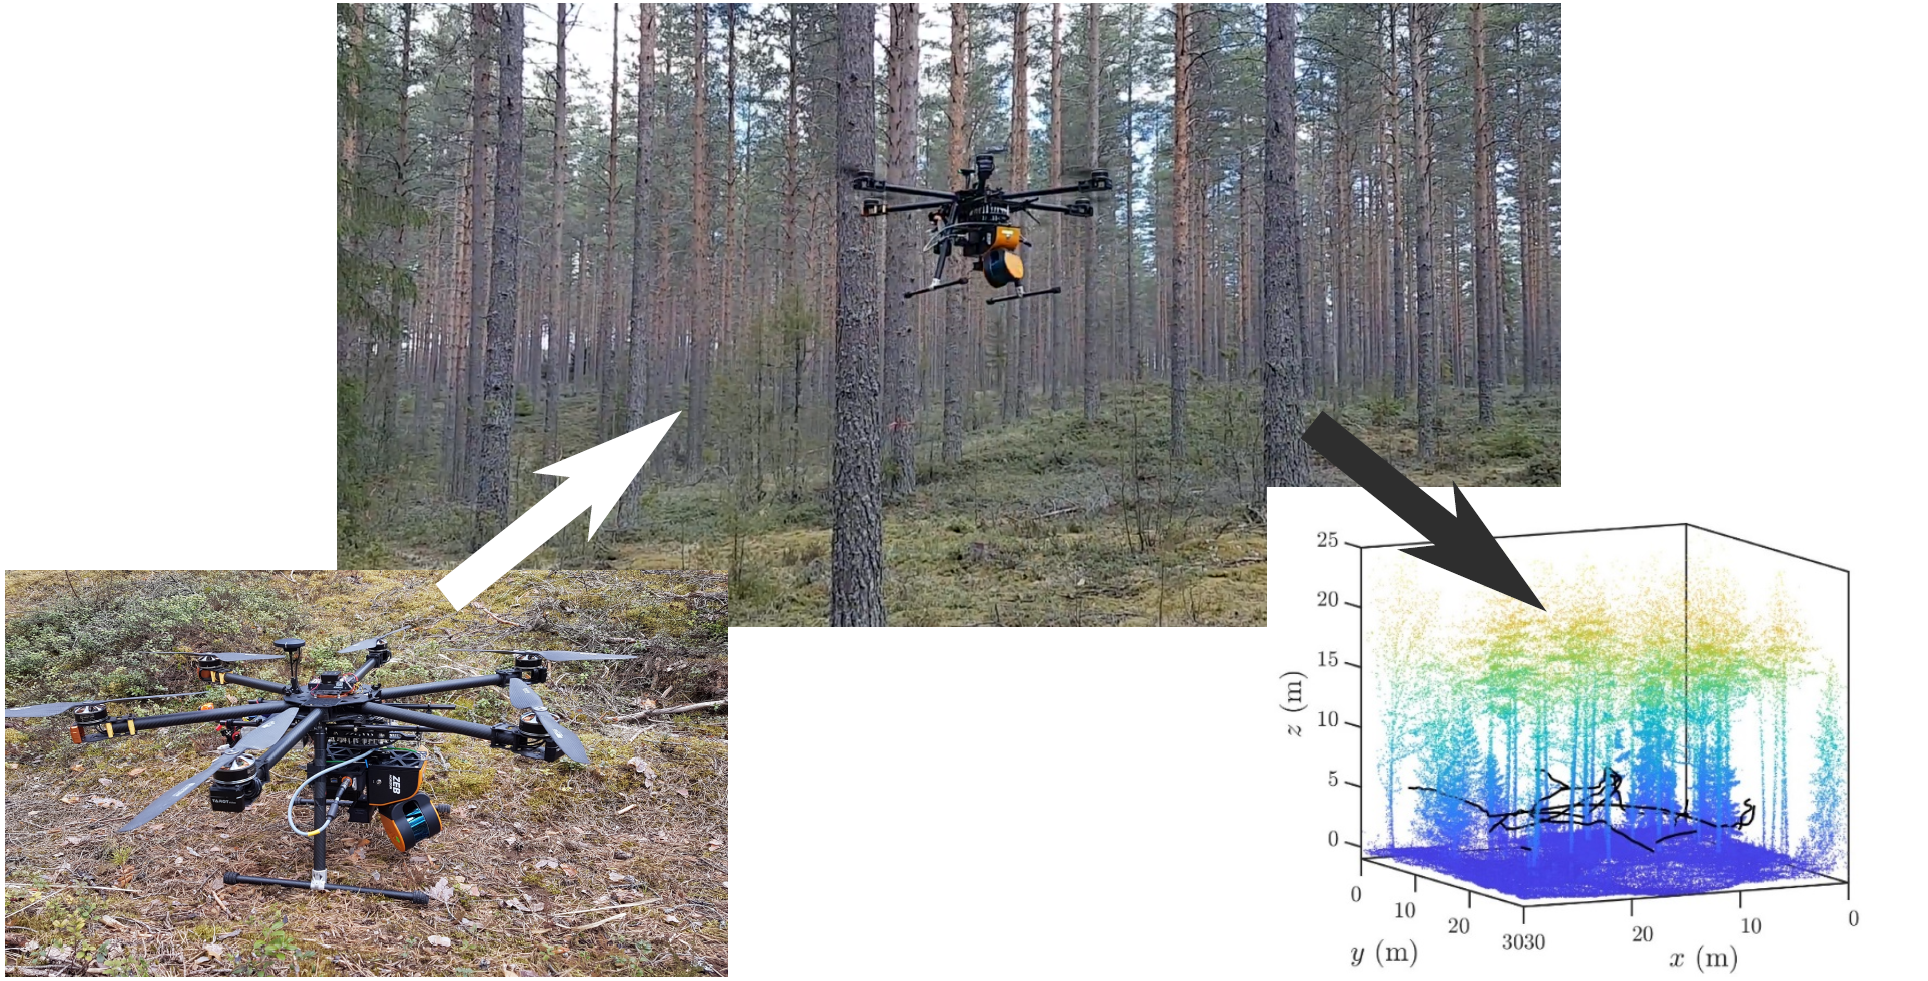
2.2. Under-Canopy UAV Laser Scanner System

The under-canopy flights were performed with a Tarot T960 hexacopter, which was equipped with a DJI digital FPV (first person view) system, Pixhawk 2.1 autopilot, and ArduCopter 3.6.9 firmware. The payload capacity of the UAV is 4 kg and the flight time is 15 min. The flights were piloted manually using live video feed from the DJI FPV system. The GeoSLAM Zeb-Horizon laser scanner was mounted to the bottom of the UAV using GeoSLAM Zeb-Horizon UAV mount, as shown in Figure 2. On 27 November 2020, one flight at each site was flown manually without GNSS assistance at a flying height of 2–3 m above ground, with some higher spots when the canopy had a gap. The flying speed was mostly very slow, i.e., 1–2 m/s. The flight time for the sparse plot was 8.5 min and 6.5 min for the obstructed site. The flight trajectories for both of the test sites are shown in Figure 3.
The GeoSLAM Zeb-Horizon scanner is officially a hand-held laser scanning system which has a rotating arm. We chose to mount the Zeb-Horizon scanner onto the UAV since we wanted to have a rotating laser scanner that provides adequate coverage of the canopy. In a previous study, we applied a Kaarta Stencil-1 laser scanner (Kaarta, Pittsburgh, PA, USA) mounted on a UAV acquiring laser scanning data under the forest canopy. Such a system based on the Velodyne VLP-16 sensor (Velodyne Lidar, San Jose, CA, USA) had a horizontal field of view of 360° and 16 laser profiles corresponding to a vertical field of view of ±15°, which enabled us to extract the stem curves for pine trees approximately up to the height of 8 m while flying at a height of 2–3 m. Due to the rotating scanner, the laser scanner provided a point cloud extending from the ground to the treetops. The Zeb-Horizon scanner also comprised the Velodyne VLP-16 sensor operating at a wavelength of 905 nm. The horizontal and vertical beam divergences of the scanner are 3 and 1.5 mrads. At the 10 m range, the laser spot sizes are then 40.1 mm and 24.5 mm, respectively.
The raw data collected with the Zeb-Horizon scanner were pre-processed using GeoSLAM Hub (version 6.0.0.) software and the default processing parameters (convergence threshold: 0, window size: 0, voxel density: 1, rigidity: 0, maximum range: 100 m, closed Loop) and afterwards exported into las-format for further processing.

2.3. Processing of Under-Canopy UAV Laser Scanner Data

Point cloud post-processing of the las-files included the following steps in Matlab (MathWorks, Matlab version 2019a): (1) digital terrain model (DTM) generation, (2) segmentation, (3) stem detection and stem curve estimation, and (4) tree height and stem volume estimation.
The DTM was calculated using a voxel-based algorithm. Within each xy-pixel, the ground elevation was obtained by computing the average z coordinate of the lowest height interval containing at least 1% of the total number of the points. The final DTM was obtained by applying Gaussian smoothing for the preliminary DTM. The canopy height model was obtained by subtracting ground elevation from the highest laser hits within each xy-pixel.
In order to speed up the stem detection in step 3, the point cloud data were then segmented by applying the watershed algorithm for the canopy height model. Each of the resulting watershed segments included up to a few trees. Note that the segmentation process resembled that used to detect individual trees in the processing of above-canopy UAV point clouds. Importantly, we did not use the segmentation step to detect individual trees but to divide the point cloud into many smaller regions, which reduced the total time taken by the clustering algorithm used for the stem detection in step 3. Our implementation of the clustering algorithm used in step 3 had an approximate time complexity of O ( n 1.6 ) , and therefore, it was significantly faster to process the point cloud in many small parts than as a single large point cloud.
In the stem detection algorithm of step 3, we aimed to find tree trunk hits from the point cloud data that were analyzed segment-wise, as explained above. Despite the integrated SLAM (Simultaneous Localization and Mapping) in the GeoSLAM system, the positioning error of the scanner was approximately at the 10 cm level. Thus, we applied an arc-based stem detection algorithm detailed in [15,16] to obtain accurate estimates of the stem curves. To this end, we first grouped the points in the point cloud based on their time stamp and z-coordinate by using a time interval of 1 s and a height interval of 0.4 m, respectively. Then, we applied the arc extraction algorithm described in [16] for each of the point groups. The arc extraction algorithm consisted of four steps that were (1) density-based clustering (DBSCAN) [32], (2) robust circle fitting using random sample consensus (RANSAC) [33], (3) removal of remaining noise points using an arc division algorithm [16], and (4) a quality check for each of the arcs using pre-determined quality criteria that included, e.g., the largest acceptable standard deviation of the radial residuals, and a minimum acceptable central angle. Having extracted arcs for all the time and height intervals, we clustered the extracted arc centers using the DBSCAN algorithm in the XY plane in order to group the arcs into trees. After that, we estimated the growth direction of the trees using principal component analysis (PCA). Final stem curves were obtained using a smoothing cubic spline.
The tree heights were obtained from the same point cloud data by exploiting the locations of the detected stems. To determine the height of a tree, we first found all the points that were located within 1 m from the 3D stem line obtained from PCA. Subsequently, we divided the found points into groups based on their z-coordinate and the tree height was estimated by comparing the number of points within each interval against a point number threshold, similarly to our previous work [16]. Finally, stem volumes were estimated with the help of the extracted stem curve and the tree height by using the fitting method described in [15].
The selection of the parameter values was based on heuristics and logic. We did not optimize the used parameters. The same parameter settings have been used successfully in totally different forests (different tree species, different density of stems) in other parts of Finland [34].

2.4. Error Analysis

To evaluate the success rate of stem detection, we calculated the completeness and the correctness of the detected trees. The completeness is defined as the number of reference trees found divided by the total number of reference trees, whereas the correctness is defined as the number of reference trees found divided by the total number of trees found.
The bias describes the systematic errors in the estimation and root-mean-square error (RMSE), i.e., standard error, includes both bias and random errors, and they were obtained as
bias = i = 1 n x i x i , ref N
RMSE = ( i = 1 n ( x i x i , ref ) 2 N ) 1 / 2
where N is the number of found trees, xi refers to the obtained estimates and xi,ref denotes the corresponding reference values. The relative bias (%) and RMSE (%) were calculated against the sample mean of the variable in question.

3. Results and Discussion

3.1. Completeness and Correctness of Stem Detection

We concentrated on detecting trees with a visible stem since the volume of such trees can be estimated accurately. Therefore, the parameters of our algorithm were far from optimal for detecting small, occluded spruces present on the test sites. The completeness and correctness of stem detection are reported in Table 2.
In the sparse site, our stem detection algorithm found 38 out of the 39 pines, but it missed all of the three small spruces. The stems of the spruces were occluded by their branches, and we refer the reader to Figure 14 of our previous work [16] for a photograph illustrating the occlusion problem. The algorithm missed one tree near the southwest corner (marked with black circle in Figure 3) of the sparse plot due to a low point density caused by being distant (roughly 15 m) from the flight trajectory (see Figure 3). There were no falsely detected stems and, thus, the correctness of stem detection was 100%.
In the obstructed site, our algorithm found 29 out of the 30 pine stems, one out of the eight small spruces, and four out of the five birches. The correctness of stem detection was again 100%.
Let us then compare our stem detection results against those reported in previous studies using under-canopy UAVs for forest field reference measurements [16,25]. The studies in [16] were conducted on the same test sites as the current study. Here, we found one tree less in the sparse site, and two trees less in the obstructed site than in [16]. The slightly lower completeness in the current study as compared with the results of [16] is most likely due to a lower point density. In [16], the VLP-16 scanner attached to the UAV was a Kaarta Stencil SLAM-system mounted on an aluminum platform together with the operating computer. As the scanner was looking only in the horizontal direction, it did not see the treetops, whereas in this study, the return hits were more equally distributed and also covered the treetops. Both the previous and the current study were based on the same sensor, i.e., VLP-16. In [34], the completeness of automated tree detection in a very sparse site (1/3 of the stem density of the current study) was 96%.

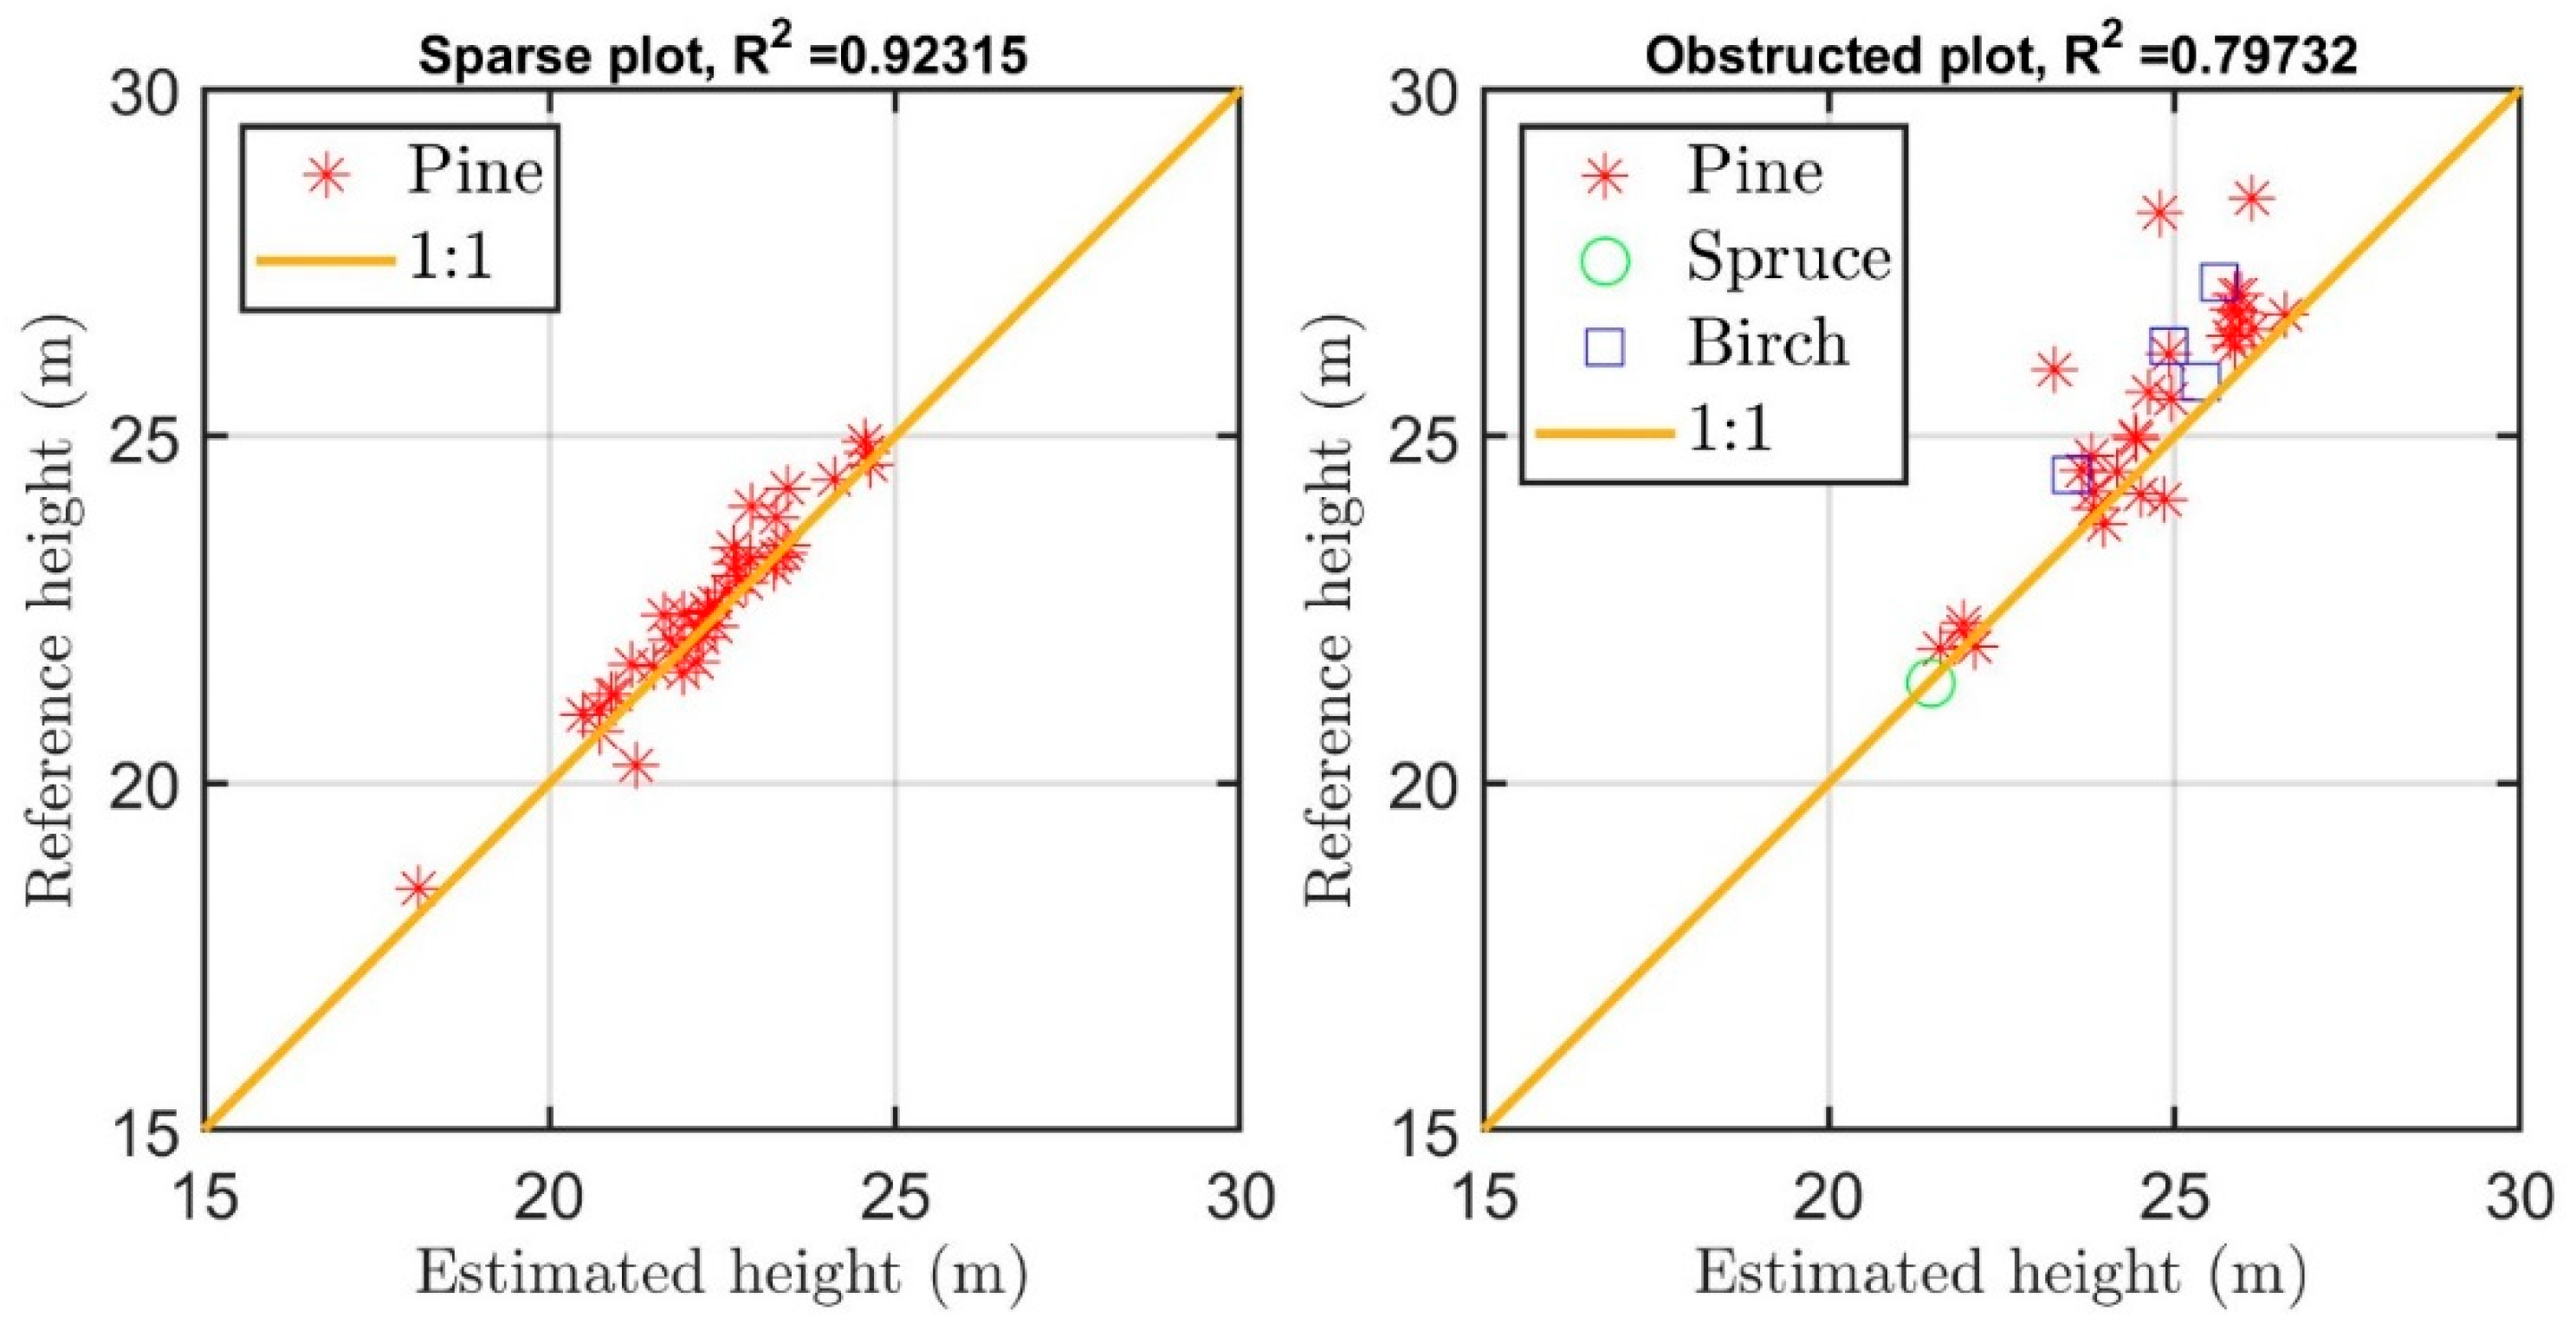
3.2. Tree Height Estimation

For the sparse site, we obtained a bias of −20 cm (−0.91%) and a standard error of 40 cm (1.86%), and for the obstructed site, we obtained a bias of −65 cm (−2.91%) and a standard error of 1 m (4.4%). In general, such accuracies are comparable to the best previous studies. Hyyppä et al. [35] reported a standard error of 1.5–2.5% for tree height determination using hand-held laser scanning (1.5–2%) and high-density above-canopy UAV laser scanning (2–2.5%) in sparse forest sites. The bias is also comparable to the results obtained with a hand-held laser scanner in [35]. The results are also better than those obtained with the current implementation of the backpack laser scanner (data collected in April 2016 with an AKHKA-R3 laser scanning unit developed in FGI, equipped with a Riegl VUX-1HA 2D laser scanner, a LITEF UIMU-LCI inertial measurement unit, and a positioning system consisting of a NovAtel Flexpak6 GNSS receiver and GGG-703 antenna) [35]. When comparing the results of the obstructed site to previous studies, the standard error obtained in this paper was lower than in any of the previous studies from the same site [24]. Previous standard errors obtained in the same site [35] have ranged from 5–6% (for backpack and hand-held laser scanning) up to 6–8% (for high-density above-canopy UAV laser scanning data). In Wang et al. [25], the standard error of tree heights estimated from UAV data was 6.1% for trees with a DBH exceeding 15 cm, which is similar to the results reported in [35]. Our results imply that under-canopy UAV laser scanning may provide tree height estimates with a slightly better accuracy than conventional high-density above-canopy UAV laser scanning measurements. It should be noted that previous results [35] have been obtained with above-canopy UAV data that employs point densities from 320 to 4800 pts/m2. The results for tree height determination can be seen in Figure 4.
When looking at the scatter plot of tree heights presented in Figure 4 (right), there are three trees, the heights of which are strongly underestimated. Figure 5 illustrates a point cloud for each of these trees. The height underestimation by more than 2.5 m was caused by the low number of tree top hits in the point cloud. The low number of tree top hits can be attributed to the limited ranging capacity of the scanner and the occlusion arising from the lower layers of the canopy. Furthermore, the selected point number threshold for the tree height estimation algorithm seems to have been too high for the low point density of the upper canopy layers. As explained previously, we did not optimize over the threshold values, and a better selection of the parameter values may have resulted in a smaller error of the estimated tree heights. Similarly to our previous work [16], the threshold number of hits indicating treetops was chosen to be higher for mature trees than for smaller trees. Since the point cloud of Figure 5 shows that the tree height measurement capacity of VLP-16 is limited for tall trees, this logic should be modified for the system under study.

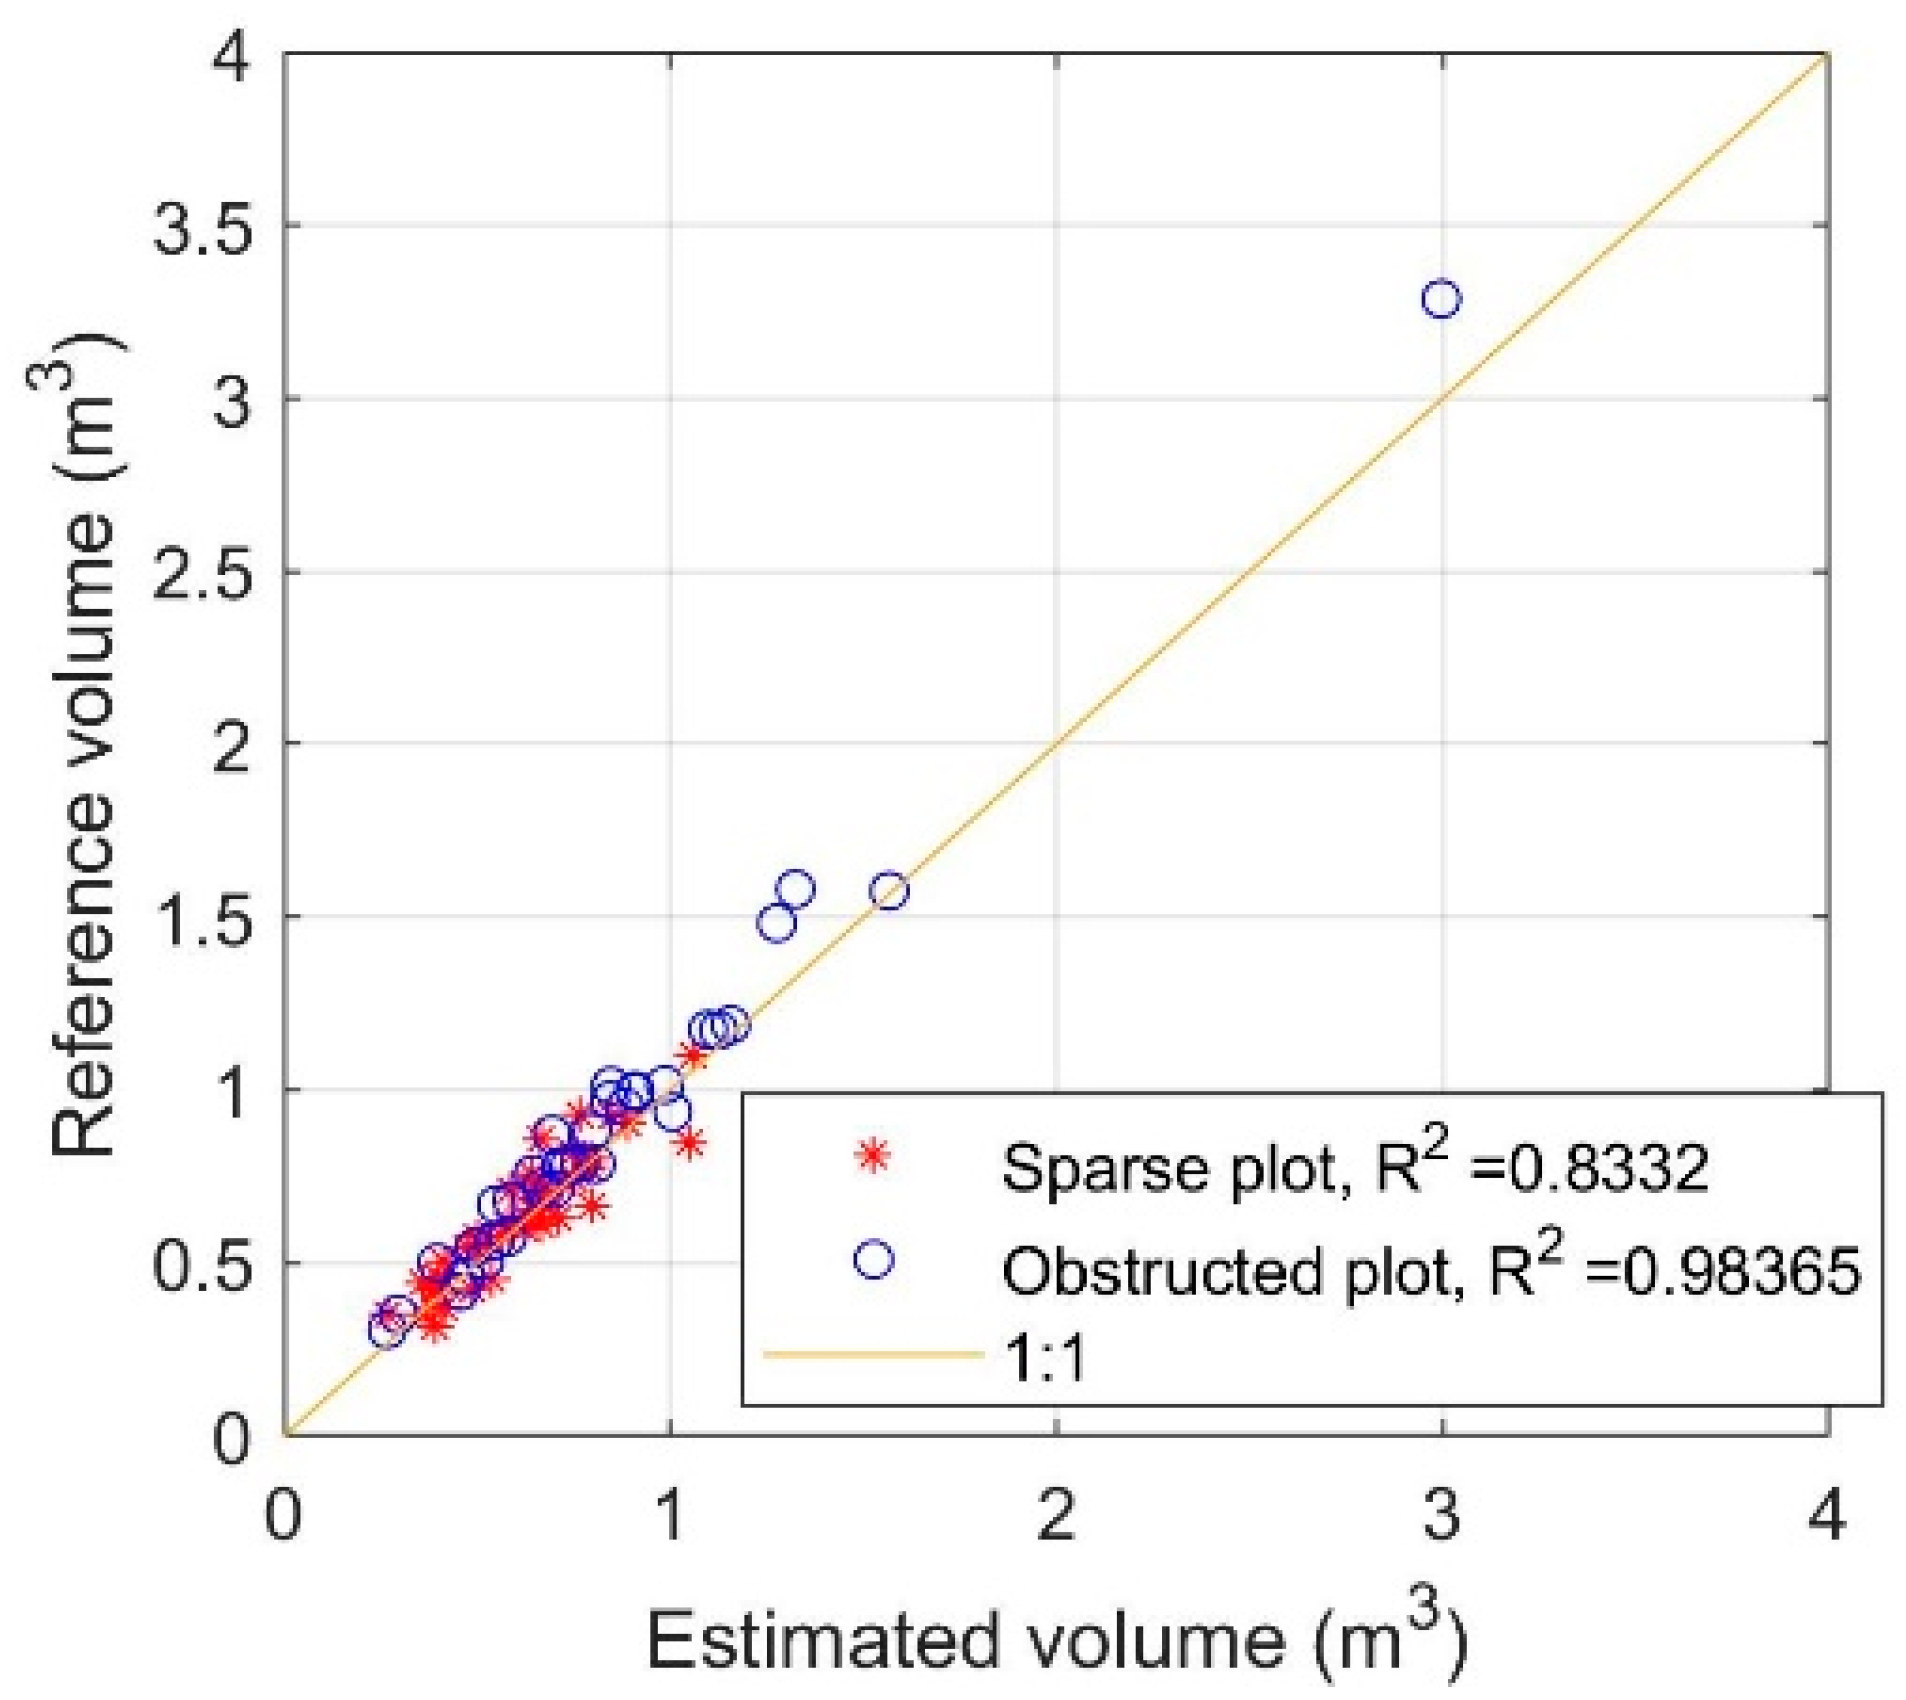
3.3. Derivation of Stem Volumes

For the sparse site, we obtained a bias of −3.1% and a standard error of 12.5% for the stem volume, whereas for the obstructed site, we obtained a bias of −2.2% and a standard error of 8.6%. Hyyppä et al. [35] reported corresponding accuracies that had been obtained using systems based on backpack laser scanning, hand-held laser scanning and a combination of under-canopy UAV laser scanning and above-canopy UAV laser scanning in the same test sites. The obtained accuracies in this study are also better than those obtained using conventional field measurements (RMSE 12% for the sparse site and 23% for the obstructed site) and those obtained using above-canopy UAV laser scanning (18–20% for the sparse site and about 50% for the obstructed site) in [35]. The scatter plots of estimated volume versus reference volume are shown in Figure 6.

3.4. Further Discussion

In this section, we discuss whether a combination of above-canopy UAV and terrestrial (e.g., TLS) point cloud data is really needed in the light of our results. It is obvious that the above-canopy UAV systems provide a detailed description of the upper parts of the forest canopy, including information of tree heights [36], crown areas, and crown volume. The above-canopy UAV systems provide high-density point clouds of high positional accuracy since GNSS-positioning provides high absolute accuracy (2–5 cm) above the canopy. On the other hand, terrestrial point clouds, which have a high local accuracy, a high density, and a low point–cloud-to-point–cloud variation, are another optimal element for characterizing lower parts of the forest canopies. Together, such point clouds can provide an optimal characterization of a canopy and tree attributes can be extracted from such point cloud data with a high accuracy. The added value of such data includes millimeter level accuracy of the terrestrial point cloud, decimeter level accuracy of the canopy height components, and the possibility for more accurate change detection. On the other hand, such data are also expensive and laborious to collect. Laborious steps include the collection of the TLS scans, matching of the TLS scans to each other and to the above-canopy point cloud. In reality, a single forest plot requires multiple TLS scans, and therefore, only a few TLS plots can be collected in a single workday by one measurement group. The collection of the UAV data does not necessarily require a significant amount of time, but it multiplies the costs of the needed sensor hardware and it also increases the collected data amount.
In order to provide both the terrestrial and canopy top point clouds using a single sensor solution, two promising technological solutions seem to exist. The first one is a rotating laser scanner, demonstrated in this paper, with a high-quality SLAM system complemented with state-of-the-art point cloud extraction methods. The second one, not yet demonstrated, uses a laser scanner with large field of view capable of seeing both the treetops and the ground. For example, an Ouster OSO scanner with a field of view of 90 degrees could be used for this purpose. Similarly to the first system, the second scanner should also be integrated with a SLAM system. When using either of these solutions, the resulting point cloud is of lower accuracy as compared with a combination of TLS and above-canopy UAV point clouds due to the need to use multi-beam laser scanners that typically have 2–3 cm ranging errors. As a result, tree trunk data can be obtained at cm-level, and treetops can be obtained with an accuracy ranging from the decimeter level to 1 m, since range accuracy, point density, the occlusion of the treetops and SLAM accuracy deteriorate the quality. From such data, it is presumably more difficult to extract quality-related features from tree stems, branches and foliage. The added value is increased efficiency and a more straightforward use of the technology. It is expected that the collection speed of field reference data with such a system is at least 10 times higher in terms of the number of trees collected in a single day as compared with data collection methods needed for the combination of TLS and above-canopy UAV point clouds. Additionally, a single-sensor system and data processing flow are needed.
This study was arranged on the same sites as the previous studies [16,35] so that we could compare the developed approach against various other approaches for field reference acquisition, including various mobile laser scanning techniques, under-canopy UAV laser scanning combined with above-canopy UAV laser scanning, various above-canopy UAV laser scanning techniques, and conventional field reference data collection. Weather, wind or seasonal effects did not affect the results since the sites were largely based on coniferous species, we did not use lidar intensity, the weather was calm during data acquisition, and the processing method was robust. Our study is the first to show that an under-canopy UAV system equipped with a rotating scanner provides tree height information with an equal or slightly better accuracy than above-canopy UAV systems providing high-density (320–4800 pts/m2) point clouds. Our under-canopy UAV system equipped with a rotating scanner also provides stem volume estimates with an accuracy equivalent to the previous best mobile laser scanning techniques even if the previous best techniques are complemented with additional above-canopy UAV laser scanning data. We assume that under-canopy UAV laser scanning is more ready and more feasible to be applied on economically exploited, more sparse boreal forest canopies, whereas the previously proposed approach based on a combination of UAV and TLS is more feasible for ecological studies of forests and for use in complex deciduous and temperate forests. Operating the under-canopy UAV system in more complex and dense forest structures provides an additional challenge since under-canopy navigation technology is needed in fully automated operations and it is challenging to fly even manually within such forests. Future research is needed to implement autonomous operation inside canopies through collision avoidance and navigation inside the forest canopies.
An alternative technological solution for the future is an above-canopy flying UAV that can measure the arcs of a tree stem from the above, as first proposed in [37] and recently also partly tested in [38,39]. This requires a small laser beam, a low enough point spacing distance (a high pulse repetition rate) and a low mirror scan speed. Such a system may be feasible for dense, spruce-dominated forests, where a UAV cannot be flown under the forest canopy due to the large number of obstacles. Such a single-sensor system may also provide adequately accurate estimates for tree height and stem volume.

4. Conclusions

The automation of forest field reference has been an intensive research objective for laser scanning scientists for two decades. The first study [16] on using an under-canopy UAV laser scanning system for collecting forest informatics resulted in stem volume estimates with a relative RMSE (root-mean-square error) of 10% at an individual tree level. However, this previous study relied on tree heights estimated from another point cloud collected with an above-canopy flying UAV. In this study, we showed that an under-canopy UAV employing a rotating laser scanner can be utilized to accurately estimate the stem curves, tree heights and stem volumes of individual trees. We compared the tree heights obtained with the rotating laser scanner system against tree heights measured manually in the field, whereas we compared the estimated stem volumes against highly accurate field reference data acquired semi-manually with multi-scan TLS. We showed that the under-canopy UAV system equipped with the rotating scanner provides estimates of tree height (RMSE of 0.45 m on the sparse test site and RMSE of 1.2 m on the obstructed test site) and stem volume (RMSE of 12.5% on the sparse site and RMSE of 8.6% on the obstructed site) with an accuracy equaling the previous best mobile laser scanning techniques, even if the previous best techniques were complemented with additional above-canopy laser scanning data. Furthermore, the system tested in this study enabled us to obtain tree height estimates with an equal or slightly better accuracy than has been previously obtained from high-density (320–4800 pts/m2) point clouds collected with above-canopy UAV laser scanning measurements on the same test sites [35].

Author Contributions

J.H. made the experimental plan, provided basic concepts for data processing, secured funding and wrote the majority of the paper. E.H. provided, and created all the algorithms, and participated in writing the article. T.H. developed hardware and made the measurements. H.K. preprocessed the data. X.Y. processed the data into forest informatics. A.K., T.H., H.K., H.H., J.M. and X.Y. participated in writing the paper. X.Y. and E.H. acted as senior authors. All authors have read and agreed to the published version of the manuscript.

Funding

We gratefully acknowledge Academy of Finland, Strategic Research Council and ministry of Agriculture and Forestry that funded this research through grants (Decisions 334830, 334002, 337811, 337656, and VN/3482/2021 (PI J.H.), 334829 (PI A.K.), 314312 (PI H.K)). Publication is also part of Finnish Research Flagships Forest-Human–Machine Interplay (UNITE).

Institutional Review Board Statement

Not applicable.

Informed Consent Statement

Not applicable.

Data Availability Statement

The data presented in this study will be available later on (year 2022) upon request from the corresponding author. We are currently building our data sharing systems.

Conflicts of Interest

The authors declare no conflict of interest.

References

  1. Luoma, V.; Saarinen, N.; Wulder, M.A.; White, J.C.; Vastaranta, M.; Holopainen, M.; Hyyppä, J. Assessing precision in conventional field measurements of individual tree attributes. Forests 2017, 8, 38. [Google Scholar] [CrossRef] [Green Version]
  2. Stereńczak, K.; Mielcarek, M.; Modzelewska, A.; Kraszewski, B.; Fassnacht, F.E.; Hilszczański, J. Intra-annual Ips typographus outbreak monitoring using a multi-temporal GIS analysis based on hyperspectral and ALS data in the Białowieża Forests. For. Ecol. Manag. 2019, 442, 105–116. [Google Scholar] [CrossRef]
  3. Hyyppä, J.; Inkinen, M. Detecting and Estimating Atributes for Single Trees Using Laser Scanner. Photogramm. J. Finl. 1999, 16, 27–42. [Google Scholar]
  4. Persson, A.; Holmgren, J.; Soderman, U. Detecting and measuring individual trees using an airborne laser scanner. Photogramm. Eng. Remote Sens. 2002, 68, 925–932. [Google Scholar]
  5. Hopkinson, C.; Chasmer, L.; Hall, R.J. The uncertainty in conifer plantation growth prediction from multi-temporal lidar datasets. Remote Sens. Environ. 2008, 112, 1168–1180. [Google Scholar] [CrossRef]
  6. Jaakkola, A.; Hyyppä, J.; Kukko, A.; Yu, X.; Kaartinen, H.; Lehtomäki, M.; Lin, Y. A low-cost multi-sensoral mobile mapping system and its feasibility for tree measurements. ISPRS J. Photogramm. Remote Sens. 2010, 65, 514–522. [Google Scholar] [CrossRef]
  7. Wallace, L.; Lucieer, A.; Watson, C.; Turner, D. Development of a UAV-LiDAR system with application to forest inventory. Remote Sens. 2012, 4, 1519–1543. [Google Scholar] [CrossRef] [Green Version]
  8. Lovell, J.L.; Jupp, D.L.; Culvenor, D.S.; Coops, N.C. Using airborne and ground-based ranging lidar to measure canopy structure in Australian forests. Can. J. Remote Sens. 2003, 29, 607–622. [Google Scholar] [CrossRef]
  9. Liang, X.; Kankare, V.; Hyyppä, J.; Wang, Y.; Kukko, A.; Haggrén, H.; Yu, X.; Kaartinen, H.; Jaakkola, A.; Guan, F.; et al. Terrestrial laser scanning in forest inventories. ISPRS J. Photogramm. Remote Sens. 2016, 115, 63–77. [Google Scholar] [CrossRef]
  10. Olofsson, K.; Holmgren, J.; Olsson, H. Tree stem and height measurements using terrestrial laser scanning and the RANSAC algorithm. Remote Sens. 2014, 6, 4323–4344. [Google Scholar] [CrossRef] [Green Version]
  11. Wang, Y.; Pyörälä, J.; Liang, X.; Lehtomäki, M.; Kukko, A.; Yu, X.; Kaartinen, H.; Hyyppä, J. JIn situ biomass estimation at tree and plot levels: What did data record and what did algorithms derive from terrestrial and aerial point clouds in boreal forest. Remote Sens. Environ. 2019, 232, 111309. [Google Scholar] [CrossRef]
  12. Liang, X.; Wang, Y.; Pyörälä, J.; Lehtomäki, M.; Yu, X.; Kaartinen, H.; Kukko, A.; Honkavaara, E.; Issaoui, A.E.; Nevalainen, O.; et al. Forest in situ observations using unmanned aerial vehicle as an alternative of terrestrial measurements. For. Ecosyst. 2019, 6, 1–16. [Google Scholar] [CrossRef] [Green Version]
  13. Cabo, C.; Del Pozo, S.; Rodríguez-Gonzálvez, P.; Ordóñez, C.; Gonzalez-Aguilera, D. Comparing terrestrial laser scanning (TLS) and wearable laser scanning (WLS) for individual tree modeling at plot level. Remote Sens. 2018, 10, 540. [Google Scholar] [CrossRef] [Green Version]
  14. Giannetti, F.; Puletti, N.; Quatrini, V.; Travaglini, D.; Bottalico, F.; Corona, P.; Chirici, G. Integrating terrestrial and airborne laser scanning for the assessment of single-tree attributes in Mediterranean forest stands. Eur. J. Remote Sens. 2018, 51, 795–807. [Google Scholar] [CrossRef] [Green Version]
  15. Hyyppä, E.; Kukko, A.; Kaijaluoto, R.; White, J.C.; Wulder, M.A.; Pyörälä, J.; Liang, X.; Yu, X.; Wang, Y.; Kaartinen, H.; et al. Accurate derivation of stem curve and volume using backpack mobile laser scanning. ISPRS J. Photogr. Remote Sens. 2020, 161, 246–262. [Google Scholar] [CrossRef]
  16. Hyyppä, E.; Hyyppä, J.; Hakala, T.; Kukko, A.; Wulder, M.A.; White, J.C.; Pyörälä, J.; Yu, X.; Wang, Y.; Virtanen, J.P.; et al. Under-canopy UAV laser scanning for accurate forest field measurements. ISPRS J. Photogr. Remote Sens. 2020, 164, 41–60. [Google Scholar] [CrossRef]
  17. Balenović, I.; Liang, X.; Jurjević, L.; Hyyppä, J.; Seletković, A.; Kukko, A. Hand-Held Personal Laser Scanning–Current Status and Perspectives for Forest Inventory Application. Croat. J. For. Eng. 2020, 42, 165–183. [Google Scholar] [CrossRef]
  18. Ko, C.; Lee, S.; Yim, J.; Kim, D.; Kang, J. Comparison of Forest Inventory Methods at Plot-Level between a Backpack Personal Laser Scanning (BPLS) and Conventional Equipment in Jeju Island, South Korea. Forests 2021, 12, 308. [Google Scholar] [CrossRef]
  19. Liang, X.; Kukko, A.; Hyyppä, J.; Lehtomäki, M.; Pyörälä, J.; Yu, X.; Kaartinen, H.; Jaakkola, A.; Wang, Y. In-situ measurements from mobile platforms: An emerging approach to address the old challenges associated with forest inventories. ISPRS J. Photogr. Remote Sens. 2018, 143, 97–107. [Google Scholar] [CrossRef]
  20. Bienert, A.; Georgi, L.; Kunz, M.; Maas, H.G.; von Oheimb, G. Comparison and combination of mobile and terrestrial laser scanning for natural forest inventories. Forests 2018, 9, 395. [Google Scholar] [CrossRef] [Green Version]
  21. Laasasenaho, J. Taper Curve and Volume Functions for Pine, Spruce and Birch; Metsäntutkimuslaitos: Helsinki, Finland, 1982. [Google Scholar]
  22. Vandapel, N.; Kuffner, J.; Amidi, O. Planning 3-D path networks in unstructured environments. In Proceedings of the 2005 IEEE International Conference on Robotics and Automation, Barcelona, Spain, 18–22 April 2005; pp. 4624–4629. [Google Scholar]
  23. Vian, J.L.; Przybylko, J. Tree Metrology System. U.S. Patent US 9,198.363 B2, 1 December 2015. [Google Scholar]
  24. Chisholm, R.A.; Cui, J.; Lum, S.K.; Chen, B.M. UAV lidar for below-canopy forest surveys. J. Unmanned Veh. Syst. 2013, 1, 61–68. [Google Scholar] [CrossRef] [Green Version]
  25. Wang, Y.; Kukko, A.; Hyyppä, E.; Hakala, T.; Pyörälä, J.; Lehtomäki, M.; El Issaoui, A.; Yu, X.; Kaartinen, H.; Liang, X.; et al. Seamless integration of above-and under-canopy unmanned aerial vehicle laser scanning for forest investigation. For. Ecosyst. 2021, 8, 1–15. [Google Scholar] [CrossRef]
  26. Higuti, V.A.; Velasquez, A.E.; Magalhaes, D.V.; Becker, M.; Chowdhary, G. Under canopy light detection and ranging-based autonomous navigation. J. Field Robot. 2019, 36, 547–567. [Google Scholar] [CrossRef]
  27. Schultz, A.; Gilabert, R.; Bharadwaj, A.; de Haag, M.U.; Zhu, Z. A navigation and mapping method for UAS during under-the-canopy forest operations. In Proceedings of the IEEE/ION PLANS 2016, Savannah, GA, USA, 11–14 April 2016; pp. 739–746. [Google Scholar]
  28. Cui, J.Q.; Lai, S.; Dong, X.; Chen, B.M. Autonomous navigation of UAV in foliage environment. J. Intell. Robot. Syst. 2016, 84, 259–276. [Google Scholar] [CrossRef]
  29. Lin, T.J.; Stol, K.A. Towards Automated Under-Canopy Exploration of Plantation Forests. In Proceedings of the 2019 International Conference on Unmanned Aircraft Systems (ICUAS), Atlanta, GA, USA, 11–14 June 2019; pp. 1201–1208. [Google Scholar]
  30. Manish, R.; Lin, Y.C.; Ravi, R.; Hasheminasab, S.M.; Zhou, T.; Habib, A. Development of a Miniaturized Mobile Mapping System for In-Row, Under-Canopy Phenotyping. Remote Sens. 2021, 13, 276. [Google Scholar] [CrossRef]
  31. Krisanski, S.; Taskhiri, M.S.; Turner, P. Enhancing methods for under-canopy unmanned aircraft system based photogrammetry in complex forests for tree diameter measurement. Remote Sens. 2020, 12, 1652. [Google Scholar] [CrossRef]
  32. Ester, M.; Kriegel, H.P.; Sander, J.; Xu, X. A Density-Based Algorithm for Discovering Clusters in Large Spatial Databases with Noise. In Proceedings of the Second International Conference on Knowledge Discovery and Data Mining (KDD-96), Portland, OR, USA, 2–4 August 1996; Volume 96, pp. 226–231. [Google Scholar]
  33. Fischler, M.A.; Bolles, R.C. Random sample consensus: A paradigm for model fitting with applications to image analysis and automated cartography. Commun. ACM 1981, 24, 381–395. [Google Scholar] [CrossRef]
  34. Hyyppä, E.; Muhojoki, J.; Yu, X.; Kukko, A.; Kaartinen, H.; Hyyppä, J. Rapid Coarse Registration Method Using Translation- and Rotation-Invariant Local Descriptors Towards Fully Automated Forest Inventory, Manuscript. ISPRS J. Photogramm. Remote Sens. Open 2021. under review. [Google Scholar]
  35. Hyyppä, E.; Yu, X.; Kaartinen, H.; Hakala, T.; Kukko, A.; Vastaranta, M.; Hyyppä, J. Comparison of Backpack, Handheld, Under-Canopy UAV, and Above-Canopy UAV Laser Scanning for Field Reference Data Collection in Boreal Forests. Remote Sens. 2020, 12, 3327. [Google Scholar] [CrossRef]
  36. Wang, Y.; Lehtomäki, M.; Liang, X.; Pyörälä, J.; Kukko, A.; Jaakkola, A.; Liu, J.; Feng, Z.; Chen, R.; Hyyppä, J. Is field-measured tree height as reliable as believed–A comparison study of tree height estimates from field measurement, airborne laser scanning and terrestrial laser scanning in a boreal forest. ISPRS J. Photogramm. Remote Sens. 2019, 147, 132–145. [Google Scholar] [CrossRef]
  37. Jaakkola, A.; Hyyppä, J.; Yu, X.; Kukko, A.; Kaartinen, H.; Liang, X.; Hyyppä, H.; Wang, Y. Autonomous collection of forest field reference—The outlook and a first step with UAV laser scanning. Remote Sens. 2017, 9, 785. [Google Scholar] [CrossRef] [Green Version]
  38. Neuville, R.; Bates, J.S.; Jonard, F. Estimating forest structure from UAV-mounted LiDAR point cloud using machine learning. Remote Sens. 2021, 13, 352. [Google Scholar] [CrossRef]
  39. Puliti, S.; Breidenbach, J.; Astrup, R. Estimation of forest growing stock volume with UAV laser scanning data: Can it be done without field data? Remote Sens. 2020, 12, 1245. [Google Scholar] [CrossRef] [Green Version]
Figure 1. Test sites used for the study: sparse site on the left, obstructed site on the right.
Forests 12 00856 g001
Figure 2. UAV equipped with a rotating laser scanner developed for the study.
Forests 12 00856 g002
Figure 3. Flight trajectory for the under-canopy UAV flight (white line) in the sparse (top) and the obstructed (down) test sites. The original point cloud has been down sampled for visualization. Left: top view of the flight with flight trajectory (white lines), test plot (red lines) and point clouds colored by heights. In the upper left figure, the black circle denotes the location of the pine, the stem of which was not detected from the point cloud. Right: side view of the flight trajectory (dark line) and point cloud.
Forests 12 00856 g003
Figure 4. Scatter plot of the UAV-derived tree height versus the reference height for the sparse plot (left) and the obstructed plot (right).
Forests 12 00856 g004
Figure 5. Example trees higher than 25 m, the heights of which were underestimated by the under-canopy UAV laser scanning system.
Forests 12 00856 g005
Figure 6. Scatter plot of the estimated volume vs. the reference volume for the sparse plot and the obstructed plot.
Forests 12 00856 g006
Table 1. Descriptive statistics of trees on the test sites at the individual tree level. Here, ‘no trees’ stands for the number of trees within each test site, stem density corresponds to the number of trees per one hectare, DBH is an abbreviation of the diameter at breast height and volume means the volume of the tree stem neglecting the volume of branches. Furthermore, ‘std’ means the standard deviation.
Test SiteNo TreesStem Density (Stems/ha)DBH (cm)Height (m)Volume (m3)
MeanStdMinMaxMeanStdMinMaxMeanStdMinMax
Sparse4241025.95.210.933.221.42.81224.50.580.230.0760.99
Obstructed4342027.110.15.357.522.26.07.427.60.730.560.0083.27
Table 2. Completeness and correctness of stem detection. The number of detected trees is reported in the parentheses.
Completeness (%)Correctness (%)
AllPineSpruceBirch
Sparse90.5 (38/42)97.4 (38/39)0 (0/3)-100 (38/38)
Obstructed79.1 (34/43)96.7 (29/30)12.5 (1/8)80.0 (4/5)100 (34/34)
Publisher’s Note: MDPI stays neutral with regard to jurisdictional claims in published maps and institutional affiliations.

