Abstract
Background and Objectives: Mineral topsoil moisture is a very important component of the hydrological balance in forests. The moisture is closely related to the forest type, its woody species composition, stand age, and structure through interception and evapotranspiration. We aimed to investigate the topsoil moisture response to precipitation in three treatments: under young Norway spruce, white birch, and a grass-dominated treeless gap at an acidic mountain site in the Jizerské hory Mts., Czech Republic. The study was conducted in 18- to 21-year-old stands during four growing seasons. Materials and Methods: The analyzed parameters were: rainfall amounts measured by an on-site automated station, root penetration using a root auger, and soil moisture measured continuously using electric sensors, as well as derived parameters such as interception. Results and Conclusions: Even within small patches of the three treatments, soil water content was found to be higher under the gap vegetation compared to both tree species. In addition, the topsoil under spruce was significantly more saturated than under birch. The average growing-season interception capacity of birch, spruce, and the gap treatment ranged from 1.4 to 2.2 mm, 2.1 to 2.6 mm, and 1.2 to 2.2 mm, respectively. Soil moisture mostly decreased during periods of flushing and stabilized during the transitions from the growing to the dormant seasons. The seasonal effects were particularly obvious under the birch stand. The crucial factors decreasing topsoil water content under birch included both rooting depth and density, which may predispose preferential pathways for water infiltration. This validated white birch’s capability to decrease topsoil water content, which can be beneficial at secondary-waterlogged sites.
1. Introduction
Soil water is of great importance particularly under dry and warm conditions, where it is a limiting factor of forest growth and productivity [1,2]. Soil moisture controls the water and energy exchange between the atmosphere and land surface, and its importance increases with greater drought frequency in many areas of the world experiencing climatic shift. [3]. Soil moisture integrates the water balance components of land surface hydrology [4]. The components affecting water storage in the topsoil layer under natural conditions are evapotranspiration (ET), precipitation (P), deep percolation (DP), runoff (Q), and possibly also capillary rise (CR). A simple equation of soil moisture (w) change over time (t) can be expressed as
The precipitation amounts falling onto soil (effective precipitation; [5]) are decreased by interception—water held on surfaces (forest vegetation, forest floor, and topsoil humus in our case) which evaporates and thus never reaches the mineral soil (e.g., [6]). Evapotranspiration includes two subprocesses such as vaporization from either bare soil or a water surface, and transpiration associated with plant water uptake in the rooting zone, when plants transport water through their vascular tissues onto the stomata of both the needles and leaves from where it can vaporize [7]. In forest ecosystems, evapotranspiration of trees plays a crucial role, but it is also supplemented by evapotranspiration of understory vegetation [8,9]. Deep percolation is the movement of water towards groundwater, whereas capillary rise acts in the opposite direction. Preferential pathways leading along living or declined roots are important for deep percolation [10]. Capillary rise appears only at locations with a high groundwater table and typically small flow rates. This component can be mostly omitted for topsoil [7].
Interception and evapotranspiration of forests play an important role in the water cycle in a landscape [11,12]. The patterns of both depend mainly on the type of vegetation, such as evergreen vs. deciduous and/or coniferous vs. broadleaved tree species showing different habitus, branching, and bark surface, as well as age, stand density, and vertical structure (e.g., [13,14,15,16]). Atmospheric conditions and soil water availability are also responsible [17,18]. Soil water content (or volumetric soil moisture) is influenced by forest stands both indirectly by reduced amounts of rainfall (interception) when rain water enters the stand as it passes through the canopy (throughfall), and directly first by using water for transpiration (more than 95% of water taken up by roots) and secondly by the soil solution for their nutrition (less than 5%) [19]. Different impacts on soil water due to water removal and suction that are attributable to particular woody species have been found [20]. Understanding soil moisture-plant interactions is at the core of ecohydrology research [21]. This can have an important implication in the adaptation of management of forest stands to improve their effect on the basin/landscape hydrology as well as in management of forests with a supplemental impact of specific tree species [22,23].
White birch and Norway spruce constitute stands of a different nature, both in their above- and below-ground parts [24]. Therefore, they are expected to affect site water balance components in different ways. According to the findings by Lutter et al. [25], the greatest fluctuations of soil moisture occur in topsoil which is the richest in fine roots taking up water (e.g., [26,27]). In spring, topsoil water storage decreases due to transpiration preferentially [28]. Temperature and precipitation also greatly impact this upper soil layer [29].
The objective of this study was to compare the dynamics of water content in the top mineral layer of soil (A and Ae horizons) under vegetation covers of Norway spruce (Picea abies (L.) H. Karst.), white birch (Betula pubescens Ehrh.), and a treeless gap at an acidic mountaintop-forest site. The research questions addressed were as follows: (i) Is the total content of available water in the gap higher with regard to lower ground vegetation interception and transpiration compared to tree species in the growing season?; (ii) Do topsoil moisture dynamics differ between the spruce and birch stands due to their aboveground and belowground biomass nature, allocation, and functioning?; (iii) Are birch stand seasonal patterns of phenological phases in the growing season (flushing, full foliage, senescence, and leaf fall) reflected in the water content of the birch topsoil more expressively relative to seasonal patterns in both the spruce and gap treatments?
2. Materials and Methods
2.1. Study Site
The study site (50°49′34″ N and 15°21′19″ E) is situated on the mountaintop of a moderate southwestern slope (<2%) at an altitude of 980 m a. s. l., in the Jizerské hory Mts., Czech Republic (CZ). The forest site was classified as acidic Norway spruce with dominant Calamagrostis villosa((Chaix) J. F. Gmel.) in the herb layer (see [30,31]). On a large salvage-harvested clear cut, different tree species were planted on square plots (100 m2) in a randomized block design in the 1990s [32].
The water content of the topsoil was measured below canopies of 18- to 21-year-old plantations of Norway spruce (average height approximately 4.3 m; stand basal area (G) was 14.9 m2 per ha at a stand density of 4000 trees per hectare—the 2013 situation), white birch (average height approximately 3.5 m; G was 3.7 m2 per ha at a stand density of approximately 4200 per ha in 2012), and also under grass covering a treeless gap. The leaf area index (LAI) of the spruce and birch stands were assessed on the basis of the 2012 DBH distributions using equations (functional forms) published by Forrester et al. [33]:
where ε is an error term that is assumed to be normally distributed with a mean (μ) of 0 and a standard deviation of σ. The equation was rearranged (transformed) to:
where Y represents LAI, and d states the DBH of individual trees. The indexes used were β0 = e−1.3878 and β1 = 1.7797 for white birch, and β0 = e−1.3434 and β1 = 1.857 for Norway spruce (Table A.5 by Forrester et al. [33]). The LAI of spruce was estimated as 3.63 m2 m−2 in 2013 and 5.86 m2 m−2 in 2018 (G = 25.2 m2 per ha), whereas for birch it was 0.96 m2 m−2 in 2012 and 3.67 m2 m−2 in 2018 (G = 18.1 m2 per ha).
The gap was dominated by 40-cm-high Calamagrostis villosa (its dry matter accounted for approximately 200 g m−2); other accompanying plant species included Vaccinium myrtillus (L.), Avenella flexuosa ((L.) Drejer), and Vaccinium vitis-idaea (L.). The differences in abundance of the ground vegetation between stands were low in 2011 (Table 1); the understory partly differed in height and consequently in total biomass (not measured). In the following years, the abundance of the understory vegetation of spruce and birch plots slowly reduced due to increased shading. Each treatment was represented by three replications (plots 10 × 10 m); all research was performed within a 0.16 ha area (Figure 1).

Table 1.
Average abundance of the dominant ground vegetation species according to treatment in 2011.
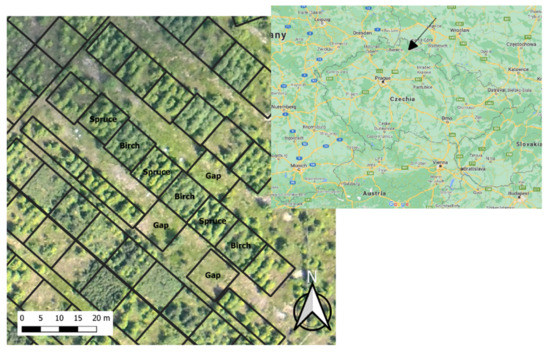
Figure 1.
Aerial photograph of the research area (J. Vondra on the 6 July 2011). Treatment names show plots 10 × 10 m analyzed within the study.
The soil type at the locality of interest is sandy loam Ferro-humic Podzol on biotitic granite [34]. The average thickness of the topsoil humus layers L and F+H was 1.7 and 8.1 cm in the spruce stand, 2.1 and 7.3 cm in the birch stand, and 2.3 and 6.9 cm in the gap, respectively. The soil type and layering of the locality were stable. The profile depth was around 60–70 cm. The clay, silt, and sand proportions were 5.6%, 40.9%, and 52.5%, respectively. Volumetric water content corresponding to field capacity and to plant wilting point accounted for approximately 27% and 9%, respectively, and full water capacity amounted to 48%.
2.2. Root Distribution
There was a presumption that soil porosity and water permeability of the topsoil layer may depend on the treatment. Roots are a significant factor that influence soil physical properties as well as the drainage capability of soil (see Introduction). Rooting depth of the soil profile was determined from soil cores that were taken using a circular root auger with an 8-cm inner diameter (Root Auger, Eijkelkamp) in particular treatments. Samples were taken at the very beginning of the dormant season (late October) at the end of a 4-day rainy period amounting to 30 mm, of which 3.8 mm fell just hours before on the very morning that sampling was performed. Three soil cores per treatment were taken.
Moreover, transient soil waterlogging due to a preceding heavy rainfall was monitored in the field, using 8 probe rods per treatment driven randomly into the ground to a depth of 20 cm. The soil cores were lifted up, and, after a 5-min stabilization period, the water levels were measured in the holes.
In a laboratory, undisturbed samples to a depth of 59 cm were divided into approximately 5-cm vertical sections. In each section, the roots were separated from the soil (including other partly decomposed biological material) using a multiple washing method and both the fine (<1 mm in diameter) and the coarser roots were weighed after drying. Fine dead roots were not excluded.
2.3. Soil Moisture Measurement
In early spring 2011, six TMS 1 loggers (Tomst Ltd., Prague, Czech Republic; see [35]) per each treatment replication (three plots per treatment), equipped with temperature and soil moisture sensors, were randomly put into the soil in a vertical position. The loggers monitored the moisture of approximately the 10-cm mineral topsoil comprising the A and Ae horizons. The topsoil is supposed to be the layer from which spruces, birches, and grass plants take up most of the water they need; deeper soil horizons become crucial during low precipitation periods [36].
Other studied characteristics were mineral soil (−10 cm), soil surface (0 cm), and above-ground (10 cm above the surface) temperatures; a study dealing with the results from 2011 and 2012 has been published [37]. The number of randomly placed loggers and three times replicated treatments were established to minimize the risk of monitoring unrepresentative conditions within the treatment. Data were recorded at 15-min intervals.
Soil moisture sensors in TMS 1 loggers operate on the principle of time domain transmissometry (TDT) [38], which is a method that is largely independent of salinity and temperature. The instruments were approved for taking microclimate measurements [39]; the measuring error of the TMS sensors does not exceed 1% [35]. Soil moisture values recorded by the loggers are uncalibrated data, i.e., absolute values, and their range in each particular sensor may differ partly in relation to the variability of the production inputs (minimum values ranged from 212 to 384; maximum from 2456 to 2694 and the individual range of loggers from 2162 to 2407 units). Therefore, the limit values of each particular sensor (minimum in a dry sensor, maximum in a sensor fully dipped into water) were determined in a laboratory before being installed, and the data from each particular sensor were normalized for the purpose of making an analysis (see below).
Rainfall pattern (a SR1 rain gauge, Tlusťák, Prague, Czech Republic), air temperatures (a Pt1000 sensor, Libor Daneš Ltd., Roztoky, Czech Republic), and solar radiation (a SG002 pyranometer, Tlusťák, Prague, Czech Republic) at 200 cm above the ground at hourly intervals were recorded using a LEC 2000 automated weather station (Ing. Libor Daneš Ltd., Roztoky, Czech Republic) located in the gap at a distance of approximately 120 m SW from the analyzed treatments. The daily sum of solar radiation was computed as a total of hourly records.
Snow cover usually occurs between November and April at the given experimental locality [34]. Therefore, the May to October period roughly represents the growing seasons evaluated in 2011–2014. In 2011 and 2012, the loggers were removed prior to winter and reinstalled in spring with a new randomized design within the same plots. The number of loggers in gap treatment, where lower data variability was confirmed, was reduced to five per plot beginning in 2012.
For technical reasons, the beginning of May was omitted in 2012 and 2013. To confirm the moisture level of the topsoil in early spring, the loggers were left on site in the 2013–2014 winter. Periods with precipitation below 0.2 mm were considered as precipitation-less periods.
2.4. Soil Moisture Data Processing and Statistical Analyses
Based on the exploratory analysis of the topsoil moisture data, the measurement segments with outlier data (periods of the soil profile compaction just after the logger installation and periods of technical problems with the loggers) were excluded from the analysis. Data normalization for the theoretical range of 0 to 1 was performed by Min-Max scaling according to the formula:
where xi is the actual; min(x) is the minimum; and max(x) is the maximum value measured by the given sensor for the i-th measurement.
This dimensionless quantity of soil moisture was used for the computation of mean values and variances of water content in the topsoil at the recording intervals for each treatment using Horn’s Quantile Based Method [40]. This robust method based on order statistics is appropriate for datasets with 4 ≤ n ≤ 20. The mean value at each recording interval (for every 15 min) was computed as the pivot halfsum (PL), and the 95% confidence interval of the mean was expressed by pivot statistics [41]. L95%, H95%, and R95% denote the lower limit, the upper limit of the confidence interval, and their difference (range), respectively.
The mean values of the topsoil moisture of each treatment on specific days were computed as the average of all mean values (PL) from the recording intervals on each given day. The lower and the upper limit of the 95% confidence interval was computed as the average of the lower pivots (L95%) and the average of the upper pivots (H95%) of all recording intervals of each given day. The range R95% was computed from the difference between H95% and L95%. The mean values and confidence intervals of the topsoil moisture content under the treatments for the particular studied periods were computed in a similar way.
The mean daily and growing season values of relative soil moisture (PL; “average moisture” hereinafter) and the characteristics of the confidence interval (L95%, H95%) were subsequently converted to the values of volumetric soil moisture. Calibration curves developed on the basis of laboratory measurements of soil samples taken from similar soil conditions on the top of the Jizerské hory Mts. with the inclusion of temperature correction were applied. The calibration was based on 5 loggers exposed to 12 volumetric moisture levels (from the wilting point to saturation) evaluated gravimetrically.
A regression analysis of selected aggregate parameters was performed.
To estimate the total interception of the treatment (canopy and forest floor) and share of evapotranspiration and percolation, “precipitation events” were analyzed. The analyses were based on the assumption that precipitation sums which do not manifest in any increase in soil topsoil moisture (+ΔW) can be attributed to interception. To reduce the overlapping of water and moisture flow of individual rains, consecutive precipitation when no-rain period(-s) in-between was (were) less than or equal to 2 h in length was considered as the same precipitation event (PE). For each PE, total precipitation was computed. An estimation of the total interception capacity of the treatment was based on precipitation events with no effect on soil moisture increase. The average maximal month total interception capacity of the treatments was computed as
where Ii stands for the average maximal interception capacity of the month I; means the highest subtotal of the PEs fully intercepted in the month for each individual year 2011–2014; means the minimum of the next higher PE in size per month in the year, and 4 is the number of analyzed years.
To compare the impact of evapotranspiration with infiltration (leading to deep percolation) intensity, average volumetric topsoil moisture loss per day (TML) between each following precipitation event (; %) was computed for each treatment as
where means the maximal topsoil moisture following the last PE; means moisture before the beginning of the recent PE; and is the number of days between the precipitation events. Negative decreases (i.e., an occasional increase in soil moisture without any precipitation, which can be attributed to, e.g., animal activities) were omitted.
In addition to the analysis of the entire vegetation periods, a 4-day period with intensive precipitation (29 mm in total) was chosen to depict characteristic water content changes in detail in peak summer. The analyses were conducted using software such as MS Excel and R 4.0.3 [42].
3. Results
3.1. The Weather Pattern in Particular Growing Seasons
The weather station data showed that median air temperatures at 200 cm above ground were the highest in the 2011 study period, when they reached almost 11 °C, while the lowest was in 2013 (9.9 °C). The greatest variability in daily temperatures was recorded in 2012 (Table 2). The mean daily temperatures dropped below 0 °C at the beginning and at the end of the studied periods in 2011 and 2014. At the end of the 2012 period, a longer spell of freezing temperatures was observed (Figure 2).
Table 2.
Median and median absolute deviation with a consistency constant of 1.4826 for the normal distribution (in brackets) of air temperature and daily solar radiation (the sum of hourly records) at 200 cm above ground and total rainfall from May to October 2011–2014.
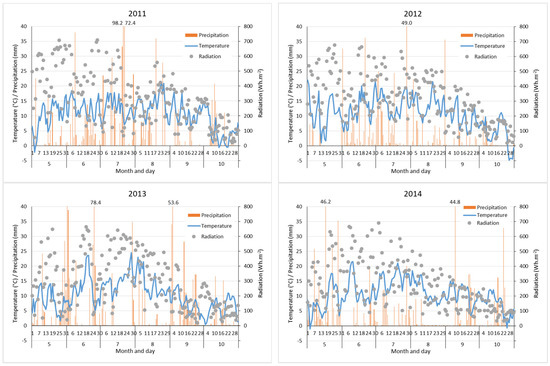
Figure 2.
Mean daily air temperature and daily radiation sum (measured every hour) at 200 cm above ground and the daily sum of precipitation in the 2011–2014 growing seasons. Any precipitation value excessing the y-axis range is presented above.
Median daily solar radiation (the median of the sums of hourly records) was similar in 2011 and 2012 (with medians of 307 and 308 Wh·m−2, respectively), whereas it was lower in the following years. A greater variability in the sum of solar radiation was observed in 2011 and 2013 (Table 2). The 2011 and 2013 growing seasons were rich in rainfall; the total sums exceeded 880 mm, whereas the most precipitation fell in July 2011 (365 mm) and in June and September 2013 (283 and 248 mm, respectively, Figure 3). In July 2011, 204 mm of rainfall fell within 3 days. The most serious low-rainfall periods were observed in the second half of May 2012, in July 2013, and from August to September 2014 (Figure 2).
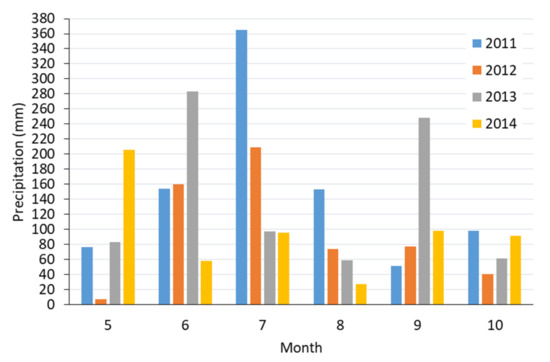
Figure 3.
Total precipitation in analyzed months of the growing seasons in 2011–2014.
3.2. Soil Waterlogging and Root Distribution
The evaluation of soil waterlogging indicated different soil profile saturation patterns under the treatments compared. The below-birch soil profile was moist within the sampled depth, and no saturation zone was observed, whereas 75% of the below-spruce probes were filled with water either fully or except for the topmost 10 cm. Only 13% of these water-filled probes were found in the grass-dominated gap.
An analysis of the root cores showed that more than 90% of the weight of coarser roots (exceeding 1 mm in diameter) was present in the upper 20 cm of the mineral topsoil under the birch stand, and single coarser roots penetrated the soil to a depth of 50 cm. Under both the spruce stand and the grass in the gap, more than 90% of coarser roots penetrated the upper 12 cm; in the spruce stand, some coarser roots were found at a depth of 35 cm, and in the gap at a depth of 25 cm (Figure 4). The total average dry weight of coarser roots was 1.48 kg m−2 (SD 0.55) under birch, 1.30 kg m−2 (SD 0.35) under spruce, and 0.50 kg m−2 (SD 0.34) in the gap. Because of the low number of samples, differences were only less significant, i.e., p = 0.122 (to reject the valid hypothesis, a confidence coefficient above 0.90 is not required with regard to the practical significance of the differences in root distribution).
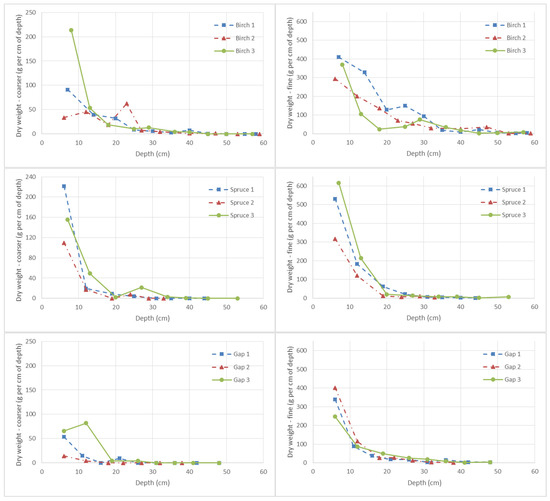
Figure 4.
Average dry weight (g) of coarser (left) and fine (right) roots per cm of depth of the respective soil layer on an area of 1 m2.
Below the birch, spruce, and gap treatments, fine roots comprising 90% of their total sampled weight were located within the topmost 29 cm, 13 cm, and 18 cm, respectively. Single fine roots were found even deeper in the analyzed profiles, i.e., to 58 cm in birch, to 53 cm in spruce, and to 48 cm in the gap treatments, respectively. The total average dry weight of fine roots per 1 m2 amounted to 5.67 kg (SD 1.27) under birch, 4.56 kg (SD 1.32) under spruce, and 3.04 (SD 0.31) under gap vegetation, but the differences were statistically less significant (p = 0.123).
3.3. The Average Moisture of the Topsoil Layer in the Growing Seasons
The lowest average water content of the topsoil was observed under the birch stand in each studied period. With the exception of 2012, spruce showed higher values, and the gap showed the highest average water content values compared to birch. The limits of the 95% confidence interval prove that the average moisture content of the birch topsoil was significantly lower, except for 2012, than the average moisture content below the gap, and also than the moisture content below spruce in 2011–2012 (Table 3). The 2011–2014 variability (represented by the pivot range—R95%) of this moisture decreased in the birch > spruce > gap order. The average growing season moisture content of the topsoil under the tree species showed a downward trend with the exception of the 2012 period (Table 3) and correlated strongly with the solar radiation sum (for birch r2 = 0.973, while for spruce r2 = 0.921; Table 2). In the gap, the differences in the average values were low in these particular years.
Table 3.
The average volumetric topsoil water content (%) in the studied periods. PL—the average of daily pivot halfsums; L95%, H95%, and R95%—the mean of daily pivot statistics representing a 95% confidence interval of the mean (lower limit, upper limit of the confidence interval, and their difference (range), respectively).
3.4. The 2011 Growing Season
As for the average daily water content, the highest values were found in the gap topsoil, lower ones under spruce, and the lowest ones under birch. At the beginning of the period, the birch topsoil was significantly drier than the gap topsoil, but the moisture difference between spruce and the gap was not significant (Figure 5). From the end of May, the water content of the topsoil under birch, with the exception of single short periods after heavier rainfall events, was significantly lower compared to the two other treatments. Significant moisture differences between the spruce and the gap were observed only at the beginning of October (Figure 5). The lowest values of average moisture of the topsoil under birch (32.1%) and in the gap (40.3%) were recorded at the beginning of June, while under the spruce stand, the minimum was measured at the beginning of October (37.3%).
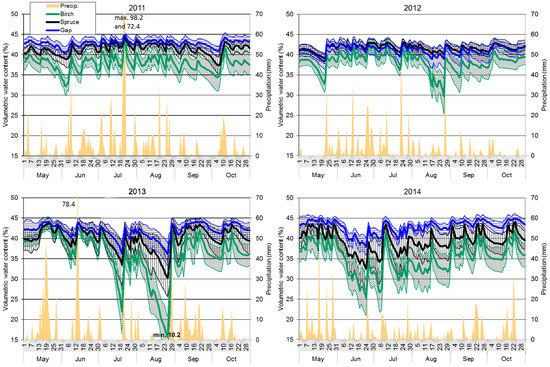
Figure 5.
Precipitation (mm day−1) and the average volumetric water content of the topsoil (%; bold line) and the 95% confidence interval of the average volumetric water content expressed by pivot statistics (L95%, H95%; thin line and hatching) under the spruce, birch, and gap treatments in 2011–2014 growing seasons. Any precipitation exceeding the y-axis range is presented above, while the water content value below the y-axis range is at the bottom of the chart.
3.5. The 2012 Growing Season
The lowest amount of rainfall occurred in the 2012 growing season (Table 2). The mean water content of the topsoil under spruce was close to levels seen in the gap topsoil. The birch topsoil showed lower values; the differences were more frequently significant compared to spruce, which showed lower variability than the gap values (Figure 5). Statistical differences between the birch and gap were observed in late summer before heavier rainfall events. As a consequence of the low amount of rainfall in spring, the minimum water content of the topsoil was recorded under the studied treatments at the end of May, when the minimum moisture dropped to 32.8% under birch, 39.1% under spruce, and 38.3% in the gap. The birch topsoil water content proceeded to decrease to even lower values in late August (29.6%; see Figure 5). Despite the low amount of rainfall at the end of the studied period, the soil water content under each treatment obviously increased.
3.6. The 2013 Growing Season
Similarly to 2011, the average water content of the gap topsoil was the highest among the treatments in the 2013 growing season; however, the difference from spruce was not significant. This year was rich in rainfall, but its distribution was a limiting factor. During a precipitation-less period beginning in mid-July, the topsoil water content decreased particularly under birch, where it was, with some exceptions, lower than in the gap (Figure 5). The lowest values in all treatments were observed during a period of low precipitation in the second half of August, when the average volumetric moisture of the topsoil dropped to 15.6%, 30.3%, and 36.1% under the birch, spruce, and gap treatments, respectively; these values were the absolute minima for all four studied growing seasons. Given the substantial rain that fell at the end of August, which amounted to almost 100 mm within four days with a maximum of 53.6 mm per day, the water content of the topsoil increased rapidly. Despite becoming almost equal in all three treatments, the water content of the birch topsoil remained significantly lower than in the gap in the next period (Figure 5).
3.7. The 2014 Growing Season
The average water content of the gap topsoil was the highest once again in the 2014 growing season, showing a significantly lower variance compared to both tree species treatments. The sensors left on site over winter confirmed a different level of topsoil moisture under the studied treatments from the end of winter, which influenced the beginning of the observed vegetation period (Figure 5). The lowest water content was observed in late June (24 June). Due to more frequent rainfalls of sufficient intensities, the values did not decrease as much as was seen in the preceding year. The average water content of the topsoil layer amounted to 25.4%, 32.6%, and 38.1% under the birch, spruce, and gap treatments, respectively. Whereas the water content under birch was significantly lower compared to the gap from mid-May, with the exception of two short intense rainfall episodes (mid-July, end of November), differences in the topsoil water content between spruce and the gap were only minor and lasted a short time, which correlated with the ends of longer periods of rainless days (Figure 5).
3.8. Soil Moisture Differences
During the four growing seasons studied, significant differences in soil moisture between the treatments were observed. With the exception of 2012 (the driest season with the largest radiation sum) and the spring of 2013, the gap topsoil moisture was significantly higher compared to that of birch on most days (Figure 6). Frequent significant differences between the moisture of birch and spruce were seen in both 2011 and 2012, whereas only short summer periods showed a difference in 2013–2014. On the other hand, below-spruce moisture differed from that of the gap at the beginning and the end of the 2011 season, which was not confirmed in the next two years until late summer, and the autumn values differed significantly in 2014.
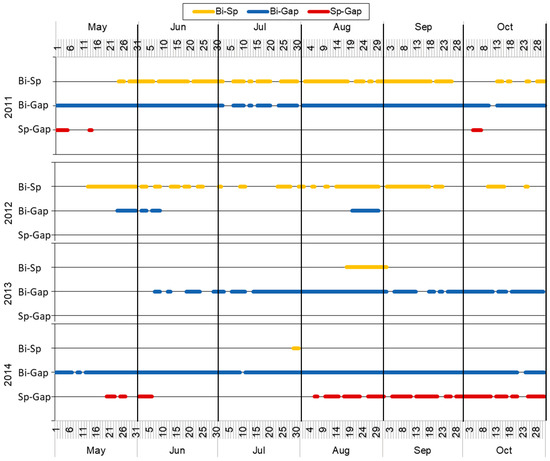
Figure 6.
Periods with significant differences in topsoil moisture between treatments in 2011–2014. Bi-Sp—differences in birch and spruce treatment; Bi-Gap—differences in birch and gap treatments; Sp-Gap—differences in spruce and gap treatments.
3.9. Interception, Evapotranspiration, and Infiltration
According to our estimations, the spruce stand was able to intercept more rainwater than both other treatments throughout the vegetation period (Figure 7). There was no development trend observed between the four subsequent years. Maximal precipitation intercepted during precipitation events in individual years and months differed as a consequence of actual precipitation distribution (Figure 3) and other weather circumstances. In addition, consequently, the ranges of intervals of interception capacity differed. The highest average interception capacity of all treatments was found in May (it was equal to the September one in birch), while the lowest values were found at the end of the vegetation period (Figure 7). In the growing season, the average interception capacity of birch, spruce, and gap treatments ranged from 1.4 to 2.2 mm, 2.1 to 2.6 mm, and 1.2 to 2.2 mm, respectively.
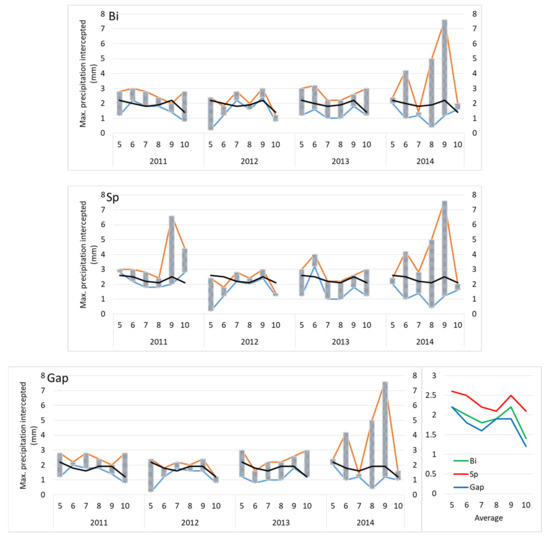
Figure 7.
Intervals with interception capacities (maximal precipitation fully intercepted) according to treatment (Bi—birch, Sp—spruce, Gap), growing season, and month (left), and averages of maximal precipitation intercepted (right). Blue line—maximal precipitation subtotal of a fully intercepted event (with no response by the topsoil moisture); red line—next precipitation event in size (total mm); black line—average maximal interception for the month.
The average volumetric topsoil moisture loss representing evapotranspiration with infiltration intensity progressed dynamically over the growing seasons: The lowest values were seen mostly in October, whereas the highest were in June and/or July. The TMLs in birch were significantly higher, but the differences decreased in the spring and the autumn months (Figure 8). There was a greater similarity in the TML distribution of birch and spruce in 2014. The maximum TML in birch, spruce, and the gap reached 1.9%, 0.7%, and 0.6% in 2011; 4.2%, 0.8%, and 1.5% in 2012; 4.4%, 1.8%, and 1.4% in 2013; and 4.5%, 2.6%, and 1.6% in 2014, respectively.
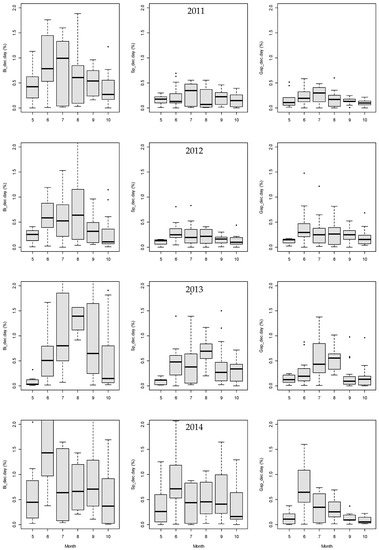
Figure 8.
Boxplots of the average daily volumetric topsoil moisture decreases (%) between precipitation events by month during the 2011–2014 growing seasons.
The intensive peak summer rain event effects analyzed in more detail showed that soil moisture responded similarly in all three treatments. The rate of soil moisture increase differed, however, as a more intensive response of soil moisture under the birch stand was obvious in both rising and falling limbs of the curve (Figure 9).
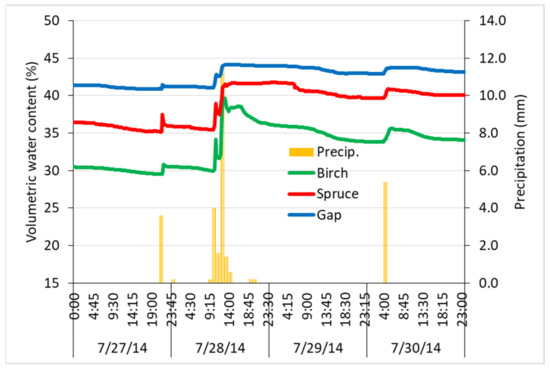
Figure 9.
The 4-day summer period showing the average volumetric topsoil water content (%) response to rain events (mm per hour) under spruce, birch, and gap vegetation in 2014.
4. Discussion
4.1. Precipitation
Differences in the nature of herb and woody species as well as the habitus differences between spruce and birch impacts total stand interception (see e.g., [43]), which lowers the amount of water that reaches the soil surface (effective precipitation). Both stemflow and also occult (also called horizontal, condensed) precipitation at higher altitudes have an opposite effect on the amount of throughfall [44].
Kantor and Šach [45] considered interception as the main source of higher water consumption (E+I) by both Serbian spruce (G = 14.4 m2 per ha in 20 years) and silver birch (G = 13.3 m2 per ha) stands aged 14 to 20 years compared to treeless gaps at middle altitudes (550 m a.s.l.) during years with high precipitation. Transpiration of the gap vegetation was approximately 5% higher than in the two tree stands. Differences in the estimated interception of the treatments in our study were not large; nevertheless, these can be also expected as one of the causes of the difference between the treeless treatment and both woody-canopy ones. A slight difference in the interception between birch and the gap treatment could be distorted by the additional precipitation present in birch through stemflow. In broadleaves, stemflow accounts for approximately 6% of the open-space rainfall, whereas in conifers it is only 2% [46,47]. However, despite their smoother bark, the role of birches’ stemflow in the augmentation of the below-canopy water amount (throughfall water surplus) when it rains is probably limited due to their growth (size).
Under the mountain conditions (e.g., [48]) of our study, the importance of occult precipitation from mist or fog during the growing season can be expected mainly in spruce due to its higher LAI [49,50,51]. However, this surplus might be mostly reflected in the estimated interception of our study. The average LAI of spruce was more than three times higher than that of white birch (3.6 m2 m−2 for spruce in 2013 and 1.0 m2 m−2 for white birch in 2012). In the 2013 (2012)–2018 period, the average annual increase in LAI for both spruce and birch was estimated as 0.45 m2 m−2. The resulting effect of LAI on soil water content through interception and throughfall surplus acts together with evapotranspiration.
4.2. Evapotranspiration
The slope of the declining legs of volumetric topsoil moisture curves was likely to be attributable to both transpiration and infiltration intensities (see Figure 9). This was in accordance with Sprenger et al. [52], who estimated that it only takes a few days for infiltrated water to be taken up by roots in the growing season. The different pattern of the water content of the topsoil under both tree species treatments could also be related to the higher transpiration rate of birch compared to spruce, despite its lower LAI. For example, Oltchev et al. [53,54] revealed approximately 10–20% greater transpiration by silver birch and aspen trees compared to spruce in the growing season at an altitude of 200 m in western Russia, and the values were even two times higher during a dry summer [53]. Our study was situated in forest vegetation zone 8—Norway spruce (see [31]), where transpiration in the growing season is significantly limited by air temperature. Moreover, evaporation, which strongly correlates with temperature, is likely to be low when temperatures are cooler, and both can be estimated from the wide range of daily topsoil moisture decreases in summer months (Figure 8). In the gap treatment, the average ground air temperature was found to be significantly higher compared to young spruce, and the mean daily temperature ranges decreased in the following order: gap > birch > spruce in the 2011 and 2012 growing seasons [37].
On the contrary, mountaintop sites are frequently exposed to intense winds, which have an additive effect on evaporation as well as transpiration [55]. According to stand wind-breaking capabilities, wind speed is expected to decrease more as the air passes through spruce treatments compared to birch. Based on the different levels of volumetric topsoil moisture and also of daily topsoil moisture decreases, we inferred more water to be transpired by white birches from this upper layer compared to spruces. On the other hand, the estimated greater spruce LAI (>three times at the beginning), which was considered to be one of the most important factors in determining differences in transpiration [56], indicates a higher spruce transpiration potential compared to birch. For example, under the piedmont conditions of the Krkonoše Mts., mean vaporization (IET = precipitation minus percolation) of a ten-year-observation of what was initially a 14-years-old stand totaled 347 mm for Serbian spruce (stand density 42,000 per ha, a mean height of 9 m at the end) and 304 mm for a denser and taller silver birch stand (58,000 per ha, 10 m) per growing season [57]. The mean IET of ground vegetation in the gap was not much lower as it totaled 274 mm. These values cannot, however, be compared directly with our study site since the climatic conditions differ. However, higher summer-month differences in birch daily TML (compared to spruce and the gap) also indicate, besides higher infiltration intensity expected from root analyses, a significant impact of birch ET. The relative difference in spruce and birch LAI partly diminished during the analyzed years, and the significance of the soil water content differences also decreased. This supports the assumption of more factors affecting differences in topsoil moisture.
Closed-canopy spruce stands provide more shade relative to birch stands all year round. The higher light levels below the birch canopy in our experiment allowed for the intensive development of ground vegetation. In contrast to older stands (e.g., [58]), the differences in species abundance were small. Ground vegetation also contributes to evapotranspiration, however only to a limited extent compared to tree story. This can be inferred using a comparison of the topsoil water content under birch and under the gap, where below the dominant ground vegetation exposed to full solar radiation showed the highest level of topsoil moisture compared to both reforested treatments (see Figure 5 and Figure 9).
Alsheimer et al. [59] found relatively low maximum daily tree canopy transpiration rates (up to 2.8 mm per day in July) in a 40-year-old boggy spruce stand (G = 34.2 m2 per ha) at an altitude of 780 m in Fichtelgebirge. On the other hand, Müller [60] stated in his review that higher transpiration losses occur on a sunny day in high summer, accounting for 4.3–4.4 mm in spruce and 4.0–4.7 mm in silver birch. The transpiration rate of grass (C. epigeios (L.) Roth) was even higher, showing 6.8–8.8 mm per day with a sufficient soil water level, but only 2.45–2.9 mm with a high soil water deficit. Blueberry (Vaccinium myrtillus), the second most represented ground vegetation species in our study, was reported to transpire only 0.5–0.9 mm per day [60]. The noticeably high transpiration reported for C. epigeios seems to contradict with our observation of a relatively high soil water content in the gap. In our study, however, there was a mixture of dominant C. villosa accompanied by two species of the genus Vaccinium and Avenella flexuosa. This vegetation cover in the gap treatment was likely to show much lower transpiration rates compared to both tree species treatments. This corresponds to increased topsoil water content after forest stand removal, which was had previously been confirmed within the Jizerka catchment under comparable conditions [30].
In the majority of the evaluated periods, minimal values of average water content in the topsoil were observed in May-June, while the highest average daily decreases in topsoil moisture were seen in June-July, i.e., during the time of intensive vegetation development with higher water demands. This is in line, e.g., with analyses of maximal transpiration rates observed in a mixed aspen-spruce-birch forest in western Russia [54]. More intensive decreasing topsoil water content referring to increased evapotranspiration took place in all studied treatments, even though to a different extent in each of them. The most significant differences in water content between the gap and spruce stand were observed at the end of the growing seasons in 2011 and 2014 (Figure 6). This indicates reduced water uptake at the time of gap vegetation senescence.
4.3. Belowground Biomass Relationship to Soil Water
The depth of rooting and the total average dry weight of both coarser and fine roots per square meter decreased in the following order: white birch > Norway spruce > treeless gap. This seemed to be consistent with the observed topsoil moisture levels, since root penetration could play a role as another aspect influencing water uptake from the soil profile [61], as well as infiltration intensity being a gateway to deep percolation (DP). C. villosa is vegetatively propagated by rhizomes that penetrate the soil to a depth of 15–20 cm [62] and can reach a length of 500 m m−2 [63]. The observed higher proportion of roots at deeper soil layers under birch compared to the gap and spruce treatments is consistent with, e.g., Zakopal’s [64] findings, who described that a C. epigeios-dominant gap showed a mean dry weight of roots accounting for 85% (up to 94%) at a layer of 0–10 cm in heavy-textured compacted soils. At the same site, 8-year-old birch stands showed a surface root system within the upper 20 cm topsoil accounting for 90% of all the roots’ dry weight; in older stands, it was only 70%. The silver birch root system is deep, and root penetration is intensive, but it adapts to soil conditions, such as depth and the permeability of the soil [22,65], water table level, stoniness, and soil temperature [66]. If planted on abandoned arable soils, silver birch growth is significantly affected by available water in the upper soil layer (0–25 cm), thus reducing the impact of deeper soil layers [25]. Only minimal data are available about the nature of the root system of white birch; however, it can be assumed to be similar to that of silver birch.
Given the analyzed root cores, there is still some uncertainty with respect to water uptake beneath the monitored zone of the top 10 cm of mineral soil in our study. However, Brinkmann et al. [36] showed that during periods of sufficient soil water supply, which were the most frequent among the periods analyzed in our study, tree species use water from shallow soil layers. In contrast to spruce, broadleaves such as ash, beech, and sycamore maple are able to obtain water from even deeper soil layers (redistribution of soil water in the soil profile) when soil water availability is decreased in the topsoil [36], which can be assumed is identical in birch.
Root distribution through the soil profile under the birch treatment showed a different below-ground biomass accumulation than is the case with spruce. Whereas the total weight of birch roots amounted to 27.1 t per ha at 18 years of age, the spruce stand of the same age only accounted for 4.1 t per ha in a study analyzing forest stands in a taiga [67]. The difference was extremely high compared to our study, but we also found lower total root biomass in the spruce stand compared to the birch one (by 18%).
The dead roots of birch decompose faster than those of spruce, which is beneficial for soil porosity development [68], because roots are crucial makers of preferential pathways for water infiltration, which substantially increase the infiltration capacity of soil [69,70,71,72]. In this study, the proportion of recently dead roots was low, but living roots also represent preferential pathways, even though their impact on infiltration capacity is lower. Increased porosity of the topsoil can contribute to higher permeability by water and help transport water to deeper layers. It was obvious from the analyses of daily TMLs, when the assumption of a higher transpiration rate of birch does not completely clarify the differences. Spatial differences in soil porosity, which can help to explain the variability of soil moisture data, can be also expected: E.g., Metzger et al. [73] found lower soil water content at the same soil water potential in the proximity of beech trees, which indicated a higher fraction of coarse pores and coarse middle pores near the trees.
The soils at the study site are relatively porous sandy loams. During the years of soil water monitoring and soil sampling, short-term waterlogging was observed only twice, and both events occurred in autumn after intensive rains. Waterlogging can also be expected during periods of snow melt, when the air temperature does not exceed 4 °C and dormant roots do not yet start taking up water. These observations correspond with sprinkling experiments in spruce and beech stands on a hillslope [74] which showed different runoff dynamics. Due to its different root architecture, the spruce water table develops at approximately a 30 cm soil depth, while the soil water content at greater depths remains low during and after sprinkling. However, at the beech site, coarse roots drained more water towards deeper soil horizons, and the beech hillslope exhibited a faster runoff response than the spruce site [74]. Both rooting density and rooting depth are likely to contribute to the differences among our treatments as well.
4.4. Course of Growing Seasons and Soil Water Limits
As for the broadleaf’s phenology, both leaf development and leaf senescence affect interception and evapotranspiration more distinctly. A comparison of soil moisture between spruce and beech spots in a mixed mature stand in Lower Austria showed that in the period before leaf emergence, the soil water content was 5% higher under beech [75]. In our study, however, the beginning of the growing seasons in young stands showed an opposite trend—higher water content under spruce (with the exception of 2013). This was not likely to be explained by the greater soil moisture drawdown below birch, because the soil water content below both species was definitely recharged during each winter. Rothe [76], in a mixed stand in the hilly landscape of Southern Bavaria, described more intensive and deeper soil desiccation under beech than that under spruce at the same site, which corresponds with our observations of birch compared to spruce.
Rainfall deficits in the growing season, if accompanied by high temperatures, are a frequent cause of drought injuries in tree species. Fine roots of tree species are less resistant to drought than buds. At the same time, drought also diminishes nutrient availability in soil through the insufficiency of the soil solution [77]. Root death as a result of water deficit occurs most frequently in late summer. As for soil moisture, August seems to be the critical month when the lowest moisture levels of the growing season mostly occur, resulting in early leaf or needle fall [78,79]. In our experiment, the topsoil moisture in August tended to be minimal in 2012 and 2013, but it never dropped to the potential plant wilting point.
In 2012, the topsoil moisture content in the gap showed relatively greater variability in comparison with the other years. The spruce topsoil had less water in the period between June and September, but without significant differences (Figure 5). The year of 2012 showed that in spite of the significant number of point observations of soil moisture, the influence of the random positions of the moisture sensors was obvious. In relation to the other years, the low amount of precipitation did not sufficiently explain the exceptional proximity of the moisture patterns in the spruce and the gap treatments.
Water was not a limiting factor in either spruce or in the gap from 2011 to 2014 at the locality when compared with basic soil water content levels (soil water constants). There were only two short periods (in August 2013 and also in June 2014; see Figure 5) when soil moisture decreased to the field capacity (27%) under spruce. In birch, there was one short period when the lower 95% confidence interval of topsoil moisture dropped to the wilting point, which was approximately 9% (the end of August 2013). Birch soil moisture was depleted to the field capacity in summer more frequently (in August 2012, at the end of June and August 2013, and in June and July 2014). It was affirmed that white birch substantially decreases the water content of the topsoil, which can be beneficial at secondary-waterlogged sites.
5. Conclusions
The study helped us to formulate the following answers to three scientific questions: (1) Even within small patches that are 0.01 ha in size, 10-cm topsoil water content under gap vegetation showed higher values compared to the tree species during the growing season. The significance of topsoil moisture differences between the spruce stand and the gap was weaker; however, only partially overlapping confidence intervals of the moisture pattern showed that the differences cannot be considered to be minor. (2) The topsoil water content under spruce was significantly higher mostly for the first two growing seasons compared to the topsoil under birch, and the differences were much slighter afterwards. The most important reason could be birch’s deeper rooting, which makes preferential pathways for water infiltration (deep percolation). (3) The greatest effect of phenology (vegetation development phases during the vegetation period) on topsoil moisture was observed under the birch stand. In the spruce and gap treatments, such an effect was lower. The range of the differences in the topsoil moisture between the spruce stand and the gap increased with the growth of the spruce stand. The white birch substantially decreased the water content of the topsoil, which can be beneficial at secondary-waterlogged sites. However, this capability can also limit its performance at drier sites and even lessen the positive effect of its use as pioneer species in two-phase forest regeneration at sites prone to drought. In that case, making small clearings (gaps) can positively improve available soil water for target tree species.
Author Contributions
O.Š. designed and performed the experiment, derived and analyzed the data, and worked on the manuscript. All authors (O.Š., F.Š. and D.K.) discussed the results and contributed to the final manuscript. All authors have read and agreed to the published version of the manuscript.
Funding
The research was supported by the Ministry of Agriculture of the Czech Republic through Project NAZV No. QK1810415 “The Influence of Tree Species Composition and the Structure of Forest Stands on Microclimate and Hydrological Conditions in the Landscape” and by institutional support MZE-RO0118.
Acknowledgments
The authors gratefully acknowledge the establishment of the study site by Vratislav Balcar, an emeritus researcher from the Forestry and Game Management Research Institute, Opočno Research Station. The authors would also like to thank the language experts for editing the language and those people who assisted in taking samples and performing analyses in the lab. Many authors’ thanks go also to Jitka Součková for her help with the list of references cited.
Conflicts of Interest
The authors declare no conflict of interest.
References
- Huang, M.B.; Zettl, J.D.; Barbour, S.L.; Elshorbagy, A.; Si, B.C. The impact of soil moisture availability on forest growth indices for variably layered coarse-textured soils. Ecohydrology 2013, 6, 214–227. [Google Scholar] [CrossRef]
- Manrique-Alba, A.; Ruiz-Yanetti, S.; Moutahir, H.; Novak, K.; De Luis, M.; Bellot, J. Soil moisture and its role in growth-climate relationships across an aridity gradient in semiarid Pinus halepensis forests. Sci. Total Environ. 2017, 574, 982–990. [Google Scholar] [CrossRef]
- Kurz-Besson, C.B.; Lousada, J.L.; Gaspar, M.J.; Correia, I.E.; David, T.S.; Soares, P.M.M.; Cardoso, R.M.; Russo, A.; Varino, F.; Meriaux, C.; et al. Effects of recent minimum temperature and water deficit increases on Pinus pinaster radial growth and wood density in Southern Portugal. Front. Plant Sci. 2016, 7, 1170. [Google Scholar] [CrossRef] [PubMed]
- Porporato, A.; D’Odorico, P.; Laio, F.; Ridolfi, L.; Rodriguez-Iturbe, I. Ecohydrology of water-controlled ecosystems. Adv. Water Resour. 2002, 25, 1335–1348. [Google Scholar] [CrossRef]
- Bos, M.G.; Kselik, R.A.L.; Allen, R.G.; Molden, D.J. Effective precipitation. In Water Requirements for Irrigation and the Environment; Springer: Berlin, Germany, 2009. [Google Scholar]
- Gardon, F.R.; de Toledo, R.M.; Brentan, B.M.; dos Santos, R.F. Rainfall interception and plant community in young forest restorations. Ecol. Indic. 2020, 109, 105779. [Google Scholar] [CrossRef]
- Nolz, R. A review on the quantification of soil water balance components as a basis for agricultural water management with a focus on weighing lysimeters and soil water sensors/Ein Überblick über die Ermittlung von Wasserhaushaltsgrößen als Basis für die landeskulturelle Wasserwirtschaft mit Fokus auf Lysimeter und Bodenwassersensoren. Die Bodenkult. J. Land Manag. Food Environ. 2016, 67, 133–144. [Google Scholar]
- Iida, S.; Ohta, T.; Matsumoto, K.; Nakai, T.; Kuwada, T.; Kononov, A.V.; Maximov, T.C.; van der Molen, M.K.; Dolman, H.; Tanaka, H.; et al. Evapotranspiration from understory vegetation in an eastern Siberian boreal larch forest. Agric. For. Meteorol. 2009, 149, 1129–1139. [Google Scholar] [CrossRef]
- Tie, Q.; Hu, H.; Tian, F.; Holbrook, N.M. Comparing different methods for determining forest evapotranspiration and its components at multiple temporal scales. Sci. Total. Environ. 2018, 633, 12–29. [Google Scholar] [CrossRef] [PubMed]
- Mitchell, A.; Ellsworth, T.; Meek, B. Effect of Root systems on preferential flow in swelling soils. Commun. Soil Sci. Plant Anal. 1995, 26, 2655–2666. [Google Scholar] [CrossRef]
- Brümmer, C.; Black, T.A.; Jassal, R.S.; Grant, N.J.; Spittlehouse, D.L.; Chen, B.; Nesic, Z.; Amiro, B.D.; Arain, M.A.; Barr, A.G.; et al. How climate and vegetation type influence evapotranspiration and water use efficiency in Canadian forest, peatland and grassland ecosystems. Agric. For. Meteorol. 2012, 153, 14–30. [Google Scholar] [CrossRef]
- Gribovszki, Z.; Kalicz, P.; Palocz-Andresen, M.; Szalay, D.; Varga, T. Hydrological role of Central European forests in changing climate-review. Idojaras 2019, 123, 535–550. [Google Scholar]
- Hríbik, M.; Vida, T.; Skvarenina, J.; Skvareninova, J.; Ivan, L. Hydrological effects of Norway spruce and European beech on snow cover in a Mid-Mountain Region of the Polana Mts., Slovakia. J. Hydrol. Hydromech. 2012, 60, 319–332. [Google Scholar] [CrossRef]
- Peck, A.; Mayer, H. Influence of stand parameters on evaporation in forests. Forstwiss. Cent. 1996, 115, 1–9. [Google Scholar] [CrossRef]
- Reynolds, E.R.C.; Henderson, C.S. Rainfall interception by beech, larch and Norway spruce. Forestry 1967, 40, 165–184. [Google Scholar] [CrossRef]
- Soubie, R.; Heinesch, B.; Granier, A.; Aubinet, M.; Vincke, C. Evapotranspiration assessment of a mixed temperate forest by four methods: Eddy covariance, soil water budget, analytical and model. Agric. For. Meteorol. 2016, 228, 191–204. [Google Scholar] [CrossRef]
- Clausnitzer, F.; Kostner, B.; Schwarzel, K.; Bernhofer, C. Relationships between canopy transpiration, atmospheric conditions and soil water availability—Analyses of long-term sap-flow measurements in an old Norway spruce forest at the Ore Mountains/Germany. Agric. For. Meteorol. 2011, 151, 1023–1034. [Google Scholar] [CrossRef]
- Saha, A.K.; Sternberg, L.D.O.; Ross, M.S.; Miralles-Wilhelm, F. Water source utilization and foliar nutrient status differs between upland and flooded plant communities in wetland tree islands. Wetl. Ecol. Manag. 2010, 18, 343–355. [Google Scholar] [CrossRef]
- Brooks, K.N.; Ffolliott, P.F.; Gregersen, H.M.; DeBano, L.F. Hydrology and the Management of Watersheds, 3rd ed.; Blackwell: Ames, IA, USA, 2003. [Google Scholar]
- Boldrin, D.; Leung, A.K.; Bengough, A.G. Hydrologic reinforcement induced by contrasting woody species during summer and winter. Plant Soil 2018, 427, 369–390. [Google Scholar] [CrossRef]
- Wang, C.; Fu, B.; Zhang, L.; Xu, Z. Soil moisture–plant interactions: An ecohydrological review. J. Soils Sediments 2019, 19, 1–9. [Google Scholar] [CrossRef]
- Abdallah, M.A.B.; Durfee, N.; Mata-González, R.; Ochoa, C.G.; Noller, J.S. Water use and soil moisture relationships on western juniper trees at different growth stages. Water 2020, 12, 1596. [Google Scholar] [CrossRef]
- Mata-González, R.; Abdallah, M.A.B.; Ochoa, C.G. Water use by mature and sapling western juniper (Juniperus occidentalis) trees. Rangel. Ecol. Manag. 2021, 74, 110–113. [Google Scholar] [CrossRef]
- Válek, Z. Lesní dřeviny Jako Vodohospodářský a Protierozní činitel [Forest Tree Species as Water Management and Erosion Control Factor]; Státní Zemědělské Nakladatelství: Praha, Czech Republic, 1977. [Google Scholar]
- Lutter, R.; Tullus, A.; Kanal, A.; Tullus, T.; Vares, A.; Tullus, H. Growth development and plant-soil relations in midterm silver birch (Betula pendula Roth) plantations on previous agricultural lands in hemiboreal Estonia. Eur. J. For. Res. 2015, 134, 53–667. [Google Scholar] [CrossRef]
- Mainiero, R.; Kazda, M.; Schmid, I. Fine root dynamics in 60-year-old stands of Fagus sylvatica and Picea abies growing on haplic luvisol soil. Eur. J. For. Res. 2010, 129, 1001–1009. [Google Scholar] [CrossRef]
- Wambsganss, J.; Beyer, F.; Freschet, G.T.; Scherer-Lorenzen, M.; Bauhus, J. Tree species mixing reduces biomass but increases length of absorptive fine roots in European forests. J. Ecol. 2021, 1–14. [Google Scholar] [CrossRef]
- Raz-Yaseef, N.; Yakir, D.; Schiller, G.; Cohen, S. Dynamics of evapotranspiration partitioning in a semi-arid forest as affected by temporal rainfall patterns. Agric. For. Meteorol. 2012, 157, 77–85. [Google Scholar] [CrossRef]
- Tužinský, L. Režim vlhkosti a zásob využiteľnej vody v pôde pod lesnými ekosystémami [Moisture and usable water reserves in soil under forest ecosystems]. In Vedecké práce Výskumného Ústavu Lesného Hospodárstva vo Zvolen; Príroda: Bratislava, Slovakia, 1990; pp. 95–110. [Google Scholar]
- Křeček, J.; Nováková, J. Soil water content and plant succession after the harvest of mature spruce stands in a mountain catchment. Ekológia 2009, 28, 213–224. [Google Scholar] [CrossRef]
- Viewegh, J.; Kusbach, A.; Mikeska, M. Czech forest ecosystem classification. J. For. Sci. 2003, 49, 85–93. [Google Scholar] [CrossRef]
- Balcar, V.; Podrázský, V. Založení výsadbového pokusu v hřebenové partii Jizerských hor [Establishment of a tree planting experiment in the ridge part of the Jizerské Mts.]. Zpr. Lesn. Výzkumu 1994, 39, 1–7. [Google Scholar]
- Forrester, D.I.; Tachauer, I.H.H.; Annighoefer, P.; Barbeito, I.; Pretzsch, H.; Ruiz-Peinado, R.; Stark, H.; Vacchiano, G.; Zlatanov, T.; Chakraborty, T.; et al. Generalized biomass and leaf area allometric equations for European tree species incorporating stand structure, tree age and climate. For. Ecol. Manag. 2017, 396, 160–175. [Google Scholar] [CrossRef]
- Balcar, V.; Špulák, O.; Kacálek, D.; Kuneš, I. Klimatické podmínky na výzkumné ploše Jizerka—I. Srážky a půdní vlhkost [Climatic conditions in the Jizerka experimental plot—Precipitation and soil moisture]. Zpr. Lesn. Výzkumu 2012, 57, 74–81. [Google Scholar]
- Tomst TMS Dataloggers. Available online: https://tomst.com/web/cz/systemy/tms/tms-3/ (accessed on 6 January 2020).
- Brinkmann, N.; Eugster, W.; Buchmann, N.; Kahmen, A. Species-specific differences in water uptake depth of mature temperate trees vary with water availability in the soil. Plant Biol. 2019, 21, 71–81. [Google Scholar] [CrossRef]
- Špulák, O.; Kacálek, D. Below-canopy and topsoil temperatures in young Norway spruce and Carpathian birch stands compared to gaps in the mountains. J. For. Sci. 2016, 62, 441–451. [Google Scholar] [CrossRef]
- Will, B.; Rolfes, I. Comparative study of moisture measurements by time domain transmissometry. In Proceedings of the IEEE Sensors, Baltimore, MD, USA, 3–6 November 2013; pp. 1–4. [Google Scholar] [CrossRef]
- Wild, J.; Kopecký, M.; Macek, M.; Šanda, M.; Jankovec, J.; Haase, T. Climate at ecologically relevant scales: A new temperature and soil moisture logger for long-term microclimate measurement. Agric. For. Meteorol. 2019, 268, 40–47. [Google Scholar] [CrossRef]
- Horn, P.S.; Pesce, A.J.; Copeland, B.E. A robust approach to reference interval estimation and evaluation. Clin. Chem. 1998, 44, 622–631. [Google Scholar] [CrossRef]
- Meloun, M.; Hill, M.; Militký, J.; Kupka, K. Analysis of large and small samples of biochemical and clinical data. Clin. Chem. Lab. Med. 2001, 39, 53–61. [Google Scholar] [CrossRef] [PubMed]
- R Core Team. R: A Language and Environment for Statistical Computing. R Foundation for Statistical Computing: Vienna, Austria. 2020. Available online: https://www.R-project.org/ (accessed on 3 March 2021).
- Acharya, B.S.; Kharel, G.; Zou, C.B.; Wilcox, B.P.; Halihan, T. Woody plant encroachment impacts on groundwater recharge: A review. Water 2018, 10, 1466. [Google Scholar] [CrossRef]
- Dohnal, M.; Černý, T.; Votrubová, J.; Tesař, M. Rainfall interception and spatial variability of throughfall in spruce stand. J. Hydrol. Hydromech. 2014, 62, 277–284. [Google Scholar] [CrossRef]
- Kantor, P.; Šach, F. Hydrická účinnost mladých náhradních porostů smrku omoriky a břízy bradavičnaté [Hydrological efficiency of substitute young stands of Serbian spruce and European birch]. Lesnictví-Forestry 1988, 34, 1017–1040. [Google Scholar]
- Barbier, S.; Balandier, P.; Gosselin, F. Influence of several tree traits on rainfall partitioning in temperate and boreal forests: A review. Ann. For. Sci. 2009, 66, 1–11. [Google Scholar] [CrossRef]
- Tužinský, L. Spruce and beech forest stands water balance. Ekológia 2000, 19, 198–210. [Google Scholar]
- Scholl, M.; Eugster, W.; Burkard, R. Understanding the role of fog in forest hydrology: Stable isotopes as tools for determining input and partitioning of cloud water in montane forests. Hydrol. Processes 2011, 25, 353–366. [Google Scholar] [CrossRef]
- Krečmer, V.; Fojt, V.; Křeček, J. Horizontální srážky z mlhy v lesích jako položka vodní bilance v horské krajině [Horizontal precitipation from fog in forests as part of the water balance in mountains]. Meteorol. Zpr. 1979, 32, 78–81. [Google Scholar]
- Minďaš, J.; Bartík, M.; Škvareninová, J.; Repiský, R. Functional effects of forest ecosystems on water cycle—Slovakia case study. J. For. Sci. 2018, 64, 331–339. [Google Scholar] [CrossRef]
- Vorčák, J.; Merganič, J.; Škvarenina, J.; Merganičová, K. Contribution to understanding precipitation regime in the mountain spruce forests of Babia hora—Oravské Beskydy using throughfall index. Beskydy 2009, 2, 85–94. [Google Scholar]
- Sprenger, M.; Tetzlaff, D.; Buttle, J.; Laudon, H.; Soulsby, C. Water ages in the critical zone of long-term experimental sites in northern latitudes. Hydrol. Earth Syst. Sci. 2018, 22, 3965–3981. [Google Scholar] [CrossRef]
- Oltchev, A.; Cermak, J.; Nadezhdina, N.; Tatarinov, F.; Tishenko, A.; Ibrom, A.; Gravenhorst, G. Transpiration of a mixed forest stand: Field measurements and simulation using SVAT models. Boreal Environ. Res. 2002, 7, 389–397. [Google Scholar]
- Oltchev, A.; Cermak, J.; Gurtz, J.; Tishenko, A.; Kiely, G.; Nadezhdina, N.; Zappa, M.; Lebedeva, N.; Vitvar, T.; Albertson, J.D.; et al. The response of the water fluxes of the boreal forest region at the Volga’s source area to climatic and land-use changes. Phys. Chem. Earth 2002, 27, 675–690. [Google Scholar] [CrossRef]
- Liuzzo, L.; Viola, F.; Noto, L. Wind speed and temperature trends impacts on reference evapotranspiration in Southern Italy. Theor. Appl. Climatol. 2016, 123, 43–62. [Google Scholar] [CrossRef]
- Granier, A.; Biron, P.; Bréda, N.; Pontailler, J.-Y.; Saugier, B. Transpiration of trees and forest stands: Short and long-term monitoring using sapflow methods. Glob. Chang. Biol. 1996, 2, 265–274. [Google Scholar] [CrossRef]
- Šach, F.; Kantor, P.; Černohous, V. Water budget in a young stands of substitute tree species in immission region of the Trutnov Piedmont in the Czech Republic. Lesn. For. 1994, 40, 211–216. [Google Scholar]
- Wallrup, E.; Saetre, P.; Rydin, H. Deciduous trees affect small-scale floristic diversity and tree regeneration in conifer forests. Scand. J. For. Res. 2006, 21, 399–404. [Google Scholar] [CrossRef]
- Alsheimer, M.; Köstner, B.; Falge, E.; Tenhunen, J.D. Temporal and spatial variation in transpiration of Norway spruce stands within a forested catchment of the Fichtelgebirge, Germany. Ann. Sci. For. 1998, 55, 103–123. [Google Scholar] [CrossRef]
- Müller, H. Standortsökologische Wasserhaushaltsuntersuchungen an Vaccinium myrtillus L. [Site-ecological water balance studies on Vaccinium myrtillus L.]. Arch. Forstwes. 1967, 16, 587–590. [Google Scholar]
- Canadell, J.; Jackson, R.B.; Ehleringer, J.R.; Mooney, H.A.; Sala, O.E.; Schulze, E.D. Maximum rooting depth of vegetation types at the global scale. Oecologia 1996, 108, 583–595. [Google Scholar] [CrossRef] [PubMed]
- Pyšek, P. What do we know about Calamagrostis villosa?—A review of the species behaviour in secondary habitats. Preslia 1993, 65, 1–20. [Google Scholar]
- Fiala, K. The role of root system of Calamagrostis epigejos in its successful expansion in alluvial meadows. Ekólogia 2001, 20, 292–300. [Google Scholar]
- Zakopal, V. Charakter půdního prokořenění křivoklátských holin zejména břízou [The nature of the rooting in the soil of clear-felled areas in the Křivoklát region especially by birch]. Sborník Ceskoslov. Akad. Zeměděl Věd. Lesn. 1958, 4, 737–760. [Google Scholar]
- Köstler, J.N.; Brückner, E.; Bibelriether, H. Die Wurzeln der Waldbäume. Untersuchungen zur Morphologie des Waldbäume in Mitteleuropa [Roots of the Forest Trees. Surveys to the Morphology of Forest Trees in the Central Europe]; P. Parey: Hamburg, Germany; Berlin, Germany, 1968. [Google Scholar]
- Mauer, O.; Houšková, K. Zpevňující funkce břízy [Stabilizing function of birch]. In Meliorační a Zpevňující Funkce Lesních Dřevin—Soil Improving and Stabilising Functions of Forest Trees; Kacálek, D., Mauer, O., Podrázský, V., Slodičák, M., Eds.; Lesnická práce: Kostelec nad Černými lesy, Czech Republic, 2017; pp. 115–121. [Google Scholar]
- Smirnov, V.V. Izmenenije syrorostuščej organičeskoj massy v jelovych i jelovo-listvennych drevostojach srednej tajgi [Changing of wetland organic matter in spruce and spruce-broadleaved forest stands of a middle taiga]. AN SSSR Tr. Inst. Lesa 1962, LIII, 103–125. [Google Scholar]
- Hynynen, J.; Niemistö, P.; Viherä-Aarnio, A.; Brunner, A.; Hein, S.; Velling, P. Silviculture of birch (Betula pendula Roth and Betula pubescens Ehrh.) in northern Europe. Forestry 2010, 83, 103–119. [Google Scholar] [CrossRef]
- Lange, B.; Luescher, P.; Germann, P.F. Significance of tree roots for preferential infiltration in stagnic soils. Hydrol. Earth Syst. Sci. 2009, 13, 1809–1821. [Google Scholar] [CrossRef]
- Lange, B.; Germann, P.; Lüscher, P. Einfluss der Wurzeln auf das Wasserspeichervermögen hydromorpher Waldböden [Significance of roots for soil water storage capacity of hydromorphic forest soils]. Schweiz. Z. Forstwes. 2010, 161, 510–516. [Google Scholar] [CrossRef][Green Version]
- Lüscher, P.; Zürcher, K. Waldwirkung und Hochwasserschutz: Eine differenzierte Betrachtungsweise ist angesagt [Forest effect and flood protection: A differentiated approach is required]. Ber. Bayer. Landesanst. Wald Forstwirtsch. 2003, 40, 30–33. [Google Scholar]
- Yunusa, I.A.M.; Newton, P.J. Plants for amelioration of subsoil constraints and hydrological control: The primer-plant concept. Plant Soil 2003, 257, 261–281. [Google Scholar] [CrossRef]
- Metzger, J.C.; Wutzler, T.; Dalla Valle, N.; Filipzik, J.; Grauer, C.; Lehmann, R.; Roggenbuck, M.; Schelhorn, D.; Weckmuller, J.; Kusel, K.; et al. Vegetation impacts soil water content patterns by shaping canopy water fluxes and soil properties. Hydrol. Process. 2017, 31, 3783–3795. [Google Scholar] [CrossRef]
- Jost, G.; Schume, H.; Hager, H.; Markart, G.; Kohl, B. A hillslope scale comparison of tree species influence on soil moisture dynamics and runoff processes during intense rainfall. J. Hydrol. 2012, 420, 112–124. [Google Scholar] [CrossRef]
- Schume, H.; Jost, G.; Katzensteiner, K. Spatio-temporal analysis of the soil water content in a mixed Norway spruce (Picea abies (L.) Karst.)—European beech (Fagus sylvatica L.) stand. Geoderma 2003, 112, 273–287. [Google Scholar] [CrossRef]
- Rothe, A. Einfluss des Baumartenanteils auf Durchwurzelung, Wasserhaushalt, Stoffhaushalt und Zuwachsleistung eines Fichten-Buchen-Mischbestandes am Standort Höglwald [Influence of spruce and beech mixtures on root penetration, water and nutrient balance and growth performance at the Höglwald site]. Forstl. Forschungsber. München 1997, 163, 1–213. [Google Scholar]
- Marschner, H. Mineral Nutrition of Higher Plants; Academic Press: London, UK, 1995. [Google Scholar]
- Bussotti, F.; Pollastrini, M. Traditional and novel indicators of climate change impacts on European forest trees. Forests 2017, 8, 137. [Google Scholar] [CrossRef]
- Sanchez-Salguero, R.; Camarero, J.J.; Grau, J.M.; de la Cruz, A.C.; Gil, P.M.; Minaya, M.; Fernandez-Cancio, A. Analysing atmospheric processes and climatic drivers of tree defoliation to determine forest vulnerability to climate warming. Forests 2017, 8, 13. [Google Scholar] [CrossRef]
Publisher’s Note: MDPI stays neutral with regard to jurisdictional claims in published maps and institutional affiliations. |
© 2021 by the authors. Licensee MDPI, Basel, Switzerland. This article is an open access article distributed under the terms and conditions of the Creative Commons Attribution (CC BY) license (https://creativecommons.org/licenses/by/4.0/).