
Effects of Windthrows on Forest Cover, Tree Growth and Soil Characteristics in Drought-Prone Pine Plantations

 ,
,  ,
, 
 , and
, and
Abstract
1. Introduction
2. Materials and Methods
2.1. Study Sites
2.2. Field Sampling Design and Laboratory Processing
2.3. Climate Data
2.4. NDVI Data
2.5. Growth Data
2.6. Soil Analyses
2.7. Statistical Analyses
3. Results
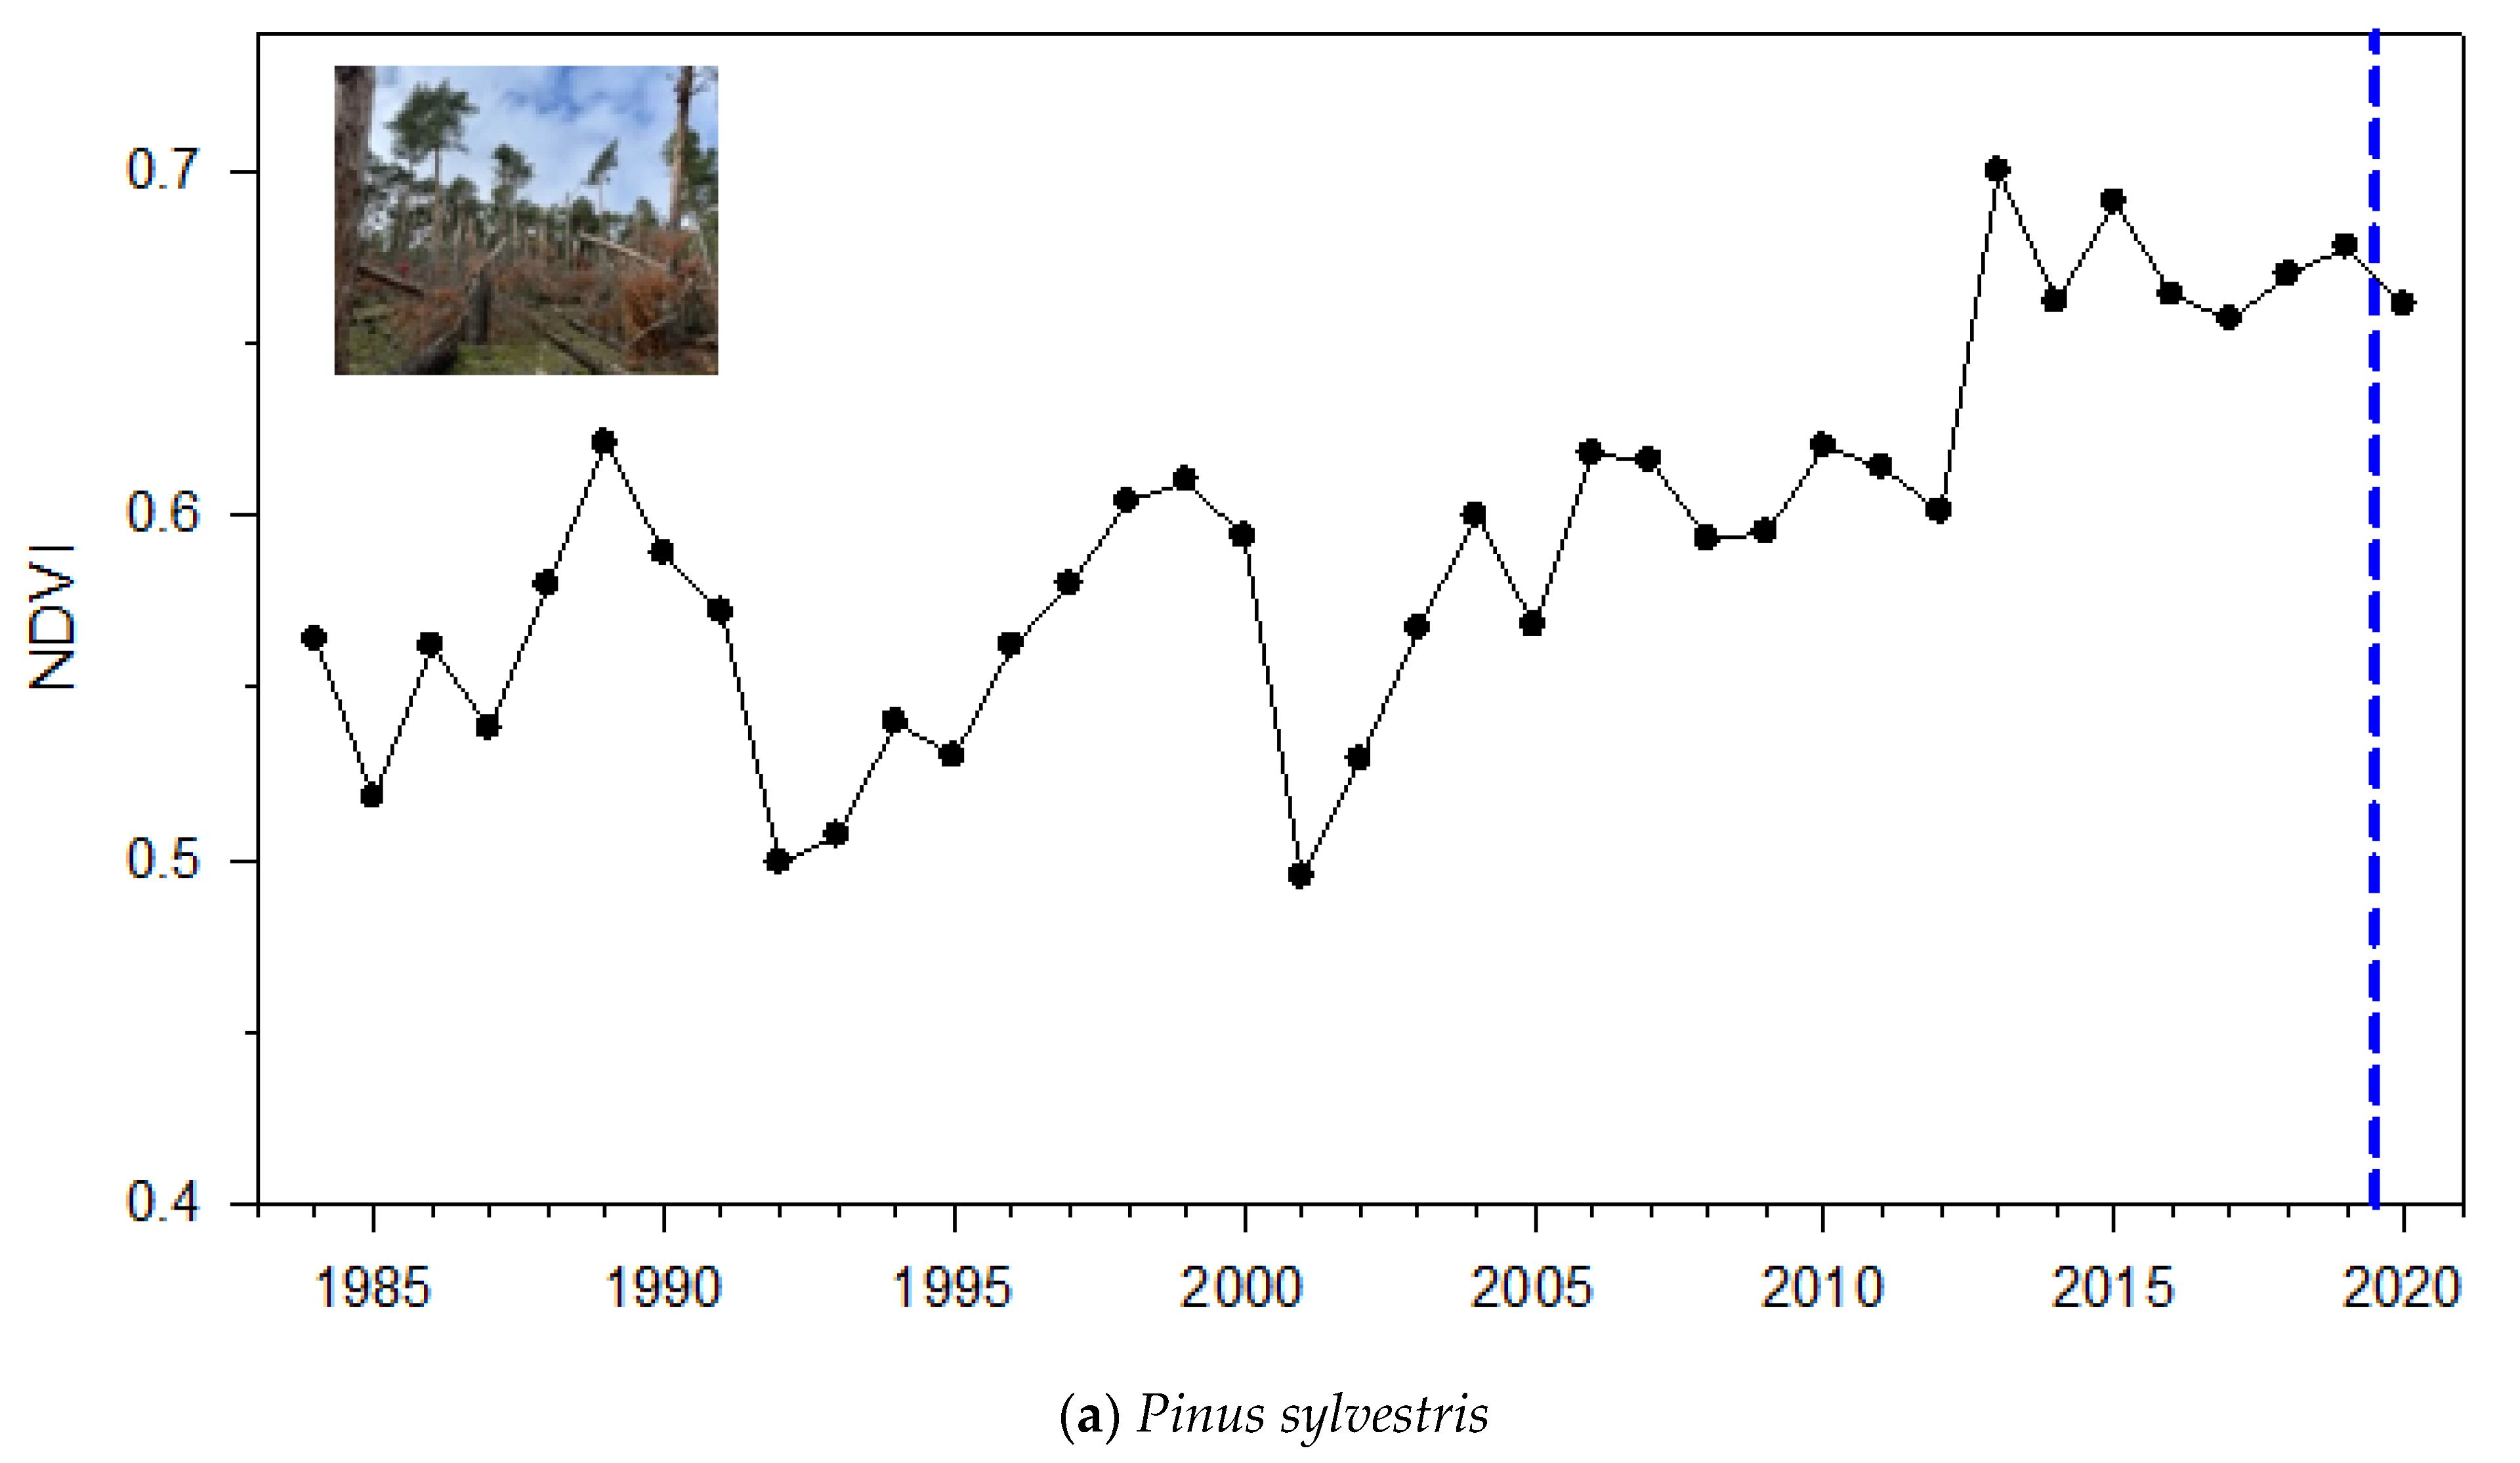
3.1. NDVI Patterns
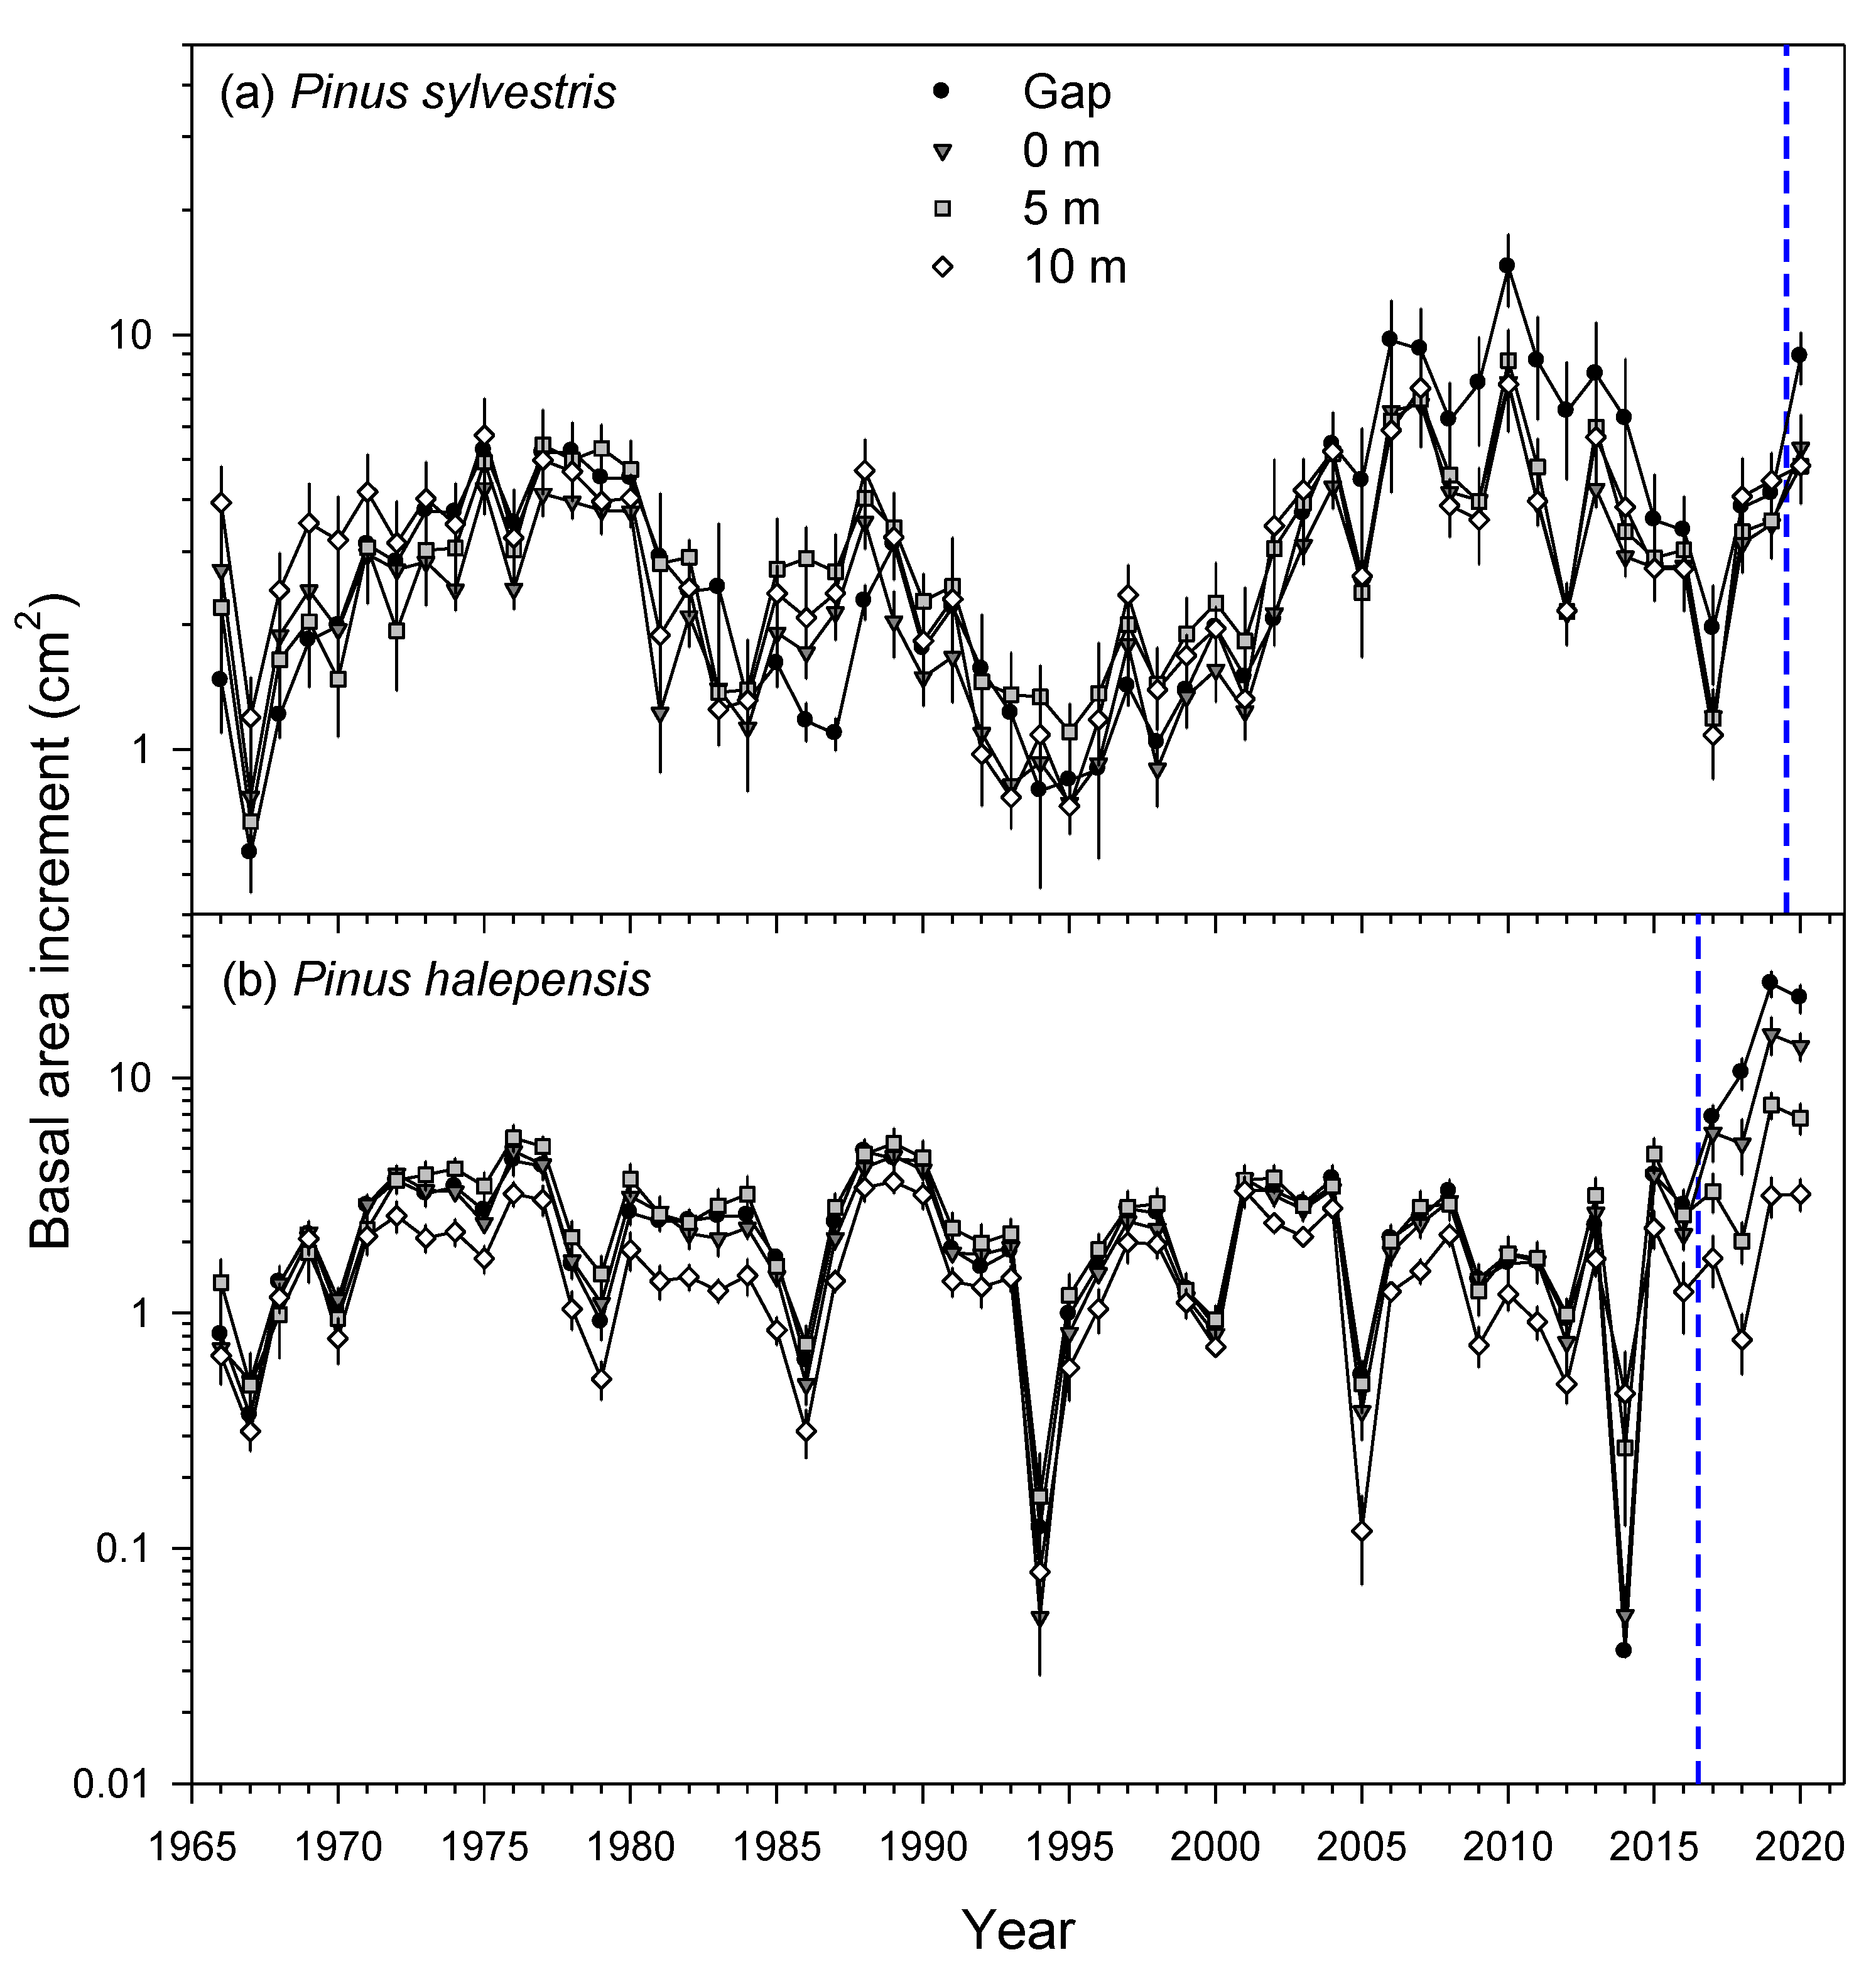
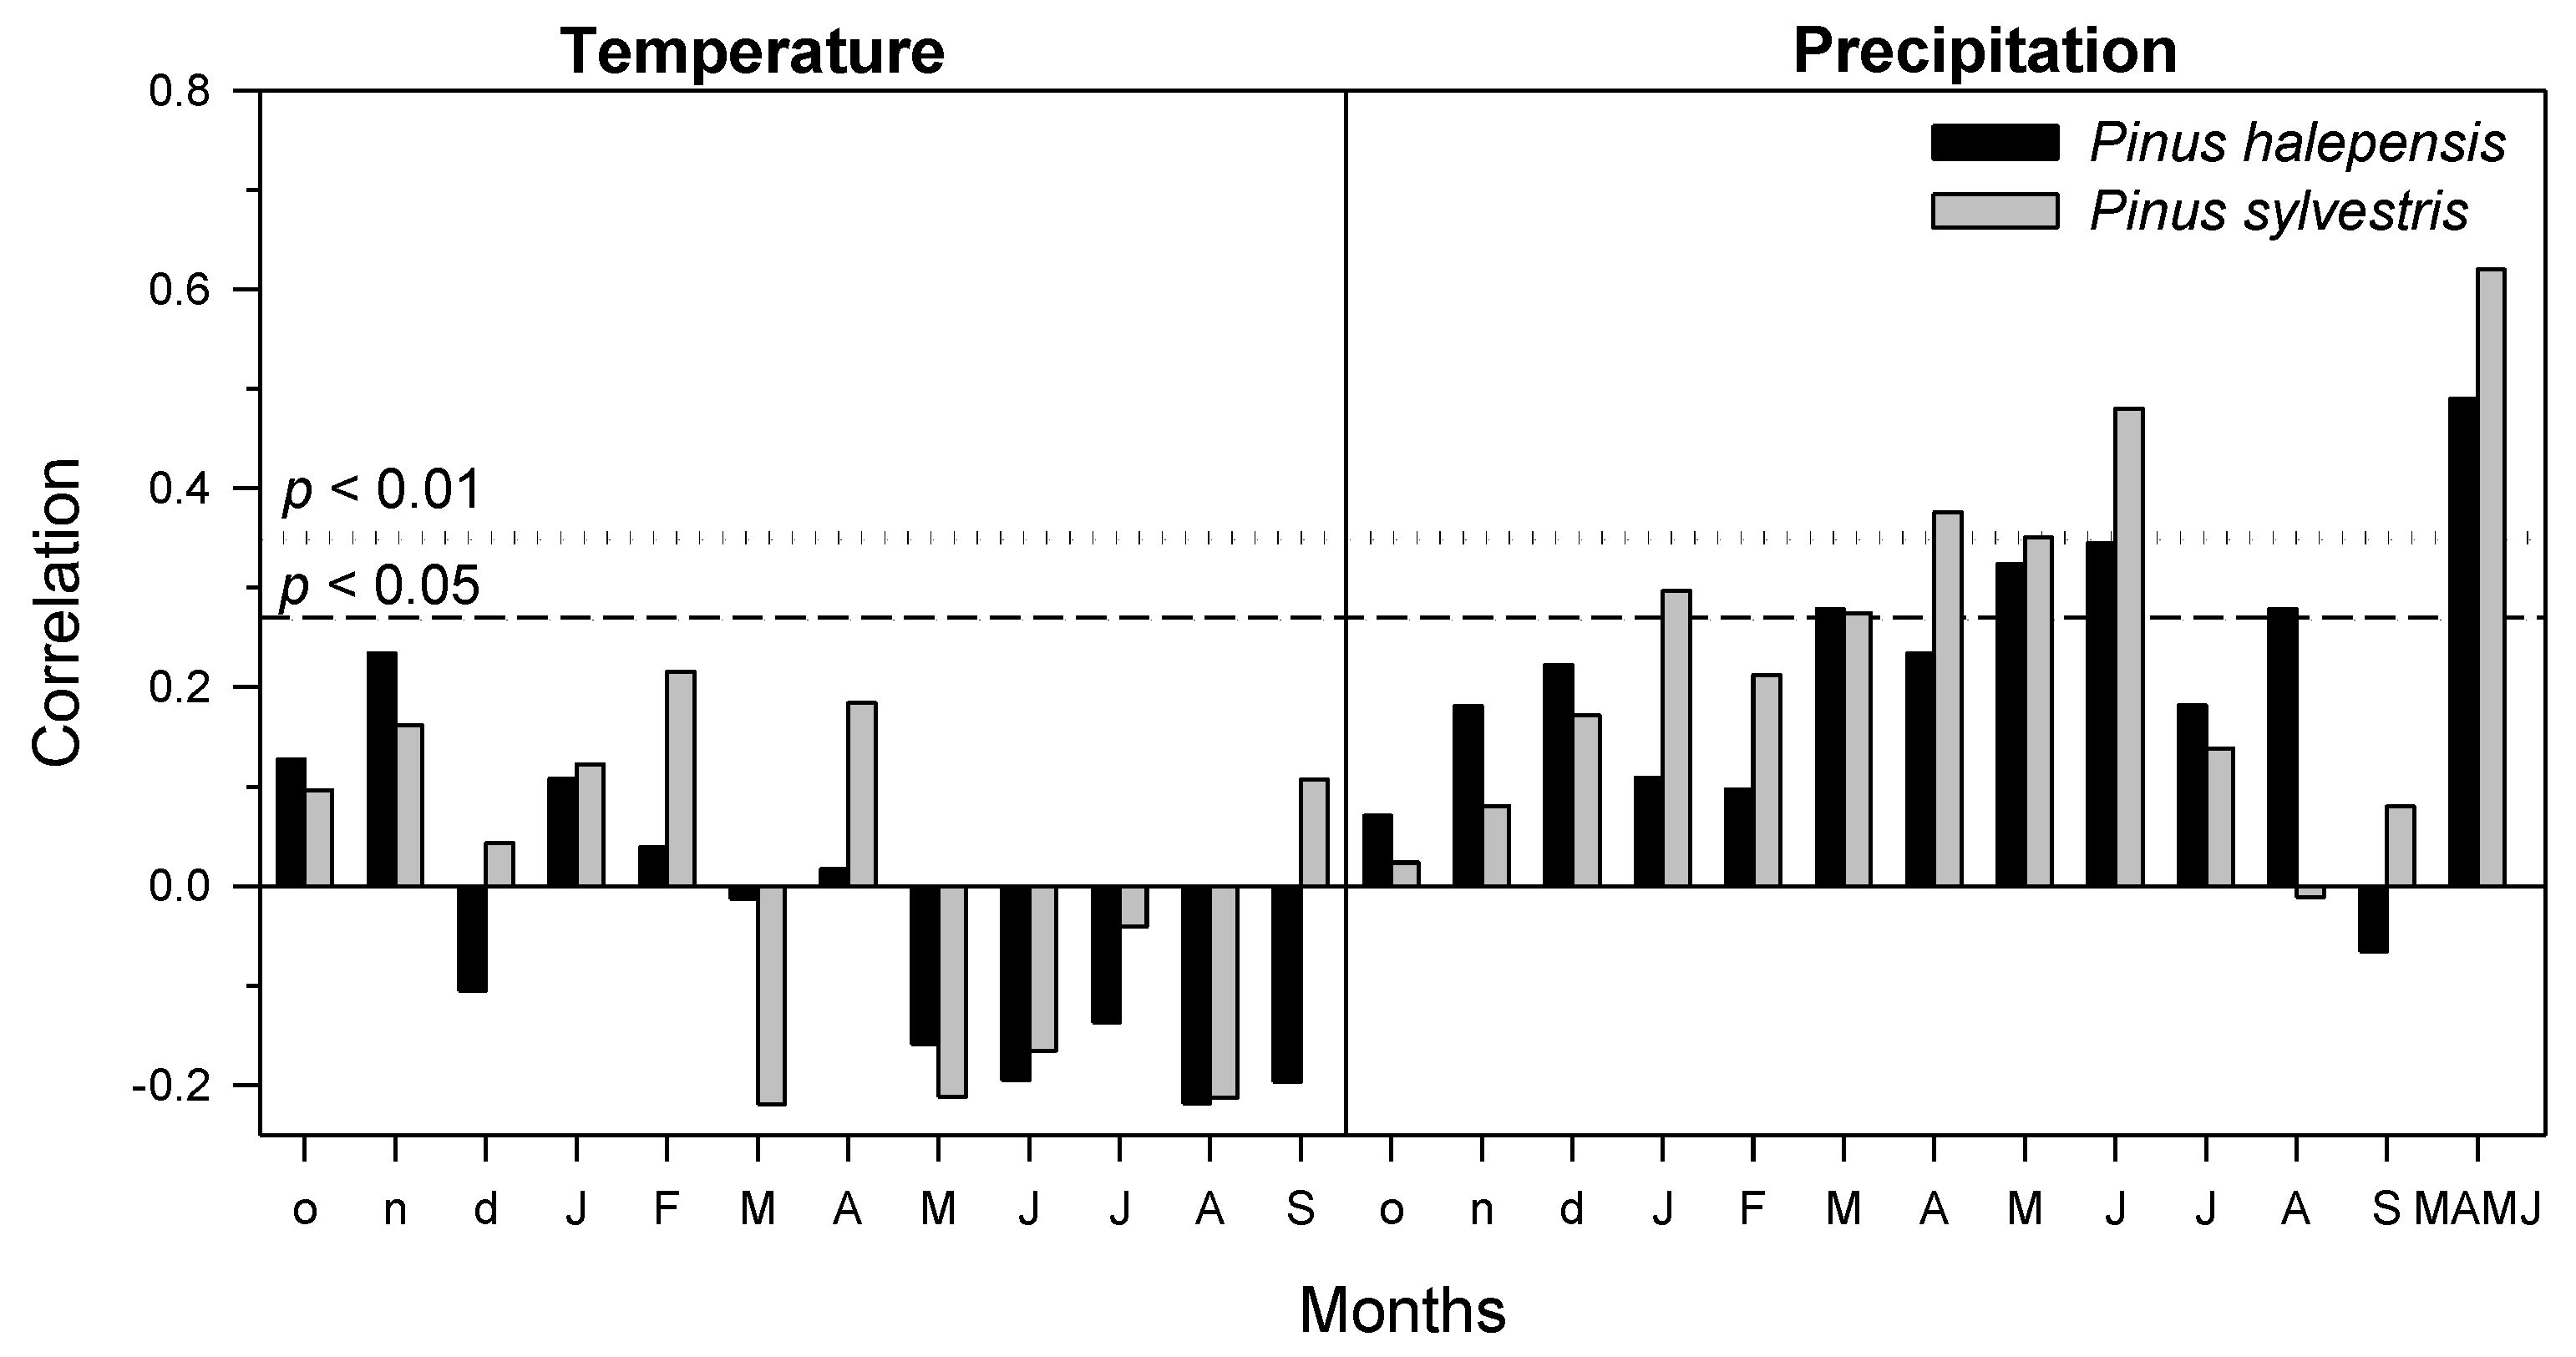
3.2. Tree Growth: Responses to the Windthrow and Climate-Growth Relationships
3.3. Soils: Texture, Nutrients and Microbiota
4. Discussion
4.1. Magnitude and Duration of Post-Windthrow NDVI Reduction and Growth Enhancement
4.2. Impacts of Windthrow on Soil Characteristics of Mediterranean Pine Plantations
4.3. Implications for Management of Disturbed Pine Plantations
5. Conclusions
Supplementary Materials
Author Contributions
Funding
Institutional Review Board Statement
Informed Consent Statement
Data Availability Statement
Acknowledgments
Conflicts of Interest
References
- Schelhaas, M.-J.; Nabuurs, G.-J.; Schuck, A. Natural disturbances in the European forests in the 19th and 20th centuries. Glob. Chang. Biol. 2013, 9, 1620–1633. [Google Scholar] [CrossRef]
- Doll, D.; Riou-Nivert, P. Les chablis en Europe: Courons-nous au désastre? Forêt-Entrep. 1991, 77, 1–16. [Google Scholar]
- Senf, C.; Seidl, R. Mapping the forest disturbance regimes of Europe. Nat. Sustain. 2021, 4, 63–70. [Google Scholar] [CrossRef]
- Seidl, R.; Schelhaas, M.-J.; Lexer, M.J. Unraveling the drivers of intensifying forest disturbance regimes in Europe. Glob. Chang. Biol. 2011, 17, 2842–2852. [Google Scholar] [CrossRef]
- Seidl, R.; Thom, D.; Kautz, M.; Martin-Benito, D.; Peltoniemi, M.; Vacchiano, G.; Wild, J.; Ascoli, D.; Petr, M.; Honkaniemi, J.; et al. Forest disturbances under climate change. Nat. Clim. Chang. 2017, 7, 395–402. [Google Scholar] [CrossRef] [PubMed]
- Seidl, R.; Schelhaas, M.J.; Rammer, W.; Verkerk, P.J. Increasing forest disturbances in Europe and their impact on carbon storage. Nat. Clim. Chang. 2014, 4, 806–810. [Google Scholar] [CrossRef] [PubMed]
- Wilson, J.S.; Oliver, C.D. Stability and density management in Douglas-fir plantations. Can. J. For. Res. 2000, 30, 910–920. [Google Scholar] [CrossRef]
- Mead, D.J. Sustainable Management of Pinus Radiata Plantations; FAO: Roma, Italy, 2013. [Google Scholar]
- Baldrian, P. Forest microbiome: Diversity; complexity and dynamics. FEMS Microbiol. Rev. 2017, 41, 109–130. [Google Scholar] [CrossRef]
- Splechtna, B.; Gratzer, G.; Black, B.A. Disturbance history of a European old-growth mixed-species forest—A spatial dendro-ecological analysis. J. Veg. Sci. 2005, 16, 511–522. [Google Scholar]
- Jaloviar, P.; Sedmáková, D.; Pittner, J.; Danková, L.J.; Kucbel, S.; Sedmák, R.; Saniga, M. Gap structure and regeneration in the mixed old-growth forests of National Nature Reserve Sitno, Slovakia. Forests 2020, 11, 81. [Google Scholar] [CrossRef]
- Gazol, A.; Ibáñez, R. Different response to environmental factors and spatial variables of two attributes (cover and diversity) of the understorey layers. For. Ecol. Manag. 2009, 258, 1267–1274. [Google Scholar] [CrossRef]
- Štursová, M.; Šnajdr, J.; Cajthaml, T.; Bárta, J.; Šantrůčková, H.; Baldrian, P. When the forest dies: The response of forest soil fungi to a bark beetle-induced tree dieback. ISME J. 2014, 8, 1920–1931. [Google Scholar] [CrossRef] [PubMed]
- Ulanova, N.G. The effects of windthrow on forests at different spatial scales: A review. For. Ecol. Manag. 2000, 135, 155–167. [Google Scholar] [CrossRef]
- Mitchell, S.J. Wind as a natural disturbance agent in forests: A synthesis. Forestry 2013, 86, 147–157. [Google Scholar] [CrossRef]
- Gazol, A.; Camarero, J.J.; Vicente-Serrano, S.M.; Sánchez-Salguero, R.; Gutiérrez, E.; de Luis, M.; Sangüesa-Barreda, G.; Novak, K.; Rozas, V.; Tíscar, P.A.; et al. Forest resilience to drought varies across biomes. Glob. Chang. Biol. 2018, 24, 2143–2158. [Google Scholar] [CrossRef] [PubMed]
- Aponte, C.; Matías, L.; González-Rodríguez, V.; Castro, J.; García, L.V.; Villar, R.; Marañón, T. Soil nutrients and microbial biomass in three contrasting Mediterranean forests. Plant Soil 2014, 380, 57–72. [Google Scholar] [CrossRef]
- Rodríguez, O.; Bech, J. Reanalysing strong-convective wind damage paths using high-resolution aerial images. Nat. Hazards 2020, 104, 1021–1038. [Google Scholar] [CrossRef]
- Piserra, M.T.; del Río, J. Study of the strong winds phenomenon hazard in Spain. Inf. Construcción 1994, 45, 5–12. [Google Scholar] [CrossRef][Green Version]
- Vicente-Serrano, S.M.; Gouveia, C.; Camarero, J.J.; Beguería, S.; Trigo, R.; López-Moreno, J.I.; Azorín-Molina, C.; Pasho, E.; Lorenzo-Lacruz, J.; Revuelto, J.; et al. Response of vegetation to drought time-scales across global land biomes. Proc. Natl. Acad. Sci. USA 2013, 110, 52–57. [Google Scholar] [CrossRef]
- De Vries, F.T.; Manning, P.; Tallowin, J.R.; Mortimer, S.R.; Pilgrim, E.S.; Harrison, K.A.; Hobbs, P.J.; Quirk, H.; Shipley, B.; Cornelissen, J.H.; et al. Abiotic drivers and plant traits explainlandscape-scale patterns in soil microbial communities. Ecol. Lett. 2012, 15, 1230–1239. [Google Scholar] [CrossRef]
- Guillot, E.; Hinsinger, P.; Dufour, L.; Roy, J.; Bertrand, I. With or without trees: Resistance and resilience of soil microbial communities to drought and heat stress in a Mediterranean agroforestry system. Soil Biol. Biochem. 2019, 129, 122–135. [Google Scholar] [CrossRef]
- Cornes, R.; van der Schrier, G.; van den Besselaar, E.J.M.; Jones, P.D. An ensemble version of the E-OBS temperature and precipitation datasets. J. Geophys. Res. Atmos. 2018, 123, 9391–9409. [Google Scholar] [CrossRef]
- Gorelick, N.; Hancher, M.; Dixon, M.; Ilyushchenko, S.; Thau, D.; Moore, R. Google Earth Engine: Planetary-scale geospatial analysis for everyone. Rem. Sens. Environ. 2017, 202, 18–27. [Google Scholar] [CrossRef]
- Didan, K. MOD13A1 MODIS/Terra Vegetation Indices 16-Day L3 Global 500m SIN Grid V006 [Data set]. NASA EOSDIS Land Processes DAAC. 2015. Available online: https://doi.org/10.5067/MODIS/MOD13A1.006 (accessed on 12 January 2021).
- Fritts, H.C. Tree-Rings and Climate; Academic Press: London, UK, 1976. [Google Scholar]
- Larsson, L.-A.; Larsson, P.O. CDendro and CooRecorder (v. 9.3.1) [Software]; Cybis Elektronik: Saltsjöbaden, Sweden, 2018. [Google Scholar]
- Holmes, R.L. Computer assisted quality control in tree ring dating and measurement. Tree-Ring Bull. 1983, 43, 69–78. [Google Scholar]
- Cook, E.R.; Krusic, P. A tree-ring standardization program based on detrending and autoregressive time series modeling; with interactive graphics. In Lamont Doherty Earth Observatory; Columbia University: New York, NY, USA, 2005. [Google Scholar]
- Briffa, K.R.; Jones, P.D. Basic chronology statistics and assessment. In Methods of Dendrochronology: Applications in the Environmental Sciences; Cook, E.R., Kairiukstis, L., Eds.; Kluwer Academic Publishers: Dordrecht, The Netherlands, 1990; pp. 137–152. [Google Scholar]
- Wigley, T.M.; Briffa, K.R.; Jones, P.D. On the average value of correlated time series; with applications in dendroclimatology and hydrometeorology. J. Clim. Appl. Meteorol. 1984, 23, 201–213. [Google Scholar] [CrossRef]
- Buyer, J.S.; Sasser, M. High throughput phospholipid fatty acid analysis of soils. Appl. Soil Ecol. 2012, 61, 127–130. [Google Scholar] [CrossRef]
- Frostegård, A.; Bååth, E. The use of phospholipid fatty acid analysis to estimate bacterial and fungal biomass in soil. Biol. Fertil. Soils 1996, 22, 59–65. [Google Scholar] [CrossRef]
- Zelles, L. Fatty acid patterns of phospholipids and lipopolysaccharides in the characterisation of microbial communities in soil: A review. Biol. Fertil. Soils 1999, 29, 111–129. [Google Scholar] [CrossRef]
- Zelles, L. Phospholipid fatty acid profiles in selected members of soil microbial communities. Chemosphere 1997, 35, 275–294. [Google Scholar] [CrossRef]
- Willers, C.; Jansen van Rensburg, P.J.; Claassens, S. Phospholipid fatty acid profiling of microbial communities–a review of interpretations and recent applications. J. Appl. Microbiol. 2015, 119, 1207–1218. [Google Scholar] [CrossRef] [PubMed]
- Legendre, P.; Legendre, L. Numerical Ecology; Elsevier: Amsterdam, The Netherlands, 2012. [Google Scholar]
- McArdle, B.H.; Anderson, M.J. Fitting multivariate models to community data: A comment on distance-based redundancy analysis. Ecology 2001, 82, 290–297. [Google Scholar] [CrossRef]
- Oksanen, J.; Blanchet, F.G.; Friendly, M.; Kindt, R.; Legendre, P.; McGlinn, D.; Minchin, P.R.; O’Hara, R.B.; Simpson, G.L.; Solymos, P.; et al. Vegan: Community Ecology Package. R Package Version 2.5-7. Available online: https://CRAN.R-project.org/package=vegan (accessed on 3 May 2021).
- R Core Team. R: A Language and Environment for Statistical Computing; R Foundation for Statistical Computing: Vienna, Austria; Available online: https://www.R-project.org/ (accessed on 3 May 2021).
- Hollander, M.; Wolfe, D.A. Nonparametric Statistical Methods; J. Wiley: New York, NY, USA, 1973. [Google Scholar]
- Dunn, O.J. Multiple comparisons using rank sums. Technometrics 1964, 6, 241–252. [Google Scholar] [CrossRef]
- Ogle, D.H.; Wheeler, P.; Dinno, A. FSA: Fisheries Stock Analysis. R Package Version 0.8.32. Available online: https://github.com/droglenc/FSA (accessed on 3 May 2021).
- Rakhsh, F.; Golchin, A.; Al Agha, A.B.; Nelson, P.N. Mineralization of organic carbon and formation of microbial biomass in soil: Effects of clay content and composition and the mechanisms involved. Soil Biol. Biochem. 2020, 151, 108036. [Google Scholar] [CrossRef]
- Riaz, M.; Marschner, P. Sandy soil amended with clay soil: Effect of clay soil properties on soil respiration; microbial biomass; and water extractable organic C. J. Soil Sci. Plant Nut 2020, 20, 2465–2470. [Google Scholar] [CrossRef]
- Sohn, J.A.; Saha, S.; Bauhus, J. Potential of forest thinning to mitigate drought stress: A meta-analysis. For. Ecol. Manag. 2016, 380, 261–273. [Google Scholar] [CrossRef]
- Giuggiola, A.; Bugmann, H.; Zingg, A.; Dobbertin, M.; Rigling, A. Reduction of stand density increases drought resistance in xeric Scots pine forests. For. Ecol. Manae. 2013, 310, 827–835. [Google Scholar] [CrossRef]
- Giuggiola, A.; Ogée, J.; Rigling, A.; Gessler, A.; Bugmann, H.; Treydte, K. Improvement of water and light availability after thinning at a xeric site: Which matters more? A dual isotope approach. New Phytol. 2016, 210, 108–121. [Google Scholar] [CrossRef] [PubMed]
- Tague, C.L.; Moritz, M.; Hanan, E. The changing water cycle: The eco-hydrologic impacts of forest density reduction in Mediterranean (seasonally dry) regions. WIREs Water 2019, 6, e1350. [Google Scholar] [CrossRef]
- Lohmander, P.; Helles, F. Windthrow probability as a function of stand characteristics and shelter. Scand. J. For. Res. 1987, 2, 227–238. [Google Scholar] [CrossRef]
- Vicente-Serrano, S.M.; Camarero, J.J.; Olano, J.M.; Martín-Hernández, N.; Peña-Gallardo, M.; Tomás-Burguera, M.; Gazol, A.; Azorin-Molina, C.; Bhuyan, U.; El Kenawy, A. Diverse relationships between forest growth and the Normalized Difference Vegetation Index at a global scale. Remote Sens. Environ. 2016, 187, 14–29. [Google Scholar] [CrossRef]
- Camarero, J.J.; Gazol, A.; Sangüesa-Barreda, G.; Vergarechea, M.; Alfaro-Sánchez, R.; Cattaneo, N.; Vicente-Serrano, S.M. Tree growth is more limited by drought in rear-edge forests most of the times. For. Ecosyst. 2021, 8, 25. [Google Scholar] [CrossRef]
- Tsamir, M.; Gottlieb, S.; Preisler, Y.; Rotenberg, E.; Tatarinov, F.; Yakir, D.; Tague, C.; Klein, T. Stand density effects on carbon and water fluxes in a semi-arid forest; from leaf to stand-scale. For. Ecol. Manag. 2019, 453, 117573. [Google Scholar] [CrossRef]
- Moreno, G.; Hernández-Esteban, A.; Rolo, V.; Igual, J.M. The enduring effects of sowing legume-rich mixtures on the soil microbial community and soil carbon in semi-arid wood pastures. Plant Soil 2021, in press. [Google Scholar] [CrossRef]
- Aussenac, G. Interactions between forest stands and microclimate: Ecophysiological aspects and consequences for silviculture. Ann. For. Sci. 2000, 57, 287–301. [Google Scholar] [CrossRef]
- Matsushima, M.; Chang, S.X. Effects of understory removal; N fertilization; and litter layer removal on soil N cycling in a 13-year-old white spruce plantation infested with Canada bluejoint grass. Plant Soil 2007, 292, 243–258. [Google Scholar] [CrossRef]
- De Boer, W.; Folman, L.B.; Summerbell, R.C.; Boddy, L. Living in a fungal world: Impact of fungi on soil bacterial niche development. FEMS Microbiol. Rev. 2005, 29, 795–811. [Google Scholar] [CrossRef] [PubMed]
- Lässig, R. Windwürfe—Chancen für artenreiche Wälder nutzen. Wald Holz 2000, 81, 56–60. [Google Scholar]
- Kumar, M.; Kumar, A.; Kumar, R.; Konsam, B.; Pala, N.A.; Bhat, J.A. Carbon stock potential in Pinus roxburghii forests of Indian Himalayan regions. Environ. Dev. Sustain. 2021. [Google Scholar] [CrossRef]


| Pinus sylvestris | Pinus halepensis | |
|---|---|---|
| Diameter at 1.3 m (cm) | 24.2 ± 0.8b | 19.8 ± 0.6a |
| Age at 1.3 m (years) | 91 ± 1b | 55 ± 1a |
| No. trees | 23 | 34 |
| No. cores | 35 | 67 |
| Tree-ring width (mm) | 0.98 ± 0.03a | 1.19 ± 0.03b |
| First-order autocorrelation | 0.69 ± 0.02 | 0.66 ± 0.01 |
| Mean sensitivity | 0.48 ± 0.01a | 0.63 ± 0.01b |
| Correlation with site series | 0.71 ± 0.02a | 0.90 ± 0.01b |
| Time span | 1922−2020 | 1962−2020 |
| Best-replicated time span 1 | 1936−2020 | 1965−2020 |
| Variables | Pinus sylvestris | Pinus halepensis | ||||||
|---|---|---|---|---|---|---|---|---|
| KW Test | p | Dt | p | KW Test | p | Dt | p | |
| clay | 0.273 | 0.602 | 5.771 | 0.016 | −2.402 | 0.016 | ||
| silt | 0.011 | 0.917 | 1.320 | 0.251 | ||||
| sand | 0.273 | 0.602 | 2.455 | 0.117 | ||||
| pH | 1.320 | 0.251 | 1.098 | 0.295 | ||||
| Organic C | 1.844 | 0.175 | 0.273 | 0.602 | ||||
| N | 0.273 | 0.602 | 3.153 | 0.076 | ||||
| C/N | 1.104 | 0.293 | 0.011 | 0.917 | ||||
| P | 1.844 | 0.175 | 3.153 | 0.076 | ||||
| Ca | 2.455 | 0.117 | 0.884 | 0.347 | ||||
| K | 0.535 | 0.465 | 6.818 | 0.009 | 2.611 | 0.009 | ||
| Mg | 4.811 | 0.028 | 2.193 | 0.028 | 6.818 | 0.009 | 2.611 | 0.009 |
| PC1 | 1.320 | 0.251 | 5.771 | 0.016 | 2.402 | 0.016 | ||
| PC2 | 0.535 | 0.465 | 1.844 | 0.175 | ||||
| Biomass | 0.011 | 0.917 | 3.153 | 0.076 | ||||
| Eukaryote | 1.320 | 0.251 | 0.535 | 0.465 | ||||
| Gram negative | 0.273 | 0.602 | 6.818 | 0.009 | 2.611 | 0.009 | ||
| Gram positive | 0.098 | 0.754 | 4.811 | 0.028 | −2.193 | 0.028 | ||
| Actinomycetes | 0.535 | 0.465 | 5.771 | 0.016 | −2.402 | 0.016 | ||
| Fungi | 2.455 | 0.117 | 2.455 | 0.117 | ||||
| AM Fungi | 2.455 | 0.117 | 0.011 | 0.917 | ||||
| Fungi: Bacteria | 2.455 | 0.117 | 2.455 | 0.117 | ||||
| Gram positive: Gram negative | 0.273 | 0.602 | 6.818 | 0.009 | −2.611 | 0.009 | ||
| Stress | 0.011 | 0.917 | 0.011 | 0.917 | ||||
| Variables | Pinus sylvestris | Pinus halepensis | ||||||
|---|---|---|---|---|---|---|---|---|
| PC1 | PC2 | PC1 | PC2 | |||||
| rho | p | rho | p | rho | p | rho | p | |
| Clay | 0.442 | 0.204 | 0.297 | 0.407 | −0.927 | 0.001 | −0.164 | 0.657 |
| Silt | 0.333 | 0.349 | 0.188 | 0.608 | −0.345 | 0.331 | 0.006 | 1.000 |
| Sand | −0.358 | 0.313 | −0.261 | 0.47 | 0.782 | 0.012 | −0.115 | 0.759 |
| pH | −0.261 | 0.47 | 0.067 | 0.865 | −0.681 | 0.03 | 0.201 | 0.578 |
| Organic C | 0.455 | 0.191 | 0.600 | 0.073 | 0.600 | 0.073 | −0.103 | 0.785 |
| N | 0.661 | 0.044 | 0.345 | 0.331 | 0.879 | 0.002 | −0.006 | 1.000 |
| C/N | −0.457 | 0.184 | 0.317 | 0.372 | 0.333 | 0.349 | 0.042 | 0.919 |
| P | 0.479 | 0.166 | 0.176 | 0.632 | 0.818 | 0.007 | −0.091 | 0.811 |
| Ca | 0.285 | 0.427 | 0.442 | 0.204 | −0.152 | 0.682 | −0.806 | 0.008 |
| K | 0.321 | 0.368 | 0.079 | 0.838 | 0.939 | 0.001 | 0.2 | 0.584 |
| Mg | −0.067 | 0.865 | 0.394 | 0.263 | 0.879 | 0.002 | 0.527 | 0.123 |
| Biomass | 0.806 | 0.008 | −0.055 | 0.892 | 0.855 | 0.004 | 0.042 | 0.919 |
| Eukaryotes | 0.406 | 0.247 | 0.539 | 0.113 | 0.333 | 0.349 | 0.564 | 0.096 |
| Gram negative | 0.794 | 0.010 | 0.248 | 0.492 | 0.964 | 0.001 | 0.261 | 0.47 |
| Gram positive | 0.067 | 0.865 | −0.358 | 0.313 | −0.321 | 0.368 | −0.758 | 0.016 |
| Actinomycetes | 0.176 | 0.632 | 0.224 | 0.537 | −0.964 | 0.001 | −0.345 | 0.331 |
| Fungi | −0.891 | 0.001 | 0.079 | 0.838 | 0.321 | 0.368 | 0.830 | 0.006 |
| AM Fungi | −0.297 | 0.407 | −0.745 | 0.018 | 0.455 | 0.191 | −0.479 | 0.166 |
| Fungi: Bacteria | −0.891 | 0.001 | 0.079 | 0.838 | 0.406 | 0.247 | 0.770 | 0.014 |
| Gram positive: Gram negative | −0.685 | 0.035 | −0.358 | 0.313 | −0.952 | 0.001 | −0.297 | 0.407 |
| Stress | −0.697 | 0.031 | −0.515 | 0.133 | 0.418 | 0.232 | −0.285 | 0.427 |
Publisher’s Note: MDPI stays neutral with regard to jurisdictional claims in published maps and institutional affiliations. |
© 2021 by the authors. Licensee MDPI, Basel, Switzerland. This article is an open access article distributed under the terms and conditions of the Creative Commons Attribution (CC BY) license (https://creativecommons.org/licenses/by/4.0/).
Share and Cite
Camarero, J.J.; Colangelo, M.; Gazol, A.; Pizarro, M.; Valeriano, C.; Igual, J.M. Effects of Windthrows on Forest Cover, Tree Growth and Soil Characteristics in Drought-Prone Pine Plantations. Forests 2021, 12, 817. https://doi.org/10.3390/f12070817
Camarero JJ, Colangelo M, Gazol A, Pizarro M, Valeriano C, Igual JM. Effects of Windthrows on Forest Cover, Tree Growth and Soil Characteristics in Drought-Prone Pine Plantations. Forests. 2021; 12(7):817. https://doi.org/10.3390/f12070817
Chicago/Turabian StyleCamarero, Jesús Julio, Michele Colangelo, Antonio Gazol, Manuel Pizarro, Cristina Valeriano, and José M. Igual. 2021. "Effects of Windthrows on Forest Cover, Tree Growth and Soil Characteristics in Drought-Prone Pine Plantations" Forests 12, no. 7: 817. https://doi.org/10.3390/f12070817
APA StyleCamarero, J. J., Colangelo, M., Gazol, A., Pizarro, M., Valeriano, C., & Igual, J. M. (2021). Effects of Windthrows on Forest Cover, Tree Growth and Soil Characteristics in Drought-Prone Pine Plantations. Forests, 12(7), 817. https://doi.org/10.3390/f12070817