MaxEnt Modeling Based on CMIP6 Models to Project Potential Suitable Zones for Cunninghamia lanceolata in China

 ,
,  , ,
, ,
Abstract
1. Introduction
2. Materials and Methods
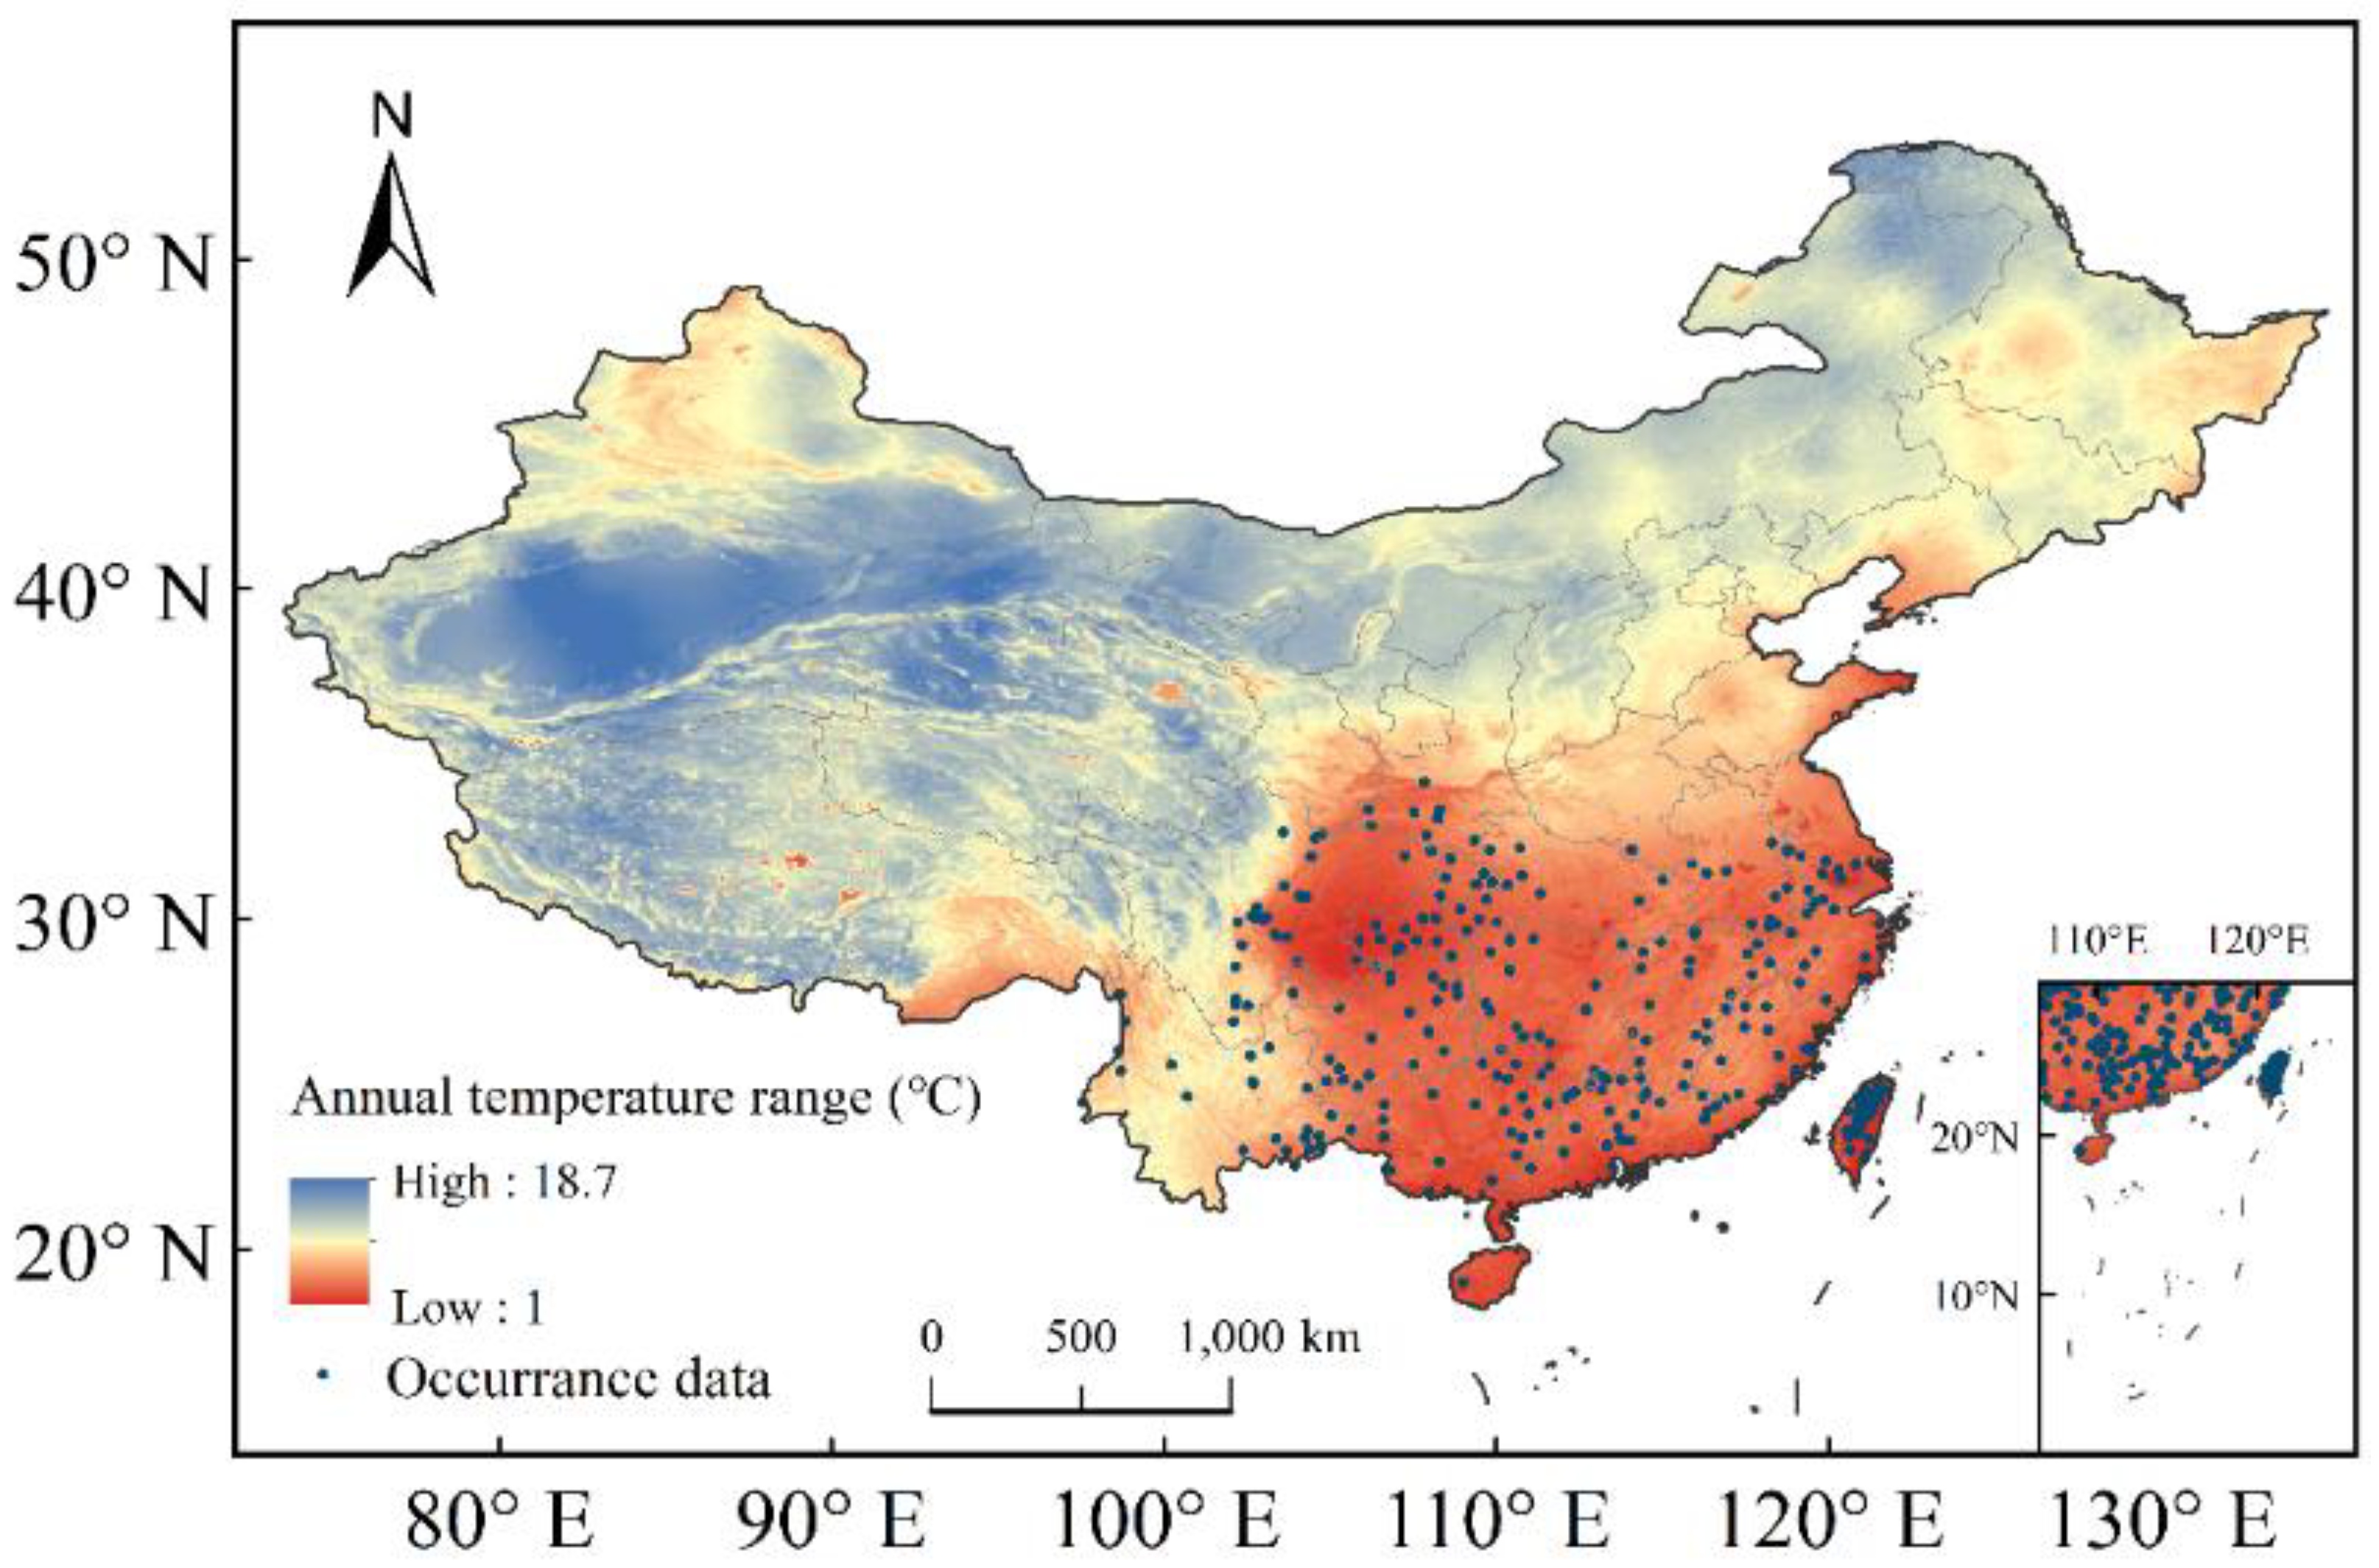
2.1. Current Species Data
2.2. Environmental Variables for Model Fitting
2.3. Environmental Variables for Model Forecasting
2.4. Land Use and Land Cover Data
2.5. MaxEnt Model Description and Modeling
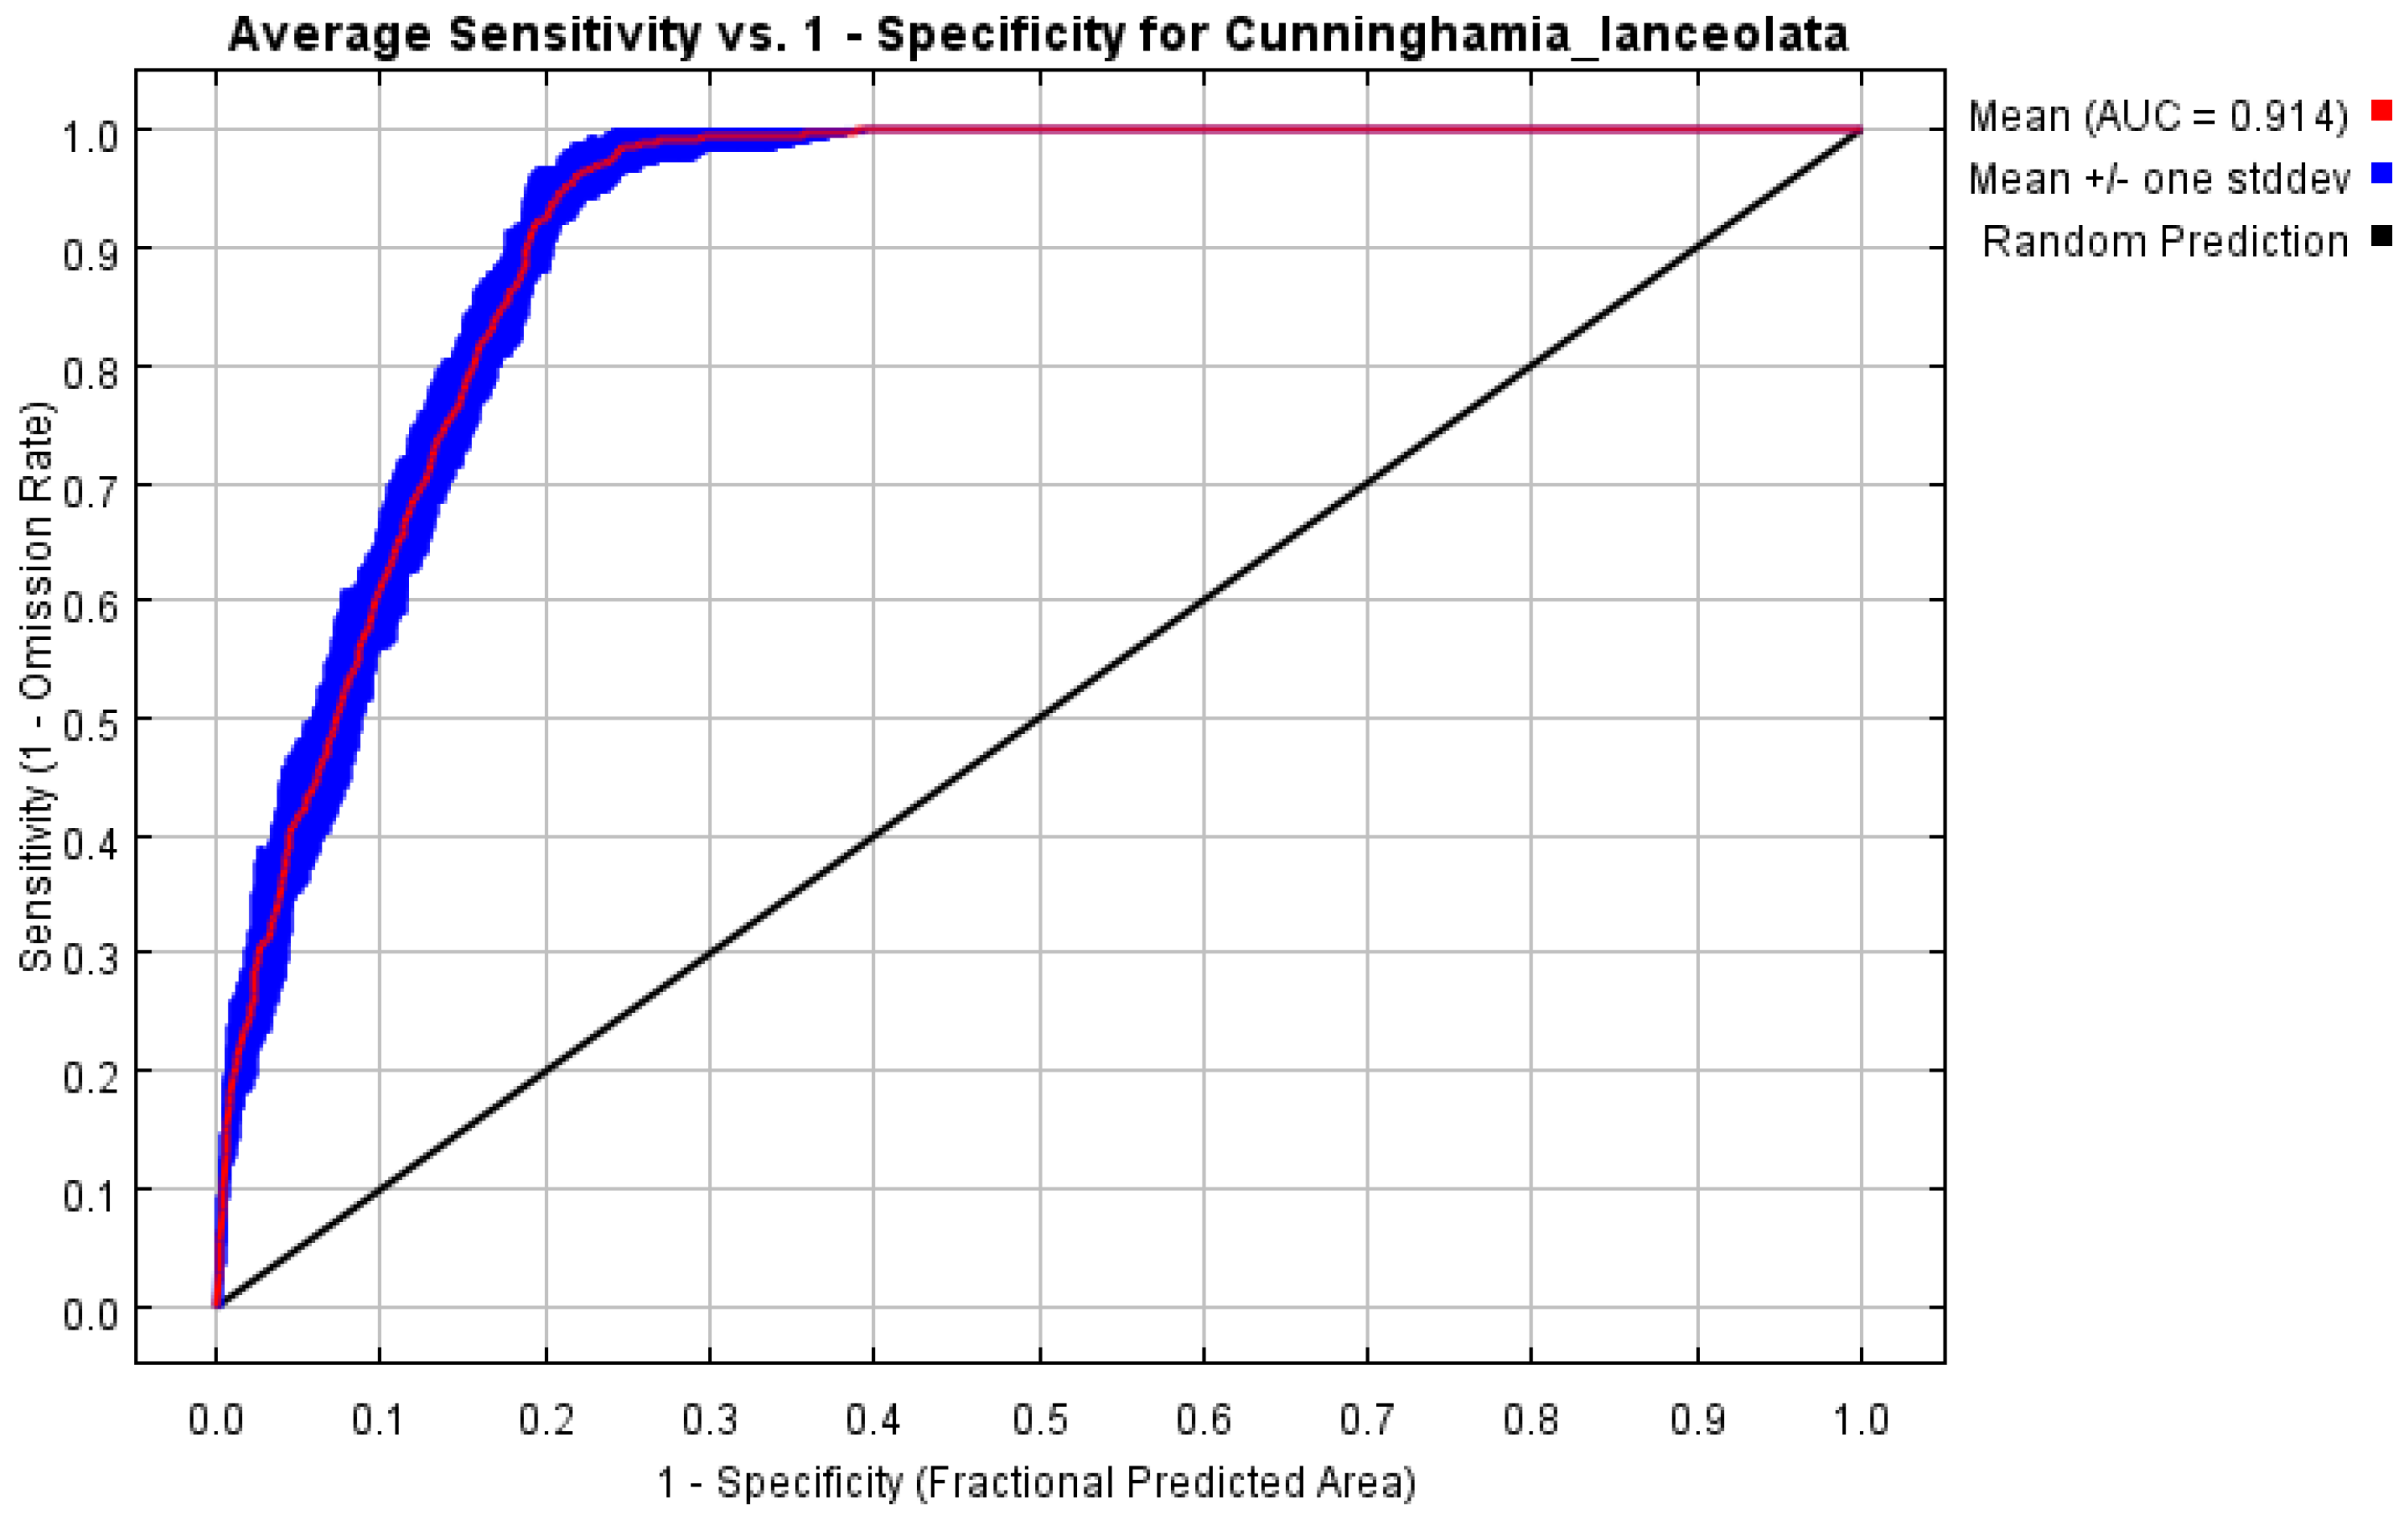
2.6. Evaluation of Model Results and Potential Habitat Classification
2.7. Identification of Planting Area with LU Data
3. Results
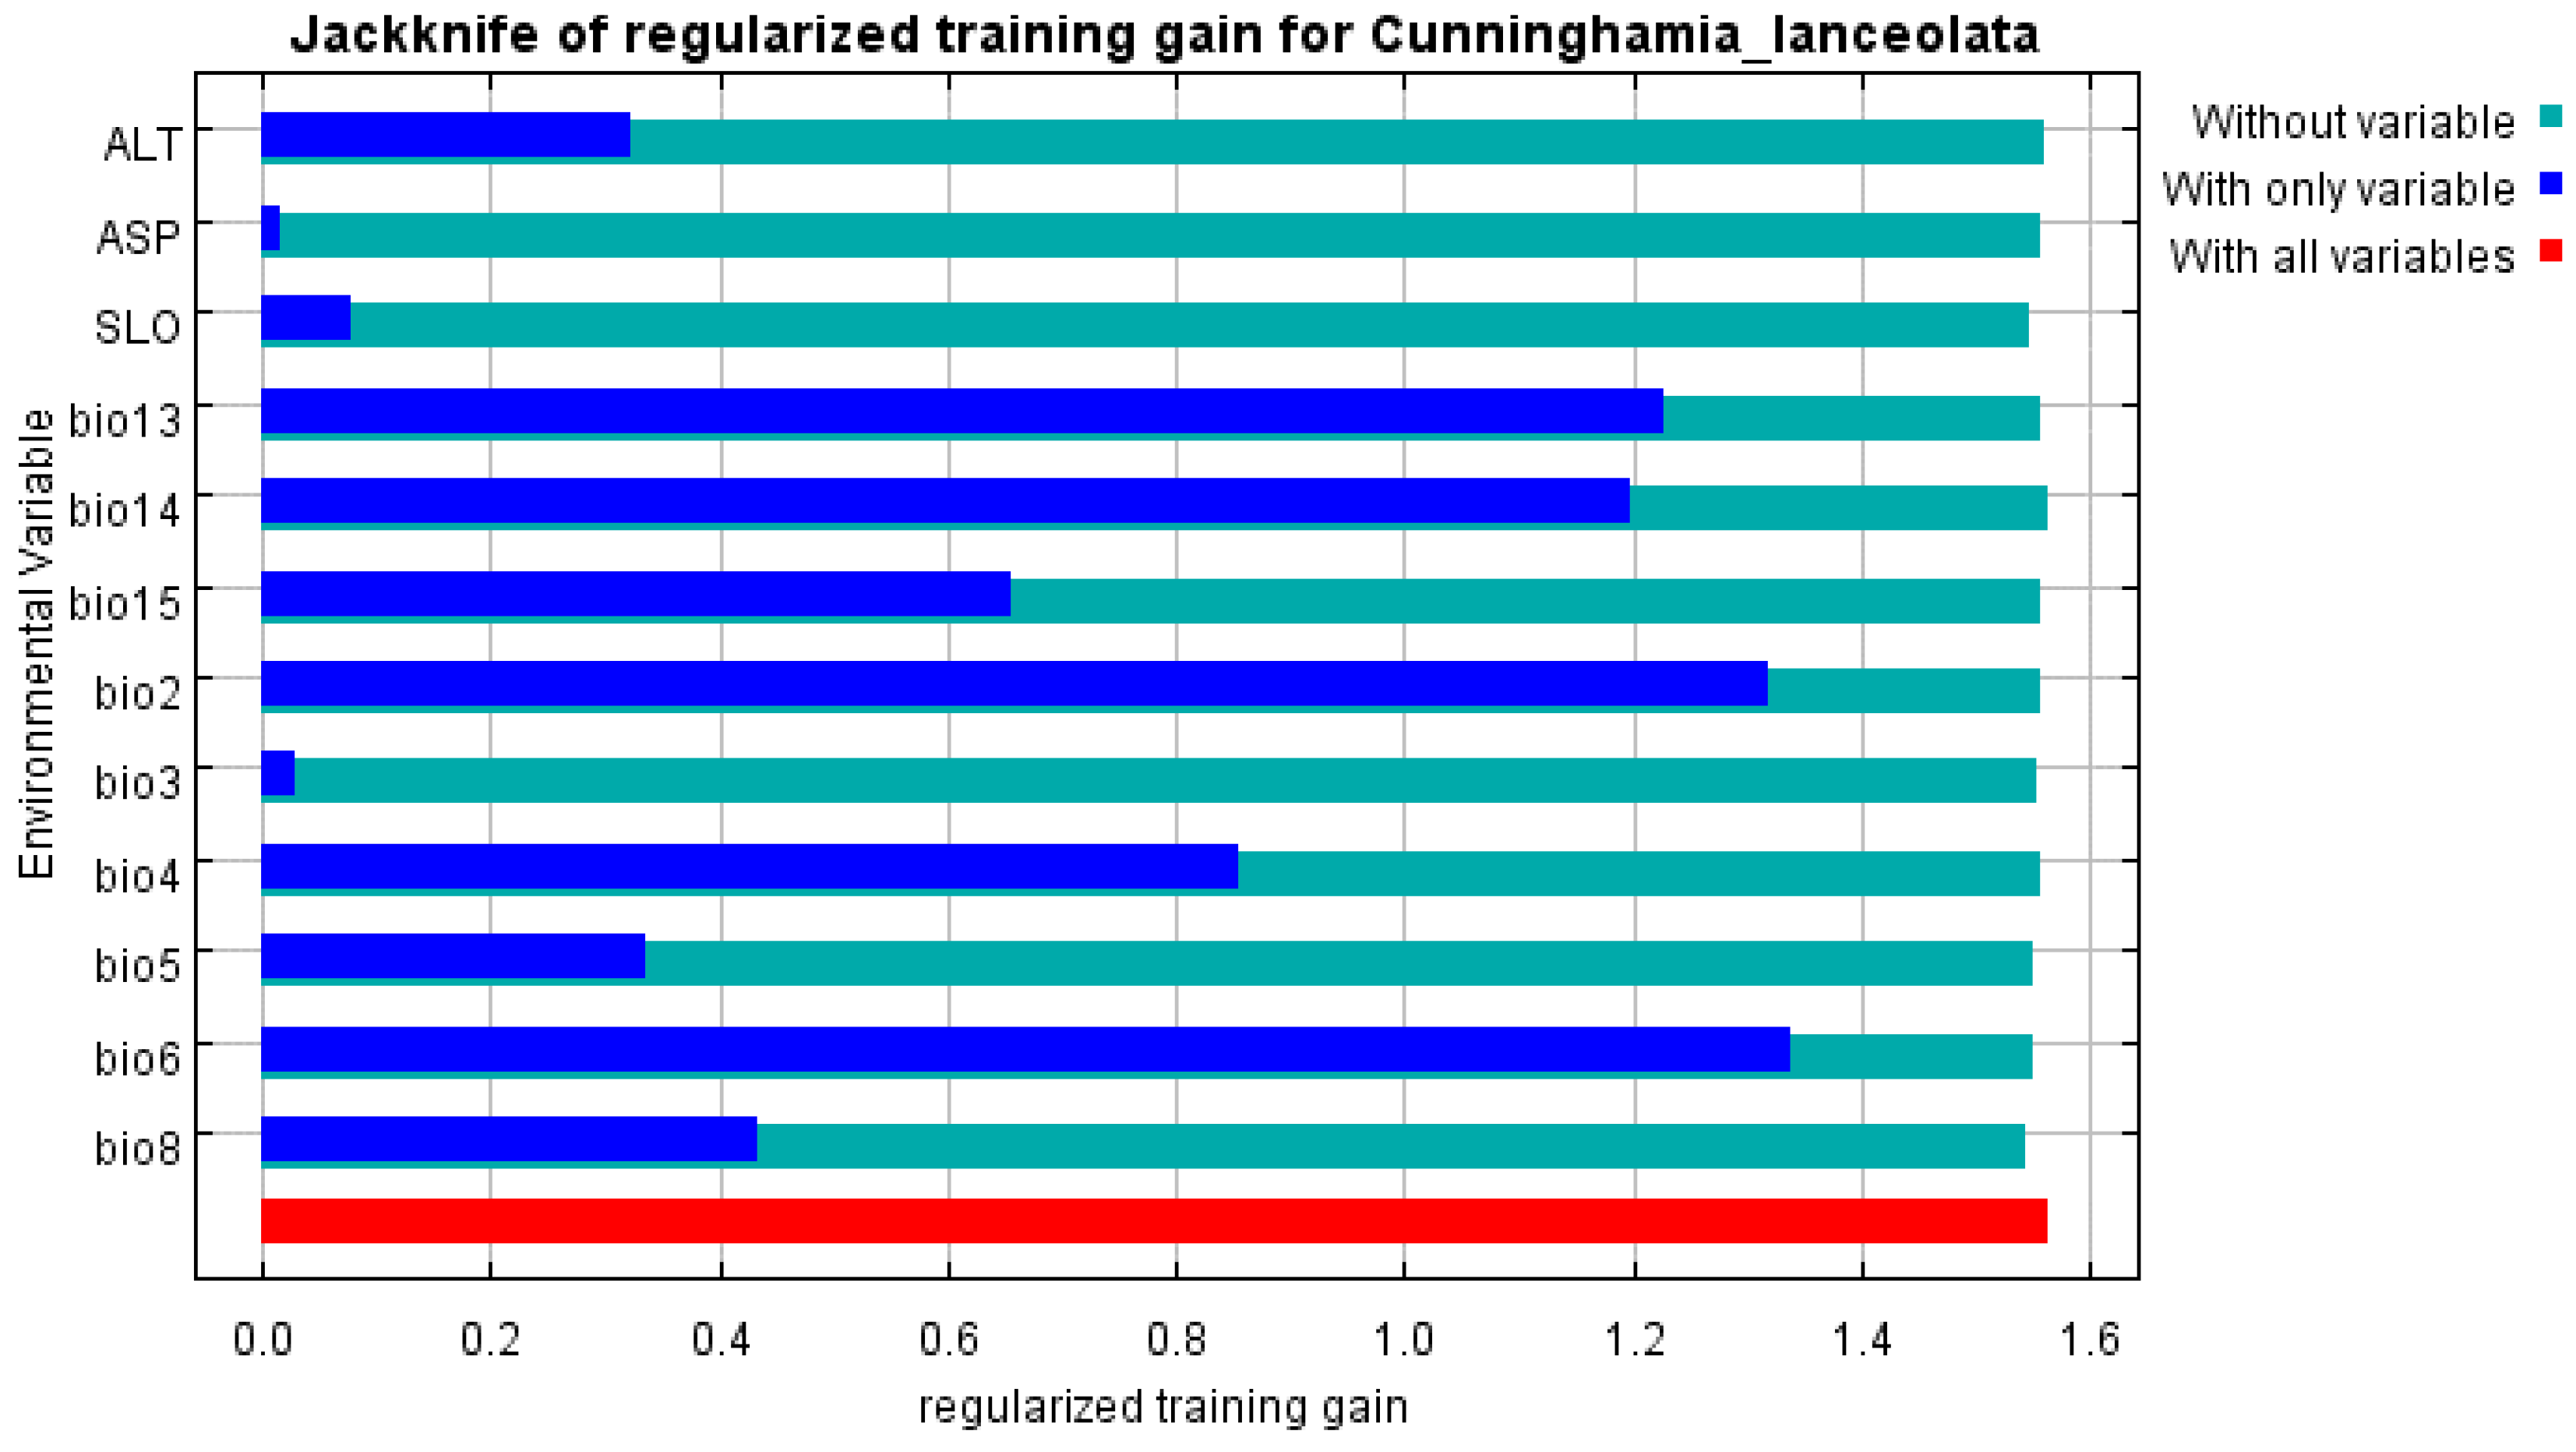
3.1. Model Evaluations and Critical Environmental Variables
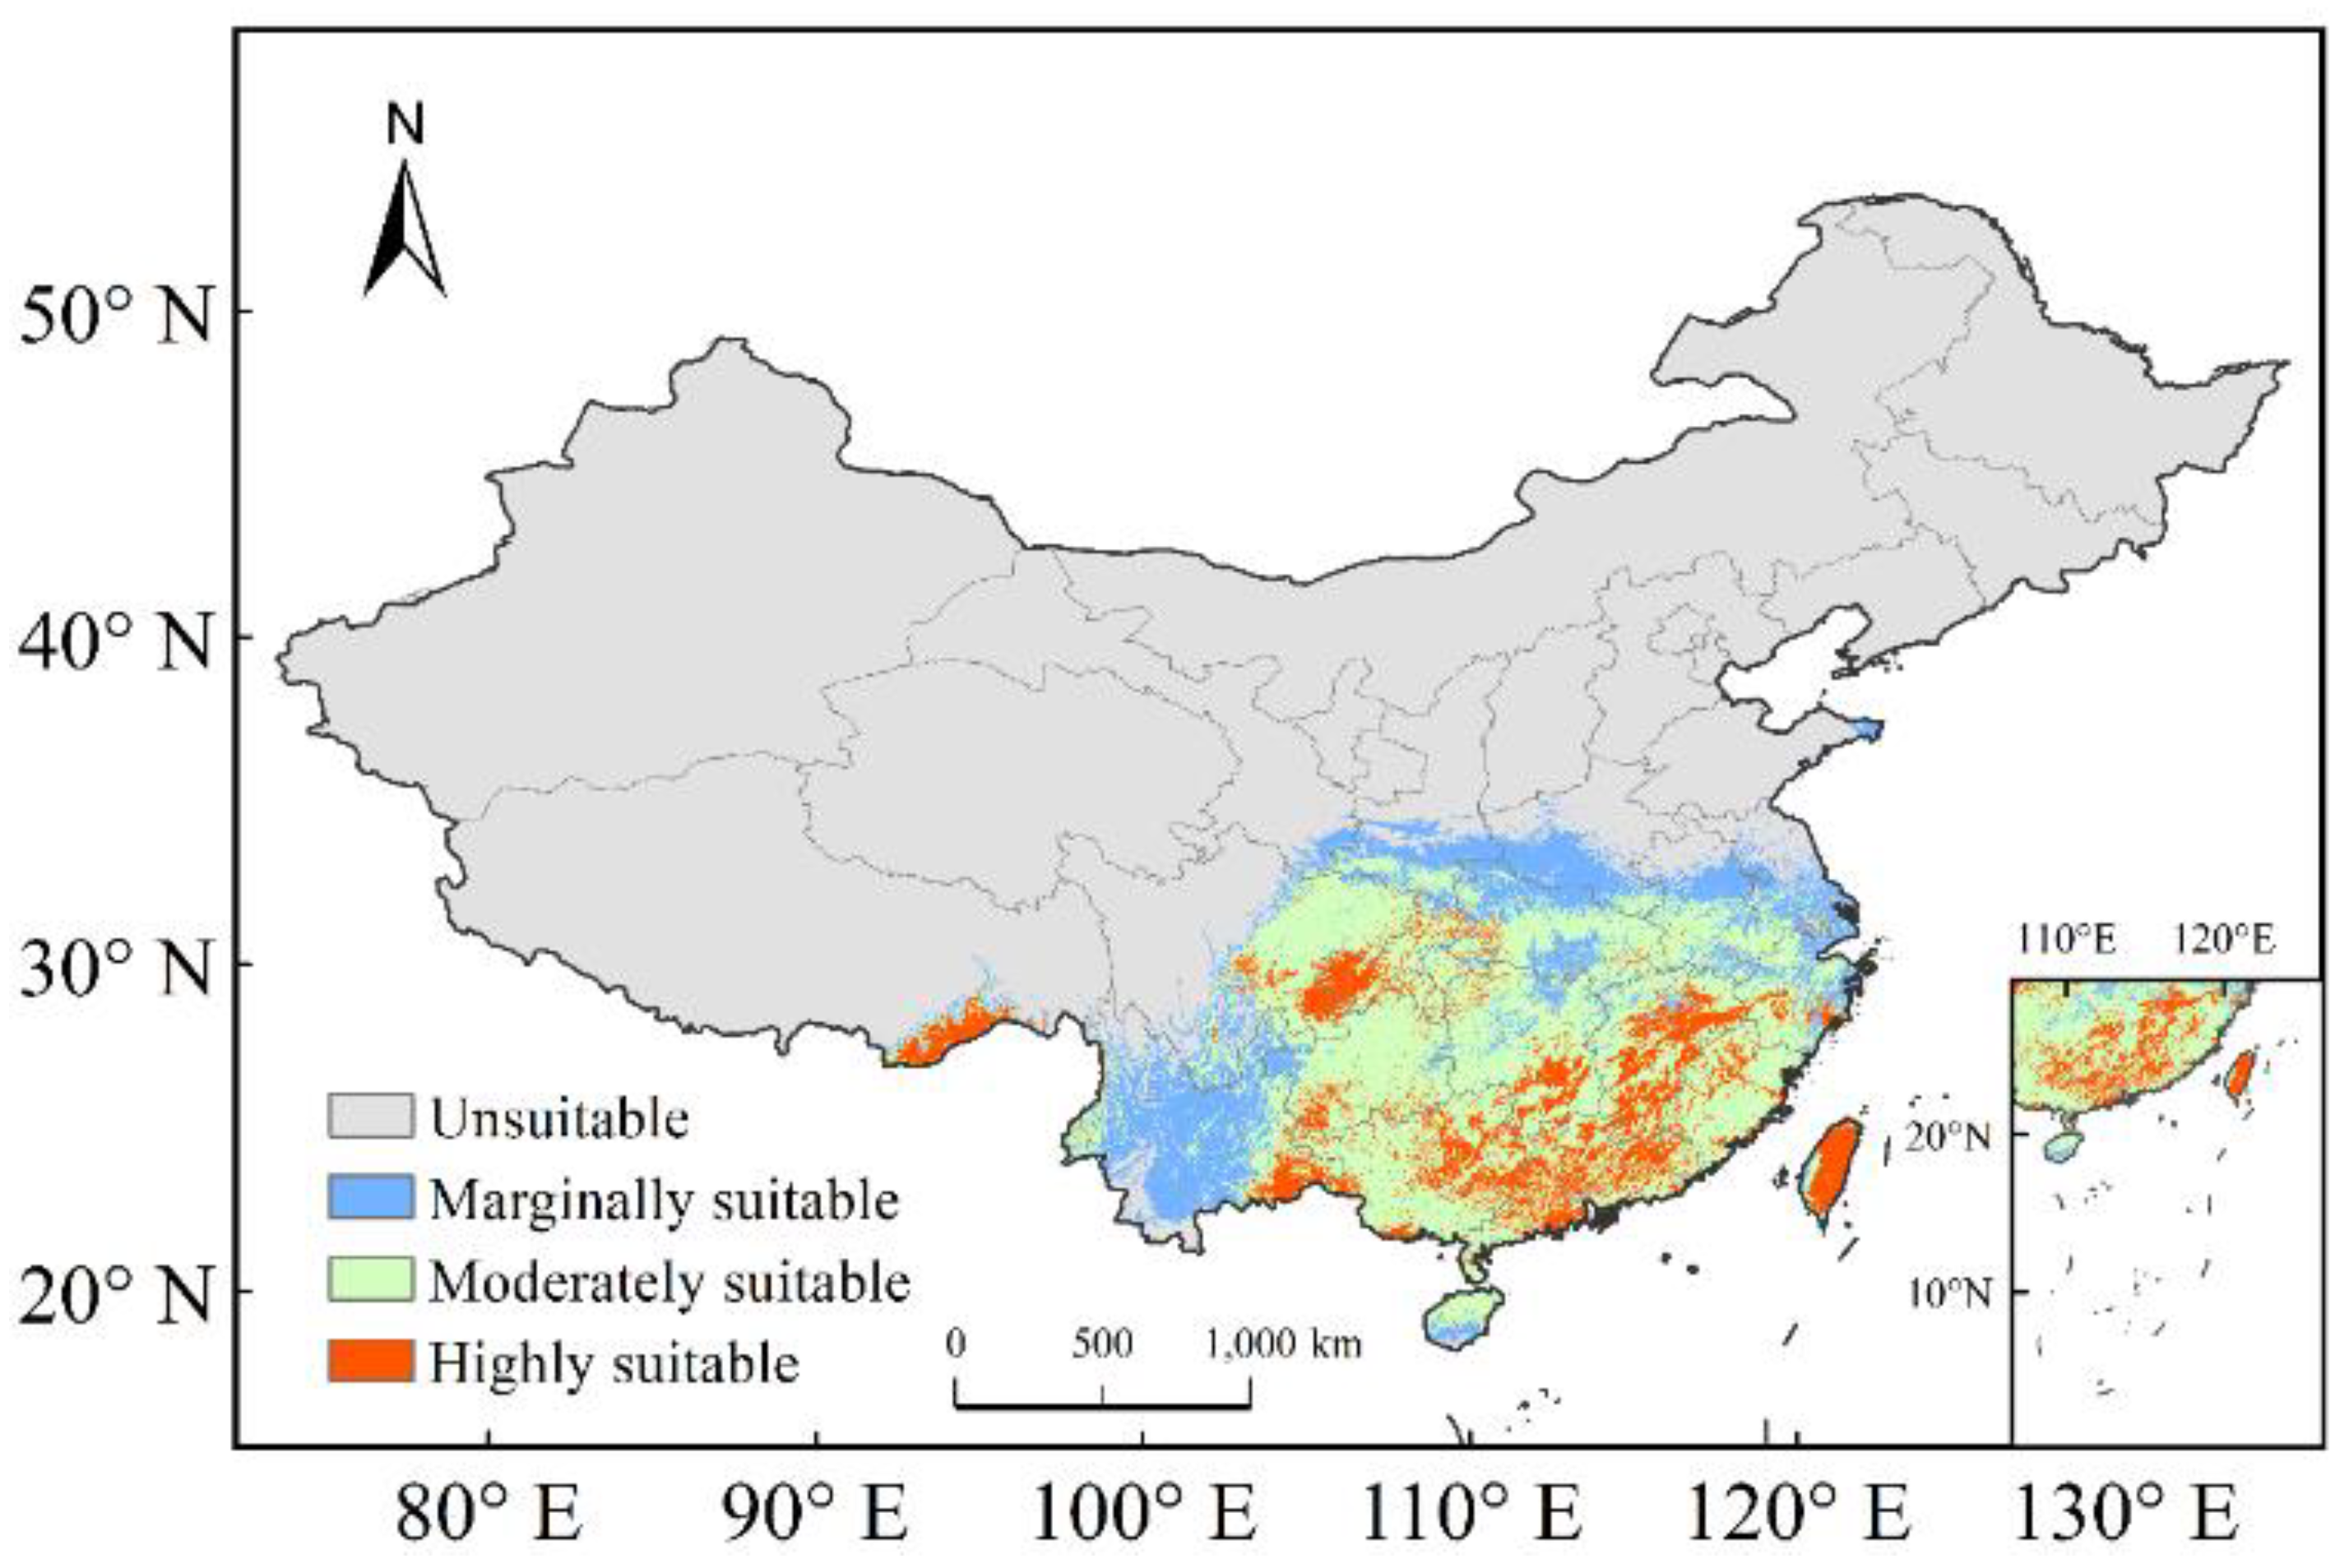
3.2. Current Potential Distribution
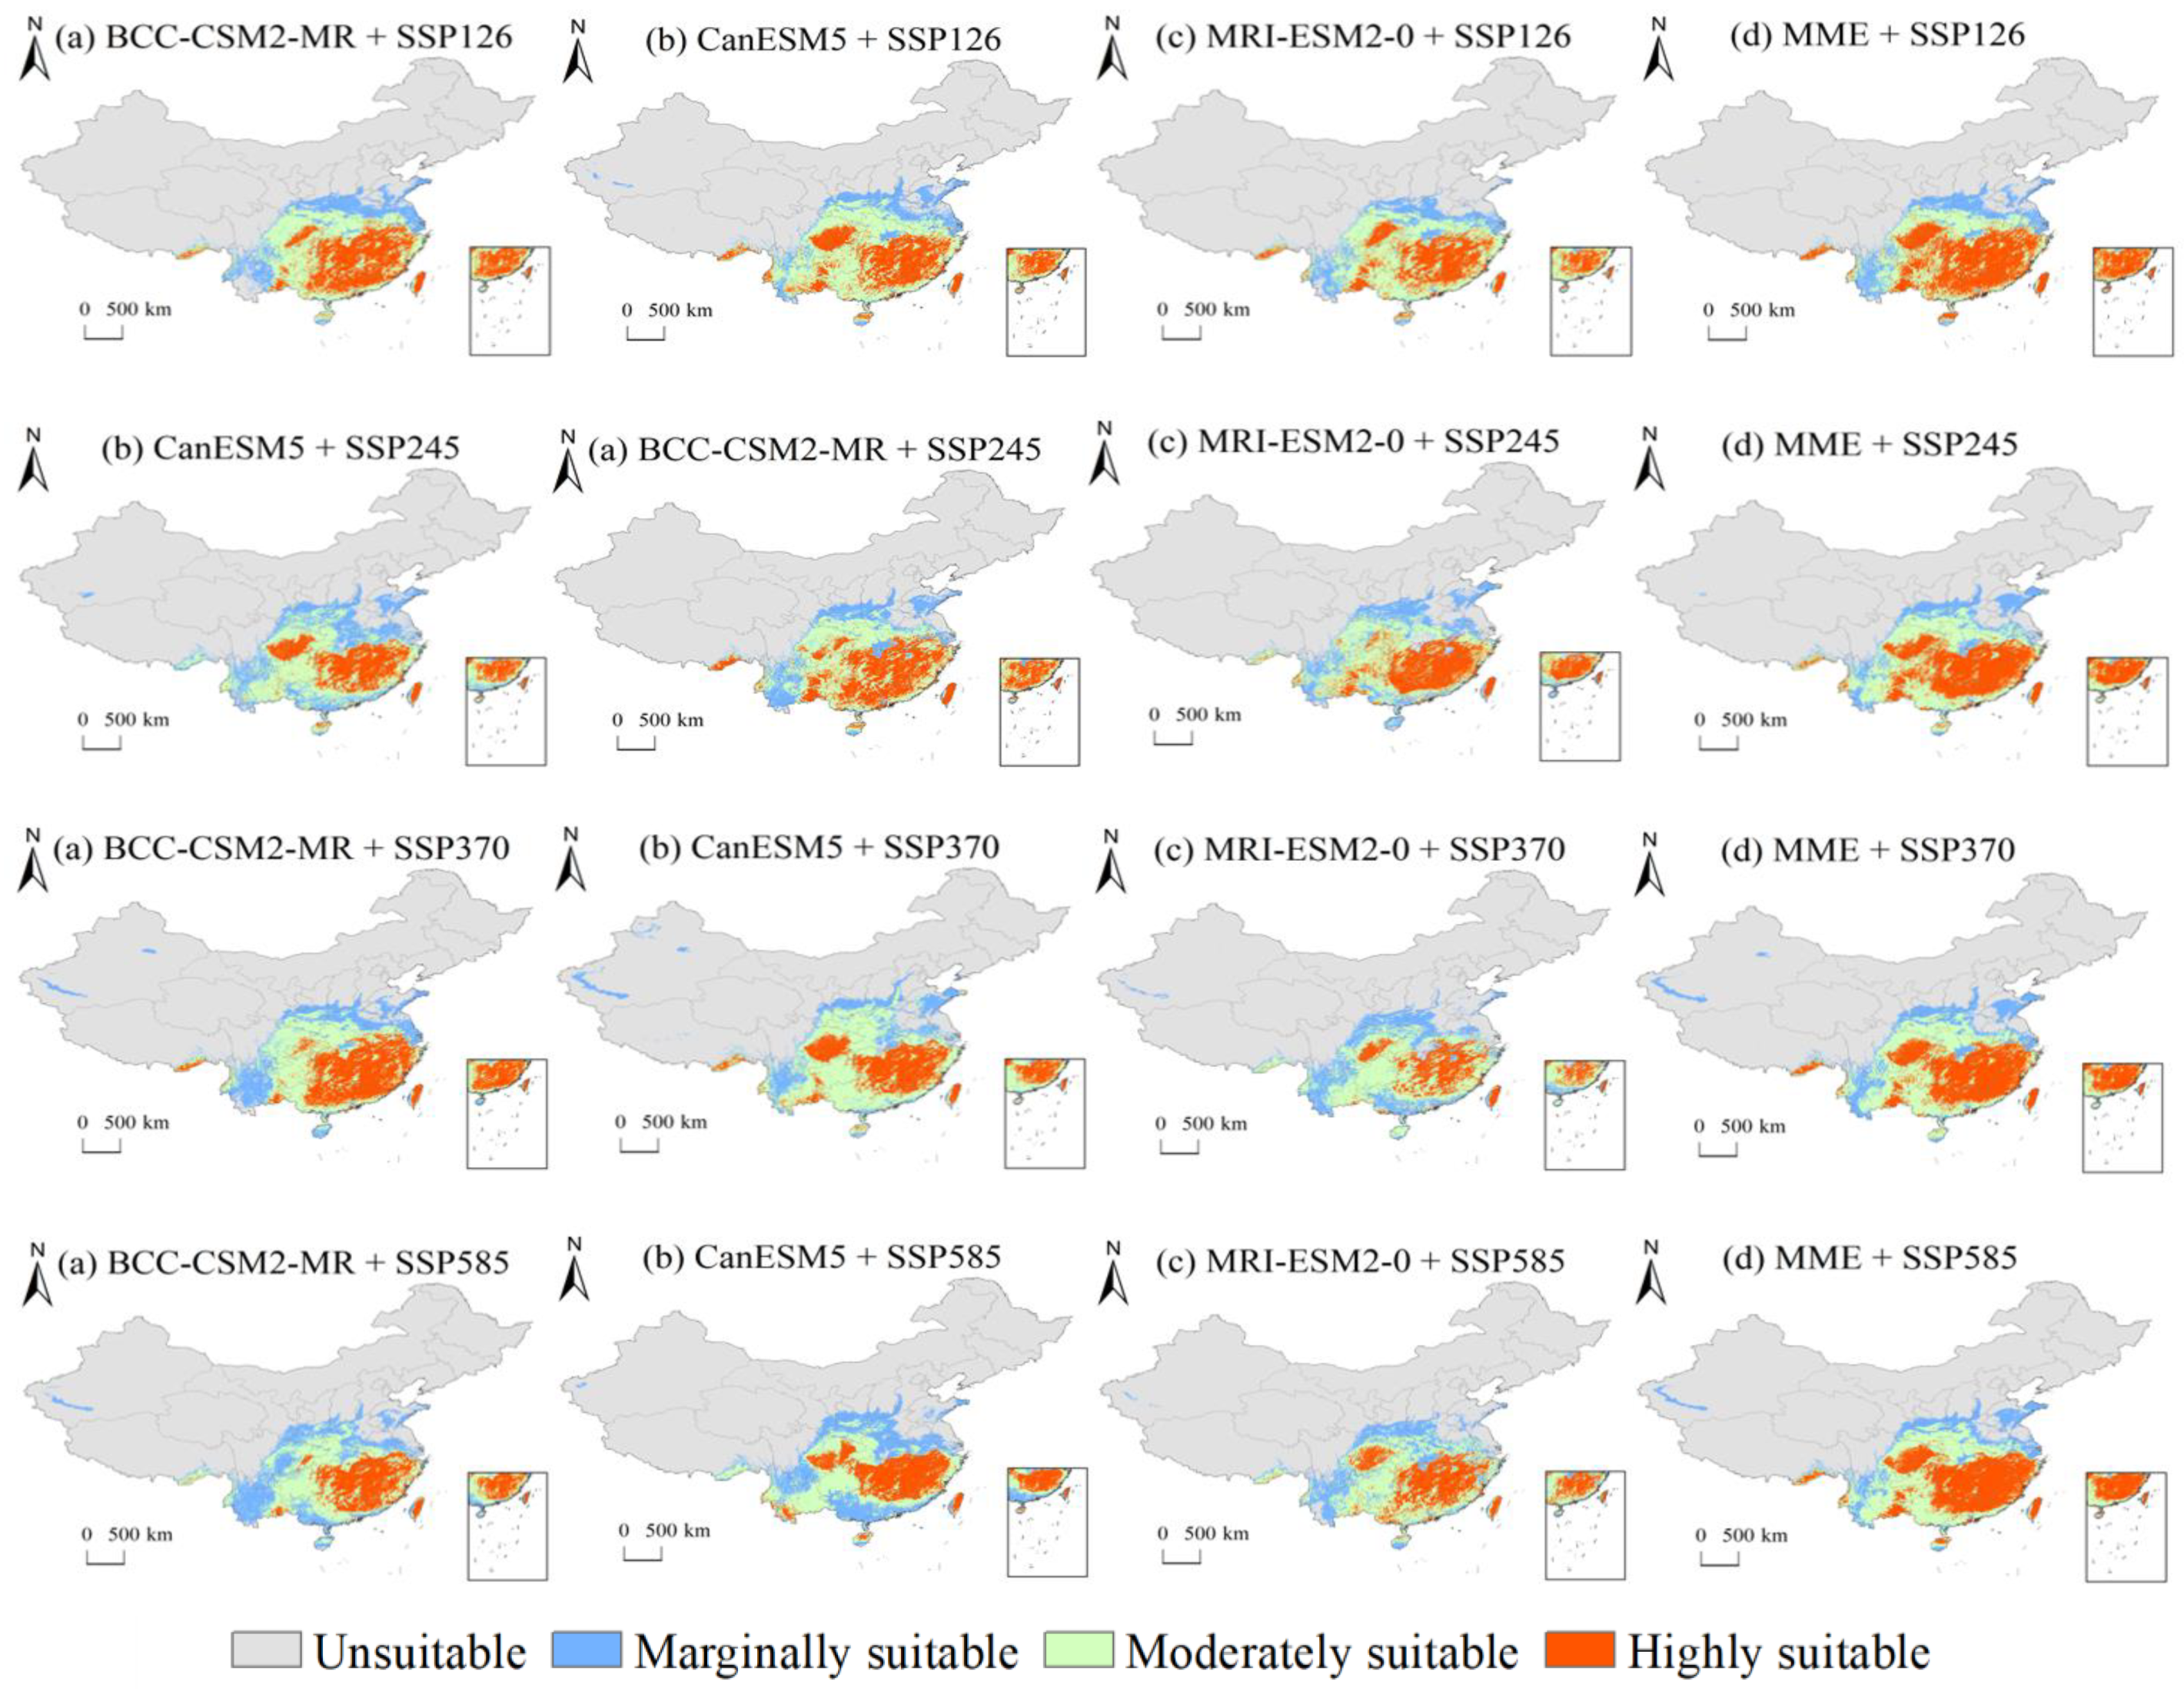
3.3. Potential Future Distribution Areas
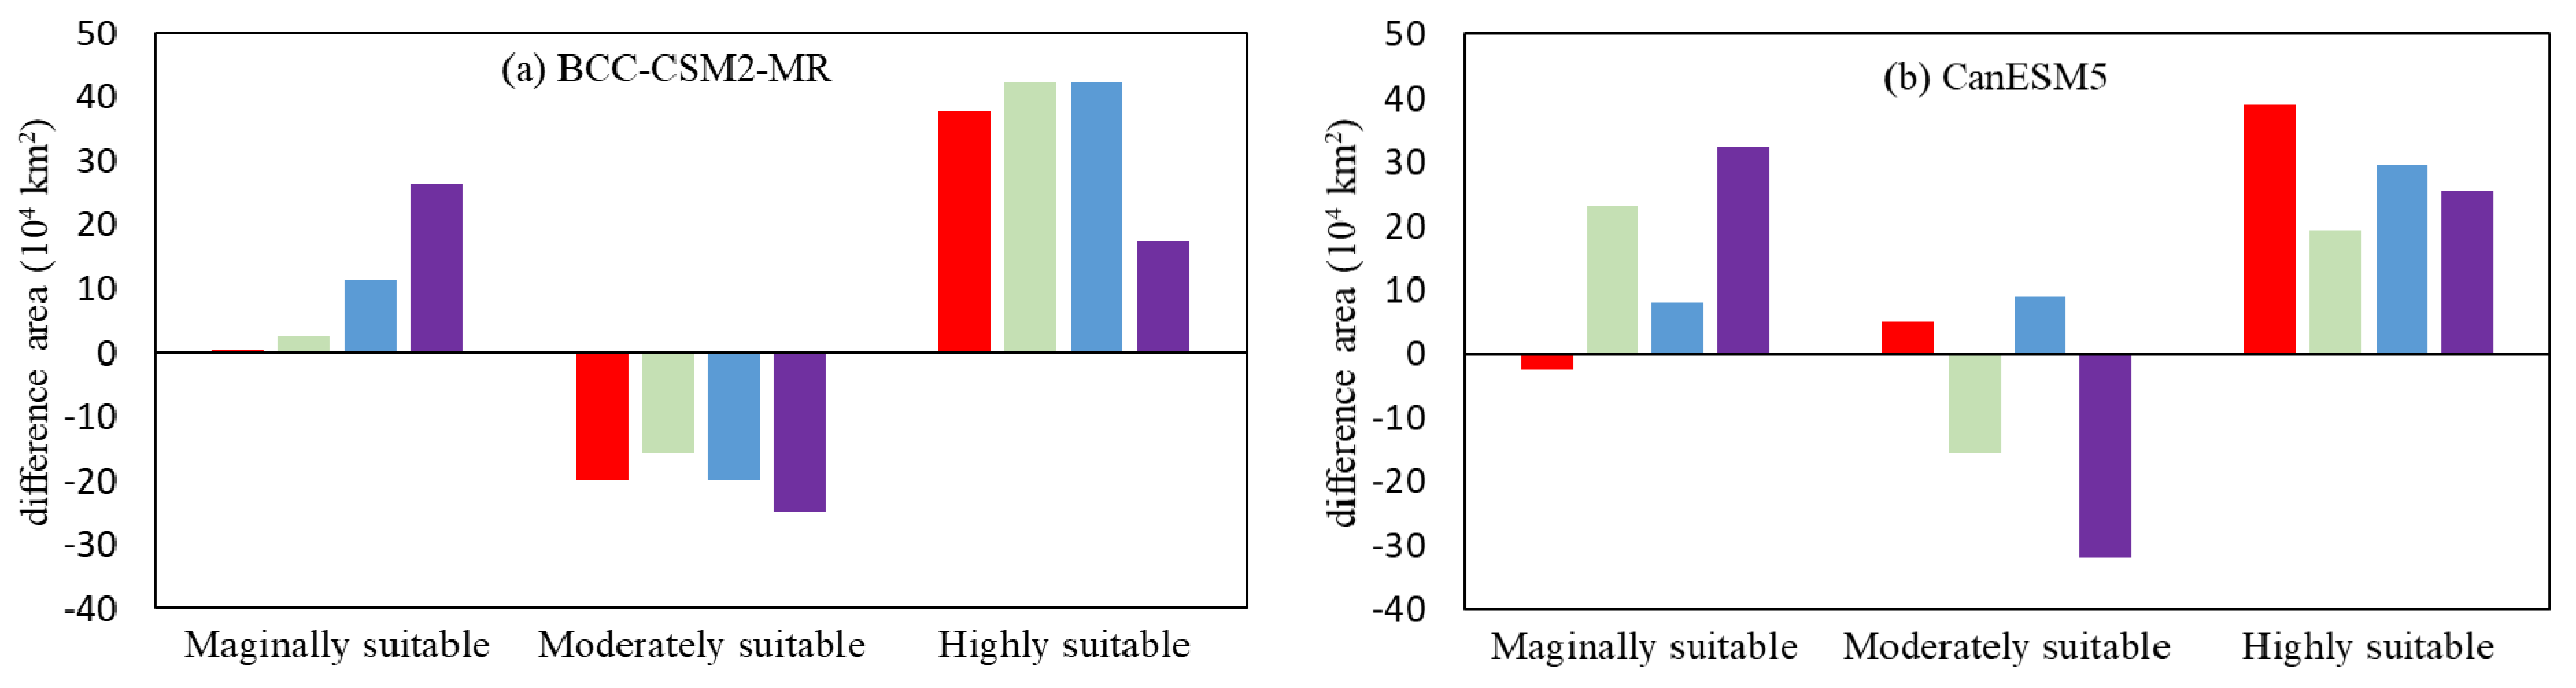
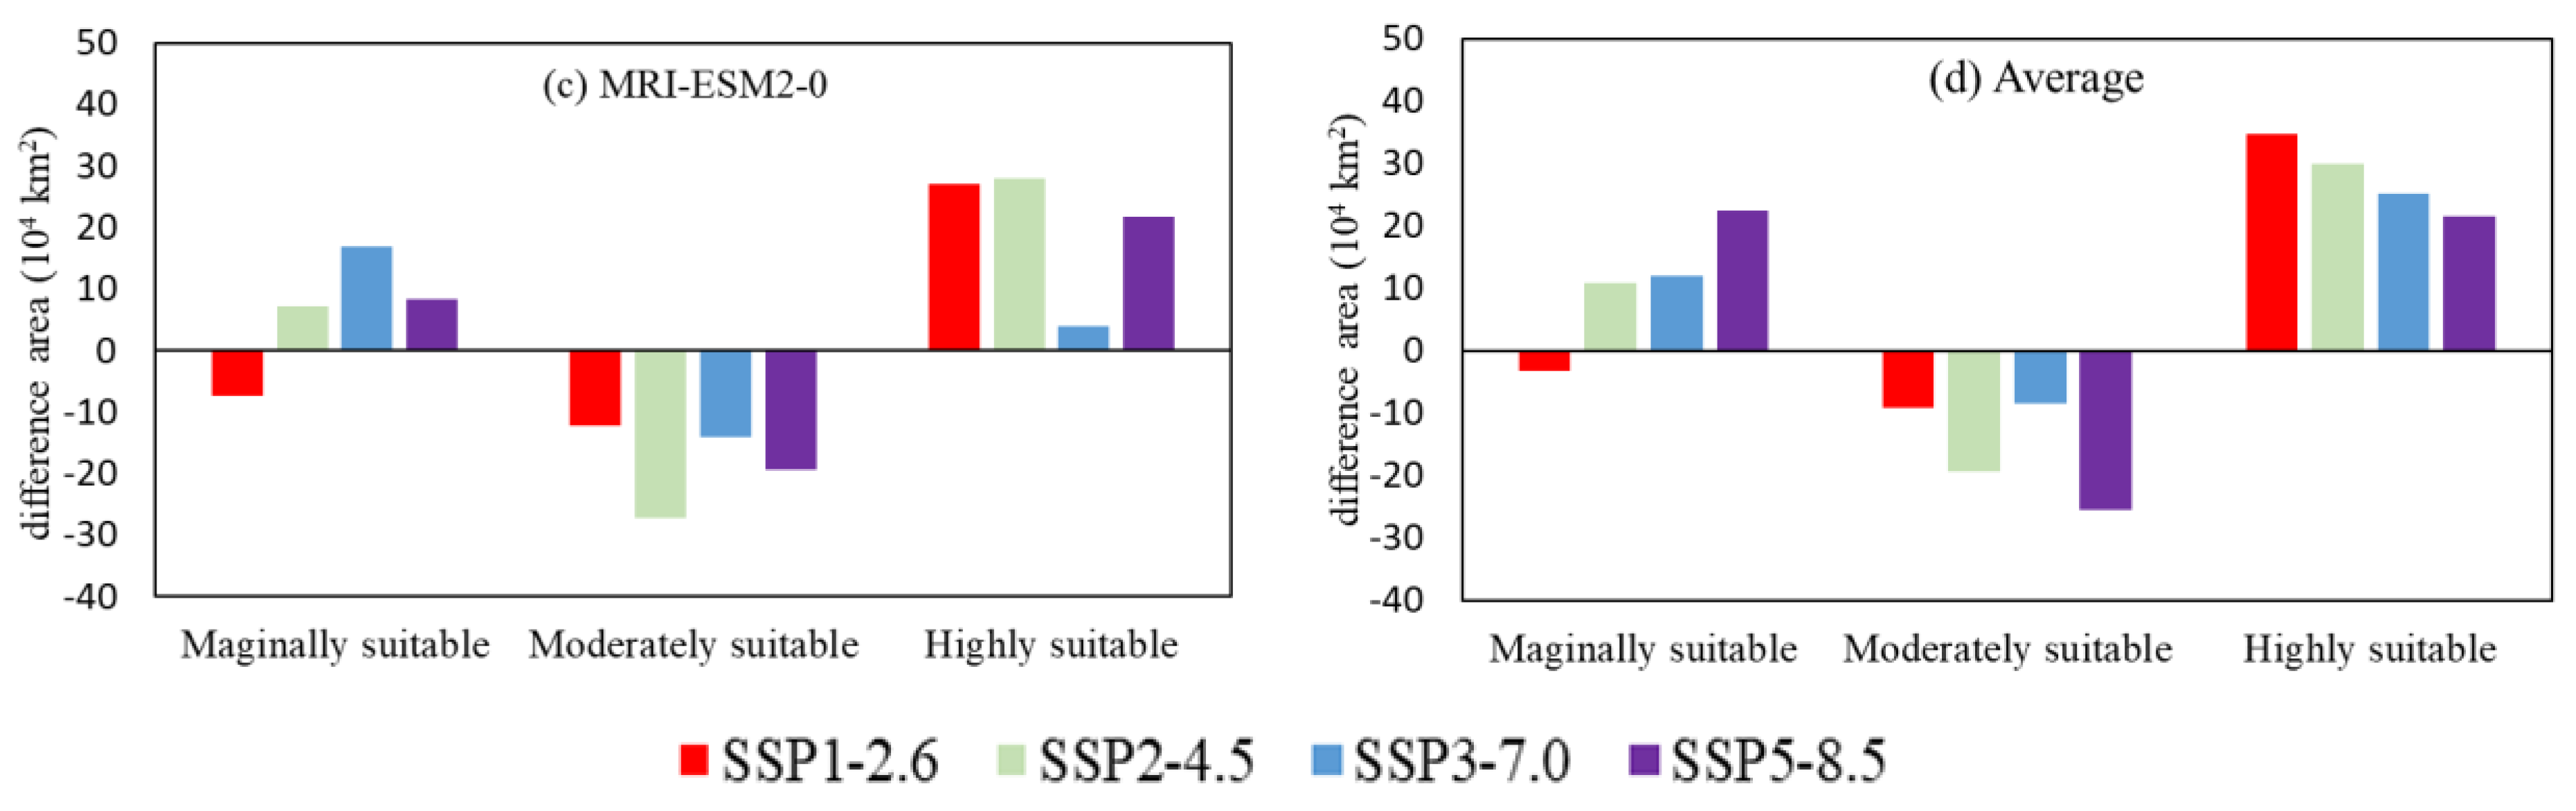
3.4. Future Changes in Suitable Habitats
3.5. Practical Available Planting in the Predicted Suitable Area
4. Discussion
5. Conclusions
- (1)
- The current potential suitable growth areas for C. lanceolata were mainly located in Southern China. The annual temperature range was the most important variable to affect the potential suitable area of C. lanceolata. The current potential highly suitable area of C. lanceolata was primarily located in areas with a low annual temperature range, which was in accordance with the existing distribution of C. lanceolata. When the annual temperature varied from 4.7–6.7 °C, the logistic output of MaxEnt was higher than 0.5, which indicated that the area was highly suitable for C. lanceolata. When the annual temperature varied from 3.30–10.60 °C, the logistic output of MaxEnt was higher than 0.1, which indicated that the area was suitable for C. lanceolata.
- (2)
- The suitable area of C. lanceolata was observed to increase in China under all SSPs scenarios from 2041–2060. The gained area was mainly located in Southwest and Eastern Shandong, Western and Southern Henan, Northern Anhui, Northern and Central Jiangsu, Southern Shanxi, and Southern Yunnan in most models under four SSPs, as the uncertainties were unavoidable for the prediction. However, the average of multiple models may effectively reduce the uncertainty and balance the prediction results. The average of multiple models revealed that the suitable area of C. lanceolata increased to 29.00 × 10⁴ km2 under SSP3-7.0, which was the largest between the four scenarios, whereas the increased area under SSP5-8.5 was the smallest between the four scenarios at 18.59 × 10⁴ km2. This result revealed that the extremely high radiative forcing had a serious negative effect on C. lanceolata. Conversely, under SSP1-2.6, which had a low radiation intensity and effective control of global temperature growth at 2 °C, the growth area of the highly suitable area was the largest, increasing by 34.61 × 10⁴ km2. The highly suitable area possessed various environmental factors that were more suitable for the growth of C. lanceolata, which cultivated higher quality trees, a faster growth rate, and higher timber yields. Consequently, the increased highly suitable area of C. lanceolata under SSP1-2.6 had important economic and ecological value, which could not be ignored. As described above, the suitable area and yield of C. lanceolata were greatly increased under the SSP1-2.6 and SSP3-7.0 in different ways.
- (3)
- The LUCC data were reclassified into four categories: farmland, bare land, forest land, and grassland. In view of China’s arable land protection red line policy, the bare land, woodland, and grassland might be potentially available for the planting of C. lanceolata in the future. When the predictions were combined with the reclassified land use data, the result showed that the average practical available area for C. lanceolata would be approximately 61.76% of the predicted suitable area. However, with the further promotion of the policy of returning farmland to forests in China, progressively more grain plots would be returned to forestry and public awareness of forest protection would be enhanced. The practical available planting area and distribution of C. lanceolata in China will increase significantly in the future.
Author Contributions
Funding
Data Availability Statement
Conflicts of Interest
Appendix A

| Type | Variable | Description | Source | Unit |
|---|---|---|---|---|
| Bioclimatic Variables | bio01 | Annual mean temperature | WorldClim | °C |
| bio02 | Mean diurnal range (mean of monthly (max temp-min temp)) | WorldClim | °C | |
| bio03 | Isothermality (bio2/bio7) (*100) | WorldClim | - | |
| bio04 | Temperature seasonality (standard deviation*100) | WorldClim | °C | |
| bio05 | Max temperature of warmest month | WorldClim | °C | |
| bio06 | Min temperature of coldest month | WorldClim | °C | |
| bio07 | Temperature annual range (bio5–bio6) | WorldClim | °C | |
| bio08 | Mean temperature of wettest quarter | WorldClim | °C | |
| bio09 | Mean temperature of driest quarter | WorldClim | °C | |
| bio10 | Mean temperature of warmest quarter | WorldClim | °C | |
| bio11 | Mean temperature of coldest quarter | WorldClim | °C | |
| bio12 | Annual precipitation | WorldClim | mm | |
| bio13 | Precipitation of wettest month | WorldClim | mm | |
| bio14 | Precipitation of driest month | WorldClim | mm | |
| bio15 | Precipitation seasonality (coefficient of variation) | WorldClim | 1 | |
| bio16 | Precipitation of wettest quarter | WorldClim | mm | |
| bio17 | Precipitation of driest quarter | WorldClim | mm | |
| bio18 | Precipitation of warmest quarter | WorldClim | mm | |
| bio19 | Precipitation of coldest quarter | WorldClim | mm | |
| Topographic Variable | ALT | Altitude | WorldClim | m |
| SLO | Slope | Derived from ALT | % | |
| ASP | Aspect | Derived from ALT | ° |
| Variables | ASP | ALT | SLO | Bio2 | Bio3 | Bio4 | Bio5 | Bio6 | Bio8 | Bio13 | Bio14 | Bio15 |
|---|---|---|---|---|---|---|---|---|---|---|---|---|
| ASP | 1 | |||||||||||
| ALT | 0.184 ** | 1 | ||||||||||
| SLO | 0.201 ** | 0.498 ** | 1 | |||||||||
| bio2 | 0.082 * | 0.311 ** | −0.038 | 1 | ||||||||
| bio3 | 0.200 ** | 0.602 ** | 0.117 ** | 0.488 ** | 1 | |||||||
| bio4 | −0.149 ** | −0.474 ** | −0.194 ** | 0.223 ** | −0.687 ** | 1 | ||||||
| bio5 | −0.068 * | −0.766 ** | −0.417 ** | 0.138 ** | −0.328 ** | 0.622 ** | 1 | |||||
| bio6 | 0.071 * | −0.248 ** | −0.166 ** | −0.436 ** | 0.349 ** | −0.653 ** | 0.134 ** | 1 | ||||
| bio8 | −0.083 * | −0.610 ** | −0.353 ** | 0.038 | −0.058 | 0.282 ** | 0.748 ** | 0.352 ** | 1 | |||
| bio13 | 0.023 | 0.013 | 0.086 * | −0.458 ** | 0.283 ** | −0.559 ** | −0.106 ** | 0.677 ** | 0.063 | 1 | ||
| bio14 | −0.023 | −0.299 ** | −0.056 | −0.481 ** | −0.198 ** | −0.077 * | 0.165 ** | 0.374 ** | 0.027 | 0.437 ** | 1 | |
| bio15 | 0.055 | 0.455 ** | 0.181 ** | 0.369 ** | 0.569 ** | −0.327 ** | −0.216 ** | 0.071 * | 0.080 * | 0.209 ** | −0.619 ** | 1 |
References
- Smeraldo, S.; Bosso, L.; Salinas-Ramos, V.B.; Ancillotto, L.; Sánchez-Cordero, V.; Gazaryan, S.; Russo, D. Generalists yet different: Distributional responses to climate change may vary in opportunistic bat species sharing similar ecological traits. Mammal. Rev. 2021. [Google Scholar] [CrossRef]
- Vermeiren, P.; Reichert, P.; Schuwirth, N. Integrating uncertain prior knowledge regarding ecological preferences into multi-species distribution models: Effects of model complexity on predictive performance. Ecol. Model. 2020, 420, 1–15. [Google Scholar] [CrossRef]
- Scholze, M.; Knorr, W.; Nigel, W.A.; Prentice, I.C. A climate-change risk analysis for world ecosystems. Proc. Natl. Acad. Sci. USA 2006, 103, 13116–13120. [Google Scholar] [CrossRef] [PubMed]
- Chalghaf, B.; Chlif, S.; Mayala, B.; Ghawar, W.; Bettaieb, J.; Harrabi, M.; Benie, G.B.; Michael, E.; Salah, A.B. Ecological Niche Modeling for the Prediction of the Geographic Distribution of Cutaneous Leishmaniasis in Tunisia. Am. J. Trop. Med. Hyg. 2016, 94, 844–851. [Google Scholar] [CrossRef] [PubMed]
- Lindner, M.; Maroschek, M.; Netherer, S.; Kremer, A.; Barbati, A.; Garcia-Gonzalo, J.; Seidl, R.; Delzon, S.; Corona, P.; Kolström, M.; et al. Climate change impacts, adaptive capacity, and vulnerability of European forest ecosystems. For. Ecol. Manag. 2010, 259, 698–709. [Google Scholar] [CrossRef]
- Hamidreza, K.; Winfried, V. Potential impacts of climate and landscape fragmentation changes on plant distributions: Coupling multi-temporal satellite imagery with GIS-based cellular automata model. Ecol. Inform. 2016, 32, 145–155. [Google Scholar] [CrossRef]
- Zhang, K.; Yao, L.; Meng, J.; Tao, J. Maxent modeling for predicting the potential geographical distribution of two peony species under climate change. Sci. Total Environ. 2018, 634, 1326–1334. [Google Scholar] [CrossRef] [PubMed]
- Su, B.; Huang, J.; Mondal, S.K.; Zhai, J.; Wang, Y.; Wen, S.; Gao, M.; Lv, Y.; Jiang, S.; Jiang, T.; et al. Insight from CMIP6 SSP-RCP scenarios for future drought characteristics in China. Atmos. Res. 2021, 250. [Google Scholar] [CrossRef]
- Taylor, K.E.; Stouffer, R.J.; Meehl, G.A. An Overview of CMIP5 and the Experiment Design. Bull. Am. Meteorol. Soc. 2012, 93, 485–498. [Google Scholar] [CrossRef]
- Tebaldi, C.; Debeire, K.; Eyring, V.; Fischer, E.; Fyfe, J.; Friedlingstein, P.; Knutti, R.; Lowe, J.; O’Neill, B.; Sanderson, B.; et al. Climate model projections from the Scenario Model Intercomparison Project (ScenarioMIP) of CMIP6. Earth Syst. Dyn. 2021, 12, 253–293. [Google Scholar] [CrossRef]
- Raffini, F.; Bertorelle, G.; Biello, R.; D’Urso, G.; Russo, D.; Bosso, L. From Nucleotides to Satellite Imagery: Approaches to Identify and Manage the Invasive Pathogen Xylella fastidiosa and Its Insect Vectors in Europe. Sustainability 2020, 12, 4508. [Google Scholar] [CrossRef]
- Martínez-Minaya, J.; Cameletti, M.; Conesa, D.; Pennino, M.G. Species distribution modeling: A statistical review with focus in spatio-temporal issues. Stoch. Environ. Res. Risk Assess. 2018, 32, 3227–3244. [Google Scholar] [CrossRef]
- Noma, H.; Nagashima, K.; Kato, S.; Teramukai, S.; Furukawa, T.A. Meta-analysis using flexible random-effects distribution models. J. Epidemiol. 2021. [Google Scholar] [CrossRef] [PubMed]
- Xue, Y.; Guan, L.; Tanaka, K.; Li, Z.; Chen, Y.; Ren, Y. Evaluating effects of rescaling and weighting data on habitat suitability modeling. Fish. Res. 2017, 188, 84–94. [Google Scholar] [CrossRef]
- Lecocq, T.; Harpke, A.; Rasmont, P.; Schweiger, O.; Bolliger, J. Integrating intraspecific differentiation in species distribution models: Consequences on projections of current and future climatically suitable areas of species. Divers. Distrib. 2019, 25, 1088–1100. [Google Scholar] [CrossRef]
- Jiang, Z. Spatial Structured Prediction Models: Applications, Challenges, and Techniques. IEEE Access 2020, 8, 38714–38727. [Google Scholar] [CrossRef]
- Bradie, J.; Leung, B. A quantitative synthesis of the importance of variables used in MaxEnt species distribution models. J. Biogeogr. 2017, 44, 1344–1361. [Google Scholar] [CrossRef]
- Elith, J.; Phillips, S.J.; Hastie, T.; Dudík, M.; Chee, Y.E.; Yates, C.J. A statistical explanation of MaxEnt for ecologists. Divers. Distrib. 2011, 17, 43–57. [Google Scholar] [CrossRef]
- Jackson, C.R.; Robertson, M.P. Predicting the potential distribution of an endangered cryptic subterranean mammal from few occurrence records. J. Nat. Conserv. 2011, 19, 87–94. [Google Scholar] [CrossRef]
- Kalboussi, M.; Achour, H. Modelling the spatial distribution of snake species in northwestern Tunisia using maximum entropy (Maxent) and Geographic Information System (GIS). J. For. Res. 2017, 29, 233–245. [Google Scholar] [CrossRef]
- Mitchell, P.J.; Monk, J.; Laurenson, L.; Chisholm, R. Sensitivity of fine-scale species distribution models to locational uncertainty in occurrence data across multiple sample sizes. Methods Ecol. Evol. 2016, 8, 12–21. [Google Scholar] [CrossRef]
- Préau, C.; Isselin-Nondedeu, F.; Sellier, Y.; Bertrand, R.; Grandjean, F. Predicting suitable habitats of four range margin amphibians under climate and land-use changes in southwestern France. Reg. Environ. Chang. 2018, 19, 27–38. [Google Scholar] [CrossRef]
- Kaky, E.; Gilbert, F. Using species distribution models to assess the importance of Egypt’s protected areas for the conservation of medicinal plants. J. Arid Environ. 2016, 135, 140–146. [Google Scholar] [CrossRef]
- Hasui, É.; Silva, V.X.; Cunha, R.G.T.; Ramos, F.N.; Ribeiro, M.C.; Sacramento, M.; Coelho, M.T.P.; Pereira, D.G.S.; Ribeiro, B.R. Additions of landscape metrics improve predictions of occurrence of species distribution models. J. For. Res. 2017, 28, 963–974. [Google Scholar] [CrossRef]
- Fitzpatrick, M.C.; Gotelli, N.J.; Ellison, A.M. MaxEnt versus MaxLike: Empirical comparisons with ant species distributions. Ecosphere 2013, 4. [Google Scholar] [CrossRef]
- Fourcade, Y.; Engler, J.O.; Rodder, D.; Secondi, J. Mapping species distributions with MAXENT using a geographically biased sample of presence data: A performance assessment of methods for correcting sampling bias. PLoS ONE 2014, 9, e97122. [Google Scholar] [CrossRef] [PubMed]
- Hoveka, L.N.; Bezeng, B.S.; Yessoufou, K.; Boatwright, J.S.; Van der Bank, M. Effects of climate change on the future distributions of the top five freshwater invasive plants in South Africa. S. Afr. J. Bot. 2016, 102, 33–38. [Google Scholar] [CrossRef]
- Kong, F.; Tang, L.; He, H.; Yang, F.; Tao, J.; Wang, W. Assessing the impact of climate change on the distribution of Osmanthus fragrans using Maxent. Environ. Sci. Pollut. Res. 2021. [Google Scholar] [CrossRef] [PubMed]
- Zhang, L.; Jing, Z.; Li, Z.; Liu, Y.; Fang, S. Predictive Modeling of Suitable Habitats for Cinnamomum Camphora (L.) Presl Using Maxent Model under Climate Change in China. Int. J. Environ. Res. Public Health 2019, 16, 3185. [Google Scholar] [CrossRef]
- Zhang, K.; Sun, L.; Tao, J. Impact of Climate Change on the Distribution of Euscaphis japonica (Staphyleaceae) Trees. Forests 2020, 11, 525. [Google Scholar] [CrossRef]
- Li, Y.; Li, M.; Li, C.; Liu, Z. Optimized Maxent Model Predictions of Climate Change Impacts on the Suitable Distribution of Cunninghamia lanceolata in China. Forests 2020, 11, 302. [Google Scholar] [CrossRef]
- Bağçaci, S.Ç.; Yucel, I.; Duzenli, E.; Yilmaz, M.T. Intercomparison of the expected change in the temperature and the precipitation retrieved from CMIP6 and CMIP5 climate projections: A Mediterranean hot spot case, Turkey. Atmos. Res. 2021, 256. [Google Scholar] [CrossRef]
- Wu, Y.; Zhong, P.A.; Xu, B.; Zhu, F.; Fu, J. Evaluation of global climate model on performances of precipitation simulation and prediction in the Huaihe River basin. Theor. Appl. Climatol. 2017, 133, 191–204. [Google Scholar] [CrossRef]
- Feng, J.; Lee, D.-K.; Fu, C.; Tang, J.; Sato, Y.; Kato, H.; McGregor, J.L.; Mabuchi, K. Comparison of four ensemble methods combining regional climate simulations over Asia. Meteorol. Atmos. Phys. 2010, 111, 41–53. [Google Scholar] [CrossRef]
- Katiraie-Boroujerdy, P.S.; Akbari Asanjan, A.; Chavoshian, A.; Hsu, K.l.; Sorooshian, S. Assessment of seven CMIP5 model precipitation extremes over Iran based on a satellite-based climate data set. Int. J. Climatol. 2019, 39, 3505–3522. [Google Scholar] [CrossRef]
- Sun, Q.; Miao, C.; Duan, Q. Projected changes in temperature and precipitation in ten river basins over China in 21st century. Int. J. Climatol. 2015, 35, 1125–1141. [Google Scholar] [CrossRef]
- Her, Y.; Yoo, S.H.; Cho, J.; Hwang, S.; Jeong, J.; Seong, C. Uncertainty in hydrological analysis of climate change: Multi-parameter vs. multi-GCM ensemble predictions. Sci. Rep. 2019, 9, 4974. [Google Scholar] [CrossRef] [PubMed]
- Ferro, C.A.T.; Stephenson, D.B.; Sansom, P.G.; Zappa, G.; Shaffrey, L. Simple Uncertainty Frameworks for Selecting Weighting Schemes and Interpreting Multimodel Ensemble Climate Change Experiments. J. Clim. 2013, 26, 4017–4037. [Google Scholar] [CrossRef]
- Verburg, P.H.; van de Steeg, J.; Veldkamp, A.; Willemen, L. From land cover change to land function dynamics: A major challenge to improve land characterization. J. Environ. Manag. 2009, 90, 1327–1335. [Google Scholar] [CrossRef]
- McAlpine, C.A.; Eyre, T.J. Testing landscape metrics as indicators of habitat loss and fragmentation in continuous eucalypt forests (Queensland, Australia). Landsc. Ecol. 2002, 17, 711–728. [Google Scholar] [CrossRef]
- Gobin, A.; Campling, P.; Feyen, J. Logistic modelling to derive agricultural land use determinants: A case study from southeastern Nigeria. Agric. Ecosyst. Environ. 2002, 89, 213–228. [Google Scholar] [CrossRef]
- Soares-Filho, B.S.; Cerqueira, G.C.; Pennachin, C.L. DINAMICA—A stochastic cellular automata model designed to simulate the landscape dynamics in an Amazonian colonization frontier. Ecol. Model. 2002, 154, 217–235. [Google Scholar] [CrossRef]
- Peng, J.; Pan, Y.; Liu, Y.; Zhao, H.; Wang, Y. Linking ecological degradation risk to identify ecological security patterns in a rapidly urbanizing landscape. Habitat Int. 2018, 71, 110–124. [Google Scholar] [CrossRef]
- Foley, J.A.; DeFries, R.; Asner, G.P.; Barford, C.; Bonan, G.; Carpenter, S.R.; Chapin, F.S.; Coe, M.T.; Daily, G.C.; Gibbs, H.K.; et al. Global Consequences of Land Use. Science 2005, 309, 570–574. [Google Scholar] [CrossRef] [PubMed]
- Tang, X.; Fehrmann, L.; Guan, F.; Forrester, D.I.; Guisasola, R.; Pérez-Cruzado, C.; Vor, T.; Lu, Y.; Álvarez-González, J.G.; Kleinn, C. A generalized algebraic difference approach allows an improved estimation of aboveground biomass dynamics of Cunninghamia lanceolata and Castanopsis sclerophylla forests. Ann. For. Sci. 2017, 74. [Google Scholar] [CrossRef]
- Zhou, L.; Li, S.; Jia, Y.; Heal, K.V.; He, Z.; Wu, P.; Ma, X. Spatiotemporal distribution of canopy litter and nutrient resorption in a chronosequence of different development stages of Cunninghamia lanceolata in southeast China. Sci. Total Environ. 2021, 762, 143153. [Google Scholar] [CrossRef]
- Yi, Y.J.; Zhou, Y.; Cai, Y.P.; Yang, W.; Li, Z.W.; Zhao, X. The influence of climate change on an endangered riparian plant species: The root of riparian Homonoia. Ecol. Indic. 2018, 92, 40–50. [Google Scholar] [CrossRef]
- Fotheringham, A.S.; Oshan, T.M. Geographically weighted regression and multicollinearity: Dispelling the myth. J. Geogr. Syst. 2016, 18, 303–329. [Google Scholar] [CrossRef]
- Dormann, C.F.; Elith, J.; Bacher, S.; Buchmann, C.; Carl, G.; Carré, G.; Marquéz, J.R.G.; Gruber, B.; Lafourcade, B.; Leitão, P.J.; et al. Collinearity: A review of methods to deal with it and a simulation study evaluating their performance. Ecography 2013, 36, 27–46. [Google Scholar] [CrossRef]
- Zhou, T.; Jia, X.; Liao, H.; Peng, S.; Peng, S. Effects of elevated mean and extremely high temperatures on the physio-ecological characteristics of geographically distinctive populations of Cunninghamia lanceolata. Sci. Rep. 2016, 6, 39187. [Google Scholar] [CrossRef] [PubMed]
- Van Vuuren, D.P.; Stehfest, E.; Gernaat, D.E.H.J.; Doelman, J.C.; van den Berg, M.; Harmsen, M.; de Boer, H.S.; Bouwman, L.F.; Daioglou, V.; Edelenbosch, O.Y.; et al. Energy, land-use and greenhouse gas emissions trajectories under a green growth paradigm. Glob. Environ. Chang. 2017, 42, 237–250. [Google Scholar] [CrossRef]
- Skeie, R.B.; Myhre, G.; Hodnebrog, Ø.; Cameron-Smith, P.J.; Deushi, M.; Hegglin, M.I.; Horowitz, L.W.; Kramer, R.J.; Michou, M.; Mills, M.J.; et al. Historical total ozone radiative forcing derived from CMIP6 simulations. NPJ Clim. Atmos. Sci. 2020, 3. [Google Scholar] [CrossRef]
- Eyring, V.; Bony, S.; Meehl, G.A.; Senior, C.A.; Stevens, B.; Stouffer, R.J.; Taylor, K.E. Overview of the Coupled Model Intercomparison Project Phase 6 (CMIP6) experimental design and organization. Geosci. Model. Dev. 2016, 9, 1937–1958. [Google Scholar] [CrossRef]
- Riahi, K.; van Vuuren, D.P. The Shared Socioeconomic Pathways and their energy, land use, and greenhouse gas emissions implications: An overview. Glob. Environ. Chang. 2017, 42, 153–168. [Google Scholar] [CrossRef]
- Sultana, S.; Baumgartner, J.B.; Dominiak, B.C.; Royer, J.E.; Beaumont, L.J. Potential impacts of climate change on habitat suitability for the Queensland fruit fly. Sci. Rep. 2017, 7, 13025. [Google Scholar] [CrossRef] [PubMed]
- Liu, Y.; Yu, D.; Xun, B.; Sun, Y.; Hao, R. The potential effects of climate change on the distribution and productivity of Cunninghamia lanceolata in China. Environ. Monit. Assess. 2014, 186, 135–149. [Google Scholar] [CrossRef] [PubMed]
- Coops, N.C.; Waring, R.H.; Schroeder, T.A. Combining a generic process-based productivity model and a statistical classification method to predict the presence and absence of tree species in the Pacific Northwest, USA. Ecol. Model. 2009, 220, 1787–1796. [Google Scholar] [CrossRef]
- Chang, Q.; Xiao, X.; Doughty, R.; Wu, X.; Jiao, W.; Qin, Y. Assessing variability of optimum air temperature for photosynthesis across site-years, sites and biomes and their effects on photosynthesis estimation. Agric. For. Meteorol. 2021, 298–299. [Google Scholar] [CrossRef]
- Moore, C.E.; Meacham-Hensold, K.; Lemonnier, P.; Slattery, R.A.; Benjamin, C.; Bernacchi, C.J.; Lawson, T.; Cavanagh, A.P. The effect of increasing temperature on crop photosynthesis: From enzymes to ecosystems. J. Exp. Bot. 2021, 72, 2822–2844. [Google Scholar] [CrossRef] [PubMed]
- Ikkonen, E.N.; Shibaeva, T.G.; Titov, A.F. Influence of Daily Short-Term Temperature Drops on Respiration to Photosynthesis Ratio in Chilling-Sensitive Plants. Russ. J. Plant Physiol. 2018, 65, 78–83. [Google Scholar] [CrossRef]
- Prasad, P.V.V.; Djanaguiraman, M. High night temperature decreases leaf photosynthesis and pollen function in grain sorghum. Funct. Plant Biol. 2011, 38, 993–1003. [Google Scholar] [CrossRef] [PubMed]


| Code | Environmental Variables | Units | Percent Contribution |
|---|---|---|---|
| bio14 | Precipitation of driest month | mm | 58 |
| bio6 | Min temperature of coldest month | °C | 24.4 |
| bio2 | Mean diurnal range | °C | 4.7 |
| SLO | Slope | % | 2.8 |
| bio3 | Isothermality(bio2/bio7) (*100) | °C | 2.7 |
| bio4 | Temperature seasonality (standard deviation*100) | °C | 2.6 |
| bio13 | Precipitation of wettest month | mm | 1.2 |
| bio5 | Max temperature of warmest month | °C | 1.2 |
| bio8 | Mean temperature of wettest quarter | °C | 1 |
| bio15 | Precipitation seasonality | 1 | 0.5 |
| ALT | Altitude | m | 0.4 |
| ASP | Aspect | ° | 0.4 |
| 126a | 126b | 126c | 245a | 245b | 245c | 370a | 370b | 370c | 585a | 585b | 585c | |
|---|---|---|---|---|---|---|---|---|---|---|---|---|
| Farmland | 79.62 | 85.81 | 70.11 | 79.08 | 77.38 | 67.90 | 83.52 | 82.80 | 66.15 | 74.68 | 73.35 | 70.57 |
| Bare land | 0.04 | 0.05 | 0.04 | 0.04 | 0.05 | 0.04 | 0.11 | 0.12 | 0.06 | 0.07 | 0.05 | 0.04 |
| Woodland | 115.26 | 125.57 | 117.35 | 123.89 | 123.43 | 120.19 | 121.28 | 128.05 | 120.27 | 120.17 | 126.63 | 119.14 |
| Grassland | 25.08 | 30.81 | 24.89 | 29.58 | 29.79 | 27.26 | 28.83 | 34.28 | 26.76 | 27.67 | 30.90 | 25.91 |
Publisher’s Note: MDPI stays neutral with regard to jurisdictional claims in published maps and institutional affiliations. |
© 2021 by the authors. Licensee MDPI, Basel, Switzerland. This article is an open access article distributed under the terms and conditions of the Creative Commons Attribution (CC BY) license (https://creativecommons.org/licenses/by/4.0/).
Share and Cite
Zhou, Y.; Zhang, Z.; Zhu, B.; Cheng, X.; Yang, L.; Gao, M.; Kong, R. MaxEnt Modeling Based on CMIP6 Models to Project Potential Suitable Zones for Cunninghamia lanceolata in China. Forests 2021, 12, 752. https://doi.org/10.3390/f12060752
Zhou Y, Zhang Z, Zhu B, Cheng X, Yang L, Gao M, Kong R. MaxEnt Modeling Based on CMIP6 Models to Project Potential Suitable Zones for Cunninghamia lanceolata in China. Forests. 2021; 12(6):752. https://doi.org/10.3390/f12060752
Chicago/Turabian StyleZhou, Yichen, Zengxin Zhang, Bin Zhu, Xuefei Cheng, Liu Yang, Mingkun Gao, and Rui Kong. 2021. "MaxEnt Modeling Based on CMIP6 Models to Project Potential Suitable Zones for Cunninghamia lanceolata in China" Forests 12, no. 6: 752. https://doi.org/10.3390/f12060752
APA StyleZhou, Y., Zhang, Z., Zhu, B., Cheng, X., Yang, L., Gao, M., & Kong, R. (2021). MaxEnt Modeling Based on CMIP6 Models to Project Potential Suitable Zones for Cunninghamia lanceolata in China. Forests, 12(6), 752. https://doi.org/10.3390/f12060752