Article

Genetic Diversity and Structure of Pinus densiflora Siebold & Zucc. Populations in Republic of Korea Based on Microsatellite Markers

Department of Forest Bio Resources, National Institute of Forest Science, Suwon 16631, Korea
*
Author to whom correspondence should be addressed.
Forests 2021, 12(6), 750; https://doi.org/10.3390/f12060750
Submission received: 9 April 2021 / Revised: 20 May 2021 / Accepted: 3 June 2021 / Published: 6 June 2021
(This article belongs to the Section Genetics and Molecular Biology)

Abstract

:
Pinus densiflora Siebold & Zucc. is a widely distributed conifer species in the Republic of Korea with economic and ecologic importance. However, P. densiflora is negatively influenced by various factors, such as forest fires, clearing of large numbers of trees infected with Pinus disease, and dieback. We aimed to use microsatellite markers to estimate the genetic diversity, differentiation, and structure of P. densiflora populations in the Republic of Korea. A total of 1844 samples from 60 populations were evaluated using 11 polymorphic microsatellite markers. The observed heterozygosity and expected heterozygosity were 0.652 and 0.673, respectively. The mean genetic differentiation among the populations was 0.013. Moreover, P. densiflora showed high genetic diversity and low genetic differentiation compared with conifer species, including Pinus species with similar life histories. Principal coordinates analysis and Bayesian clustering showed that P. densiflora has a weak geographical structure. The P. densiflora population at Mt. Halla, Jeju Island, showed the lowest genetic diversity and significant genetic differentiation compared with other mainland populations due to genetic drift and restricted gene flow. These findings can be useful for designing new conservation, management, and breeding strategies for P. densiflora populations in response to future environmental changes.

1. Introduction

Pinus densiflora Siebold & Zucc., usually called the Japanese red pine, is a conifer species belonging to the family Pinaceae and genus Pinus L. Japanese red pine is the most widely distributed conifer species in the Republic of Korea [1]. Its distribution in the Korean Peninsula ranges from Hamgyeongbukdo (N 43°) to Jeju Island (N 33°) [2]. This species is also found throughout Japan, Manchuria, the Shandong Peninsula in China, and eastern Russia [3]. P. densiflora is known to have undergone speciation from Pinus sylvestris L. [4]. P. sylvestris diverged to a variety of species termed ‘sylvestriformis’ in the Manchuria province of China and eventually differentiated into P. densiflora [5]. Most P. densiflora forests are secondary and mixed stand forests that primarily compete with Quercus mongolica Fisch. ex Ledeb. and Quercus serrata Murray [6]; thus, it is an ecologically important species [7]. Moreover, due to the wide range of local environmental growth, it also exhibits differences in growth depending on the matrix or soil type. Human disturbance is closely related to the wide distribution and decline in P. densiflora forests. Deciduous broad-leaved forests were replaced with P. densiflora during agricultural harvesting of wood for fuel purposes [8]. P. densiflora forests were then conserved by law and subjected to national moderation, including the plantation policy during the Koryo (918–1392) and the Chosun (1392–1910) Dynasties [9]. P. densiflora was specifically used as important building material for the royal palace and Buddhist temples. However, with time the P. densiflora forest declined due to large-scale logging after infection with pine gall midges (Thecodiplosis japonensis) or pine wilt disease caused by pine-wood nematode (Bursaphelenchus xylophilus) [10]. Frequent forest fires [11] and climate change [12] have also been reported as causes for the decrease in P. densiflora forests. Specifically, in 2009, large-scale pine forests were withered in the southern region of the Republic of Korea. Thereafter, the number of withered areas has continued to increase, as high temperatures and drought occur during the winter season.
The first study of these species morphologically classified six regional ecotypes: Dongbuk, Keumgang, Central–Southern lowland, Central–Southern highland, Angang, and Weebong based on stem and crown forms [13]. Since then, several studies have been conducted on tree breeding and conservation programs [14]. For instance, studies on morphological variants have been conducted on wood quality [15], needle and cone characteristics [16], needle characteristics [17], and provenance studies for geographical variation [18]. Furthermore, genetic analyses, including isozyme, random amplified polymorphic DNA (RAPD), and inter simple sequence repeats (ISSR), were performed to assess the genetic diversity of P. densiflora populations [7,19,20]. However, only 25 populations were analyzed in these studies. The authors postulated that the study site was limited, considering the characteristics of the species distribution range. In addition, a highly polymorphic marker is required to accurately estimate genetic diversity and genetic structure.
Genetic variation in tree species occurs due to evolutionary factors, such as genetic drift, mutation, migration, and selection, as well as environmental factors, such as geographic and climatic factors [21]. Additionally, human disturbances also affect genetic structure [22]. Hence, genetic diversity and genetic structure studies for tree species provide useful data not only regarding the evolutionary history of the species, but also for conservation, breeding, and management [23]. Microsatellite markers are codominant and identify high-level allelic diversity [24], making them useful tools in population genetics, mating systems, parentage analysis, and genetic linkage mapping for conservation and breeding.
The population of P. densiflora is decreasing due to climate change, human disturbance, pine disease, and forest fires. Strategies that take into account genetic diversity during conservation and management are required. The aims of this study were (1) to investigate 60 populations in the Republic of Korea and (2) to use microsatellite markers to estimate the genetic diversity, genetic differentiation, and genetic structure of P. densiflora.

2. Materials and Methods

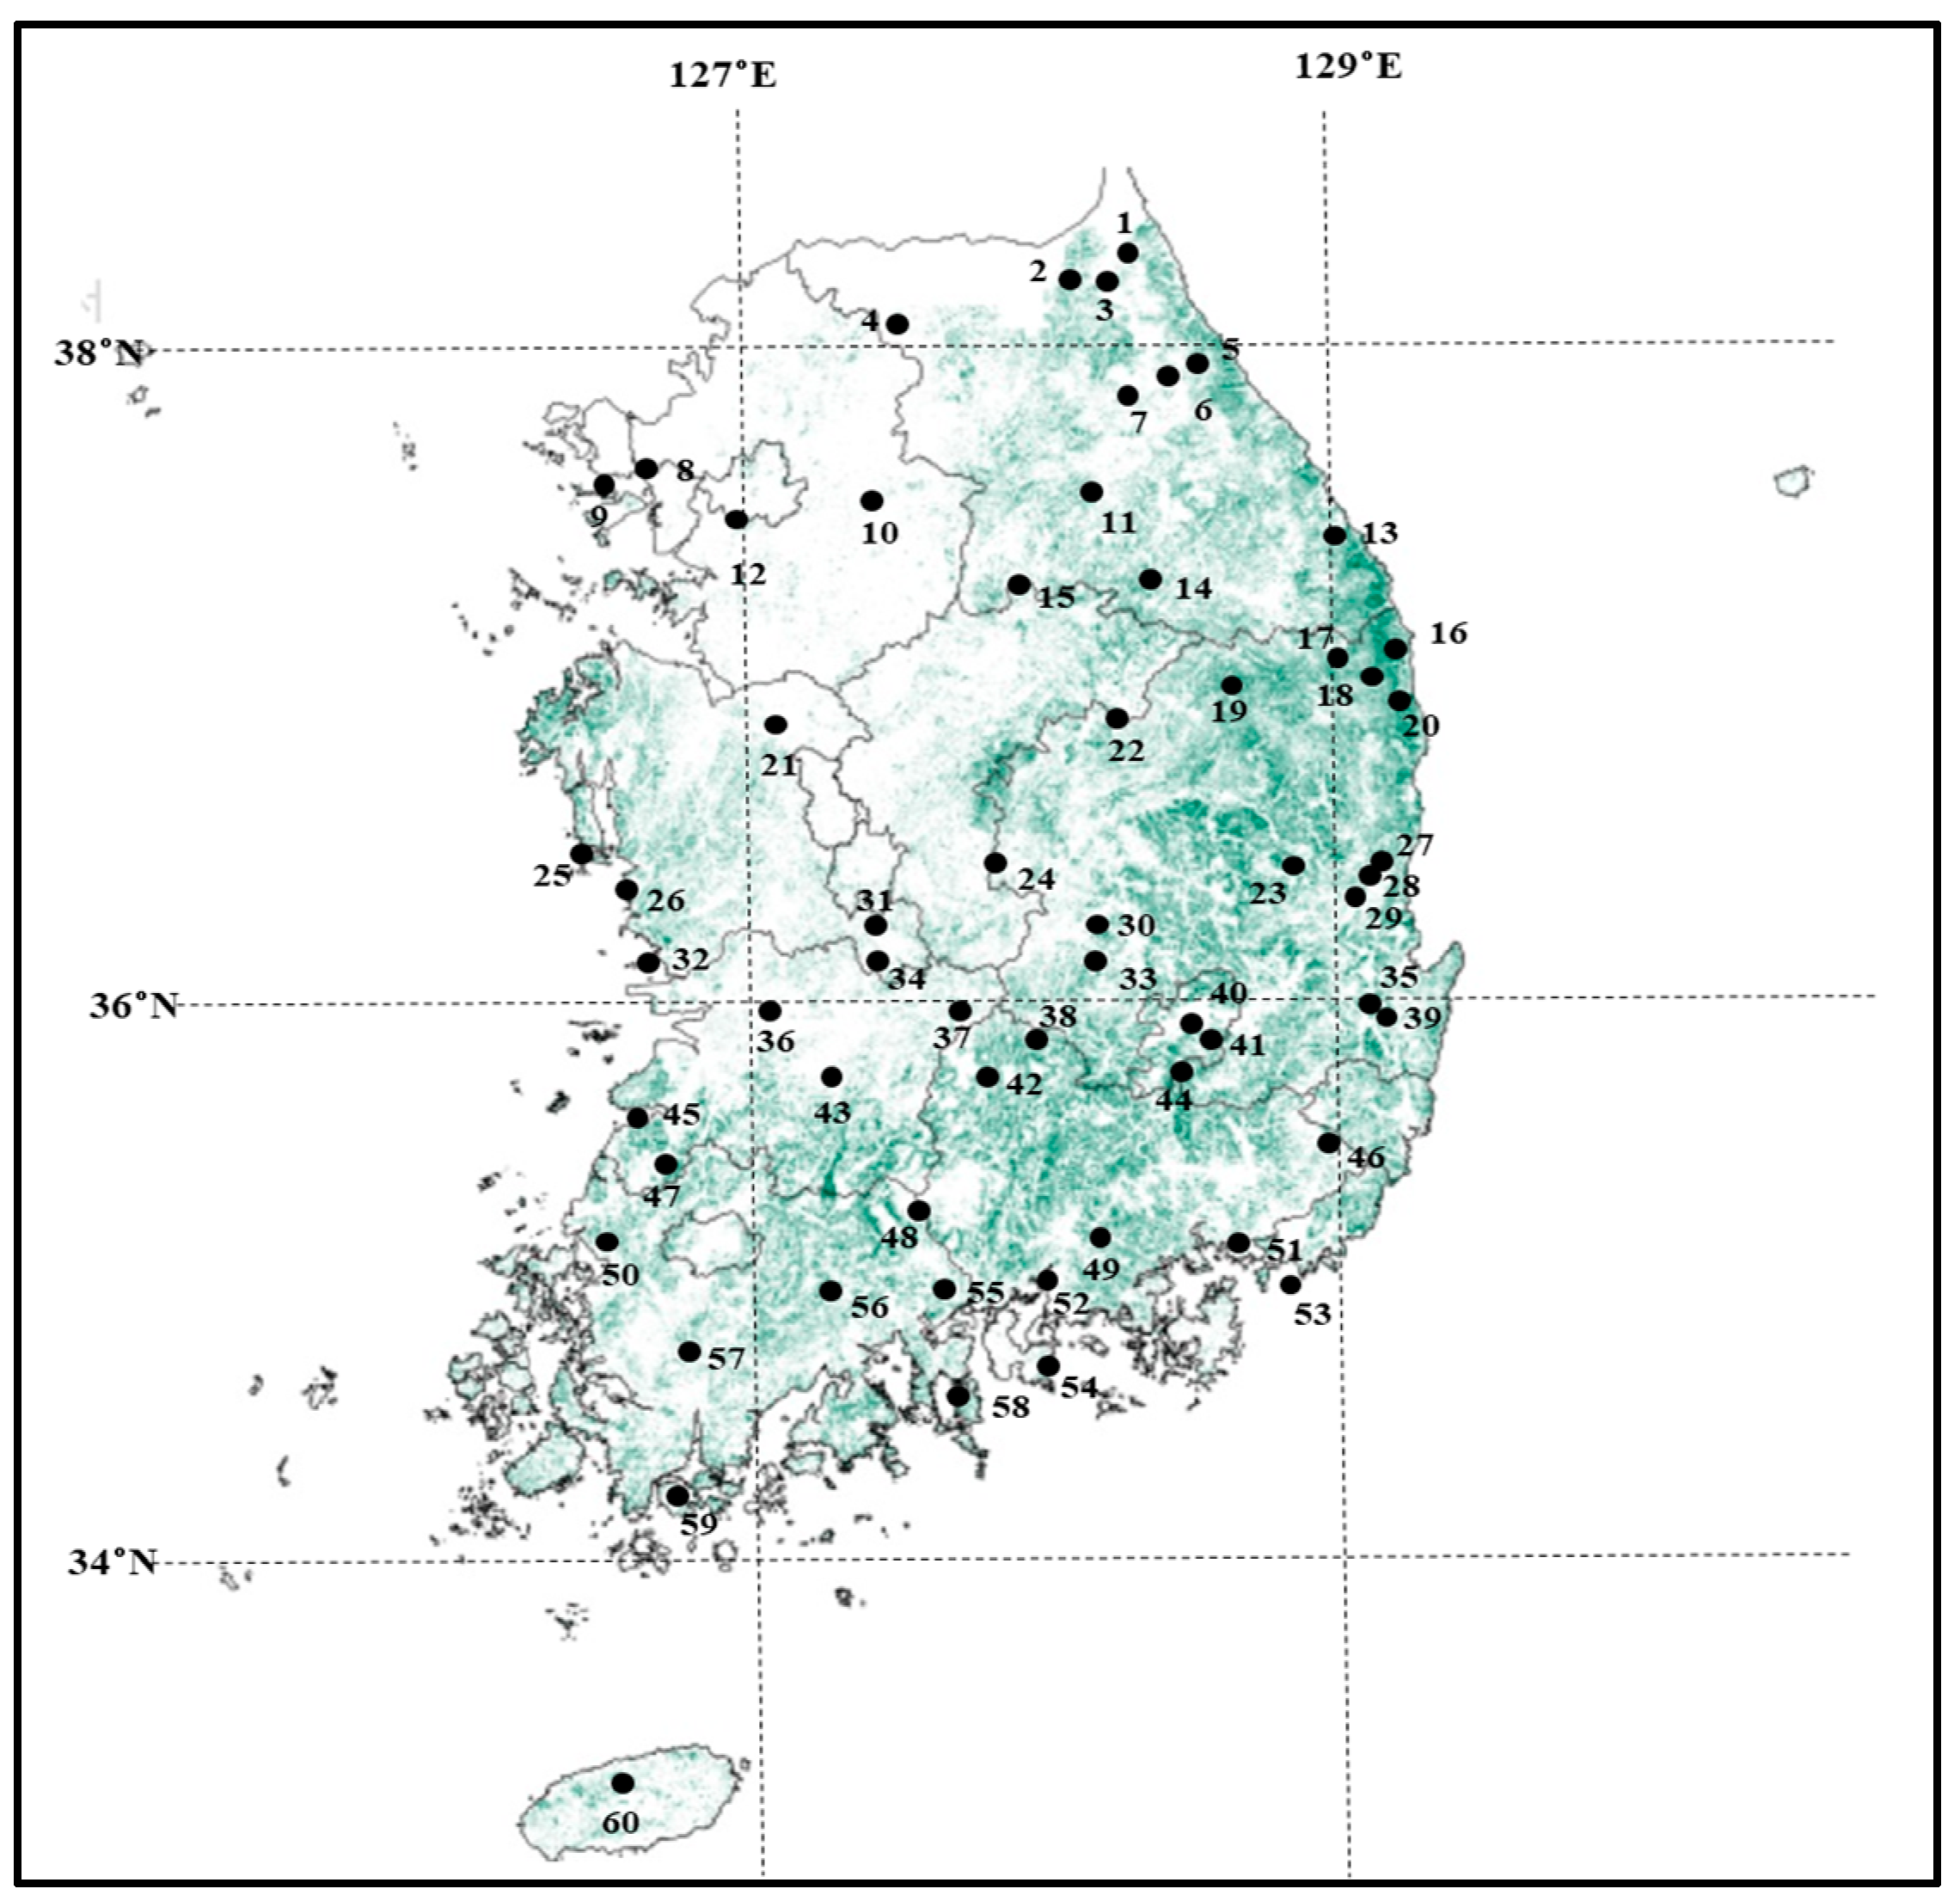
2.1. Sample Collection and DNA Extraction

Samples were collected from individual trees that were a minimum of 50 m apart. Needles were collected from each tree to minimize genetic similarity. A total of 1844 samples were collected from 60 distinct P. densiflora populations (Figure 1). Location information for the trees was collected using GPS (Garmin, GPS map60CSx, Schaffhausen, Switzerland). DNA extraction and DNA concentration measurements were performed according to previously published protocols [25].
Figure 1. Locations of the 60 P. densiflora populations throughout the Republic of Korea. The green area indicates the distribution of P. densiflora, based on data from the Statistical Yearbook of Forestry by the Korea Forest Service [1]. The numbers indicating each population are presented in Table 1.
Forests 12 00750 g001

2.2. Microsatellite Analysis

Microsatellite markers have been developed for P. densiflora over the past two decades [26,27,28]. A total of 11 markers were used for the current analysis (Table 2). Polymerase chain reaction (PCR) amplification was performed using a PTC-0240 DNA Engine Tetrad® 2 Peltier Thermal Cycler (Bio-Rad, Hercules, CA, USA). The reaction conditions were modified and varied depending on the use of different primers in a 12 μL reaction volume containing 4 μL of 20 ng final concentration of DNA, 1.2 μL of 10x buffer, 0.24 μL 10 μM of each primer (forward was labeled with florescent FAM dye), 0.12 μL of 10 mM dNTPs, 0.32 μL of 25 mM MgCl2, and 0.24 μL of 0.1 unit Taq DNA polymerase (BioFACTTM, Daejeon, Republic of Korea) to amplify Pdms009, Pdms030, Pdms065, Pdms221, Pde14, and Lop5. Except for Lop5, amplification was conducted using the following cycling parameters: initial denaturation at 94 °C for 4 min, followed by 6 cycles of touchdown consisting of denaturation at 94 °C for 1 min, and annealing at 55 °C for 1 min, decreasing by 1 °C each cycle, extension at 72 °C for 2 min, and subsequently 32 cycles of amplification consisting of denaturation at 94 °C for 30 s, annealing at 52 °C for 30 s, extension at 72 °C for 1 min, and a final extension at 72 °C for 5 min. For the Lop5 primer, amplification conditions included an initial denaturation at 94 °C for 4 min, followed by 5 cycles of touchdown consisting of denaturation at 94 °C for 1 min, annealing at 50 °C for 1 min, decreasing by 1 °C per cycle, extension at 72 °C for 2 min, and 30 cycles of amplification consisting of denaturation at 94 °C for 30 s, annealing at 45 °C for 30 s, extension at 72 °C for 1 min, and a final extension at 72 °C for 5 min.
To amplify CPDE0039, CPDE0058, CPDE0060, CPDE0076, and CPDE0106, a 16 μL reaction volume containing 4 μL of 20 ng final concentration of DNA, 1.6 μL of 10× buffer, 0.32 μL of 10 μM of each primer, 0.32 μL of 10 mM dNTPs, 0.96 μL of 25 mM MgCl2, and 0.1 U of Taq DNA polymerase was used. The conditions included an initial denaturation at 95 °C for 5 min, followed by 5 cycles of touchdown consisting of denaturation at 94 °C for 30 s, annealing at 61 °C for 30 s, decreasing by 1 °C per cycle; extension at 72 °C for 30 s; and 29 cycles of amplification consisting of denaturation at 94 °C for 30 s, annealing at 56 °C for 30 s, extension at 72 °C for 30 s, and a final extension at 72 °C for 10 min.
The amplification products were fractionated by capillary electrophoresis using an ABI Prism 3730xl Genetic Analyzer (Applied Biosystems, Foster City, CA, USA). The amplified fragment size was identified using the GeneScanTM-500 ROX size standard (Life Technologies, Carlsbad, CA, USA). Allele binning and genotyping were performed using GeneMapper v5.0 (Life Technologies, Carlsbad, CA, USA). All loci were checked for the occurrence of null alleles, large allele dropout, and stutter bands using Micro-Checker v2.2.3 software [29]. Number of alleles per locus (Na) and polymorphism information content (PIC) per locus were calculated based on allele frequency using the program Cervus v2.0 [30].

2.3. Data Analysis

The number of alleles (A) and effective alleles (Ae) were calculated. The observed heterozygosity (Ho) and expected heterozygosity (He) were estimated from the allele frequencies. Pairwise values of Nei’s genetic distance between populations were estimated. Principal coordinates analysis (PCA) was performed using Nei’s genetic distance values. We also performed a Mantel test with 999 random permutations between the matrices obtained for pairwise population differentiation (FST) and geographic distance based on the isolation by distance (IBD). All analyses were performed using GeneAlEx 6.41 software [31].
Allelic richness (AR) was estimated using a minimum sample size of 15 individuals. The inbreeding coefficient (FIS) for each population and the value of genetic differentiation between pairs of populations (FST) were calculated. The significance level of deviation of FIS from zero and pairwise FST values were determined using the FSTATv2.9.3 software [32] with 1000 permutations.
We employed both the sign test and Wilcoxon signed-rank test for each population using Bottleneck v1.2 software [33]. We estimated the significance value to detect recently bottlenecked populations. We selected both the infinite allele mutation model (IAM) and the two-phase mutation model (TPM) and set the option to test according to previously published analysis on P. densiflora in Japan [34]. The two models were selected because IAM has greater statistical power than the step mutation model (SMM) when using highly polymorphic markers. TPM is suitable when allele size is not equally distributed.
Bayesian clustering analysis was employed to identify the genetic structure of populations using Structure v2.3 software [35]. The number of assumed clusters (K) was set from 1 to 10. Each simulation was performed assuming a K value of 1–10. All simulations were performed ten times. A correlated allele frequency model was selected. The running length was set to 100,000 Markov chain Monte Carlo (MCMC) sampling, after a burn-in period of 100,000 iterations. The ΔK value was calculated according to the method of Evanno et al. [36] using the Structure Harvester program [37]. Clustering analysis results were visualized using CLUMPP v. 1.1.2 [38] and DISTRUCT v1.1 software [39]. The proportional membership of each cluster was generated and visualized. The spatially explicit Bayesian clustering methods facilitated the estimation of genetic structure by considering landscape factors [40]. Bayesian clustering analysis was used to consider spatial distribution with an algorithm implemented in v3.4.1 of the R package Geneland (v4.0.8). We assumed a spatial model with correlated allele frequency and set the cluster numbers from 1 to 5. The simulations were run for 100,000 iterations, using a thinning value of 100. Hierarchical AMOVA was also performed to estimate the degree of genetic differences among clusters using GeneAlEx 6.41 software [31]. We set the number of clusters obtained from the Geneland analysis.

3. Results

3.1. Genetic Diversity within a Population

We observed 221 alleles with 11 microsatellite primers across 1844 samples. The number of observed alleles ranged from 8 (Pdms065) to 40 (CPDE0039), with an average value of 20.1. The mean number of alleles (A), effective alleles (Ae), allelic richness (AR), observed heterozygosity (Ho), and expected heterozygosity (He) were 8.9, 4.6, 7.0, 0.652, and 0.673, respectively (Table 1). The highest level of genetic diversity was observed in the Kimhae (code 51) population (A = 10.0, Ae = 5.5, AR = 8.0, Ho = 0.697, He = 0.733), whereas the Mt. Halla (code 60) population had the lowest genetic diversity (A = 6.5, Ae = 3.3, AR = 5.0, Ho = 0.606, He = 0.609). The estimated inbreeding coefficient (FIS) ranged from −0.037 for Mt. Gwanak (code 12) to 0.193 for Angang (code 35), with a mean value of 0.048. FIS showed positive and significant values in 28 populations, including Angang (code 35) (Table 1, p < 0.05, p < 0.01, and p < 0.001). From both the sign and Wilcoxon tests, no significant populations under IAM and TPM were observed (Table S1, p < 0.05). The number of alleles (Na) per locus ranged from 8 (Pdms 221) to 40 (CPDE0039). The polymorphism information content (PIC) ranged 0.314 (Pdms 221) to 0.912 (CPDE0039) (Table 2).

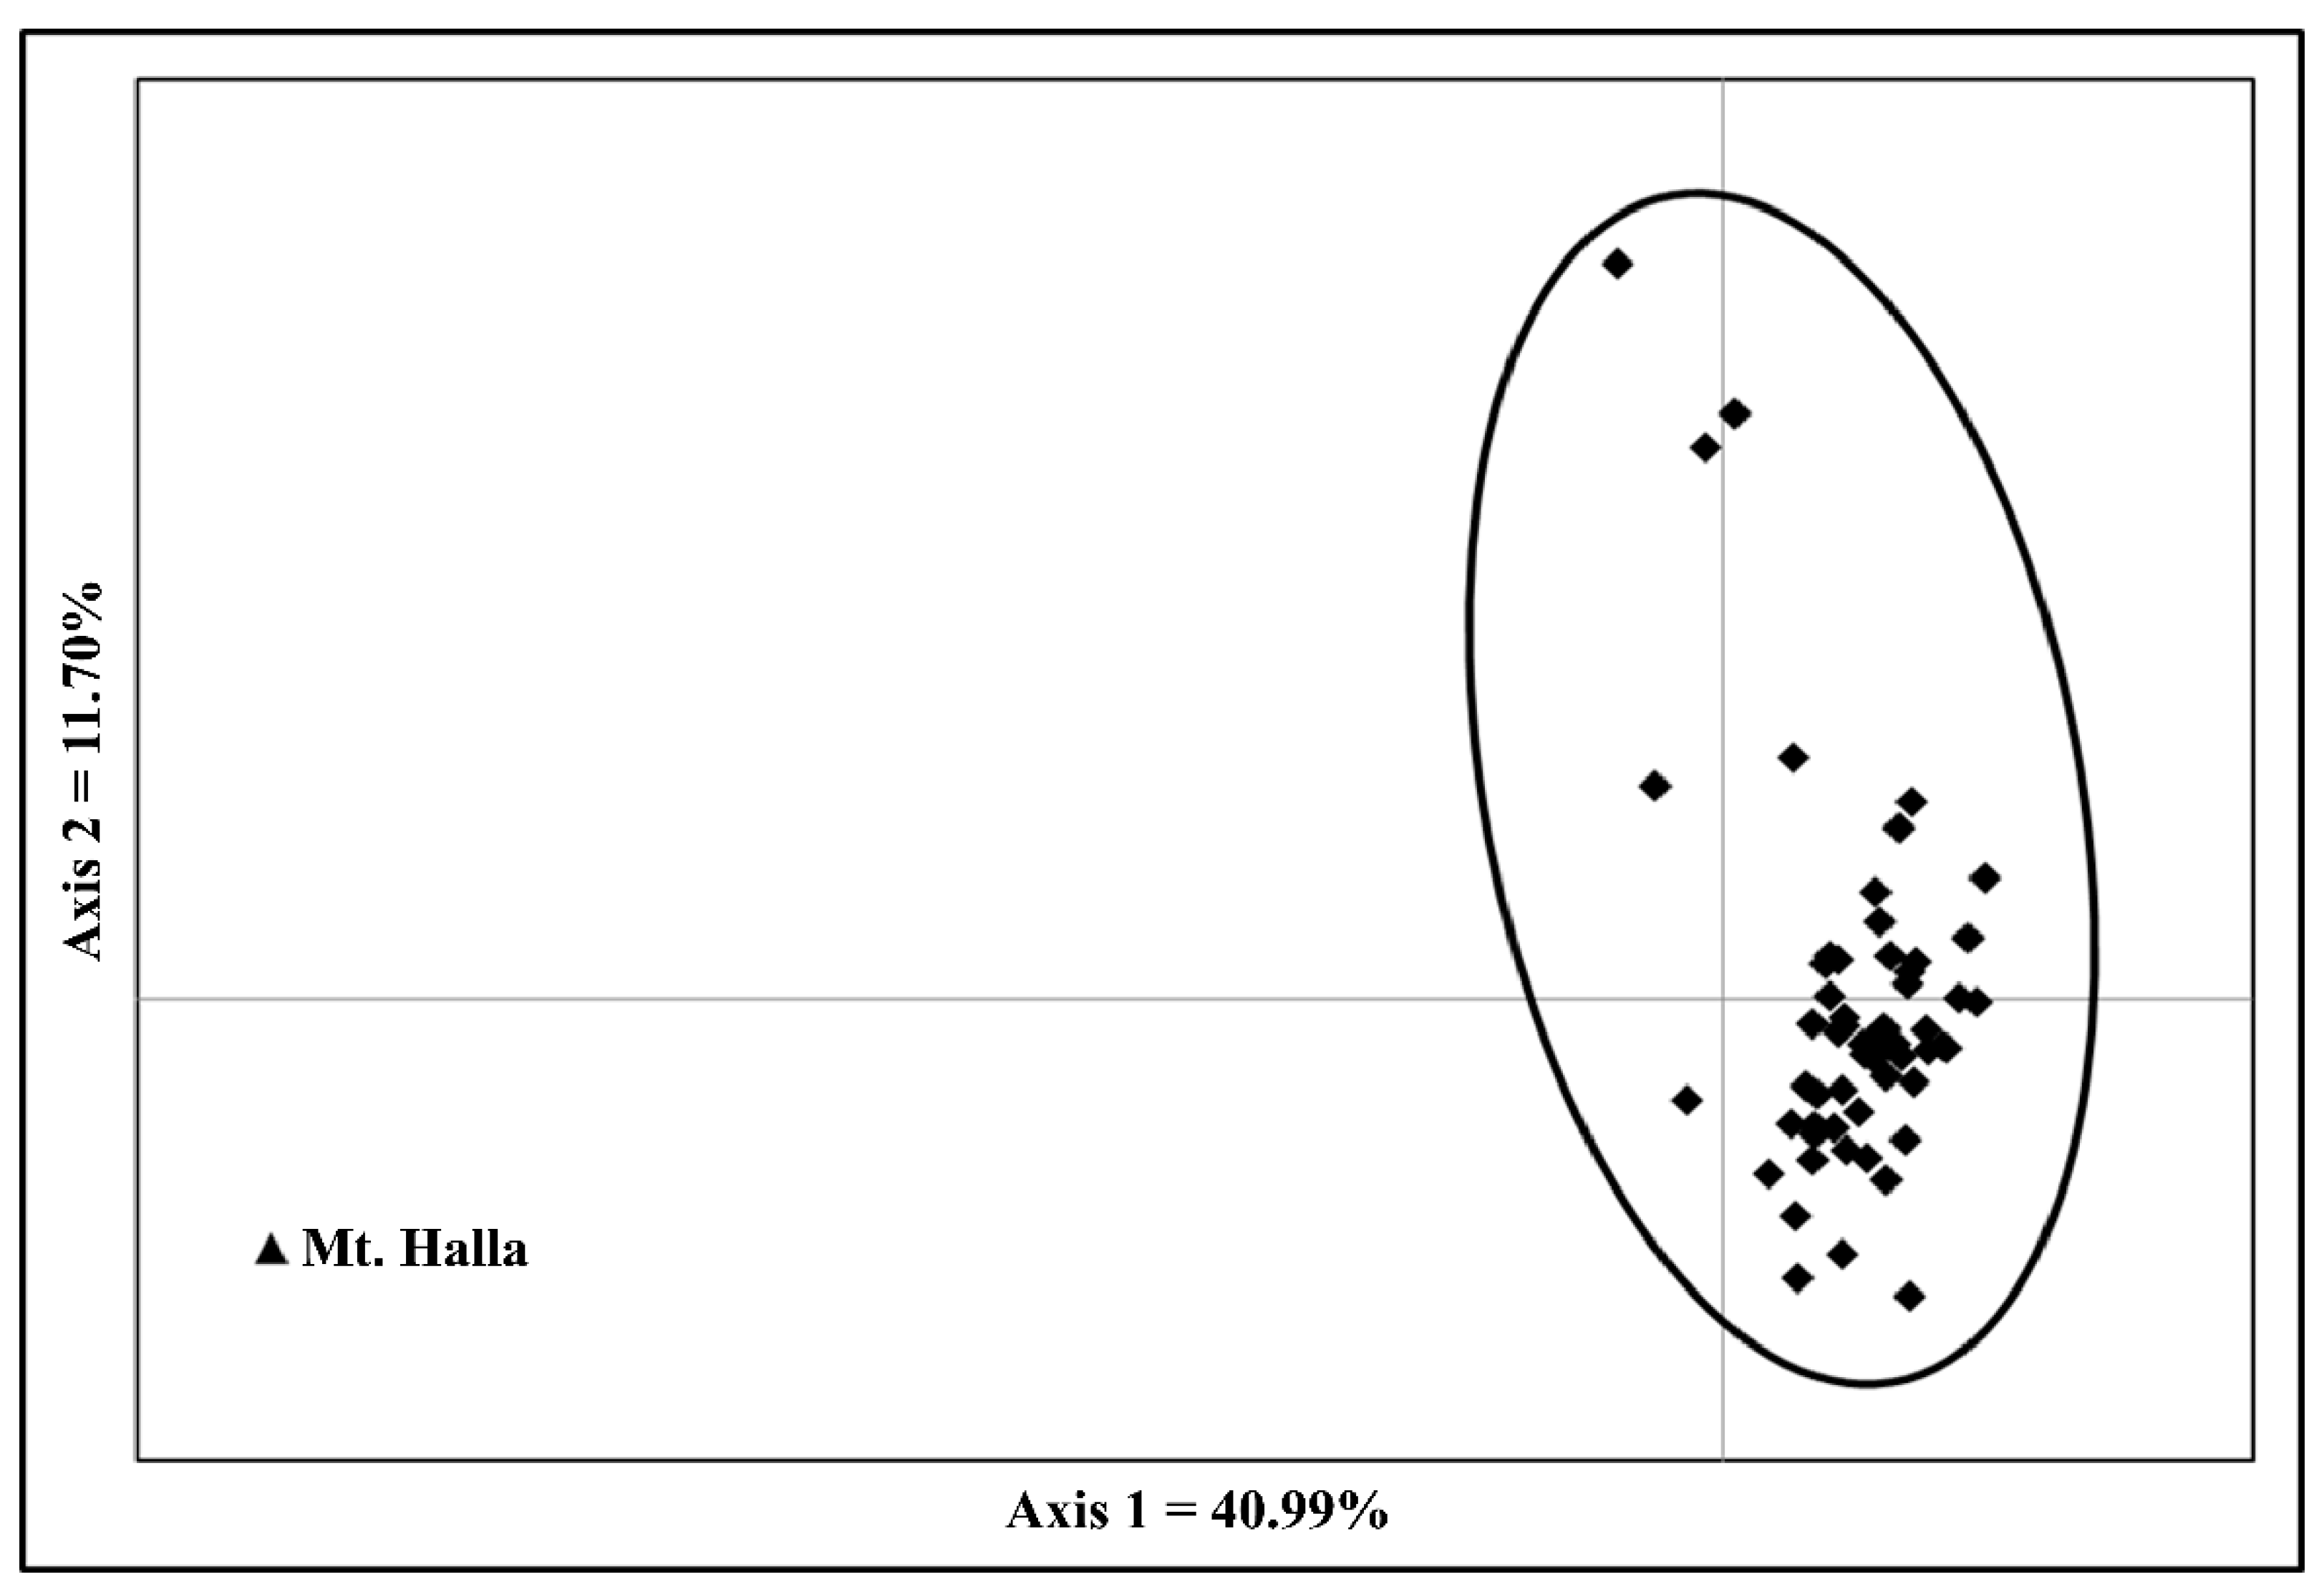
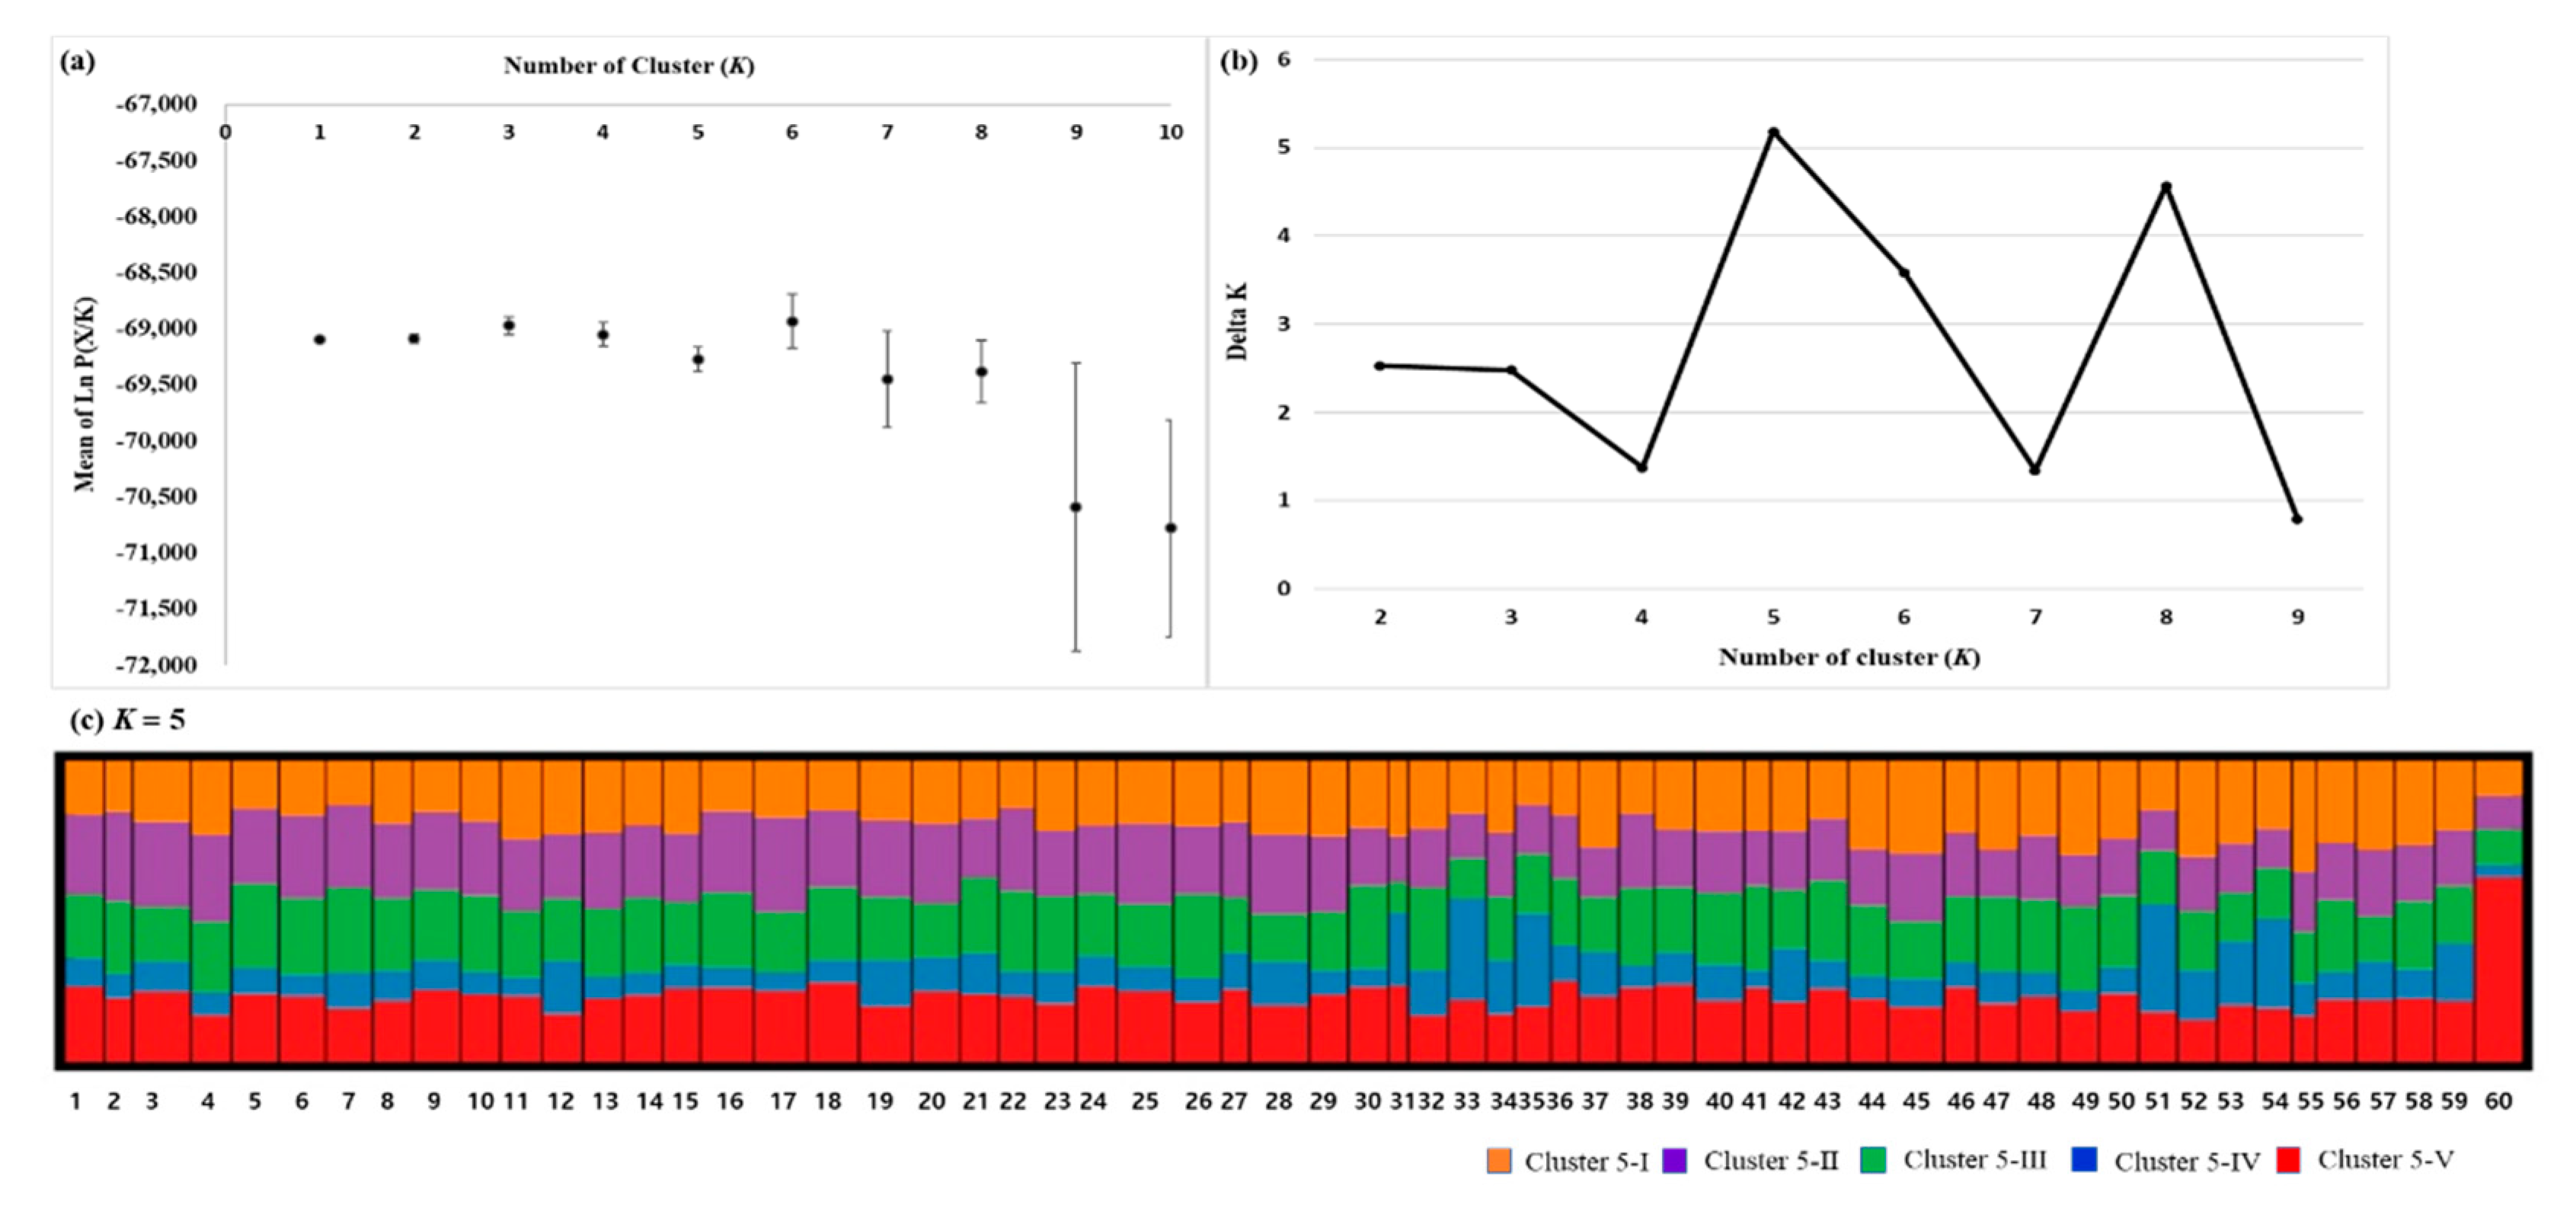
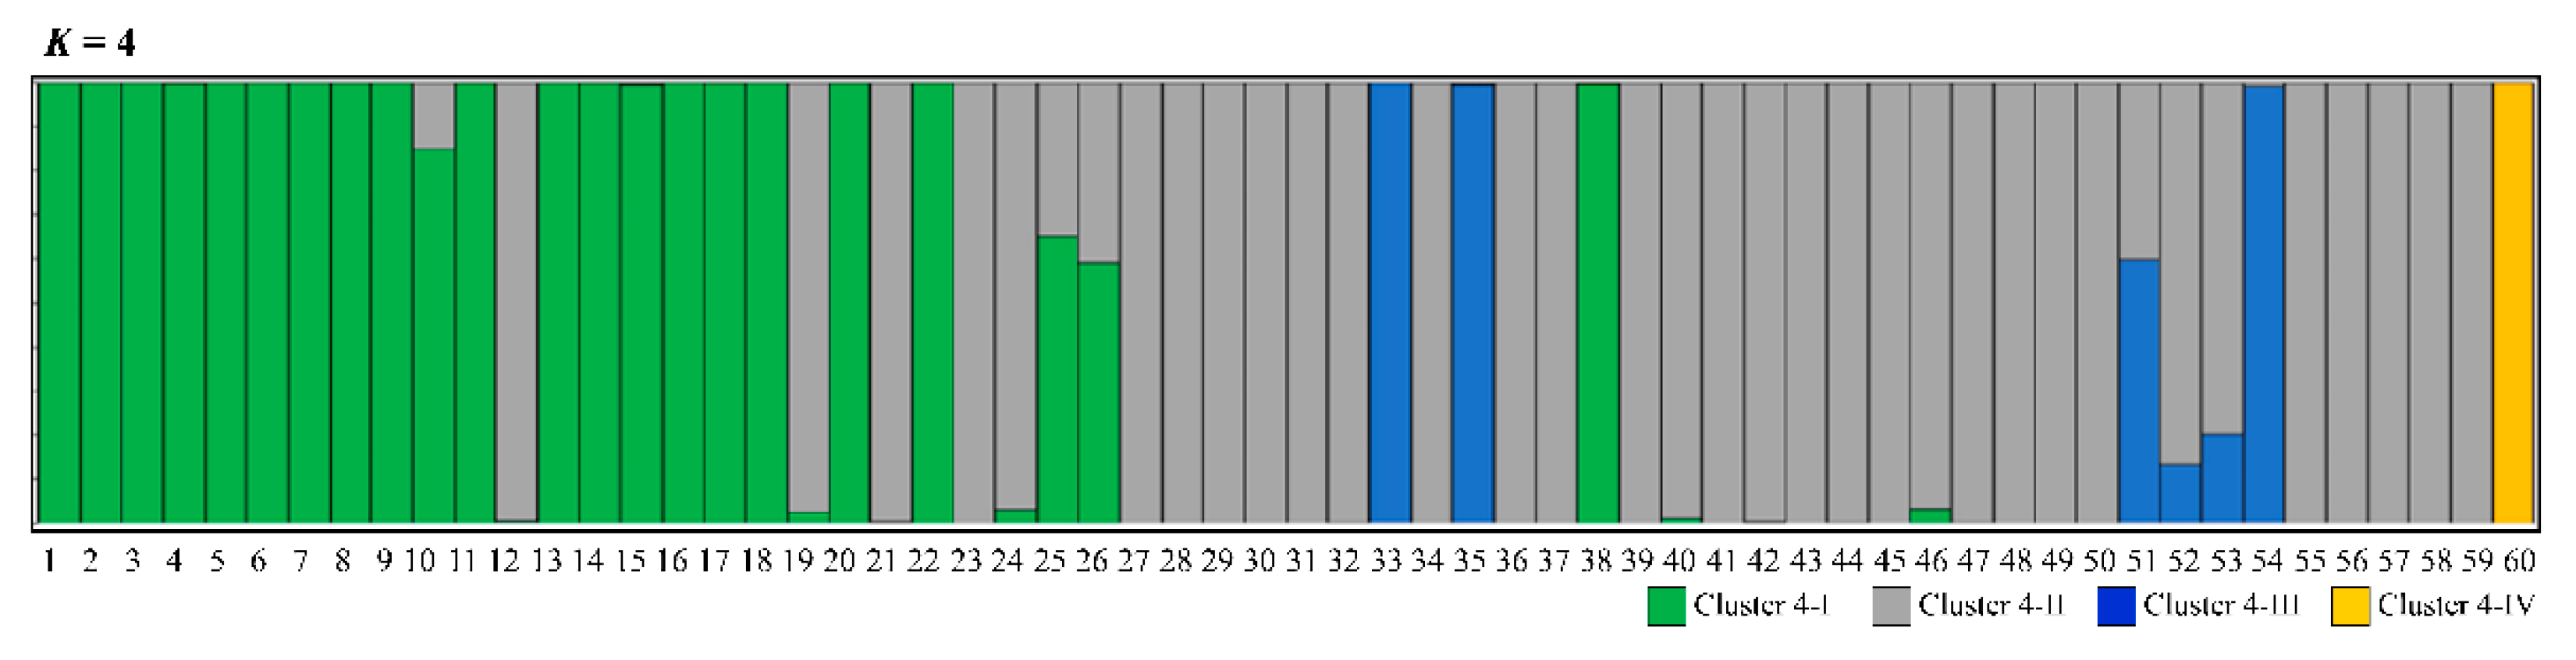
3.2. Genetic Differentiation and Population Structure

Pairwise FST values ranged from 0.004 to 0.049, and the mean genetic differentiation among populations (FST) was 0.013 (Table S2). Mt. Halla (code 60) had significantly high FST estimates relative to other populations (p < 0.001), as depicted in the PCA scatter diagram (Figure 2). Mt. Halla populations were genetically distant from other populations. Using the Mantel test, significant results were identified among the 60 populations (r = 0.343, p < 0.01, Figure S1), indicating a weak correlation between genetic differentiation and geographic distance.
From the Structure analysis, the mean value of Ln P(X/K) was estimated to be similar when K was 1–10, which was found to gradually decrease using the method of Pritchard et al. [35] (Figure 3A). However, the value of ΔK was the highest at K = 5, based on the theory suggested by Evanno et al. [36] (Figure 3B). When K was set at 5, the proportion of the five clusters was visualized in all populations (Figure 3C). Mt. Halla (code 60) was dominant in cluster 5-V. Other populations showed proportions similar to the five clusters. Four clusters were divided from spatially explicit clustering using the Geneland program (Figure 4). The proportion of each cluster within the populations was clearer than that in the Structure analysis. Cluster 4-I was dominant in 22 populations (codes 1–11, 13–18, 20, 22, 25, 26, 38). A high proportion of cluster 4-II was found in 33 populations (codes 12, 19, 21, 23, 24, 27–32, 34, 36, 37, 39–50, 52, 53, 55–59). Four populations (codes 33, 35, 51, 54) were high in proportion to cluster 4-III, and the Mt. Halla population was dominant in cluster 4-IV.
In contrast to Structure, Geneland detected the genetic structure among populations. However, the genetic differences between the four clusters including Mt. Halla was 1.4%, whereas the difference between the three clusters except Mt. Halla was less than 1% using hierarchical AMOVA (Table 3).

4. Discussion

4.1. Genetic Diversity within a Population

P. densiflora was observed to have a higher genetic diversity than other Pinus and conifer species. The level of P. densiflora genetic diversity (He = 0.673) was higher than Picea jezoensis (Siebold & Zucc.) Carrière (He = 0.406, [41]), Abies koreana E.H.Wilson (He = 0.381, [42]), and A. nephrolepis (Trautv. ex Maxim.) Maxim. (He = 0.321, [42]). According to the microsatellite metadata study, genetic diversity is influenced by the life-history parameters of various species, such as life span, geographic range, breeding system, and seed dispersal [43]. P. densiflora is wind pollinated, and its seeds are dispersed by wind [44], whereas the mating system of this species involves outcrossing [45]. The level of species genetic diversity associated with life-history traits such as being long-lived perennials, wide spread, outcrossing, and seed dispersal by wind is high [43]. The level of genetic diversity in P. densiflora (He = 0.673) was higher than that in species with life-history traits such as being a long-lived perennial (He = 0.680), wide spread (He = 0.620), outcrossing (He = 0.650), and seed dispersal by wind (He = 0.610). The level of genetic diversity for P. densiflora (He = 0.673) was intermediate compared to that of P. densiflora in Japan (He = 0.873; [34]), P. sylvestris (He = 0.847, [46]), P. koraiensis Siebold & Zucc. (He = 0.610; [47]), P. strobus L. (He = 0.590; [48]), and P. cembra L. (He = 0.581; [49]). The mean inbreeding coefficient was 0.048. There have been several studies to investigate heterozygote deficiency in conifer species. For instance, in the P. radiata D.Don study, a high degree of selfing was noted among individuals in the population under bottleneck [50]. The authors noted that homozygote excess was the result of mating among survival-selfing individuals. Additionally, in the P. contorta Douglas ex Loudon study, homozygote excess was interpreted as a subpopulation structure developed from different seed trees during regeneration following fire [51]. In the Tsuga canadensis (L.) Carrière study, it was reported that inbreeding increased due to a decline in large-scale insect outbreaks [52]. From the bottleneck test, we did not find any evidence of a recent bottleneck effect.
Mating system studies for P. densiflora in South Korea showed a high outcrossing rate (tm = 0.798–0.967) [15,53,54]. However, despite a high outcrossing rate within the population, a limited number of effective pollen contributors may result in non-random mating [15]. The number of effective pollen contributors varies depending on stand density, stand age, stand structure, and environmental conditions [54]. If the pollen donor is related, there is a possibility of biparental inbreeding depression. Moreover, genetically biased pollen causes changes in genetic diversity and genetic structure within the population. The estimated FIS value was 0.025 for Buan. This value is smaller than those for Anmyeondo (FIS = 0.067) and Mt. Juwang (FIS = 0.072). Additionally, the number of effective pollen contributors in Buan (Nep = 83.3, [54]) was higher than that in Anmyeondo (Nep = 1.3, [15]) and Mt. Juwang (Nep = 3.9, [53]).

4.2. Genetic Differentiation among Populations

The level of genetic differentiation for P. densiflora (FST = 0.013) was smaller than that of other conifer species in the Republic of Korea, including P. jezoensis (FST = 0.102; [41]), A. koreana (FST = 0.053; [42]), and A. nephrolepis (FST = 0.049; [42]). From the microsatellite metadata study [43], the level of genetic differentiation of species with life-history traits such as being a long-lived perennial (FST = 0.190), wide spread (FST = 0.250), outcrossing (FST = 0.220), and seed dispersal by wind (FST = 0.130) were low. The level of genetic differentiation in P. densiflora (FST = 0.013) was lower than that in species with a similar life history. The genetic differentiation was small compared to that of P. densiflora in Japan (FST = 0.013, [34]), P. koraiensis (FST = 0.020, [47]), P. sylvestris (FST = 0.058, [46]), P. strobus (FST = 0.060, [48]), and P. cambra (FST = 0.065; [49]). Therefore, the level of genetic differentiation in P. densiflora is small compared to other Pinus species with similar life-history traits. These results agree with previous studies based on isozyme (FST = 0.037; [19]) and ISSR (ΦST = 0.080; [7]) data. The level of genetic differentiation is affected by gene flow between populations and is determined by pollen and seed dispersal [55]. Gene flow may increase in distant populations. Parentage analysis in P. densiflora has focused on the long-distance dispersal of seeds [56]. As a result of parental analysis of seeds produced in the natural P. densiflora forest, ~20% of the sampled seeds had gametes derived from maternal trees in other populations. The effect of gene exchange by seed migration increases when many conspecific populations are distributed around the population [44]. Long-distance dispersal of P. densiflora seeds may have the potential for gene exchange within and among populations, and is likely to represent the primary cause of generally low differentiation among natural populations.

4.3. Population Structure

Both PCA and Bayesian clustering suggested that Mt. Halla (code 60) was genetically differentiated from other populations. Pairwise FST between Mt. Halla and other populations also showed significant genetic differentiation from other populations (Table S2). Bayesian analysis assigned the Mt. Halla population to a distinct genetic cluster. Mt. Halla, located on Jeju Island, was a refuge for a variety of climatic species from the cold-tolerant to subtropical during the late postglacial period, and conifer species including P. densiflora have been habitant in Mt. Halla [57]. Genetic drift has led to the loss of genetic diversity of populations on the island, as well as genetic differentiation from mainland populations [58]. Mt. Halla showed the lowest genetic diversity (He = 0.609) compared to the other mainland populations. Therefore, we conclude that genetic drift and restricted gene flow have affected the genetic diversity of Mt. Halla.
To understand the genetic structure of populations, it is necessary to consider the interactions with the landscape and environmental features (roads, mountains, and deforested areas) as well as microevolution factors, such as gene flow, genetic drift, and selection [59]. According to a comparative simulation study on Bayesian clustering methodology, it has been suggested that spatially explicit Bayesian clustering analysis should be performed to minimize interpretation errors for species in which populations are continuously distributed [60]. When comparing the two types of Bayesian clustering analysis results, spatially explicit Bayesian clustering depicted the structure between populations. However, hierarchical AMOVA showed weak genetic differentiation between clusters with no geographic patterns identified among the clusters. This is consistent with the weak correlation between geographic and genetic distance.
Wind-pollinated species have a large effective size and weak geographic structure due to extensive pollen-mediated gene flow [61]. As such, the habitat range of P. densiflora extends from mountainous areas to those near human habitats, and can thus be influenced by evolutionary factors and by human activities. Indeed, human activities and changes in land use have been reported to affect the genetic diversity and genetic structure of P. densiflora in Japan [34]. Those authors discussed that agricultural activities have created an open gap in the landscape and caused the rapid expansion of the Pinus forest. In cluster 4-III in our study, Mt. Geumo (code 33), Angang (code 35), and Goseong (code 54) were estimated to have highly significant inbreeding coefficients (Table 1). There was a deficiency in heterozygotes in the population that did not result from bottlenecks (Table 3). Although empirical evidence is lacking, a history of disturbance was detected in these studies. Until the 1970s, residents were logging and cultivating in these regions [62], and in 1994 a forest fire destroyed 12 ha of pine forests. According to recent studies, broad-leaved oak trees are widely distributed and Larix kaempferi has been planted [63]. Additionally, Angang is a region that was heavily impacted by the initial spread of pine wilt disease [64], and in the late 1990s the dieback of pine trees was observed [12]. In 2009, a large-scale dieback in an area of 8416 ha began in the southern regions, including Goseong and Kimhae, which is still ongoing to date.

4.4. Implication for Forest Conservation and Management of P. densiflora

According to the climate change scenario (RCP 8.5), 18.7% of P. densiflora forests are expected to decrease by 2070 [65]. In addition, the spread of pine nematode disease, large-scale forest fires, and increases in the area of human activity are causes of forest decline. P. densiflora is the most widely distributed species in the Republic of Korea, highlighting the difficulty associated with conserving all populations effectively. Therefore, it is important to establish strategies for the conservation of genetic diversity and sustainable management of species, which can be used to select a conservation-priority population based on the genetic diversity and genetic structure of P. densiflora. The selected population can be designated as a protected area, and it should be conserved and managed over the long term at the national level. Breeding strategies that consider genetic diversity are also important for supplying seeds and sustainable management.
Certain limitations were noted in the current study. For instance, the genetic diversity and structure of P. densiflora populations were investigated using microsatellite markers, revealing neutral microsatellite variation. However, it is not possible to detect associations using adaptation traits. Therefore, to develop a strategy for the sustainable conservation of P. densiflora that withstands climate change, it is necessary to develop DNA markers and estimate genetic variations related to adaptation. Accordingly, genomic studies on P. densiflora and the development of SNP markers related to adaptive traits are underway. However, research on population-level application will require additional studies.

5. Conclusions

This is the first study to use microsatellite markers to estimate the genetic diversity, genetic differentiation, and genetic structure of P. densiflora populations in the Republic of Korea. Compared to other species with similar life-history traits, we identified high genetic diversity and low genetic differentiation, and a weak geographic structure was observed for the genetic structure of population. These results can be attributed to the continuous distribution of populations and the extensive gene flow between populations by wind dispersal. Although a weak genetic structure was detected, we believe that the results should be of practical significance concerning the current state of species and landscape-based ecological perspectives. P. densiflora in the Republic of Korea continues to be affected by various disturbances, including forest fires, clearing a large number of trees infected with Pinus disease, and dieback. As climate change continues, pine forests are predicted to decrease, which will alter their genetic diversity and structure in response to the continued decrease in the effective size of the population. Our study provides insights into the genetic diversity and genetic structure of P. densiflora and will prove valuable for establishing strategies for conservation, management, and breeding in response to future environmental changes.

Supplementary Materials

The following are available online at https://www.mdpi.com/article/10.3390/f12060750/s1, Table S1: Probability values of 60 P. densiflora populations from bottleneck test, Table S2: Pairwise FST values among populations of P. densiflora, Figure S1: Mantel test results between population differentiation (FST) and geographic distance based on the isolation by distance (IBD).

Author Contributions

Experimental design, J.-Y.A. and K.-N.H.; investigation, J.-Y.A., J.-W.L. and K.-N.H.; formal analysis, J.-Y.A.; project administration, K.-N.H.; supervision, K.-N.H.; writing—original draft, J.-Y.A.; writing—review and editing, J.-Y.A. and J.-W.L. All authors have read and agreed to the published version of the manuscript.

Funding

This research was funded by the National Institute of Forest Science of the Republic of Korea (grant number: “FG0602-2019-01”).

Data Availability Statement

The data presented in this study are available on request from the corresponding author.

Acknowledgments

We would like to acknowledge all the people who helped us with the sampling.

Conflicts of Interest

The authors declare no conflict of interest.

References

  1. Park, J.H. Chapter II Forest Resource-Forest area and growing stock by key tree species. In Statistical Yearbook of Forestry, 50th ed.; Lim, S.S., Ed.; Korea Forest Service: Dajeon, Korea, 2020; p. 162. [Google Scholar]
  2. Kong, W.S.; Lee, S.G.; Park, H.N.; Lee, Y.M.; Oh, S.H. Time-spatial distribution of Pinus in the Korean peninsula. Quat. Int. 2014, 344, 43–52. [Google Scholar] [CrossRef]
  3. IUCN Red list Pinus densiflora. Available online: https://dx.doi.org/10.2305/IUCN.UK.2013-1.RLTS.T42355A2974820.en (accessed on 15 February 2020).
  4. Szmidt, A.E.; Wang, X.R. Molecular systematics and genetic differentiation of Pinus sylvestris (L.) and P. densiflora (Sieb. et Zucc.). Theor. Appl. Genet. 1993, 86, 159–165. [Google Scholar] [CrossRef]
  5. Kim, Z.S. Science of Pinus densiflora: From DNA to Management; Korea University Press: Seoul, Korea, 2014; p. 404. [Google Scholar]
  6. Cho, H.J.; Lee, C.B. Vegetation types and diversity patterns of Pinus densiflora forests in South Korea. J. Korean For. Soc. 2011, 100, 118–123. [Google Scholar]
  7. Hong, Y.P.; Kwon, H.Y.; Kim, I.S. I-SSR markers revealed inconsistent phylogeographic patterns among populations of Japanese red pine in Korea. Silvae Genet. 2007, 56, 22–26. [Google Scholar] [CrossRef] [Green Version]
  8. Kamada, M.; Nakagoshi, N. Pine forest structure in a human-dominated landscape system in Korea. Ecol. Res. 1993, 8, 35–46. [Google Scholar] [CrossRef]
  9. Bae, J.S. A study on the system and the development of Pine Policy in the Late Chosun era. Korean J. For. Econ. 2002, 10, 22–50. [Google Scholar]
  10. Kim, J.W. What is the problem about Pinus densiflora in Korea? Through Pine Wilt Disease (Bursaphelenchus xylophilus) and Wildfire of East coast. Korean J. Environ. Ecol. 2005, 28, 113–120. [Google Scholar] [CrossRef]
  11. Lee, S.Y.; Jun, K.W.; Lee, M.W.; Chun, K.W. Mortality in Pine stand and vegetation recovery after Forest Fire. Korean Soc. Hazard Mitig. 2008, 8, 71–79. [Google Scholar]
  12. Kim, E.S.; Lee, B.R.; Kim, J.B.; Cho, N.H.; Lim, J.H. Risk assessment of Pine Tree Dieback in Sogwang-Ri, Uljin. J. Korean For. Soc. 2020, 109, 259–270. [Google Scholar]
  13. Uyeki, H. On the Physiognomy of Pinus densiflora Growing in Korea and Silvicultural Treatment for its Improvement. In Bulletin of the Agricultural and Forestry College, Suigen, Chosen; Suwon College of Agriculture and Forestry: Suwon, Korea, 1928; p. 263. [Google Scholar]
  14. Lee, S.W.; Jang, S.S.; Jang, K.H.; Kim, C.S. Estimation of mating system parameters in the natural population of Pinus densiflora of Anmyun Island, Korea using allozyme markers. J. Korean For. Soc. 2003, 92, 121–128. [Google Scholar]
  15. Yim, K.B.; Kim, Z.S. The variation of natural population of Pinus densiflora S. et Z. in Korea (I)-Characteristics of needle and wood of Chuwang-san, An-Myeon-Do and Odae-san populations. J. Korean For. Soc. 1975, 28, 1–20. [Google Scholar]
  16. Yi, J.S.; Song, J.H.; Han, S.S.; Park, W.G. The variation of natural populations of Pinus densiflora S. et Z. in Kangwondo-The morphological characteristics of needle and cone. J. For. Environ. Sci. 1999, 15, 107–116. [Google Scholar]
  17. Lee, C.H.; Shin, C.H.; Kim, K.S. Geographic variation in needle characteristics of Pinus densiflora in Korea. Korean J. Plant. Res. 2007, 20, 336–341. [Google Scholar]
  18. Kim, I.S.; Ryu, K.O.; Song, J.H.; Kim, T.S. Geographic variation in survival rate and height growth of Pinus densiflora S. et Z. in Korea. J. Korean For. Soc. 2005, 94, 73–81. [Google Scholar]
  19. Kim, Z.S.; Lee, S.W. Genetic Diversity of Three Native Pinus Species in Korea. In Population Genetics and Genetic Conservation of Forest Trees; Baradat, P., Adams, W.T., Müller-Starck, G., Eds.; SPB Publishing: Amsterdam, The Netherland, 1994; pp. 211–218. [Google Scholar]
  20. Kim, Y.Y.; Hyun, J.O.; Hong, K.N.; Choi, T.B.; Kim, K.S. Genetic variation of natural populations of Pinus densiflora in Korea based on RAPD marker analysis. Korean J. Breed. Sci. 1995, 27, 23–48. [Google Scholar]
  21. Balloux, F.; Lugon-Moulin, N. The estimation of population differentiation with microsatellite markers. Mol. Ecol. 2002, 11, 155–165. [Google Scholar] [CrossRef] [Green Version]
  22. Hamrick, J.L.; Godt, M.J.W.; Gonzales, E. Conservation of genetic diversity in old-growth forest communities of the southeastern United States. Appl. Veg. Sci. 2006, 9, 51–58. [Google Scholar] [CrossRef]
  23. Porth, I.; El-Kassaby, Y.A. Assessment of the genetic diversity in forest tree populations using molecular markers. Diversity 2014, 6, 283–295. [Google Scholar] [CrossRef] [Green Version]
  24. Liewlaksaneeyanawin, C.; Ritland, C.E.; El-Kassaby, Y.A.; Ritland, K. Single-copy, species-transferable microsatellite markers developed from loblolly pine ESTs. Theor. Appl. Genet. 2004, 109, 361–369. [Google Scholar] [CrossRef]
  25. Ahn, J.Y.; Lee, J.W.; Lim, H.Y.; Hong, K.N. Genetic diversity and structure of Prunus padus populations in South Korea based on AFLP markers. For. Sci. Technol. 2020, 16, 171–179. [Google Scholar] [CrossRef]
  26. Watanabe, A.; Iwaizumi, M.G.; Ubukata, M.; Kondo, T.; Lian, C.; Hogetsu, T. Isolation of microsatellite markers from Pinus densiflora Sieb. et Zucc. using a dual PCR technique. Mol. Ecol. Notes 2006, 6, 80–82. [Google Scholar] [CrossRef]
  27. Lian, C.; Miwa, M.; Hogetsu, T. Isolation and characterization of microsatellite loci from the Japanese red pine, Pinus densiflora. Mol. Ecol. 2000, 9, 1186–1188. [Google Scholar] [CrossRef] [PubMed]
  28. Chung, H.; Lee, J.B.; Gil, J.S.; Um, Y.R.; Kim, J.H.; Hwang, M.Y.; Kim, H.B.; Hong, C.P.; Park, S.G.; Shim, D.H.; et al. Development of polymorphic SSR markers from Pinus densiflora (Pinaceae) natural population in Korea. Plant. Breed. Biotechnol. 2019, 7, 67–71. [Google Scholar] [CrossRef]
  29. Van Oosterhout, C.; Hutchinson, W.F.; Wills, D.P.M.; Shipley, P.F. MICRO-CHECKER: Software for identifying and correcting genotyping errors in microsatellite data. Mol. Ecol. Notes 2004, 4, 535–538. [Google Scholar] [CrossRef]
  30. Marshall, T.C.; Slate, J.; Kruuk, L.; Pemberton, J.M. Statistical confidence for likelihood-based paternity inference in natural populations. Mol. Ecol. 1998, 6, 639–655. [Google Scholar] [CrossRef] [Green Version]
  31. Peakall, R.; Smouse, P.E. GENEALEX 6: Genetic analysis in Excel. Population genetic software for teaching and research. Mol. Ecol. Notes 2006, 6, 288–295. [Google Scholar] [CrossRef]
  32. Goudet, J. FSTAT Program to Estimate and Test Gene Diversities and Fixation Indices (Version 2.9.3.2). Available online: http://www2.unil.ch/popgen/softwares/fstat.html (accessed on 30 June 2020).
  33. Piry, S.; Luikart, G.; Cornuet, J.M. BOTTLENECK: A program for detecting recent effective population size reductions from allele data frequencies. J. Hered. 1999, 90, 502–503. [Google Scholar] [CrossRef]
  34. Iwaizumi, M.G.; Tsuda, Y.; Ohtani, M.; Tsumura, Y.; Takahashi, M. Recent distribution changes affect geographic clines in genetic diversity and structure of Pinus densiflora natural populations in Japan. For. Ecol. Manag. 2013, 304, 407–416. [Google Scholar] [CrossRef]
  35. Pritchard, J.K.; Stephens, M.; Donnelly, P. Inference of Population Structure Using Multilocus Genotype Data. Genetics 2000, 155, 945–959. [Google Scholar] [CrossRef] [PubMed]
  36. Evanno, G.; Reanaut, S.; Goudet, J. Detecting the number of clusters of individuals using the software STRUCTURE: A simulation study. Mol. Ecol. 2005, 14, 2611–2620. [Google Scholar] [CrossRef] [PubMed] [Green Version]
  37. Earl, D.A.; vonHoldt, B.M. STRUCTURE HARVESTER: A website and program for visualizing STRUCTURE output and implementing the Evanno method. Conserv. Genet. Resour. 2012, 4, 359–361. [Google Scholar] [CrossRef]
  38. Jakobsson, M.; Rosenberg, N.A. CLUMPP: A cluster matching and permutation program for dealing with label switching and multimodality in analysis of population structure. Bioinformatics 2007, 23, 1801–1806. [Google Scholar] [CrossRef] [PubMed] [Green Version]
  39. Rosenberg, N.A. Distruct: A program for the graphical display of population structure. Mol. Ecol. Notes 2003, 4, 137–138. [Google Scholar] [CrossRef]
  40. Guillot, G.; Mortier, F.; Estoup, A. GENLAND: A computer package for landscape genetics. Mol. Ecol. Notes 2005, 5, 712–715. [Google Scholar] [CrossRef]
  41. Moriguchi, Y.; Kang, K.S.; Lee, K.Y.; Lee, S.W.; Kim, Y.Y. Genetic variation of Picea jezoensis populations in South Korea revealed by chloroplast, mitochondrial and nuclear DNA markers. J. Plant. Res. 2009, 122, 153–160. [Google Scholar] [CrossRef]
  42. Hong, Y.P.; Ahn, J.Y.; Kim, Y.M.; Yang, B.H.; Song, J.H. Genetic variation of nSSR markers in natural populations of Abies koreana and Abies nephrolepis in South Korea. J. Korean For. Soc. 2011, 100, 577–584. [Google Scholar]
  43. Nybom, H. Comparison of different nuclear DNA markers for estimating intraspecific genetic diversity in Plants. Mol. Ecol. 2004, 13, 1143–1155. [Google Scholar] [CrossRef] [PubMed]
  44. Ozawa, H.; Watanabe, A.; Uchiyama, K.; Saito, Y.; Ide, Y. Influence of long-distance seed dispersal on the genetic diversity of seed rain in fragmented Pinus densiflora populations relative to pollen-mediated gene flow. J. Hered. 2013, 104, 465–475. [Google Scholar] [CrossRef] [PubMed] [Green Version]
  45. Lian, C.; Miwa, M.; Hogetsu, T. Outcrossing and paternity analysis of Pinus densiflora (Japanese red pine) by microsatellite polymorphism. Heredity 2001, 87, 88–98. [Google Scholar] [CrossRef] [PubMed] [Green Version]
  46. Belletti, P.; Ferrazzini, D.; Piotti, A.; Monteleone, I.; Ducci, F. Genetic variation and divergence in Scots Pine (Pinus sylvestris L.) within its natural range in Italy. Eur. J. For. Res. 2012, 131, 1127–1138. [Google Scholar] [CrossRef] [Green Version]
  47. Tong, Y.W.; Lewis, B.J.; Zhou, W.M.; Mao, C.R.; Wang, Y.; Zhou, L.; Yu, D.P.; Dai, L.M.; Qi, L. Genetic diversity and population structure of natural Pinus koraiensis populations. Forests 2020, 11, 39. [Google Scholar] [CrossRef] [Green Version]
  48. Whitney, T.D.; Gandhi, K.J.K.; Hamrick, J.L.; Lucardi, R.D. Extant population genetic variation and structure of eastern white pine (Pinus strobus L.) in the Southern Appalachians. Tree Genet. Genomes 2019, 15, 1–19. [Google Scholar] [CrossRef]
  49. Tóth, E.G.; Tremblay, F.; Housset, J.M.; Bergeron, Y.; Carcaillet, C. Geographic isolation and climatic variability contribute to genetic differentiation in fragmented populations of the long-lived subalpine conifer Pinus cembra L. in the western Alps. BMC Evol. Biol. 2019, 19, 1–17. [Google Scholar] [CrossRef] [Green Version]
  50. Vogl, C.; Karhu, A.; Morgan, G.; Savolainen, O. High resolution analysis of mating systems: Inbreeding in natural populations of Pinus radiata. J. Evol. Biol. 2002, 15, 433–439. [Google Scholar] [CrossRef]
  51. Thomas, B.R.; Macdonald, S.E.; Hicks, M.; Adams, D.L.; Hodgetts, R.B. Effects of reforestation methods on genetic diversity of lodgepole pine: An assessment using microsatellite and randomly amplified polymorphic DNA markers. Theor. Appl. Genet. 1999, 98, 793–801. [Google Scholar] [CrossRef]
  52. Potter, K.M.; Jetton, R.M.; Dvorak, W.S.; Hipkins, V.D.; Rhea, R.; Whittier, W.A. Widespread inbreeding and unexpected geographic patterns of genetic variation in eastern hemlock (Tsuga canadensis), an imperiled North American conifer. Conserv. Genet. 2012, 13, 475–498. [Google Scholar] [CrossRef] [Green Version]
  53. Han, S.D.; Hing, Y.P.; Yang, B.H.; Lee, S.W.; Kim, C.S. Estimation of mating system parameters in the natural population of Pinus densiflora of Mt. Juwang. Proc. J. Korean For. Soc. 2004, 315–316. [Google Scholar]
  54. Kim, Y.M.; Hong, K.N.; Park, Y.J.; Hong, Y.P.; Park, J.I. Estimating the parameters of pollen flow and mating system in Pinus densiflora population in Buan, South Korea, using microsatellite markers. Korean J. Plant. Res. 2015, 28, 101–110. [Google Scholar] [CrossRef] [Green Version]
  55. Myking, T. Evaluating genetic resources of forest trees by means of life history traits-a Norwegian example. Biodivers. Conserv. 2002, 11, 1681–1696. [Google Scholar] [CrossRef]
  56. Iwaizumi, M.G.; Takahashi, M.; Watanabe, A.; Ubukata, M. Simultaneous evaluation of paternal and maternal immigrant gene flow and the implications for the overall genetic composition of Pinus densiflora dispersed seeds. J. Hered. 2010, 101, 144–153. [Google Scholar] [CrossRef] [PubMed] [Green Version]
  57. Dolezal, J.; Altman, J.; Kopecky, M.; Cerny, T.; Janecek, S.; Bartos, M.; Petrik, P.; Srutek, M.; Leps, J.; Song, J.S. Plant diversity changes during the postglacial in East Asia: Insights from forest refugia on Halla volcano, Jeju Island. PLoS ONE 2012, 7, e33065. [Google Scholar]
  58. Karhu, A.; Vogl, C.; Moran, G.F.; Bell, J.C.; Savolainen, O. Analysis of microsatellite variation in Pinus radiata reveals effects of genetic drift but no recent bottlenecks. J. Evol. Biol. 2006, 19, 167–175. [Google Scholar] [CrossRef]
  59. Manel, S.; Schwartz, M.K.; Luikart, G.; Taberlet, P. Landscape genetics: Combining landscape ecology and population genetics. Trends Ecol. Evol. 2003, 18, 189–197. [Google Scholar] [CrossRef]
  60. Frantz, A.C.; Cellina, S.; Krier, A.; Schley, L.; Burke, T. Using spatial Bayesian methods to determine the genetic structure of a continuously distributed population: Clusters or isolation by distance? J. Appl. Ecol. 2009, 46, 493–505. [Google Scholar] [CrossRef]
  61. Sork, V.L.; Smouse, P.E. Genetic analysis of landscape connectivity in tree populations. Landsc. Ecol. 2006, 21, 821–836. [Google Scholar] [CrossRef]
  62. Che, S.H.; Kim, W. Comparison of Plant community structures in cut and uncut areas at burned area of Mt. Gemo-san. J. Korean For. Soc. 1997, 86, 509–520. [Google Scholar]
  63. Kim, H.S.; Park, G.S.; Lee, S.M.; Lee, J.K. Analysis on the Correlation Between Vegetation Structure and Environment Factors of the Geumosanseong-inside in Geumosan Provincial Park, in Korea. J. Korean Soc. Environ. Restor. Technol. 2020, 23, 49–67. [Google Scholar]
  64. Ahn, S.H.; Jeon, M.J.; Eom, Y.G.; Oh, S.C.; Lee, M.R. Wood Anatomical Characteristics of Domestic Red Pine (Pinus densiflora) Infested by Pine wood Nematode (Bursaphelenchus xylophilus). J. Korean Wood Sci. Technol. 2011, 39, 15–20. [Google Scholar] [CrossRef]
  65. Cho, N.H.; Kim, E.S.; Lee, B.R.; Lim, J.H.; Kang, S.K. Predicting the potential distribution of Pinus densiflora and analyzing the Relationship with Environmental variable using MaxEnt model. Korean J. Agric. For. Meteorol. 2020, 22, 47–56. [Google Scholar]
Figure 2. Principal coordinates analysis for P. densiflora populations. Axis 1 and axis 2 explain 40.99 and 11.70% of the genetic variation, respectively.
Forests 12 00750 g002
Figure 3. Results of Bayesian clustering analysis using Structure. (a) The mean log-likelihood value (± standard deviation) of the data was based on ten repetitions for each K value. (b) The delta K value was changed with each K value. (c) The proportion of cluster membership at the population level in the 60 P. densiflora populations, assuming K = 5. Each vertical line represents a population. The numbers on the x-axis represent each population’s code in Table 1.
Forests 12 00750 g003
Figure 4. Result of Bayesian clustering analysis using Geneland. The proportion of cluster membership at the population level in the 60 P. densiflora populations, assuming K = 4. Each vertical line represents a population. The numbers on the x-axis represent each population’s code in Table 1.
Forests 12 00750 g004
Table 1. Sampling locations and genetic diversity parameters estimated from 60 P. densiflora populations in the Republic of Korea.
CodePopulationLatitude (N°)Longitude (E°)NAAeARHoHeFIS
1Mt. Seorak38.13128.29308.5 4.3 6.9 0.6120.6610.091 ***
2Yanggu38.09128.03217.7 4.1 6.7 0.7070.685−0.007
3Inje38.06128.34449.3 4.4 6.7 0.6210.6890.111 ***
4Mt. Hwaak38.03127.52309.4 4.2 7.0 0.6540.6720.044
5Gangneung37.83128.72369.5 4.7 7.0 0.6640.6840.044
6Mt. Odae37.81128.57358.3 4.3 6.4 0.6450.6590.037
7Hongcheon37.74128.34359.2 4.3 6.8 0.6450.6840.071 **
8Kimpo37.74126.54308.4 3.9 6.6 0.5890.6370.093 **
9Kanghwado37.63126.42369.0 4.7 6.9 0.6750.6810.024
10Yangpyeong37.55127.58309.5 4.4 7.0 0.6750.661−0.004
11Hoengseong37.52128.27318.7 4.7 6.9 0.6420.6660.052 *
12Mt. Gwanak37.43126.97319.2 4.5 7.0 0.7120.676−0.037
13Samcheok37.29129.32308.5 4.2 6.6 0.6360.6450.031
14Pyeongchang37.28128.56308.6 4.9 6.9 0.6600.6720.035
15Wonju37.27127.94288.4 4.4 6.8 0.6370.6580.049 *
16Ujin Deoguri37.07129.28409.4 4.6 6.7 0.6640.6780.033
17Bonghwa37.05128.98409.4 4.5 6.9 0.6390.6770.069 **
18Uljin Sokwangri37.01129.20399.3 4.6 6.8 0.6430.6710.055 **
19Youngju37.00128.694010.0 4.3 7.0 0.6750.6870.030
20Uljin Sugokri36.95129.32369.5 5.1 7.2 0.6660.6760.029
21Chunan36.84127.20298.9 4.5 7.0 0.6700.6880.044
22Goesan36.63127.90278.4 4.3 6.8 0.5940.6510.106 ***
23Andong36.52128.88318.4 4.8 6.6 0.6280.6410.037
24Boeun36.52127.82308.7 4.7 6.9 0.6120.6460.069 **
25Anmyeondo36.49126.36439.5 4.5 6.7 0.6300.6670.067 **
26Boryeong36.42126.61369.3 4.5 6.9 0.6700.6650.006
27YoungYang36.55129.19217.6 4.3 6.7 0.6630.6670.030
28Cheongsong36.41129.18459.7 4.5 7.0 0.6970.6900.001
29Mt. Juwang36.39129.15298.7 4.4 6.9 0.6240.6600.072 **
30Gumi36.28128.28308.1 4.3 6.5 0.6810.6840.022
31Daejeon36.28127.45157.7 4.7 7.6 0.6420.6930.107 **
32Seocheon36.12126.67309.8 4.7 7.4 0.6620.6870.053 *
33Mt. Geumo36.10128.322910.0 5.3 7.9 0.6470.7280.128 ***
34Geumsan36.11127.37218.1 4.3 7.1 0.6310.6750.090 **
35Angang35.97129.202710.0 5.2 8.1 0.5990.7250.193 ***
36Mt. Weebong35.91127.26217.8 4.4 6.9 0.6580.6570.023
37Mt. Deogyu35.84127.71309.5 4.7 7.3 0.6670.6880.047
38Mt. Gaya35.82128.12278.6 5.0 7.1 0.6900.6830.009
39Gyeongju35.81129.23308.8 4.5 6.8 0.6080.6330.057 *
40Mt. Daeguap35.81128.583710.1 4.8 7.2 0.6850.660−0.024
41Daegu35.79128.65207.5 4.8 6.7 0.6450.6450.025
42Geochang35.76127.83289.2 4.8 7.2 0.6460.6660.048
43Jinan35.76127.42308.9 4.9 7.0 0.6850.6810.011
44Mt. Biseul35.72128.51309.3 4.8 7.3 0.6110.6880.129 ***
45Buan35.67126.63429.9 5.0 7.1 0.6880.6950.023
46Ulju35.55129.02258.5 4.9 7.0 0.6380.6660.054 *
47Mt. Naejang35.50126.90319.4 4.5 7.0 0.6250.6580.066 **
48Mt. Jiri35.37127.57309.4 4.5 7.2 0.6940.6840.002
49Uiryeong35.31128.27308.8 4.7 7.0 0.7090.695−0.003
50Yeonggwang35.20126.54309.1 4.7 7.0 0.6290.6680.075 **
51Kimhae35.19128.752910.0 5.5 8.0 0.6970.7330.066 **
52Hadong35.09127.77309.9 5.0 7.5 0.6450.7000.095 **
53Gadeokdo35.02128.83289.5 4.6 7.3 0.6510.6840.067 *
54Goseong34.98128.212810.0 5.1 8.0 0.6600.7150.096 ***
55Suncheon34.97127.22187.3 4.4 6.6 0.6830.648−0.024
56Hwasun34.90126.92308.1 4.4 6.6 0.6420.6760.067 *
57Yeongam34.75126.67298.5 4.3 6.9 0.6550.6470.005
58Goheung34.52127.13309.5 4.8 7.3 0.7030.688−0.005
59Wando34.34126.64309.6 4.4 7.2 0.6180.6610.081 **
60Mt. Halla33.41126.54366.5 3.3 5.0 0.6060.6090.019
Mean 8.9 4.6 7.0 0.6520.6730.048
Sample size (N), number of alleles (A), number of effective alleles (Ae), allele richness (AR), observed heterozygosity (Ho), expected heterozygosity (He), inbreeding coefficient (FIS). Significant deviation from Hardy–Weinberg equilibrium (* p < 0.05, ** p < 0.01, *** p < 0.001).
Table 2. Primer information for eleven microsatellite markers.
LocusPrimer Sequence (5′→3′)Repeat MotifRange (bp)Ta (°C)NaPICReference
Pdms009F: FAM-CAATGAGTAGAAGATCATGGTGG(CT)31(CA)20130–19852340.888Watanabe et al. 2006
R: CTAGGGAGCCGCATTTACAC
Pdms030F: FAM-GATCACTGTAGGAAGGCTGG(CA)12CT(CA)598–12252130.502Watanabe et al. 2006
R: TGGGAAGAGGACAACCTGAG
Pdms065F: FAM-GTCAGAAGCCTTATACTGTG(TG)3TATAN10(TG)9(AG)10149–19352210.352Watanabe et al. 2006
R: TTGTAAATTCAAATGTAGCC
Pdms221F: FAM-GAGAGTTGTATGACGGAAATAC(GA)9G3(GA)5169–1835280.549Watanabe et al. 2006
R: CCCACACAAAAGTGTACTTC
Pde14F: FAM-TCATAGGTACAAAGTCATTACACC(TC)18(AC)14179–26152300.881Lian et al. 2000
R: CTTCCCCACTTGACTTGAAGT
Lop5F: FAM-AGCCGTAAAAGCTATCTTGTG(TA)33162–19045130.314Liewlaksaneeyanawin et al. 2004
R: GGCATACTTACATTTTAATAA
CPDE0039F: FAM-TTCCAAGAACTCCTGGCTCT(AT)15163–25756400.912Chung et al. 2019
R: GGGAACAGGTCCTCATTTCT
CPDE0058F: FAM-CAGTGGTCCACCACACTAACT(TA)10167–19356120.742Chung et al. 2019
R: GTGTGGACCATGTAAGGTATGC
CPDE0060F: FAM-ATTGATGCATGGCACCTG(GT)16136–1625614 0.710Chung et al. 2019
R: ACAGGAGTTCCGATGAGGTT
CPDE0076F: CTCAACTGGCCACTGTAGAACT(GA)9182–21256120.656Chung et al. 2019
R: AAGGTTCAGGTTGGCATC
CPDE0106F: FAM-CAGATGTTAATCTGGTAGCCCC(AT)11156–18656160.799Chung et al. 2019
R: CACCTAAGTTGCCACAATGC
Number of alleles per locus (Na), polymorphism information content per locus (PIC), the forward primers were labeled with a fluorescent dye (FAM) [26,27,28].
Table 3. Hierarchical AMOVA of P. densiflora populations.
AnalysisSource of VariationDfSum of SquaresVariance ComponentPercentage of Variation (%)
Hierarchical AMOVA (including Mt. Halla)Between cluster3151.6720.1171.4 **
Among populations56540.7490.0510.6
Within populations178414,419.0348.08298.0
Total184315,111.4568.251100
Hierarchical AMOVA (except Mt. Halla)Between cluster279.8010.0610.74 **
Among populations56540.7490.0510.62
Within populations174914,176.8398.10698.64
Total184314,797.3898.217100
The number of clusters presented is based on Geneland analysis. ** indicates a significant result (p < 0.01).
Publisher’s Note: MDPI stays neutral with regard to jurisdictional claims in published maps and institutional affiliations.

