1. Introduction
Forest resource is an important sector in the economy of British Columbia (BC) and Canada. While the available wood supply has decreased due to increased pest outbreaks and forest fires associated with climate change [
1], sawmills need to improve their process efficiency to face the increasing demand of domestic and export wood products [
2] and remain competitive on the global market. Sawmills therefore need to produce a larger yield of lumber and/or higher quality products. From the timber supply aspect, larger and straighter trees with less knots are desired to achieve the lumber production goals. Wood quality, including knot characteristics, wood density, and the proportion of juvenile wood can be significantly improved by implementing silvicultural practices such as initial stand density [
3,
4], thinning [
5,
6,
7,
8,
9], pruning [
10,
11,
12], fertilization [
13,
14]. Combined with genetic improvement of planting stock, these forest management practices could markedly contribute to increase the available forest resources by accelerating volume production of superior trees, and provide sawmills with a higher quality raw material.
For sawmills in BC, the level or type of technology implemented to increase product recovery depends on the type of sawmills (i.e., Interior or Coastal), their product structure and production goals (i.e., volume or quality). In Interior mills, scanners and optimization software assess external log features to optimize the breakdown pattern. In Coastal sawmills, less technology is normally involved in the process so the productivity is slower than that of Interior mills. Computed tomography (CT) scanning is a non-destructive technology used to detect internal features of logs and use the information (e.g., knot size and distribution) to optimize breakdown patterns to maximize lumber value. High-speed CT scanners for industrial use have been developed by Microtec (Lucidyne Technologies, Inc., Brixen, Italy) [
15] for the purpose of breakdown optimization and log sorting [
16].
Knots have an important impact on structural lumber grades as they decrease stiffness and strength by locally distorting and deviating wood fibers from the longitudinal axis of the stem, thus resulting in mechanical weak areas [
17]. In appearance-based lumber grades, esthetics is important since consumers generally prefer clear (knot-free) wood. In both applications, the presence of knots causes lumber downgrades and decreases in value. Many studies have shown that using X-ray CT scanning should increase lumber value recovery and/or volume by up to 24% [
18,
19,
20,
21,
22] because the position of the logs (i.e., rotation angle) can be optimized based on the log external shape and knots characteristics and distribution. Although the cost of an X-ray CT scanner may be prohibitive for sawmills [
23,
24], the equipment has been successfully used in research and industrial quality control applications such as measuring wood density [
25,
26,
27,
28], detecting the sapwood-heartwood border [
29,
30] as well as knots [
31,
32,
33,
34] and non-destructive testing [
35,
36,
37].
Two main species in Coastal BC are amabilis fir [
Abies amabilis (Dougl.) Forbes] and western hemlock (
Tsuga heterophylla (Raf.) Sarg.). Due to the similarity of their wood properties, they are considered as one commercial group (i.e., Hem-Fir) and accounted for 46.8% of the harvested land in 2018 [
38]. The harvested trees can be transformed into dimensional lumbers, structural laminated veneer lumbers [
39] and cross-laminated timbers [
40]. Tree attributes and wood properties were extensively analyzed in a previous research [
41].
The overall objective of the study consisted in investigating the impact of tree growth conditions on knot characteristics and how they influence the manufacturing of lumber in different types of sawmills. Specifically, the objectives were to: (1) Investigate the impact of stand density and tree diameter on knot characteristics in Coastal amabilis fir and western hemlock trees; (2) quantify how tree diameter and internal knot attributes affect sawmill lumber volume and value yield; and (3) estimate tree value based on CT-scanned knot characteristics, lumber recovery and external tree features. The hypotheses were that forest stand density impacts tree growth and internal knot characteristics the same way for Hem-Fir species and that knot characteristics and log value can be predicted from known tree features.
2. Materials and Methods
2.1. Materials
Seventy-two trees between 55 and 72 years old were selected at random but excluded decay and major defects such as fork, crook, rotten branches, dead top and a lean greater than 5°. Trees were manually felled from three stands located on Vancouver Island, British Columbia and bucked to a 10 cm top diameter. Stands 1 (49°2′ N 124°40′ W) and 3 (48°58′ N 124°39′ W) were situated in Port Alberni, while Stand 2 (50°29′ N 127°6′ W) was located in Port McNeill. Stand history, elevation, slope, stand density, site index etc., are detailed in [
41] and summarized in
Table 1. The sample under study consisted of 12 amabilis fir (
Abies amabilis (Dougl.) Forbes) and 12 western hemlock (
Tsuga heterophylla (Raf.) Sarg.) trees for each of the three DBH classes (30, 40 and 50 cm) that were studied. Stand density in those naturally regenerated forest stands ranged from 758 to 1020 stems per hectare (sph). Many attributes were measured and recorded, but this study only focused on DBH classes and the stand density of the harvested sites.
After harvesting, trees were slashed into logs having a length ranging between 2.5 and 5.5 m for further machining and testing. A total of 192 amabilis fir and 182 western hemlock logs were produced. Because the height of the trees was variable, the number of logs and their lengths varied between trees. Over 97% of the logs had a length in the 4.5–5.5 m range and 2–6 logs were slashed per tree.
Over 187,000 of X-ray CT images were obtained for the 374 logs included in this study. Cross-section scans were performed every centimeter along the longitudinal axis with an industrial CT scanner manufactured by American Science and Engineering Inc (AS&E) and located at FPInnovations in Vancouver, Canada. The scanner is built with a beam X-ray source having a fan angle of 20°, a voltage of 4 MeV and a maximum frequency of 133 Hz. The X-rays were detected by a matrix of 512 detectors, which had a length of 706 mm. The maximum log dimension that can be scanned is up to a 1 m diameter and a 5 m length. Each log was positioned upright, centered on the scanner table enclosure and pinned to the floor and then the scanner head (X-ray source and detectors) was rotated twice to make measurements from different angles and ensure all internal characteristics were detected. The physical pixel size for each cross-section was 0.605 mm/pixel and the resolution was 512 × 512 pixel. All CT images were saved as an encodable computer file format (TIFF or TIF).
2.2. Methods
2.2.1. Log Reconstruction
To reconstruct logs, each CT image was processed using the software CT2Opti [
43]. The extraction process consisted of three main steps: (1) Detecting the outer shape of the log by canny edge detector, (2) positioning the pith manually, and (3) detecting knots according to a threshold and several tomographic algorithms (e.g., erosion, opening and closing) if the knot border was unclear. False knots detection caused by wet pockets was filtered manually to guarantee the accuracy of detection. After processing, every image was connected by the
z-axis (i.e., pith) to build a complete log. Finally, the logs were converted in a format compatible with the sawmilling simulation software Optitek [
44] where they were combined into trees for breakdown (
Figure 1). Optitek is a sawmill simulation software developed by FPInnovations.
2.2.2. Simulation of Tree Breakdown
Trees were virtually sawn in Optitek. Two types of sawmill were simulated: (1) a BC Coastal sawmill and (2) a BC Interior random sawmill. Mill layouts (
Figure A1 and
Figure A2 in
Appendix A) and product list along with optimization values were provided by FPInnovations and correspond to actual BC sawmills currently in operations. Every piece of lumber virtually produced was graded according to the National Lumber Grading Association [
45]. For both sawmills, three economic scenarios, i.e., baseline, optimistic and pessimistic, were used to calculate the final product values. In this study, optimistic and pessimistic market prices were calculated by percentages of the baseline economic cycle for each grade (
Table 2). In total, all trees were virtually sawn according to six different scenarios.
2.2.3. Statistical Analysis
The statistical impact of growth history on the knot characteristics was analyzed and, based on the result, three predictive models were built (
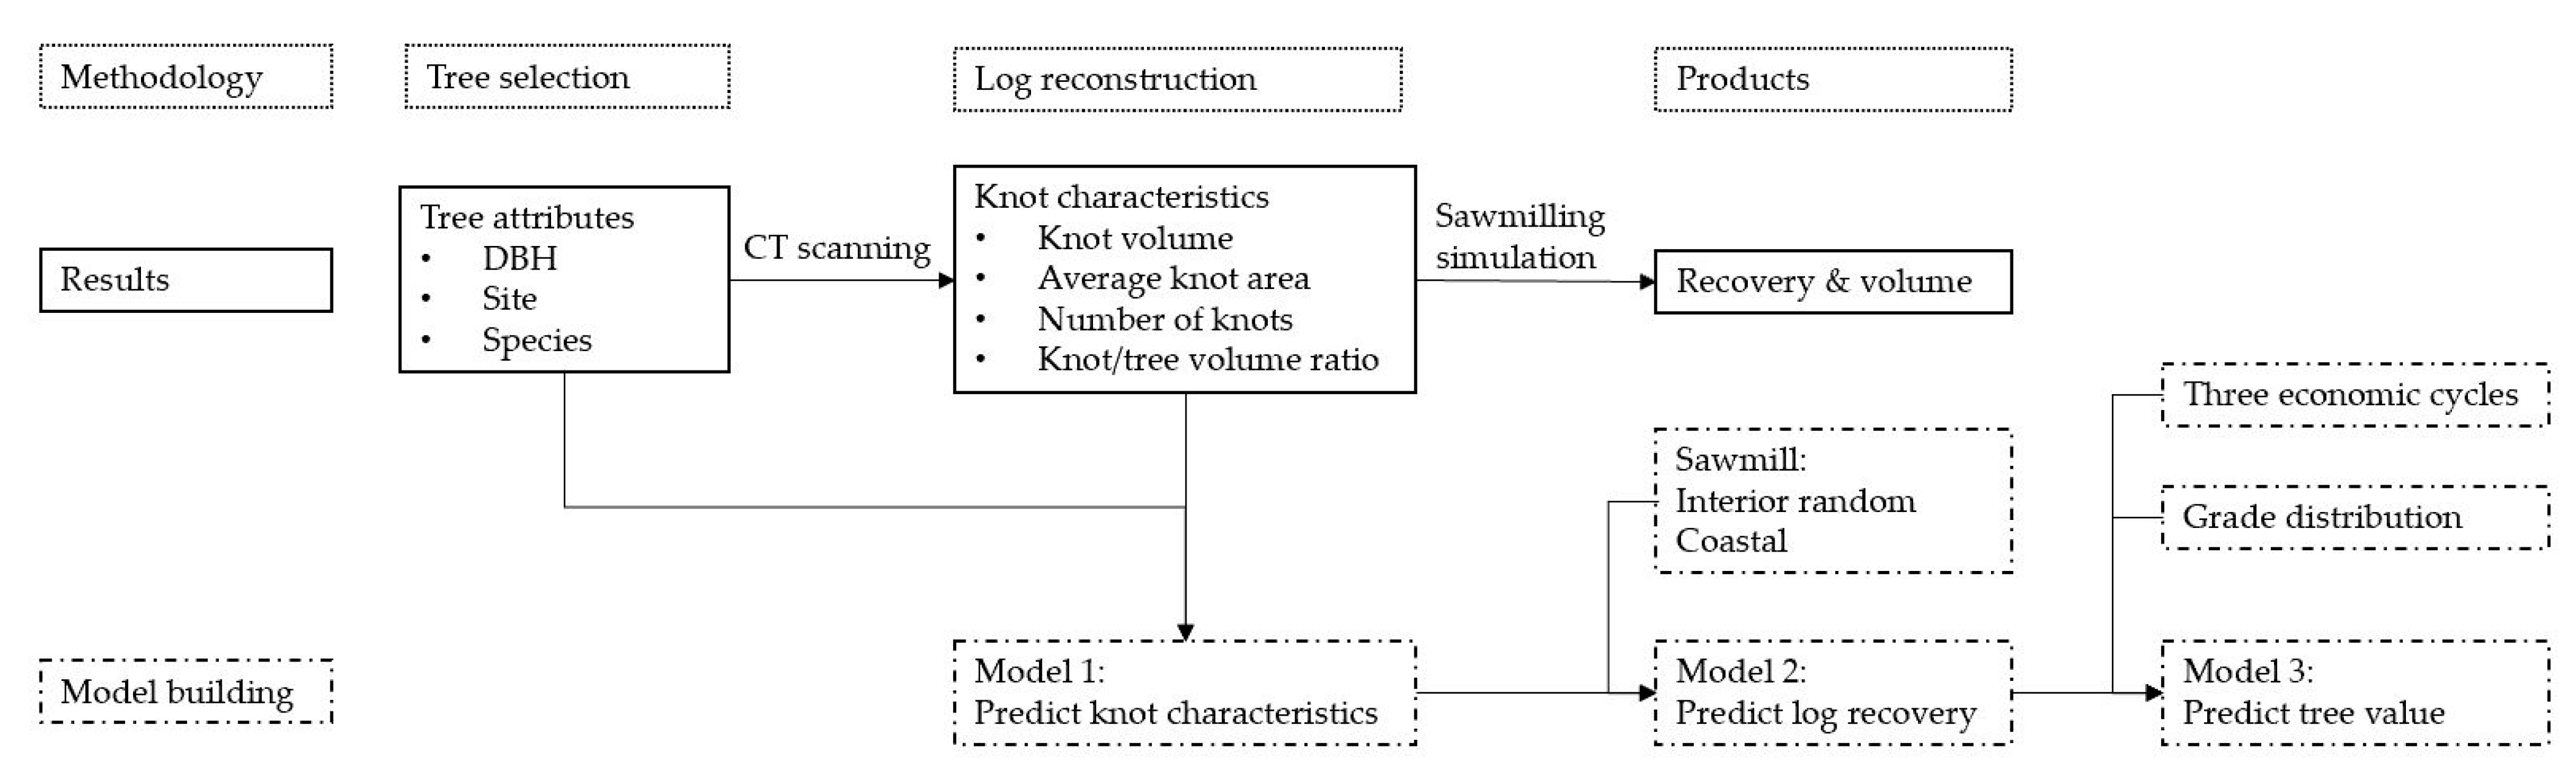
Figure 2). This strategy was adopted to evaluate the impact of growth history on three aspects of the sawmill value chain: (1) Knot characteristics, (2) lumber recovery for two sawmill types, and (3) value recovery for three economic scenarios. Data management and statistical analyses were performed with R version 3.4.0 (R Core Team 2013). For all models, assumptions were checked using diagnostic plots and only those who met the assumptions were selected for further analysis.
A randomized complete block design with mixed-effect factors was applied to assess the impact of DBH classes and sites on knot characteristics (total knot volume (KV), number of knots (NK), average knot area (KA) and knot/tree ratio (K/T)) as well as lumber volume and value recoveries. A type III analysis of variance (ANOVA) was performed. The three stands were regarded as blocks because of the heterogeneity between the three sites. The three DBH classes and two tree species were considered as independent variables. The interaction between blocks and the independent variables was evaluated at a 95% confidence interval. Because log lengths varied, the restricted estimated maximum likelihood was used to correct for the unbalanced data. Comparisons were evaluated using boxplot and p-values between groups calculated by Tukey multiple comparisons.
To develop the model predicting knot characteristics, a Pearson correlation matrix was first generated to assess the relationship between the knot characteristics extracted with CT2Opti and tree external shape measurements (e.g., DBH, height and volume). A stepwise selection of explanatory variables was used when building fixed- and mixed-effect linear models predicting knot characteristics. Three of the response variables, KV, KA and K/T, were log-transformed. For fixed-linear models, R2 was calculated to indicate the goodness of fit. For mixed-linear models, site was considered as a random effect and the Akaike information criterion (AIC) was chosen to select the best model. All assumptions were checked before determining the final models.
Linear mixed models predicting individual tree lumber recovery that were fitted by maximum likelihood were used to predict the recovery of each tree using predicted knot characteristics and sawmill type. Ten models including different variables were tested and one of them was selected first based on the AIC values and second, on the variance inflation factor (VIF) values.
To predict the individual tree value (excluding by-products), the previous models were connected using Equation (1):
The lumber distribution for each sawmill type could therefore be predicted by using tree attributes and knot characteristics. A linear mixed effect model was developed with sites as random effect. Similar to the previous two models, variables that were not significant (p > 0.05 with Type III ANOVA) were removed from the model through a stepwise selection. The value prediction model was therefore developed based on the predicted grade distribution, tree attributes, and different knot characteristics based on selection.
3. Results
3.1. Effect of Tree Growth Conditions on Knot Characteristics
Knot characteristics (i.e., KV, NK, KA and K/T) were extracted with CT2Opti and calculated based on the log model built in Optitek. The K/T was defined as the proportion of knot volume over the total volume of the reconstructed tree (without crowns), which provided an index of between tree variations. The ANOVA revealed that all knot characteristics in amabilis fir tree were not significantly affected by stand density, but significantly impacted by the DBH class (
Table 3). In contrast, the KV and KA were significantly affected by stand density and DBH class in western hemlock, while the K/T was only significantly impacted by the stand density (
Table 3).
All knot characteristics in amabilis fir trees increased with the DBH class (
Table 4). Specifically, amabilis fir trees from the 40 cm DBH class were characterized by more knots than those of the 30 cm DBH class (416 knots vs. 248 knots for Site 1). This significant increase in the NK explains the rise in KV and KA that were detected (
Table 4). The NK remained statistically similar for the 40 and 50 cm DBH class (475 knots for Site 1), although a significant increase of the KV and KA was observed (
Table 4). This could be due to branches that did not naturally self-prune in the 50 cm DBH class and stand closure that limits crown development (or the formation of new branches) as trees grow older.
Similar to amabilis fir, the KV and KA significantly increased with DBH class for western hemlock. Interestingly, Site 2 yielded western hemlock trees having larger KV and KA than the other two sites (
Table 5), but a smaller overall tree volume (4.188 m
3 for Site 2 vs. 4.442 and 4.409 m
3 for Site 1 and 3, respectively). Because the number of knots was not significantly impacted by stand density, this suggests that larger branches (i.e., knots) were grown on Site 2 (
Table 6). This could be due to the specific bioclimatic location of each site and their geomorphological characteristics. The number of knots did not significantly change with the DBH class, it could be concluded that the branches grew at a similar rate to that of the trees and that stand density was too low to promote self-pruning in the lower whorls of the trees.
3.2. Model 1: Predicting Knot Characteristics
In the selected models Equations (2)–(5) predicting knot characteristics of individual trees, DBH was significant for all response variables, while species was not significant for KA. The coefficients and standard deviations are listed in
Table 7.
where
for
tree (
).
According to the model, each 10-unit increment of DBH (cm) would be associated with a 135% and 78% increase in KV for amabilis fir and western hemlock, respectively. Based on the data, the increase in KV corresponded to an overall 155% from 30 to 40 cm and 78% from 40 to 50 cm for amabilis fir (site data pooled) (
Table 4). The discrepancy could be due to the larger KV variation present in the linear model when the DBH is close to 30 cm (not shown). A similar observation can be made for western hemlock although the model seems to fit the field measurements better since the calculated KV increased by 78% from 30 to 40 cm and 63% from 40 to 50 cm (site data pooled) (
Table 5). For this model, the adjusted R
2 was 0.73, which indicates a good fit. The variation between the models and the raw data could be due to the error terms (e
i) that accounts for the site (stand density) factor, which was not included in the models due to its low VIF value. Alternatively, these discrepancies suggest other factors such as temperature and precipitation could be considered in future iteration of the models to improve their accuracy.
The NK is a mixed-effect model and it was chosen among different models for its lowest AIC value (854.6), which indicates its accuracy. According to the model, each increment of DBH (from 30 to 50 cm) would be associated with an increase of 160 and 70 in the NK for amabilis fir and western hemlock trees, respectively. This is similar to the values obtained by CT2Opti for both amabilis fir (145) (
Table 4) and western hemlock (64) (
Table 5). The discrepancy being less than 10% suggests the model is a good fit for the data in this study.
The models for the KA are linear fixed-effect models and the adjusted R
2 was 0.67. According to the model, every 10 cm increase in DBH should result in a 56% rise in the KA for both species, as species was not significant. According to
Table 4 and
Table 5, there is a respective increase of 59% and 50% for amabilis fir and western hemlock when the DBH grows from a 30 cm class to a 40 cm class. The measured change in KA was 47% and 30% for amabilis fir and western hemlock, respectively when the DBH class further increased to 50 cm. The model therefore seemed to perform better for amabilis fir trees over the three DBH classes included in this study. For western hemlock, the model was a good fit at lower DBH. The lost in accuracy could be due to the somewhat larger variation when the DBH is close to 50 cm (not shown).
The K/T model is a mixed-effect model characterized by an AIC of 54.1. According to the model, the K/T should increase by 91% and 14% respectively for amabilis fir and western hemlock, but was 74% and 12% according to the collected data (
Table 4 and
Table 6). This suggests a relatively good fit for the western hemlock trees. This could be due to the K/T of western hemlock trees that was relatively constant over the three DBH classes, while this was not the case for the amabilis fir trees (
Table 4). This difference caused challenges in accurately modeling both species.
3.3. Sawmilling Simulation
Lumber volume recovery was extracted from the sawing simulations results as a percentage of the total volume of lumber products over the total tree volume. Overall, stand density did not have a significant effect on the lumber recovery, whereas DBH classes had a significant impact, but only in the Coastal mill for both species. The 50 cm DBH class was significantly different from the other two DBH groups and produced lower volume recovery (
Table 8). This could be due to the 50 cm DBH class being characterized by larger average knot areas (
Table 4 and
Table 5). Compared to the Interior mill, there were twice as many product types that mostly varied in length in the Coastal mill and only two grade categories, resulting in shorter products being cut from similar log volumes based on their optimization prices.
Table 9 shows the average values of amabilis fir and western hemlock in two mill types. As expected, the value increased with the DBH because of the increasing total tree volume, while stand density did not have a significant impact. The 50 cm DBH class was significantly different from the other two DBH groups and produced lower recovery of lumber but generated more value for both species. This is explained by the trimming and/or edging of knots done to improve lumber quality. As the lumber volume recovery was lower in the Coastal mill, the total value of products was also lower. Same as with the lumber volume recovery, western hemlock trees yielded a slightly lower value than amabilis fir trees (
Table 9). This difference could result from the average total log volume of amabilis fir (1.576 m
3) that was higher than that of western hemlock (1.390 m
3).
The average recovery in the generic Interior random length and Coastal mills were respectively 68% and 60% (
Figure 3) and the average value produced during the baseline economic cycle was CAD 903.40 and CAD 584.60 per tree. This could be caused by the product structure, that is simpler for the Interior random sawmill. In comparison, the Coastal mill generated a product basket having a wide range of dimensions with almost twice as many different lumber sizes than that in Interior random mill.
3.4. Model 2: Predicting Individual Tree Recovery
A linear mixed-effect model (
Table 10) was fit using the maximum likelihood. The model having the lowest AIC (715.5) among several models was selected. Each tree was processed by two different sawmill types therefore the groups of trees consist of random effect with two levels. Since knot characteristics were highly correlated with DBH and height, these two variables are not directly shown in this model.
3.5. Model 3: Predicting Individual Tree Value
To predict the value of a tree, the lumber grade distribution was first assessed (
Table 11). The DBH, height, species and predicted KA were selected amongst different combinations of independent variables according to lower AIC values and site (stand density) was considered as a random effect in the model. Similar to the simulation results, the better lumber grades predicted accounted for most products for both sawmill types.
In
Table 12, intercepts and slopes of predicting individual tree values are listed for three economic scenarios for both sawmill types. In the Coastal mill, the grade distribution was not significant in predicting tree value, so only tree attributes (e.g., DBH and height) and knot characteristics are used.
4. Discussion
4.1. Impact of Tree Growth on Knot Characteristics and Sawmill Simulations
The results indicated that the measured knot characteristics in amabilis fir trees were not significantly impacted by stand density, while western hemlock was. This could be due to trees having been harvested at a relatively young age (55–72 years old) and to the range of stand densities over the three sites that was too narrow (758, 950 and 1020 sph for site 3, 2, 1 respectively) to detect any significant differences between sites, given the high tree-to-tree variability. Alternatively, amabilis fir trees are known to be tolerant to shade [
46], and since no thinning was applied to the stands, the three stand densities were not sufficiently contrasted to detect differences in knot characteristics, meaning that competition influencing branching and knottiness was similar for all sites. It can therefore be speculated that under the Coastal Western Hemlock (CWH) Biogeoclimatic Ecological Classification (BEC) zone [
47], the growth conditions over the relatively narrow range of the stand densities studied were somewhat uniform and did not have a significant impact on amabilis fir. In contrast, stand density had a significant impact on knot characteristics in western hemlock trees. Although Site 2 had an intermediate stand density (950 sph), KV, KA and K/T were significantly larger. This particular site was located at a higher latitude (50°4′ N vs. 49° N), higher elevation (59.4 vs. 2.4 m) and on a steeper slope (25–40° vs. 0–5°). According to data from nearby weather stations over a 30 yr period (1971–2000) [
42], these small differences in site characteristics were sufficient to subject Site 2 to a slightly colder temperature (average of 8.5° vs. 9.5°) and less precipitation (average 1591.5 mm vs. 1910.7 mm). It is known that warmer temperatures positively impact growth [
48,
49] and increase the basal area increments [
50] of some species. It can therefore be speculated that western hemlock is more sensitive to access to sunlight and water than that of stand density. The hypothesis is supported by a previous study that demonstrated that western hemlock is less tolerant to shade than amabilis fir [
51].
It is known that lumber volume recovery in sawmill increases with DBH [
52]. Interestingly, the DBH class only had a significant impact in the Coastal sawmill and it was significantly lower for the 50 cm DBH class in both species (
Table 8). This could be due to the presence of larger knots that caused lumber pieces to be edged or trimmed in order to meet lumber grade requirements, but reduced the lumber volume recovery. A decreased ratio of height to diameter or an increased stem taper could also be an indicator of a lower lumber recovery factor, which was used to explain the relatively lower yield coming from the lower portion of the tree (e.g., butt log) [
53]. In this study, those two factors, height to diameter ratio and recovery, showed only a weak to moderate correlation (0.3–0.5) in the Coastal mill for both species. In parallel, the lumber value that could be extracted from each tree significantly increased with the DBH class for both species and sawmill types, which is similar to results previously reported for black spruce trees [
54]. This emphasizes the importance of log dimensions in sawmilling operations. Larger trees should yield higher volume and/or value recovery (
Table 8 and
Table 9). Furthermore, while the volume of trees increased with DBH class, the NK and K/T remained constant or grew only slightly from the 30 to 40 cm DBH groups (
Table 4,
Table 5 and
Table 6). This suggests that the presence of knots in larger DBH classes may be less important than the total tree volume in influencing the final value. Complementary to the volume and value recoveries, the better grade percentage was calculated for both mill types. In the Interior random sawmill, the better grade percentage represented the proportion of #2 and better grades, while it consisted only of the #1 grade for the Coastal mill. The better grade percentage of the latter ranged from 90% to 100% and was significantly higher than that of the former, which ranged from 75 to 85%. Although there is no evidence in the literature that knot characteristics impact the better grade percentage, these differences are likely due to the specific grade rules adopted by each sawmill type.
4.2. Prediction Models
The first model developed in this study (predicting knot characteristics) (Equations (2)–(5)) could be used to assess wood quality from standing trees. Furthermore, until CT scanners become an affordable technology widely adopted by Canadian sawmills, these models could help better estimate stand value of Hem-Fir stands grown in the CWH BEC zone in BC and provide an assessment of internal log characteristics. Thus, improving the link between stand attributes and product value. With further validation of this prediction model, the need of X-ray CT scanners in the wood industry could be reduced until such scanners become a standard in sawmilling operations. Previous research has focused on knot diameter, which is similar to KA in this study, and the growing angle of knots [
17,
52]. These could be predicted from the measurement of branches [
50]. Predicting individual knot characteristics was also investigated in 2013 [
55] using nonlinear models for black spruce and Jack pine. The independent variables included height, DBH, insertion angle of branches, branch diameters and the branch position in the tree. It is believed that the models developed in this study, using only DBH and species are much simpler and would therefore benefit from further improvement.
The second model could be used to predict lumber volume and potentially replace log scale rules since they often misestimate the expected lumber volume [
56]. Computer simulations methods are therefore recommended over empirical ones [
57]. Lumber recovery in Jack pine was predicted with a 64% accuracy with models using tree height and DBH as independent variables [
58,
59,
60]. Similarly, A study in 2009 [
60] developed four prediction models for balsam fir trees using DBH and tree height and obtained a R
2 above 0.9. In this project, the prediction of the recovery was limited to known knot characteristics, which positively contribute in accurately estimating the economic output of logs [
19,
21,
60,
61]. Although the model was based on the predicted knot characteristics and tree attributes, this method of estimating lumber recovery provides valuable insight in assessing production yield before harvesting.
The third model could be used to predict the potential value recovery that could be obtained in sawmills under different economic scenarios. Only the height and DBH are needed to estimate the value recovery from amabilis fir and western hemlock trees within the harvested area. This prediction could provide foresters with an important input when determining the rotation age. Nevertheless, it should be noted that height of the tree in this study is only the stem height, which could introduce a slight bias. If trees could be scanned using X-ray CT, the height and knot characteristics would be more accurate in predicting the recovery and value.
The models developed in this study predict knot characteristics, log volume recovery and value with only two easy measurements, DBH and stem heights, which could well-estimate the production results from harvesting or even earlier planification stage. In addition, species would affect model parameters, but the principle could be applied to other species. Although a comparison could not be done with the real-sawn data, a study indicated that including knot attributes in optimization rules would increase lumber values by 23% in jack pine and 15% in white spruce [
22]. Further studies could be done on the validation of the prediction models and assessing the impact of the cumulative error terms since an iterative modeling approach was used.
5. Conclusions
Based on the ANOVAs, amabilis fir and western hemlock trees grown in the CWH BEC zone in British Columbia, Canada have different responses to similar growth conditions, which affects the growth of branches and consequently the knot distribution. While knot characteristics increased with DBH in both species, western hemlock was more sensitive to site characteristics such as slope and elevation (Site 2). The average yearly temperature and precipitation of Site 2 was lower, which promoted the growth of larger, but fewer branches and knots, compared to Sites 1 and 3.
According to the sawmill simulation results, lumber volume and value of both types of sawmills were not significantly influenced by the density of the stand where amabilis fir and western hemlock have grown. However, trees from larger DBH classes yielded larger lumber volume and value, although this effect was not statistically significant for the lumber volume recovery in the Interior random sawmill type. Processing trees from larger diameter classes seems to be more important than the knot characteristics assessed in this study. The sawmilling simulation results also showed that processing Hem-Fir in random sawmills, prevalent in the BC Interior, are associated with higher volume and value recovery than when transformed into Coastal sawmills. This is mainly due to the differences in product baskets, which is much simpler in the Interior random mill (i.e., dimensional lumber). Since Hem-Fir trees are currently mainly processed in Coastal sawmills, this suggests that simplifying the product structure along with adopting primary breakdown equipment typically used in Interior random mills could boost both the volume and value recovery.
Models were developed to estimate knot characteristics and the value of 60-year-old amabilis fir and western hemlock trees from their tree attributes on three harvesting stands located in Vancouver Island, BC. With the combined use of X-ray CT images and sawmill simulation tools, it was possible to estimate lumber recovery and value of trees considering their internal knot features. The models provide an insight in the link between stand growth conditions, wood quality and lumber manufacturing and could be used to estimate revenue at an early stage in the decision-making process. For example, it could assist in deciding the rotation age of a stand. However, these models should be further validated using real sawmilling data. The impact of using models as inputs (i.e., in models 2 and 3) on the cumulative error should also be assessed. Similarly, using a continuous lumber prices dataset would improve the accuracy of the models, make them more dynamic, but likely involve machine learning or big dataset mining approaches.
Author Contributions
Conceptualization, A.J., J.C. and I.D.; methodology, A.J. and J.C.; validation, A.J., J.C. and I.D.; investigation, A.J. and J.C.; resources, FPInnovations, data curation, J.C.; writing—original draft preparation, A.J. and J.C.; writing—review and editing, A.J., J.C. and I.D.; visualization, A.J. and J.C.; supervision, J.C.; project administration, J.C.; funding acquisition, J.C. All authors have read and agreed to the published version of the manuscript.
Funding
This research was funded by the Forest Innovation Program of Natural Resources Canada.
Informed Consent Statement
Not applicable.
Data Availability Statement
The data presented in this study are available on request from the corresponding author with the exception of the data provided by FPInnovations. The data are not publicly available due to privacy restrictions from FPInnovations who provided the raw data.
Acknowledgments
We would like to thank FPInnovations for its technical support in the project; specifically Steve Vallerand for the CT2Opti training, Luc Bédard for assisting with sawmill layouts and Serge Constantineau for providing optimization value lists. We would also like to thank Hyeyoung Woo for her guidance on the statistical analysis.
Conflicts of Interest
The authors declare no conflict of interest.
Appendix A
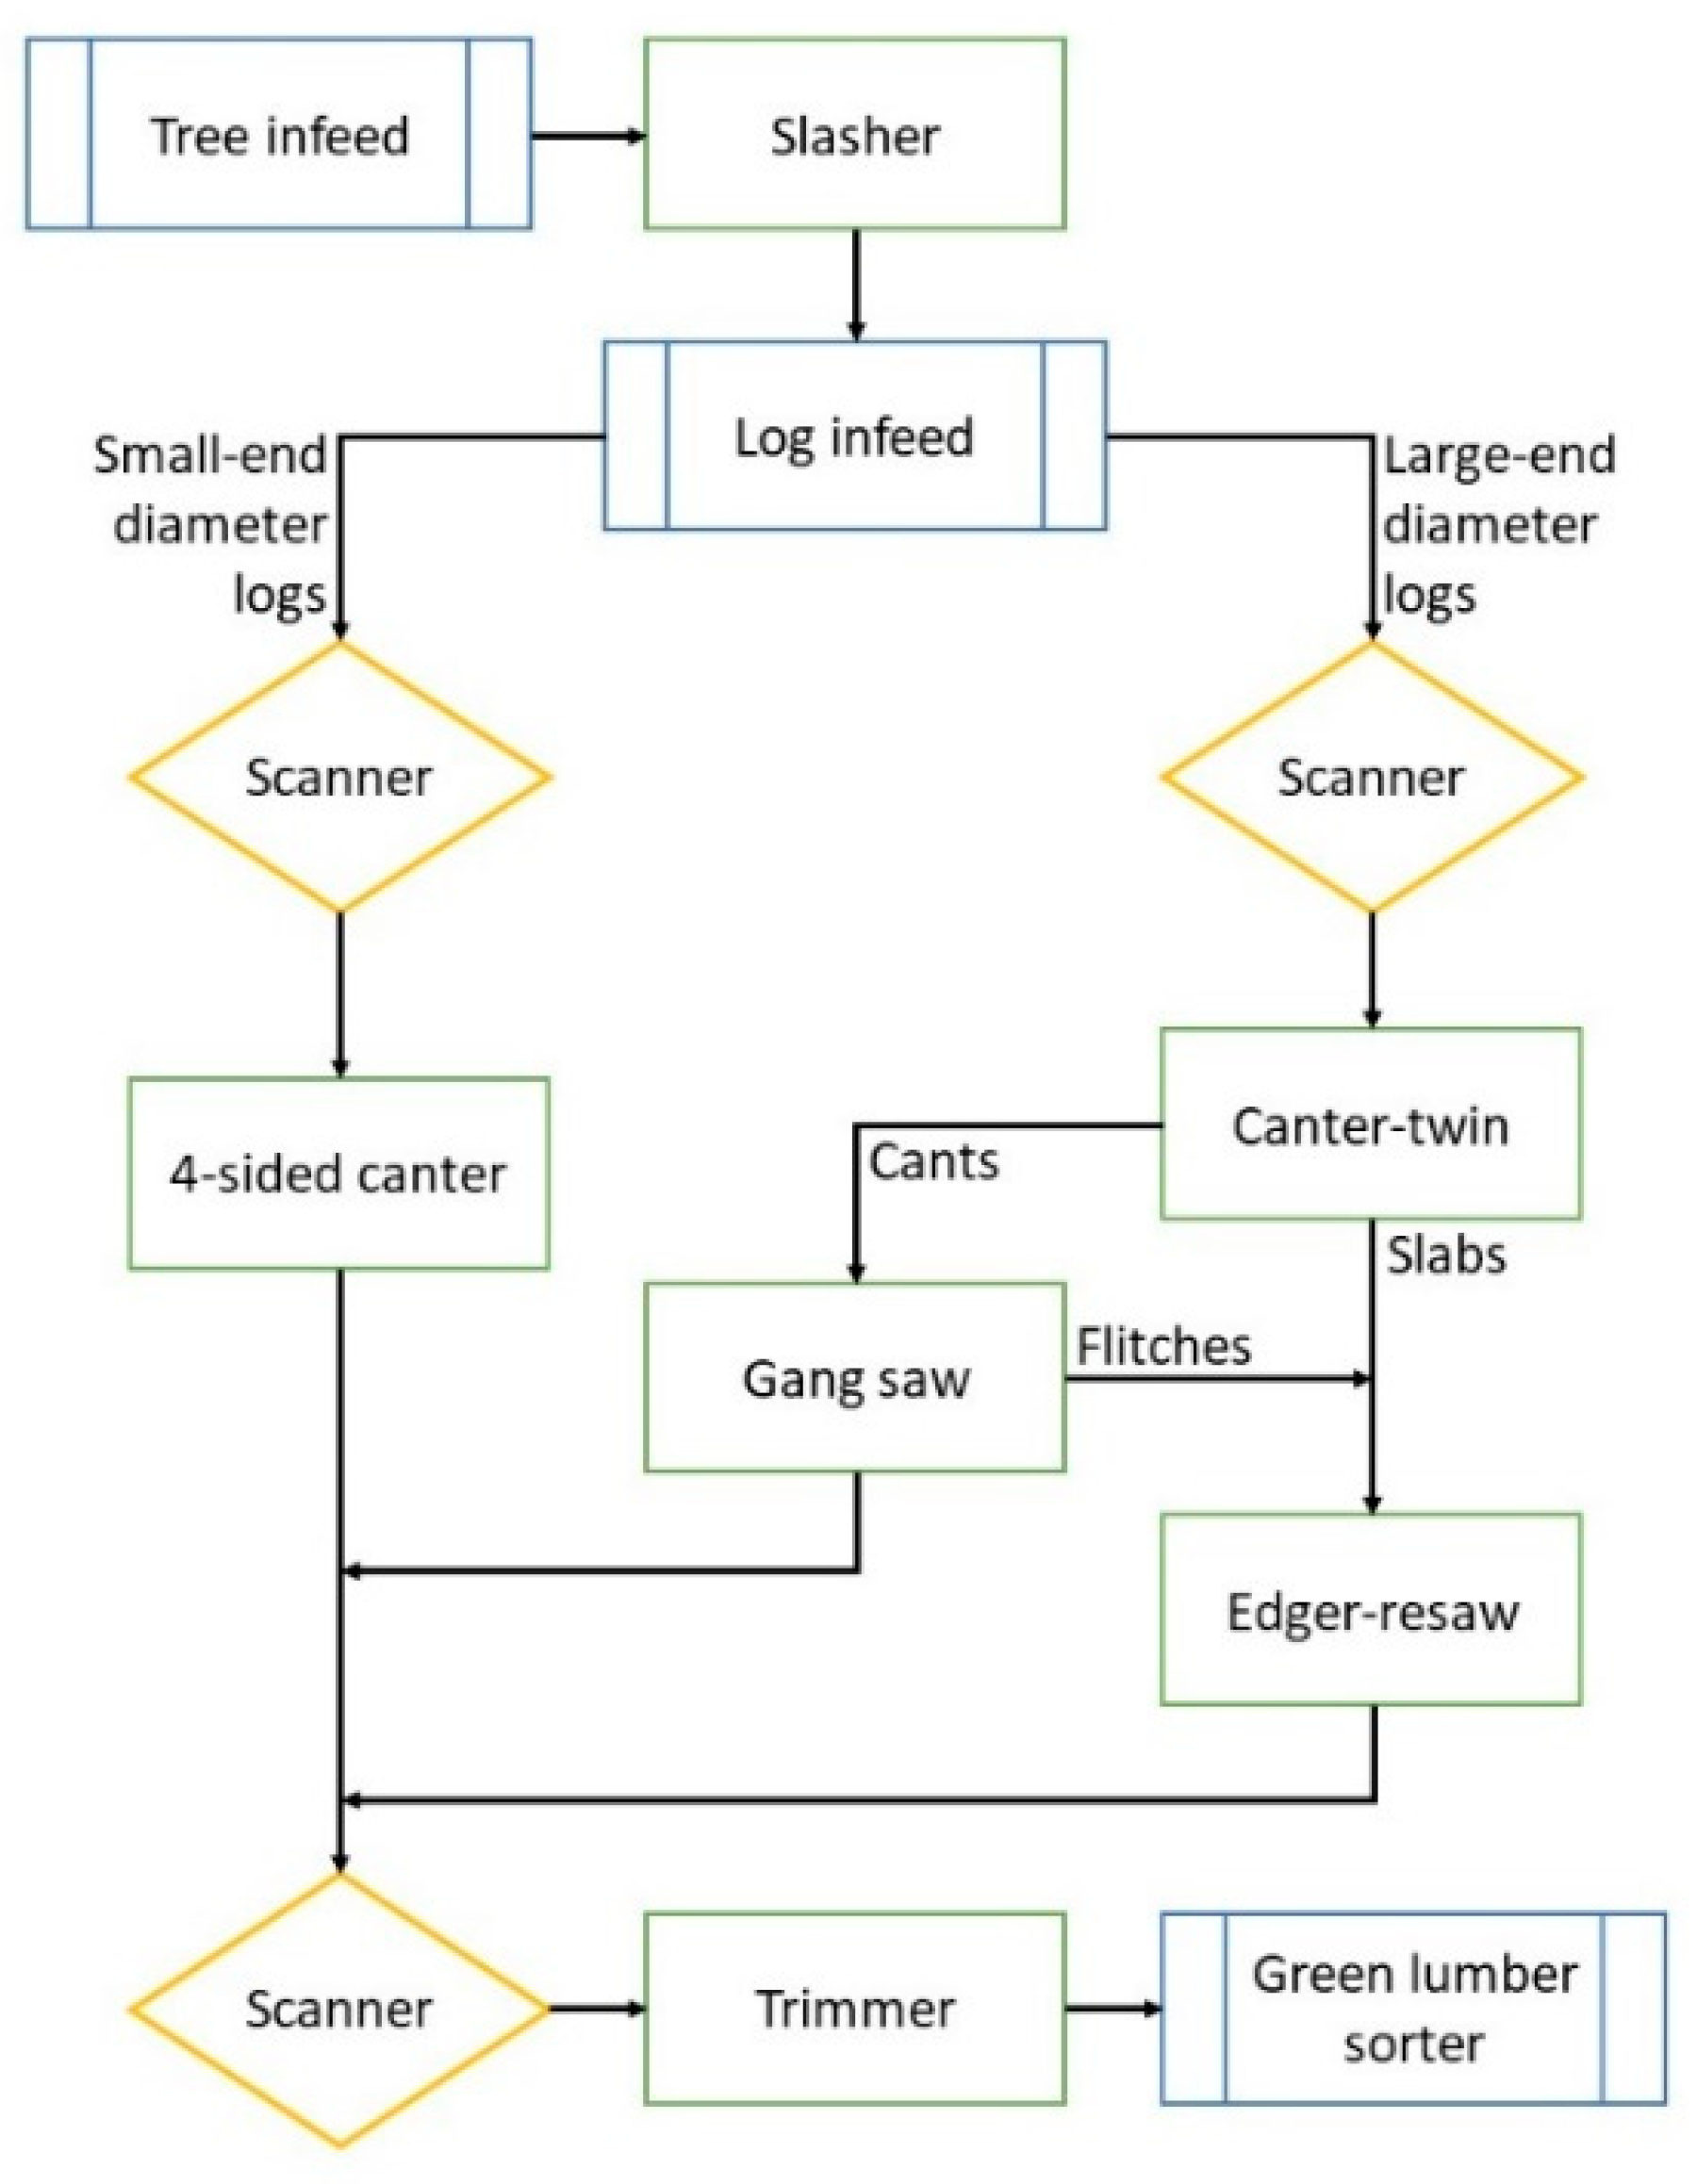
Figure A1.
Flowchart of an existing BC Coastal sawmill. This sawmill layout was used to simulate Coastal operations.
Figure A1.
Flowchart of an existing BC Coastal sawmill. This sawmill layout was used to simulate Coastal operations.
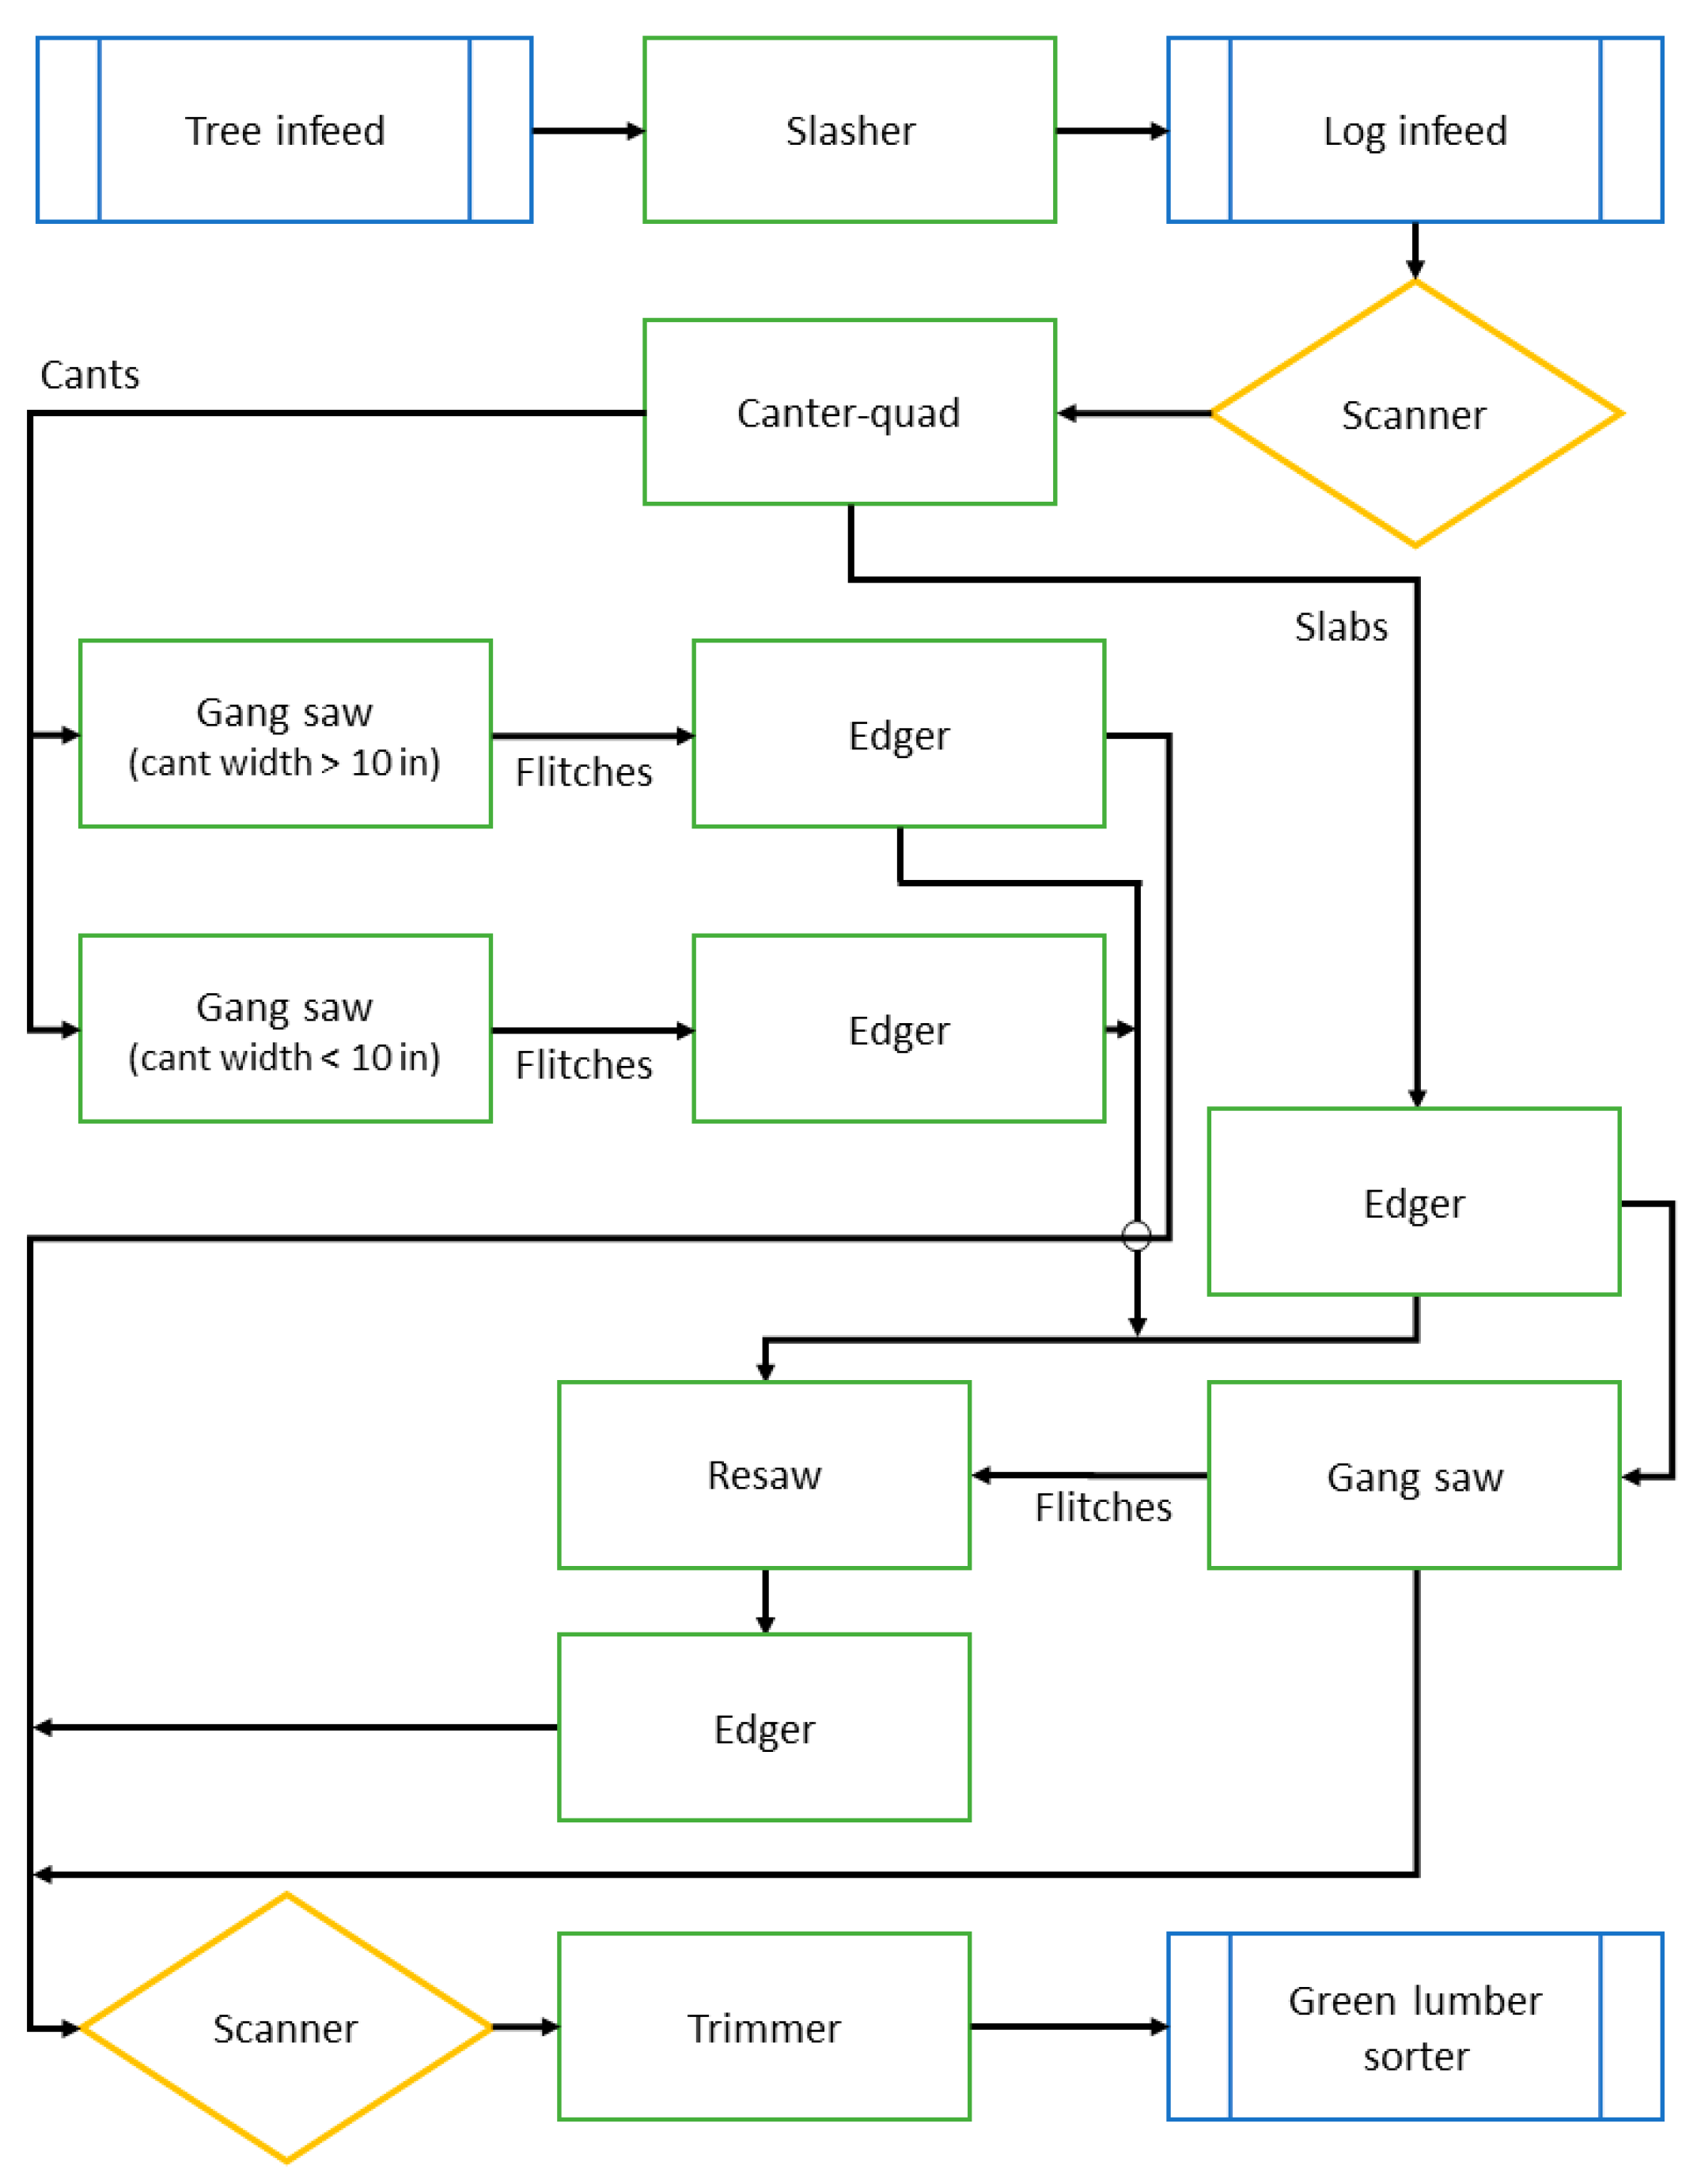
Figure A2.
Flowchart of an existing BC Interior random sawmill. This layout was used to simulate Interior operations.
Figure A2.
Flowchart of an existing BC Interior random sawmill. This layout was used to simulate Interior operations.
References
- Natural Resources Canada. Canada’s Forests: Adapting to Change. The State of Canada’s Forests: Annual Report 2020; Natural Resources Canada: Vancouver, BC, Canada, 2020.
- Hall, M. BC Coastal Fibre Supply: Strategic Support for Small Business, Corporations and the Forest Industry; Murray Hall Consulting Ltd.: Duncan, BC, Canada, 2018. [Google Scholar]
- Kang, K.-Y.; Zhang, S.Y.; Mansfield, S.D. The effects of initial spacing on wood density, fibre and pulp properties in jack pine (Pinus banksiana Lamb.). Holzforschung 2004, 58, 455–463. [Google Scholar] [CrossRef]
- Lasserre, J.P.; Mason, E.G.; Watt, M.S.; Moore, J.R. Influence of initial planting spacing and genotype on microfibril angle, wood density, fibre properties and modulus of elasticity in Pinus radiata D. Don corewood. For. Ecol. Manag. 2009, 258, 1924–1931. [Google Scholar] [CrossRef]
- Jiménez, E.; Vega, J.A.; Pérez-Gorostiaga, P.; Cuiñas, P.; Fonturbel, T.; Fernández, C.; Madrigal, J.; Hernando, C.; Guijarro, M. Effects of pre-commercial thinning on transpiration in young post-fire maritime pine stands. Forestry 2008, 81, 543–557. [Google Scholar] [CrossRef][Green Version]
- Bicho, P.; Portillo, E.; Yuen, B.; Yan, D.; Pitt, D.G. Effects of precommercial thinning on the forest value chain in northwestern New Brunswick: Part 5—Kraft and Thermomechanical pulping and pulp quality. For. Chron. 2013, 89, 490–501. [Google Scholar] [CrossRef][Green Version]
- Zhang, S.; Chauret, G.; Tong, Q. Impact of precommercial thinning on tree growth, lumber recovery and lumber quality in Abies balsamea. Scand. J. For. Res. 2009, 24, 425–433. [Google Scholar] [CrossRef]
- Chase, C.W.; Kimsey, M.J.; Shaw, T.M.; Coleman, M.D. The response of light, water, and nutrient availability to pre-commercial thinning in dry inland Douglas-fir forests. For. Ecol. Manag. 2016, 363, 98–109. [Google Scholar] [CrossRef]
- Duchesne, I.; Pitt, D.G.; Tanguay, F. Effects of precommercial thinning on the forest value chain in northwestern New Brunswick: Part 4—Lumber production, quality and value. For. Chron. 2013, 89, 474–489. [Google Scholar] [CrossRef]
- Långström, B.; Hellqvist, C. Effects of different pruning regimes on growth and sapwood area of Scots pine. For. Ecol. Manag. 1991, 44, 239–254. [Google Scholar] [CrossRef]
- Kantola, A.; Mäkinen, H.; Mäkelä, A. Stem form and branchiness of Norway spruce as a sawn timber—Predicted by a process based model. For. Ecol. Manag. 2007, 241, 209–222. [Google Scholar] [CrossRef]
- Hevia, A.; Álvarez-González, J.G.; Majada, J. Comparison of pruning effects on tree growth, productivity and dominance of two major timber conifer species. For. Ecol. Manag. 2016, 374, 82–92. [Google Scholar] [CrossRef]
- Clark, A.; Borders, B.E.; Daniels, R.F. Impact of vegetation control and annual fertilization on properties of loblolly pine wood at age 12. For. Prod. J. 2004, 54, 90–96. [Google Scholar]
- Kantavichai, R.; Turnblom, E.C.; Lowell, E.C. Effects of density control and fertilization on log wood quality from a douglas-fir stand in western oregon, USA. For. Sci. 2020, 66, 191–200. [Google Scholar] [CrossRef]
- Giudiceandrea, F.; Ursella, E.; Enrico, V. A high speed CT scanner for the sawmill industry. In Proceedings of the 17th International Non Destructive testing and Evaluation of Wood Symposium, Sopron, Hungary, 14–16 September 2011; Volume 22. [Google Scholar]
- An, Y. Coarse-Resolution CT Scanning for Sawmill Logs Sorting and Grading. Ph.D. Thesis, University of British Columbia, Vancouver, BC, Canada, 2013. [Google Scholar]
- Tong, Q.J.; Duchesne, I.; Belley, D.; Beaudoin, M.; Swift, E. Characterization of knots in plantation white spruce. Wood Fiber Sci. 2013, 45, 84–97. [Google Scholar]
- Berglund, A.; Broman, O.; Grönlund, A.; Fredriksson, M. Improved log rotation using information from a computed tomography scanner. Comput. Electron. Agric. 2013, 90, 152–158. [Google Scholar] [CrossRef]
- Fredriksson, M.; Cool, J.; Duchesne, I.; Belley, D. Knot detection in computed tomography images of partially dried jack pine (Pinus banksiana) and white spruce (Picea glauca) logs from a Nelder type plantation. Can. J. For. Res. 2017, 47, 910–915. [Google Scholar] [CrossRef]
- Stängle, S.M.; Brüchert, F.; Heikkila, A.; Usenius, T.; Usenius, A.; Sauter, U.H. Potentially increased sawmill yield from hardwoods using X-ray computed tomography for knot detection. Ann. For. Sci. 2015, 72, 57–65. [Google Scholar] [CrossRef]
- Rais, A.; Ursella, E.; Vicario, E.; Giudiceandrea, F. The use of the first industrial X-ray CT scanner increases the lumber recovery value: Case study on visually strength-graded Douglas-fir timber. Ann. For. Sci. 2017, 74. [Google Scholar] [CrossRef]
- Belley, D.; Duchesne, I.; Vallerand, S.; Barrette, J.; Beaudoin, M. Computed tomography (CT) scanning of internal log attributes prior to sawing increases lumber value in white spruce (Picea glauca) and jack pine (Pinus banksiana). Can. J. For. Res. 2019, 49, 1516–1524. [Google Scholar] [CrossRef]
- Gergel, T.; Bucha, T.; Gejdoš, M.; Vyhnáliková, Z. Computed tomography log scanning—High technology for forestry and forest based industry. Cent. Eur. For. J. 2019, 65, 51–59. [Google Scholar] [CrossRef]
- Beaulieu, J.; Dutilleul, P. Applications of computed tomography (CT) scanning technology in forest research: A timely update and review. Can. J. For. Res. 2019, 49, 1173–1188. [Google Scholar] [CrossRef]
- Lindgren, L.O. Medical CAT-scanning: X-ray absorption coefficients, CT-numbers and their relation to wood density. Wood Sci. Technol. 1991, 25, 341–349. [Google Scholar] [CrossRef]
- Freyburger, C.; Longuetaud, F.; Mothe, F.; Constant, T.; Leban, J.-M. Measuring wood density by means of X-ray computer tomography. Ann. For. Sci 2009, 66, 804. [Google Scholar] [CrossRef]
- Manceur, A.M.; Beaulieu, J.; Han, L.; Dutilleul, P. A multidimensional statistical model for wood data analysis, with density estimated from CT scanning data as an example. Can. J. For. Res. 2012, 42, 1038–1049. [Google Scholar] [CrossRef]
- Longuetaud, F.; Mothe, F.; Fournier, M.; Dlouha, J.; Santenoise, P.; Deleuze, C. Within-stem maps of wood density and water content for characterization of species: A case study on three hardwood and two softwood species. Ann. For. Sci. 2016, 73, 601–614. [Google Scholar] [CrossRef]
- Longuetaud, F.; Mothe, F.; Leban, J.-M.M. Automatic detection of the heartwood/sapwood boundary within Norway spruce (Picea abies (L.) Karst.) logs by means of CT images. Comput. Electron. Agric. 2007, 58, 100–111. [Google Scholar] [CrossRef]
- Skog, J.; Oja, J. Heartwood diameter measurements in Pinus sylvestris sawlogs combining X-ray and three-dimensional scanning. Scand. J. For. Res. 2009, 24, 182–188. [Google Scholar] [CrossRef]
- Bhandarkar, S.M.; Faust, T.D.; Tang, M. Catalog: A System for Detection and Rendering of Internal Log Defects Using Computer Tomography. Mach. Vis. Appl. 1999, 11, 171–190. [Google Scholar] [CrossRef]
- Andreu, J.-P.; Rinnhofer, A. Modeling Knot Geometry in Norway Spruce from Industrial CT Images. In Image Analysis. SCIA 2003; Springer: Berlin/Heidelberg, Germany; pp. 786–791. [CrossRef]
- Krähenbühl, A.; Kerautret, B.; Debled-Rennesson, I.; Longuetaud, F.; Mothe, F.; Krähenbühl, A.; Kerautret, B.; Debled-Rennesson, I.; Longuetaud, F.; Mothe, F. Knot Detection in X-ray CT Images of Wood. Comput. Vis. 2012, 209–218. [Google Scholar] [CrossRef]
- Johansson, E.; Johansson, D.; Skog, J.; Fredriksson, M. Automated knot detection for high speed computed tomography on Pinus sylvestris L. and Picea abies (L.) Karst. using ellipse fitting in concentric surfaces. Comput. Electron. Agric. 2013, 96, 238–245. [Google Scholar] [CrossRef]
- Schajer, G.S. Lumber strength grading using x-ray scanning. For. Prod. J. 2001, 51, 43–50. [Google Scholar]
- Oja, J.; Källsner, B.; Grundberg, S. Predicting the strength of sawn wood products: A comparison between X-ray scanning of logs and machine strength grading of lumber. For. Prod. J. 2005, 55, 55–60. [Google Scholar]
- Oh, J.K.; Kim, K.M.; Lee, J.J. Use of adjacent knot data in predicting bending strength of dimension lumber by X-ray. Wood Fiber Sci. 2010, 42, 10–20. [Google Scholar]
- Ministry of Forests, Lands, Natural Resource Operations and Rural Development. 2018/19–2020/21 Service Plan; Government of BC: Vancouver, BC, Canada, 2018.
- Jianhe Wang, B.; Dai, C. Development of structural laminated veneer lumber from stress graded short-rotation hem-fir veneer. Constr. Build. Mater. 2013. [Google Scholar] [CrossRef]
- Wang, J.B.; Wei, P.; Gao, Z.; Dai, C. Chunping The evaluation of panel bond quality and durability of hem-fir cross-laminated timber (CLT). Eur. J. Wood Prod. 2018, 76, 833–841. [Google Scholar] [CrossRef]
- Middleton, G.; Munro, D. Characterizing the Wood Attributes and Product Potential of 60-Year-Old Hem-Fir in Coastal British Columbia; FPInnovations: Vancouver, BC, Canada, 2013. [Google Scholar]
- Canadian Climate Normals 1971–2000 Station Data. Available online: https://climate.weather.gc.ca/climate_normals/ (accessed on 24 April 2020).
- Vallerand, S.; Belley, D.; Duchesne, I.; Beaudoin, M. Utilisation d’Images CT pour la Modélisation 3D de Billes Réelles avec Caractéristiques Internes; Note de recherche No. 2 ForêtValeur/ForValueNet; Québec, QC, Canada, Décembre 2011; p. 2. Available online: http://www.forvaluenet-foretvaleur.ca (accessed on 28 May 2021).
- FPInnovations. Available online: https://fpinnovations.ca/products-and-services/technologies/Pages/default.aspx (accessed on 15 March 2019).
- National Lumber Grades Authority. Standard Grading Rules for Canadian Lumber; National Lumber Grades Authority: Vancouver, BC, Canada, 2008. [Google Scholar]
- Mori, A.S.; Mizumachi, E.R.I.; Sprugel, D.G. Morphological acclimation to understory environments in Abies amabilis, a shade- and snow-tolerant conifer species of the Cascade Mountains, Washington, USA. Tree Physiol. 2008, 28, 815–824. [Google Scholar] [CrossRef]
- Marcoux, D.; Bio, R.P.; College, S. What Is the Biogeoclimatic Ecosystem Classification? Available online: https://selkirk.ca/discover/bec/zones/whatis.html (accessed on 10 May 2021).
- Way, D.A.; Oren, R. Differential responses to changes in growth temperature between trees from different functional groups and biomes: A review and synthesis of data. Tree Physiol. 2010. [Google Scholar] [CrossRef] [PubMed]
- Hember, R.A.; Kurz, W.A.; Girardin, M.P. Tree Ring Reconstructions of Stemwood Biomass Indicate Increases in the Growth Rate of Black Spruce Trees Across Boreal Forests of Canada. J. Geophys. Res. Biogeosci. 2019, 124, 2460–2480. [Google Scholar] [CrossRef]
- Mäkinen, H.; Colin, F. Predicting branch angle and branch diameter of Scots pine from usual tree measurements and stand structural information. Can. J. For. Res. 1998, 28, 1686–1696. [Google Scholar] [CrossRef]
- Weber, A.; Leckie, S.; Kimmins, H.; Gilbert, B.; Blanco, J.A.; Lo, Y.-H. Survival and growth as measures of shade tolerance of planted western redcedar, western hemlock and amabilis fir seedlings in hemlock-fir forests of northern Vancouver Island. For. Ecol. Manag. 2016. [Google Scholar] [CrossRef]
- Moberg, L. Predicting knot properties of Picea abies and Pinus sylvestris from generic tree descriptors. Scand. J. For. Res. 2006, 21, 49–62. [Google Scholar] [CrossRef]
- Lyhykäinen, H.T.; Mäkinen, H.; Mäkelä, A.; Pastila, S.; Heikkilä, A.; Usenius, A. Predicting lumber grade and by-product yields for Scots pine trees. For. Ecol. Manag. 2009. [Google Scholar] [CrossRef]
- Liu, C.; Zhang, S.Y.; Ruel, J.C.; Cloutier, A.; Rycabel, T. Development of lumber volume recovery correction models for stem deformations of natural black spruce trees. Scand. J. For. Res. 2007, 22, 415–421. [Google Scholar] [CrossRef]
- Duchateau, E.; Auty, D.; Mothe, F.; Achim, A. Improving branch distribution models in trees using X-ray computed tomography. In Proceedings of the International Conference on Function-Structural Plant Models, Saariselkä, Finland, 9–14 June 2013. [Google Scholar]
- Li, C.; Huang, S.; Barclay, H.; Sidders, D. Modeling lumber yield of white spruce in Alberta, Canada: A comparative approach. J. For. Res. 2016. [Google Scholar] [CrossRef]
- Thomas, R.E.; Bennett, N.D. An analysis of the differences among log scaling methods and actual log volume. For. Prod. J. 2017, 67, 250–257. [Google Scholar] [CrossRef]
- Tong, Q.J.; Zhang, S.Y. Modelling jack pine lumber value recovery in relation to tree characteristics using Optitek simulation. For. Prod. J. 2006, 56, 66–72. [Google Scholar]
- Tong, Q.; Zhang, S. Development of lumber recovery correction models for plantation-grown Pinus banksiana trees. Scand. J. For. Res. 2009, 24, 417–424. [Google Scholar] [CrossRef]
- Liu, C.; Ruel, J.-C.; Groot, A.; Zhang, S.Y. Model Development for Lumber Volume Recovery of Natural Balsam Fir Trees in Quebec, Canada. For. Chron. 2009, 85, 870–877. [Google Scholar] [CrossRef]
- Zhang, S.Y.; Tong, Q.J. Modeling lumber recovery in relation to selected tree characteristics in jack pine using sawing simulator Optitek. Ann. For. Sci. 2005, 62, 219–228. [Google Scholar] [CrossRef]
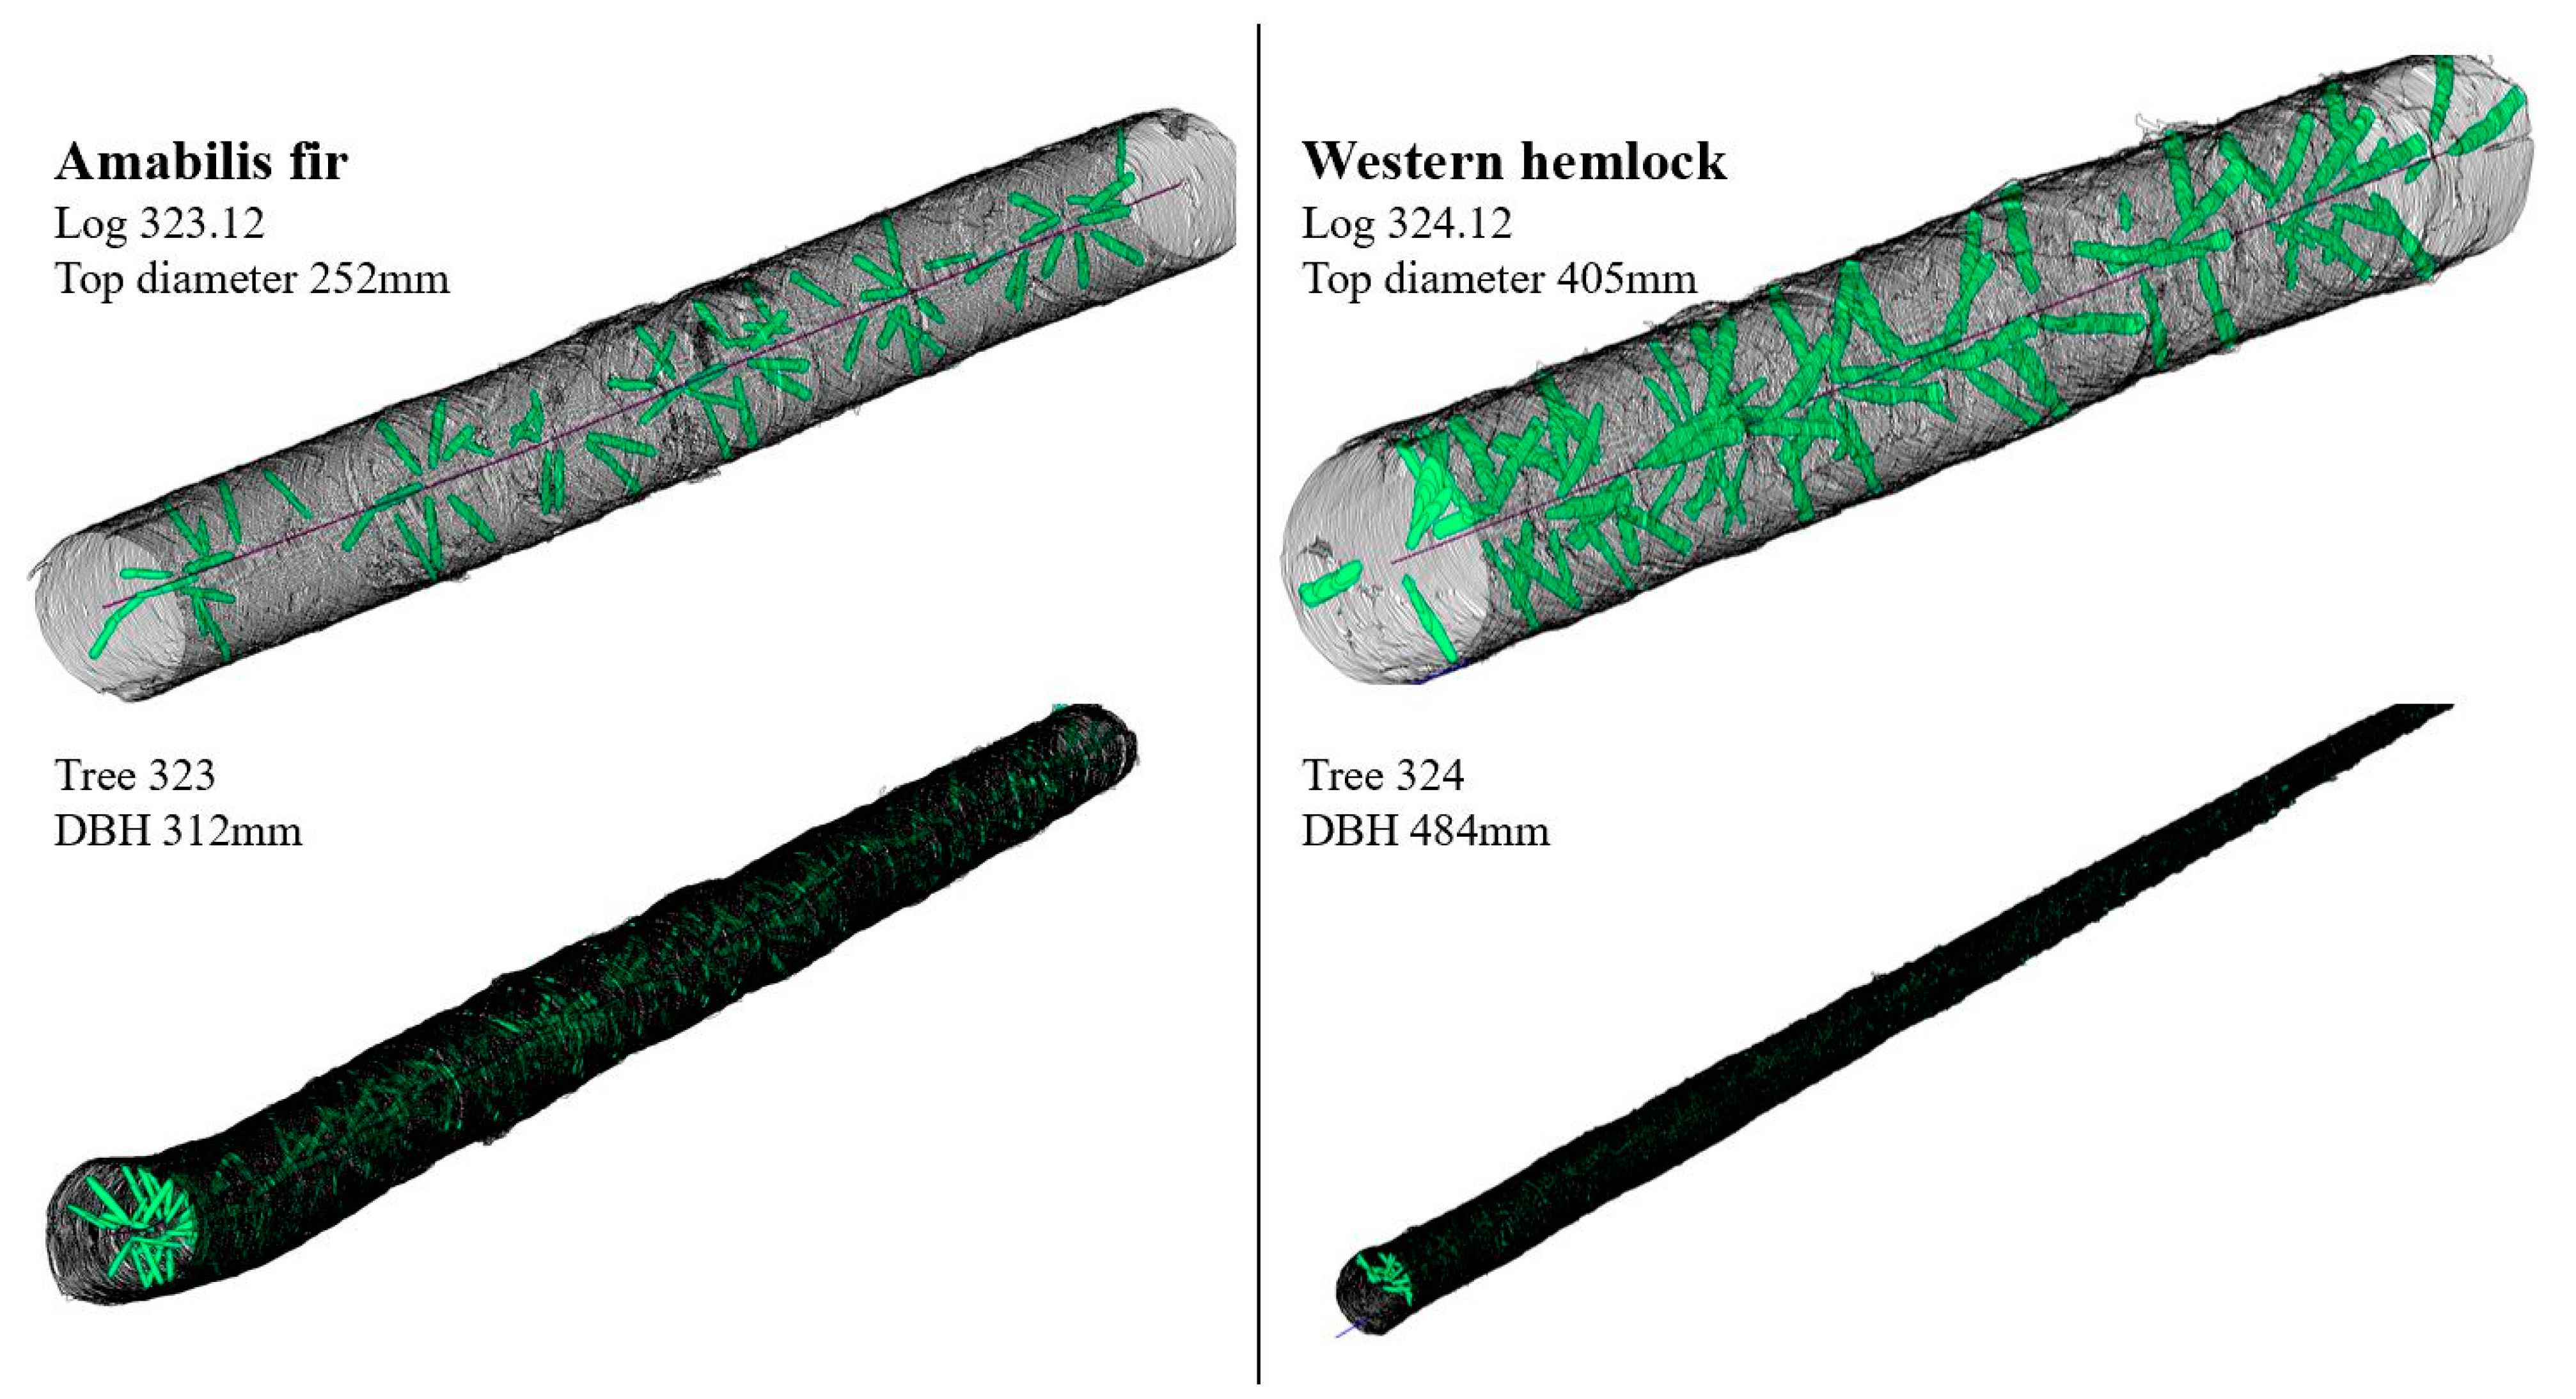
Figure 1.
Examples of log models with extracted knots (shown in green) and reconstructed stem models for amabilis fir and western hemlock.
Figure 1.
Examples of log models with extracted knots (shown in green) and reconstructed stem models for amabilis fir and western hemlock.
Figure 2.
Scheme of methods, corresponding results and model building.
Figure 2.
Scheme of methods, corresponding results and model building.
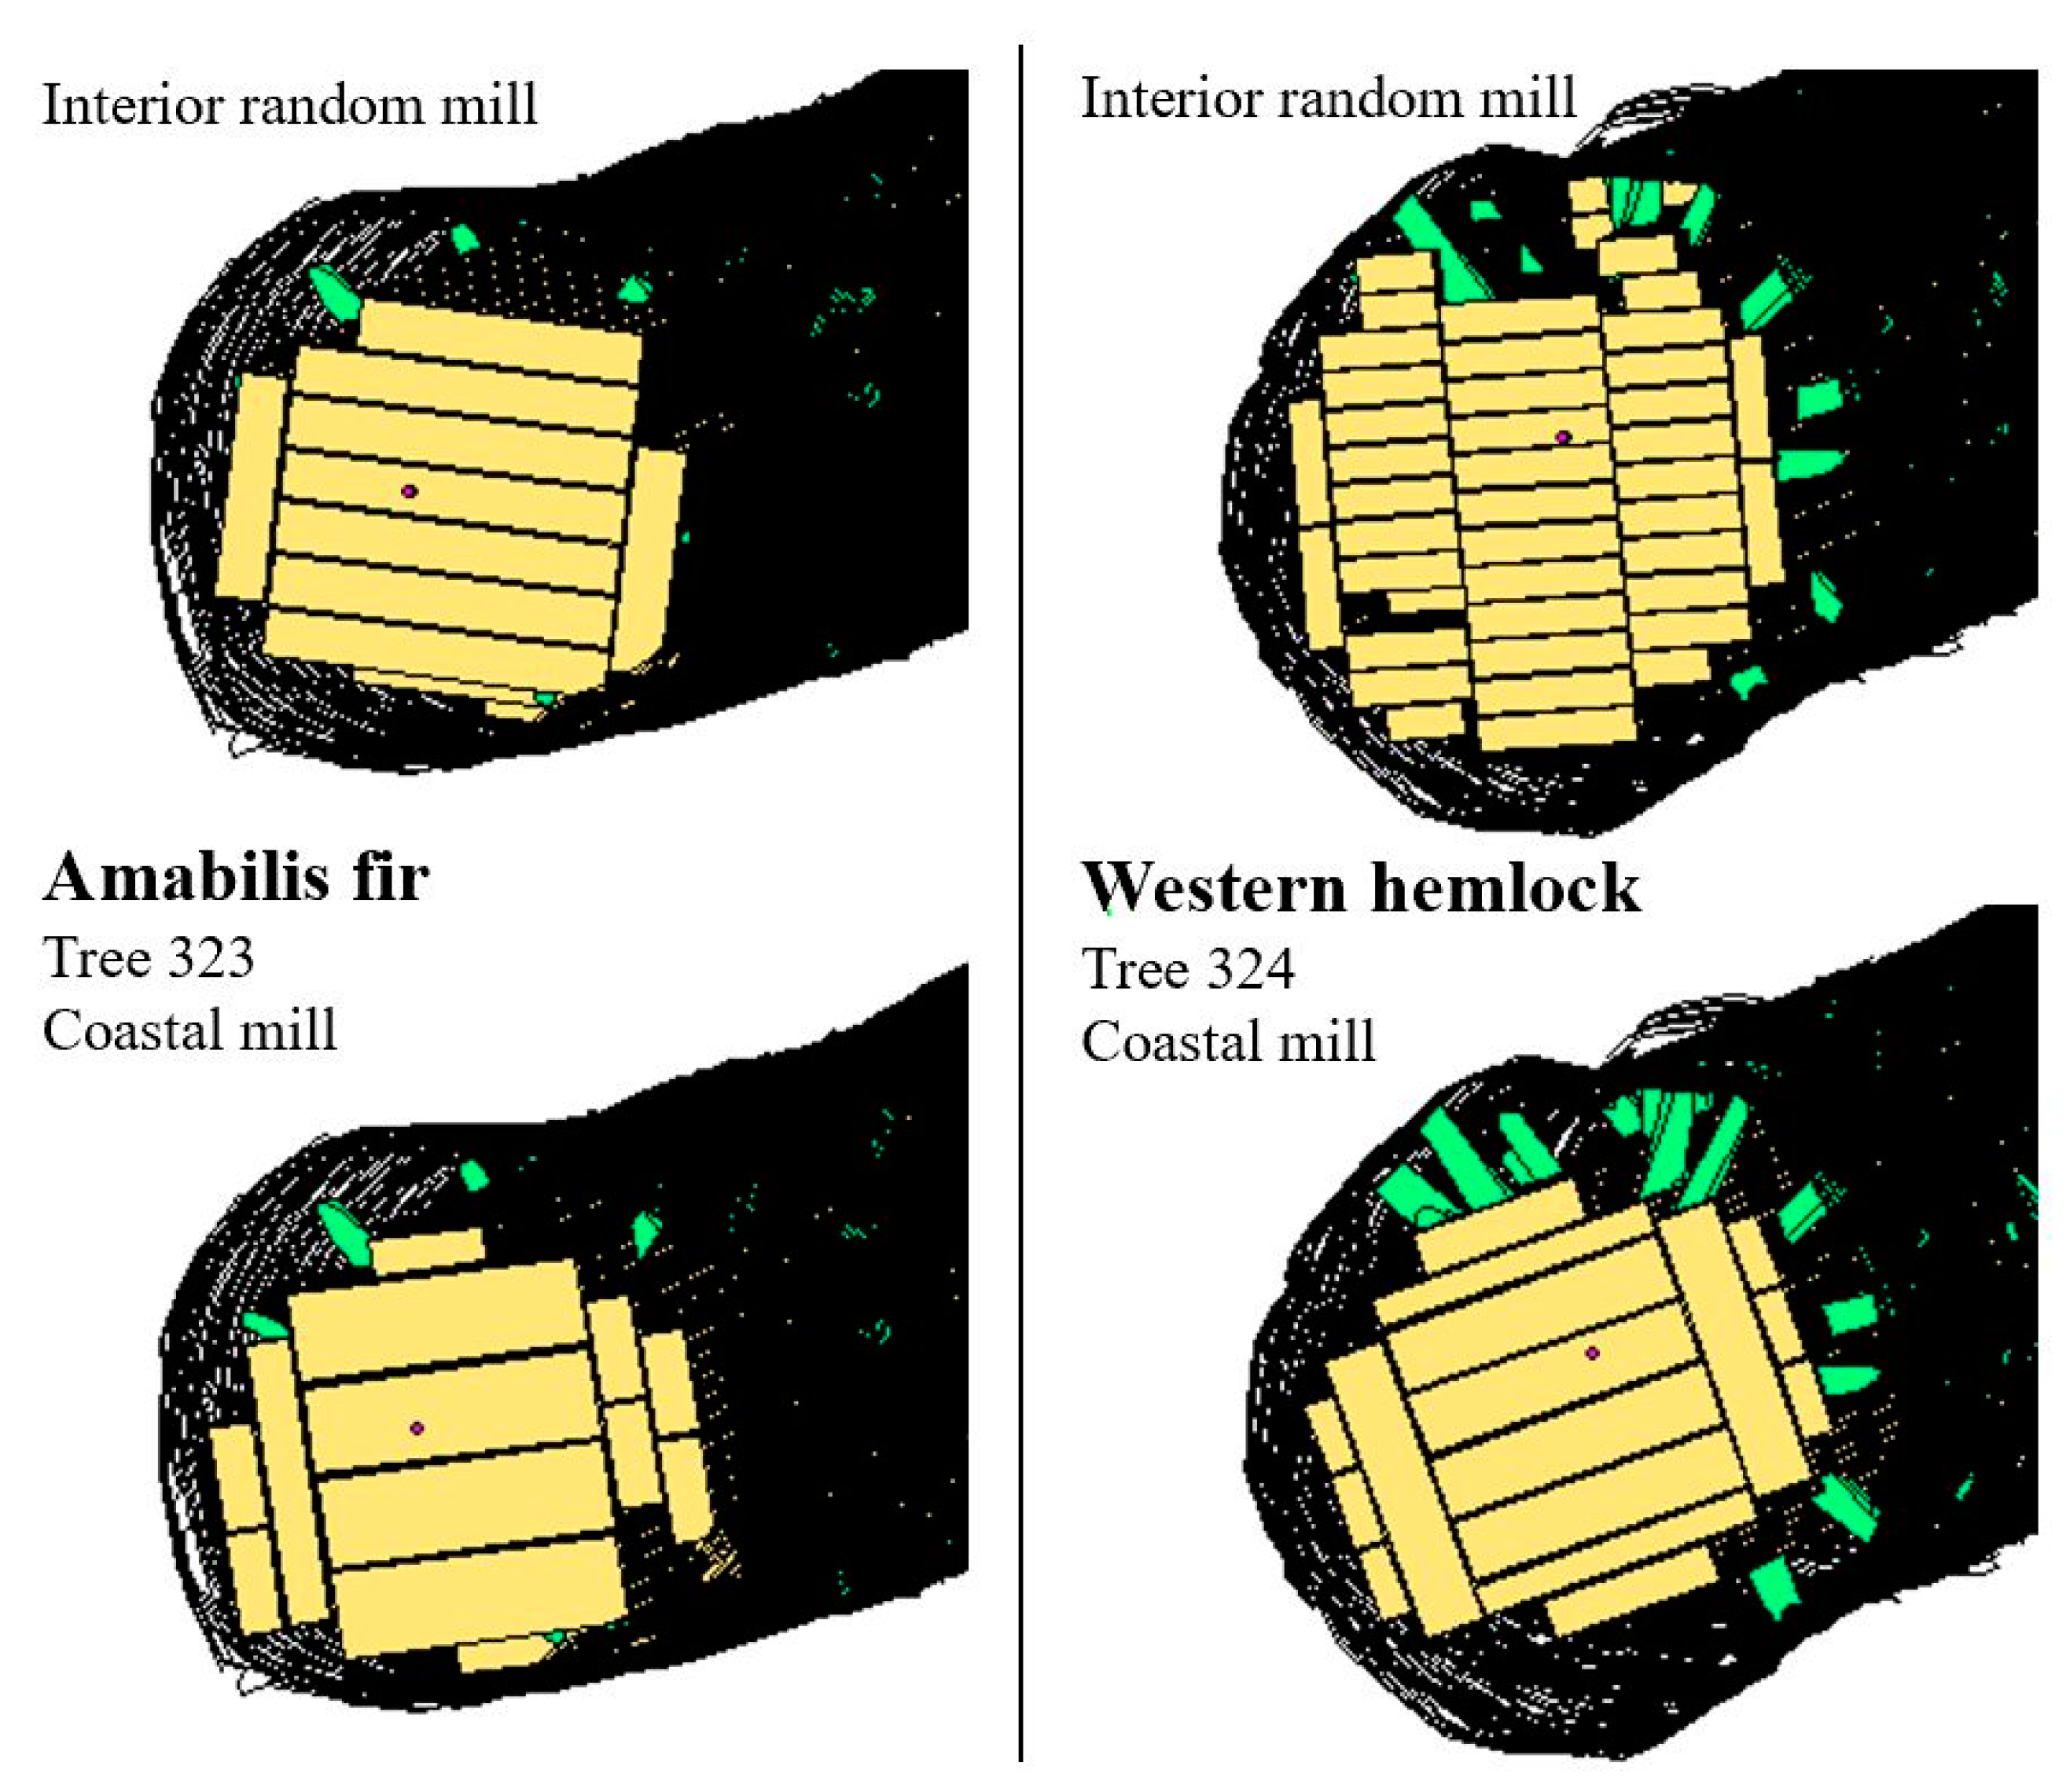
Figure 3.
Examples of cutting patterns from simulation results of amabilis fir and western hemlock in Interior random and Coastal sawmills.
Figure 3.
Examples of cutting patterns from simulation results of amabilis fir and western hemlock in Interior random and Coastal sawmills.
Table 1.
Stand characteristics for the three stands where amabilis fir and western hemlock were harvested is summarized from [
41]. The thirty-year (1971–2000) temperature and precipitation averages were extracted from weather stations
1 closely located to the stands [
42].
Table 1.
Stand characteristics for the three stands where amabilis fir and western hemlock were harvested is summarized from [
41]. The thirty-year (1971–2000) temperature and precipitation averages were extracted from weather stations
1 closely located to the stands [
42].
| Stand Characteristics | Stand 1 | Stand 2 | Stand 3 |
|---|
| Latitude | 49°2′ N | 50°29′ N | 48°58′ N |
| Longitude | 124°40′ W | 127°6′ W | 124°39′ W |
| Elevation (m) | 390 | 260 | 230 |
| Slope (%) | Level | 25–40 | 0–5 |
| Aspect | - | NE | S |
| Stand density (sph) | 1020 | 950 | 758 |
| Average temperature (°C) 1 | 9.5 | 8.5 | 9.5 |
| Average precipitation (mm) | 1910.7 | 1591.5 | 1910.7 |
| Average height of sampled trees (m) | 36.9 | 36.1 | 34.6 |
| Estimated site index at breast height age of 50 | | | |
| Amabilis fir | 32.8 | 33.7 | 35.0 |
| Western hemlock | 33.6 | 34.3 | 37.2 |
Table 2.
Percentages used to calculate the optimist and pessimist economic scenarios from the baseline economic scenario for different grades of lumber. The grades of lumber are in decreasing order of quality from left to right.
Table 2.
Percentages used to calculate the optimist and pessimist economic scenarios from the baseline economic scenario for different grades of lumber. The grades of lumber are in decreasing order of quality from left to right.
| Economic Cycle | Lumber Grades |
|---|
| #1 | #2 | #3 | Stud. | Econ. |
|---|
| Optimist | +25% | +30% | +10% | +5% | +5% |
| Pessimist | −15% | −25% | −20% | −10% | −10% |
Table 3.
The p-values of stand density and DBH class on total knot volume (KV), number of knots (NK), average knot area (KA) and knot/tree ratio (K/T) at the 95% confidence level for two species.
Table 3.
The p-values of stand density and DBH class on total knot volume (KV), number of knots (NK), average knot area (KA) and knot/tree ratio (K/T) at the 95% confidence level for two species.
| Variables | KV | NK | KA | K/T |
|---|
| Amabilis fir |
| Stand density | 0.18000 | 0.09930 | 0.17300 | 0.17030 |
| DBH class | 0.00000 | 0.00001 | 0.00000 | 0.00055 |
| Western hemlock |
| Stand density | 0.00611 | 0.40000 | 0.02670 | 0.00163 |
| DBH class | 0.00000 | 0.29400 | 0.00000 | 0.41454 |
Table 4.
Means of twelve trees and their corresponding standard deviation (in parenthesis) for total knot volume (KV), number of knots (NK), average knot area (KA) and knot/tree ratio (K/T) for three DBH classes of amabilis fir trees harvested from three different sites. Data from the three different sites is pooled.
| DBH Class | KV (cm3) | NK | KA (cm2) | K/T (/103) |
|---|
| 30 | 11,354.2 | A 1 | 285 | A | 21.9 | A | 4.337 | A |
| (5252.8) | (81.9) | (4.3) | (1.594 |
| 40 | 28,924.6 | B | 391 | B | 34.8 | B | 6.426 | B |
| (10,326.9) | (54.0) | (9.0) | (2.176) |
| 50 | 51,514.2 | C | 430 | B | 51.1 | C | 7.521 | B |
| (17,100.3) | (52.9) | (13.0) | (2.220) |
Table 5.
Means of four trees and their corresponding standard deviation (in parenthesis) for total knot volume (KV), number of knots (NK) and average knot area (KA) for three DBH classes of western hemlock trees harvested from three different sites.
Table 5.
Means of four trees and their corresponding standard deviation (in parenthesis) for total knot volume (KV), number of knots (NK) and average knot area (KA) for three DBH classes of western hemlock trees harvested from three different sites.
| Site | DBH Class | KV (cm3) | NK | KA |
|---|
| 1 | 30 | 17,341.4 | A 1 | 365 2 | 22.8 | A |
| (4296.2) | (61) | (4.1) |
| 40 | 33,372.2 | B | 502 | 29.6 | B |
| (9797.8) | (40) | (7.1) |
| 50 | 55,357.9 | C | 496 | 41.1 | C |
| (22,469.4) | (127) | (2.8) |
| 2 | 30 | 26,789.8 | D | 448 | 25.6 | D |
| (6173.7) | (147) | (2.9) |
| 40 | 42,088.5 | E | 432 | 39.2 | E |
| (8086.9) | (77) | (5.3) |
| 50 | 67,634.3 | F | 470 | 50.9 | F |
| (14,665.7) | (144) | (10.8) |
| 3 | 30 | 15,069.1 | A | 372 | 20.7 | A |
| (6018.1) | (155) | (2.6) |
| 40 | 29,681.4 | B | 420 | 35.1 | B |
| (10,074.5) | (113) | (3.3) |
| 50 | 48,854.5 | C | 410 | 43.3 | C |
| (3976.2) | (51) | (13.3) |
Table 6.
Means of twelve trees and their corresponding standard deviation (in parenthesis) for total knot/tree ratio (K/T) for western hemlock trees harvested from three different sites. Data from the three DBH classes is pooled.
Table 6.
Means of twelve trees and their corresponding standard deviation (in parenthesis) for total knot/tree ratio (K/T) for western hemlock trees harvested from three different sites. Data from the three DBH classes is pooled.
| Site | K/T (/103) |
|---|
| 1 | 7.832 | A 1 |
| (2.631) |
| 2 | 10.873 | B |
| (2.082) |
| 3 | 6.837 | A |
| (1.787) |
Table 7.
Estimations of coefficients for predicting total knot volume (KV), number of knots (NK), average knot area (KA) and knot/tree ratio (K/T). An asterisk indicates a significant p-value at the 95% confidence level.
Table 7.
Estimations of coefficients for predicting total knot volume (KV), number of knots (NK), average knot area (KA) and knot/tree ratio (K/T). An asterisk indicates a significant p-value at the 95% confidence level.
| | Log (KV) | NK | Log (KA) | Log (K/T) |
|---|
| 6.6658
(0.3035) 1 | 50.3042
(74.5801) | 1.7293
(0.1850) | 0.4389
(0.2913) |
| 0.008555 *
(0.0007460) | 0.7978 *
(0.1833) | 0.004429 *
(0.0004547) | 0.003232 *
(0.000716) |
| 1.4179 *
(0.4402) | 243.5674 *
(108.1680) | - | 1.3801 *
(0.4226) |
| −0.002805 *
(0.001081) | −0.44576
(0.26562) | - | −0.002565 *
(0.001038) |
Table 8.
Means and standard deviations (in parenthesis) of lumber volume recovery (%) based on X-ray CT-scanned log volumes obtained from twelve amabilis fir and twelve western hemlock stems for each DBH class and virtual lumber volumes obtained by simulation in two types of sawmills (Interior random and Coastal).
DBH Class
(cm) | Interior Random Sawmill | Coastal Sawmill |
|---|
| Amabilis Fir | Western Hemlock | Amabilis Fir | Western Hemlock |
|---|
| 30 | 69.15 | 65.33 | 62.21 a 1 | 58.60 c |
| (3.61) | (2.75) | (3.01) | (5.05) |
| 40 | 70.13 | 67.86 | 63.30 a | 61.99 c |
| (2.01) | (2.15) | (1.90) | (2.94) |
| 50 | 68.52 | 66.43 | 58.11 b | 56.87 d |
| (1.87) | (2.50) | (3.14) | (3.80) |
| Total | 69.26 | 66.54 | 61.20 | 59.15 |
| (2.59) | (2.59) | (3.44) | (4.40) |
Table 9.
Means and standard deviations (in parenthesis) of total values (CAD) of lumber in the baseline economic scenario obtained from twelve amabilis fir and twelve western hemlock stems for each DBH class processed in two virtual sawmills (Interior random and Coastal).
Table 9.
Means and standard deviations (in parenthesis) of total values (CAD) of lumber in the baseline economic scenario obtained from twelve amabilis fir and twelve western hemlock stems for each DBH class processed in two virtual sawmills (Interior random and Coastal).
DBH Class
(cm) | Interior Random Sawmill | Coastal Sawmill |
|---|
| Amabilis Fir | Western Hemlock | Amabilis Fir | Western Hemlock |
|---|
| 30 | 485.52 a 1 | 460.35 A | 341.46 d | 321.58 D |
| (118.12) | (110.49) | (72.65) | (74.52) |
| 40 | 1004.16 b | 899.64 B | 638.63 e | 590.82 E |
| (133.00) | (117.32) | (75.53) | (68.04) |
| 50 | 1331.40 c | 1239.50 C | 836.29 f | 778.74 F |
| (200.47) | (101.49) | (79.04) | (72.60) |
| Total | 940.36 | 866.50 | 605.46 | 563.71 |
| (383.83) | (340.64) | (218.99) | (202.63) |
Table 10.
Linear mixed model for predicting lumber recovery. A total of 144 observations and 72 groups were used.
Table 10.
Linear mixed model for predicting lumber recovery. A total of 144 observations and 72 groups were used.
| Random Effects | (Intercept) | Residual |
|---|
| Standard deviation | 2.6653 | 1.8458 |
| Fixed effects | Estimate | Standard Error |
| Intercept | 63.4231 | 4.0805 |
| Predicted KA | 3.1673 | 1.7805 |
| Predicted NK | −0.0355 | 0.0095 |
| Interior random mill | 7.7216 | 0.3120 |
Table 11.
Fixed-effect model predicting grade distribution in Interior random and Coastal mill. AIC values are listed for each grade prediction.
Table 11.
Fixed-effect model predicting grade distribution in Interior random and Coastal mill. AIC values are listed for each grade prediction.
| Sawmill | Interior Random | Coastal |
|---|
| Grade | Grade 1 | Grade 2 | Grade 3 | Grade 4 | Grade 1 | Grade 2 |
|---|
| Intercept | −57.54
(4.94) | −15.82
(2.88) | −42.05
(10.91) | −3.60
(2.38) | −27.71
(11.48) | −9.97
(4.54) |
| DBH | 0.24
(0.01) | 0.10
(0.01) | −0.05
(0.02) | | 0.10
(0.01) | −0.03
(0.01) |
| Height | | | 0.01
(0.00) | 0.0018
(0.0007) | 0.01
(0.00) | |
| Species | −4.53
(1.84) | | | −0.85
(0.40) | −5.53
(1.75) | |
| Predicted KA | | | 16.03
(5.20) | | | 6.70
(2.36) |
| AIC | 524.0 | 430.0 | 360.7 | 282.8 | 422.1 | 246.4 |
Table 12.
Estimated parameter means and standard errors in parentheses of value prediction under the baseline, optimistic and pessimistic economic scenarios in Interior random mill and Coastal mill. AIC values are listed for each scenario.
Table 12.
Estimated parameter means and standard errors in parentheses of value prediction under the baseline, optimistic and pessimistic economic scenarios in Interior random mill and Coastal mill. AIC values are listed for each scenario.
| Economic Cycle | Baseline | Optimistic | Pessimistic |
|---|
| Sawmill Type | Interior | Coastal | Interior | Coastal | Interior | Coastal |
|---|
| Intercept | −2030.55
(336.22) | −1405.87
(215.16) | −2551.86
(418.61) | −1726.30
(265.35) | −1684.13
(281.11) | −1184.65
(181.66) |
| DBH | 3.89
(0.26) | 1.27
(0.43) | 4.87
(0.32) | 1.63
(0.53) | 3.25
(0.22) | 1.095
(0.36) |
| Height | 0.18
(0.068) | 0.19
(0.031) | 0.23
(0.085) | 0.23
(0.038) | 0.145
(0.057) | 0.16
(0.026) |
| Species | −103.26
(26.57) | | −127.73
(33.08) | | −86.63
(22.21) | |
| Predicted KA | | 335.46
(102.96) | | 405.99
(126.98) | | 280.70
(86.93) |
| Predicted NK | | −0.89
(0.19) | | −1.096
(0.23) | | −0.75
(0.16) |
| Predicted Grade 1 | −19.80
(9.00) | | −25.10
(11.22) | | −16.26
(7.53) | |
| Predicted Grade 2 | 33.13
(15.90) | | 42.42
(19.79) | | 26.91
(13.29) | |
| Predicted Grade 3 | 26.59
(10.61) | | 31.66
(13.21) | | 22.39
(8.87) | |
| AIC | 887.0 | 790.5 | 918.6 | 820.7 | 861.3 | 766.1 |
| Publisher’s Note: MDPI stays neutral with regard to jurisdictional claims in published maps and institutional affiliations. |
© 2021 by the authors. Licensee MDPI, Basel, Switzerland. This article is an open access article distributed under the terms and conditions of the Creative Commons Attribution (CC BY) license (https://creativecommons.org/licenses/by/4.0/).


