Article

Generic Additive Allometric Models and Biomass Allocation for Two Natural Oak Species in Northeastern China

1
Qianyanzhou Ecological Research Station, Key Laboratory of Ecosystem Network Observation and Modeling, Institute of Geographic Sciences and Natural Resources Research, Chinese Academy of Sciences, Beijing 100101, China
2
Zhongke-Ji’an Institute for Eco-Environmental Sciences, Ji’an 343016, China
3
Academy of Forest Inventory and Planning, National Forestry and Grassland Administration, Beijing 100714, China
4
Planning & Design Institute of Forest Products Industry, National Forestry and Grassland Administration, Beijing 100010, China
*
Author to whom correspondence should be addressed.
Forests 2021, 12(6), 715; https://doi.org/10.3390/f12060715
Submission received: 3 April 2021 / Revised: 15 May 2021 / Accepted: 27 May 2021 / Published: 31 May 2021
(This article belongs to the Section Forest Ecology and Management)

Abstract

:
Current models for oak species could not accurately estimate biomass in northeastern China, since they are usually restricted to Mongolian oak (Quercus mongolica Fisch. ex Ledeb.) on local sites, and specifically, no biomass models are available for Liaodong oak (Quercus wutaishanica Mayr). The goal of this study was, therefore, to develop generic biomass models for both oak species on a large scale and evaluate the biomass allocation patterns within tree components. A total of 159 sample trees consisting of 120 Mongolian oak and 39 Liaodong oak were harvested and measured for wood (inside bark), bark, branch and foliage biomass. To account for the belowground biomass, 53 root systems were excavated following the aboveground harvest. The share of biomass allocated to different components was assessed by calculating the ratios. An aboveground additive system of biomass models and belowground equations were fitted based on predictors considering diameter (D), tree height (H), crown width (CW) and crown length (CL). Model parameters were estimated by jointly fitting the total and the components’ equations using the weighted nonlinear seemingly unrelated regression method. A leave-one-out cross-validation procedure was used to evaluate the predictive ability. The results revealed that stem biomass accounts for about two-thirds of the aboveground biomass. The ratio of wood biomass holds constant and that of branches increases with increasing D, H, CW and CL, while a reverse trend was found for bark and foliage. The root-to-shoot ratio nonlinearly decreased with D, ranging from 1.06 to 0.11. Tree diameter proved to be a good predictor, especially for root biomass. Tree height is more prominent than crown size for improving stem biomass models, yet it puts negative effects on crown biomass models with non-significant coefficients. Crown width could help improve the fitting results of the branch and foliage biomass models. We conclude that the selected generic biomass models for Mongolian oak and Liaodong oak will vigorously promote the accuracy of biomass estimation.

1. Introduction

Mongolian oak (Quercus mongolica Fisch. ex Ledeb.) and Liaodong oak (Quercus wutaishanica Mayr) are very similar in both morphological characteristics and geographical distribution. Both species are valuable and occupy the secondary broadleaved deciduous forest regions widely distributed in northeastern China [1]. Furthermore, the two oak species have strong adaptability, with characteristics of resistance to drought and impoverishment, which play an important role in biodiversity protection and sustainable forestry development. To assess forest productivity, carbon stocks and dynamics, matter and energy flows and forest ecosystem services, accurate quantification of forest biomass is of great importance [2,3,4]. The most accurate and direct way for quantification of tree biomass includes harvesting all trees in a specific community and measuring the green and oven-dried weights of both the stem and crown components. However, the use of destructive sampling is enormously time-consuming, expensive and restricted to small trees or small sample sizes; it is also not recommended in nature reserves and on endangered tree species [5]. To overcome these limitations, the indirect estimation of biomass based on allometric equations is an alternative and rapid method without destruction if accuracy is not compromised [6,7]. To our knowledge, only a few studies have developed allometric models for estimating the biomass of Mongolian oak [8,9,10], and they were usually based on local sites and a few sample trees. However, almost no biomass models exist for Liaodong oak, and especially no generic biomass equations have been reviewed for the two species.
Tree biomass is generally divided into aboveground and belowground parts, and the aboveground biomass can separate into four components, including stem wood, bark, branch and foliage. The components’ biomass models are available for elucidating the variability within a tree and also useful in wildfire assessment and wood/bioenergy production [11]. When developing a tree component biomass regression equation, a desirable feature is that the sum of the predicted values from the separate equations for each component should equal the prediction from the total tree biomass models, also known as additivity [12]. However, some published biomass models were non-additive, e.g., [10,13], resulting in an inconsistency between the sum of the components’ estimates and the total estimates [14]. Furthermore, separately fitting the biomass models by applying the least square method might ignore the inherent correlations among different biomass components of an individual tree. Parresol [15] concluded that considering this inherent correlation by constructing an additive system of biomass equations can acquire higher statistical efficiency.
Many studies have discussed the issue of ensuring additivity among a set of equations for the whole tree and its biomass components [14,16,17], and the additivity can be solved by fitting total tree and components biomass models simultaneously as a model system. Some corresponding methods are as follows: the generalized method of moments (GMM), the adjustment in proportion and nonlinear joint estimate, the seemingly unrelated regression (SUR) and nonlinear seemingly unrelated regression (NSUR) methods. Of these, the SUR and NSUR methods are the most flexible and general methods to ensure biomass additivity [12], and have become popular in recent years [5,15,18]. The two methods allow for the additive system of biomass equations using different forms of mathematical equations for each component with specific explanatory variables [19]. In particular, heteroscedasticity could be addressed through NSUR by applying a specific weighting function for each component equation, and the different weighting functions can also remove the singularity problem in the across-equation variance and covariance matrix [20].
Knowledge of belowground biomass and its dynamics is essential to fully understand the role of roots in carbon sequestration and climate change mitigation [21]. However, estimations of forest biomass have always been limited to the aboveground biomass by simply ignoring the belowground biomass [22], mainly due to the big workload in root excavation or the limited availability of allometric equations for belowground biomass [23]. Some other studies estimated belowground biomass by directly multiplying aboveground biomass using the root-to-shoot ratio (RS ratio). However, the RS ratio varies considerably with tree age and environmental conditions [24,25]. Since there are large unexplored errors in belowground biomass estimation, an alternative option for quantifying the amounts of belowground biomass is allometric equations if the information on individual trees is available [2,23].
In general, allometric biomass equations using diameter at breast height (D) alone as an explanatory variable are commonly used because of their quick and easy measurement with high accuracy. Tree height (H) has also been investigated and included as a main predictor to improve model availability across forest types [24,26] as D-H allometry depends on environmental conditions [7]. Furthermore, crown width (CW) or crown area, wood density and tree age have been integrated into biomass estimations to enhance the predictive abilities of models [5,22,27,28]. However, some variables, such as wood density, need additional work, extending the project time and increasing costs [29]. Furthermore, allometric models with multiple predictors require forest inventory datasets that contain the relevant factors.
The objective of this study was to develop generic biomass models for the two oak species in northeastern China. We focused on additive systems of biomass equations for the aboveground components, but we also constructed biomass models for roots. Both the aboveground and root biomass equations were validated through the leave-one-out cross-validation method and also compared to published models to explore the potential for application. Furthermore, we assessed the biomass allocation patterns and presented the trend that the RS ratios varied with diameter.

2. Materials and Methods

2.1. Study Area Description

This study was conducted in the Daxing’anling mountains (47°03′–53°33′ N, 119°36′–127°00′ E), the Xiaoxing’anling mountains (46°28′–49°21′ N, 127°42′–130°14′ E) and the Changbai mountains (43°31′–47°30′ N, 127°40′–134°00′ E), located in the Inner Mongolia autonomous region and Heilongjiang province, northeastern China (Figure 1). The three mountains have a distinct continental monsoon climate. In the Daxing’anling mountains, the elevation varies between 425 m and 1760 m above sea level, the mean annual temperature is −2.8 °C and the annual precipitation is around 460 mm, which is mainly distributed from May to October. In the Xiaoxing’anling mountains, the elevation ranges from 500 m to 1000 m, the mean annual temperature is from −2.0 °C to 2.0 °C and the annual precipitation is from 550 mm to 670 mm, concentrated mostly in summer. In the Changbai mountains, the elevation ranges from 800 m to 1800 m, the mean annual temperature is from −7.0 °C to 3.0 °C and the annual precipitation is from 700 mm to 1400 mm, which mainly happens from June to October. The substrate soils are predominantly brown coniferous forest soil for the three regions. These cold temperate forests are dominated by Dahurian larch (Larix spp.), White birch (Betula platyphylla Suk.), Aspen (Populus davidiana Dode.), Korean pine (Pinus koraiensis Sieb. et Zucc.), Amur linden (Tilia amurensis Rupr.), Mongolian oak, Manchurian ash (Fraxinus mandschurica Rupr.), Amur corktree (Phellodendron amurense Rupr.), Maple (Acer mono Maxim.) and Manchurian walnut (Juglans mandshurica Maxim.), among others.

2.2. Biomass Data

A total of 159 oak trees (120 and 39 Mongolian oak and Liaodong oak trees, respectively) were selected with a D between 1.5 cm and 33.0 cm. A destructive sampling method with direct field measurements was adopted to gather the biomass data, where the stem wood (inside bark), bark, branch and foliage components were measured separately. Because of the difficulty in root excavation, 53 trees with a D spanning 1.5–32.8 cm were selected for root biomass collection and used to establish allometric equations for root biomass estimation.
For each tree, the CW (twice the crown radius, i.e., twice the distance between the center of the bole and the outer edge of the crown) of the sampled trees was obtained from the average of two diameters measured along the North/South and East/West orientation. After felling with chain saws, D (1.30 m), H and crown length (CL, the distance from the first live branch to the treetop) were immediately measured and recorded. A general positive correlation between H and D was observed, as displayed in Figure 2, in which the vertical bars indicate the sample distribution across the different diameter classes.
For each felled tree, the live crown was evenly separated into three layers, and three sample branches that were representative in size and foliage amount for each layer were selected to separate, weighing the fresh weight of the branches and foliage. Subsamples of the branches and foliage were then randomly collected and weighed, and bagged for water content determination in the laboratory. Subsequently, the stem was equally divided into ten sections and each section was weighed directly in the field. At the position corresponding to a 0.1, 0.3 and 0.7 tree height, 3- to 5-cm-thick stem discs were cut, and after removing the bark, weighed to acquire the fresh weight of the stem wood. These discs and the removed bark were taken back to the laboratory for determining the water content. For root extraction, the soil was manually and carefully removed to obtain as intact roots as possible, especially fine roots. All extracted roots were weighed and recorded. The tree stump was dug out completely at last to measure the fresh weight. Subsamples of different root classes and stumps were randomly gathered and weighed, and taken back to the laboratory for determining the water content.
All subsamples of the stem wood, bark, branches, foliage, roots and stumps were oven-dried at 105 °C for 72 h to constant weight to estimate the water content. The dry weights of the different components were then computed by subtracting the weight of the water from the fresh weights; i.e., the dry biomass of each component was calculated by multiplying the fresh weight by the respective ratio of the dry mass to fresh mass. For each sampled tree, the sum of the dry biomass of the stem wood, bark, branches and foliage yielded the aboveground biomass. Root (belowground) biomass was regarded as the sum of the root dry biomass and stump dry biomass (Table 1).

2.3. Data Analysis

Aboveground biomass allocated to wood, bark, branches and foliage was evaluated by calculating the biomass fractions for each component; i.e., the proportion of the component’s biomass to the aboveground biomass. Bivariate relationships between biomass fractions and D, H, CW and CL were further graphically examined for each component. The RS ratio (i.e., root biomass/aboveground biomass) varying with the diameter class was graphically examined.

2.3.1. Allometric Models Specification

Allometry relationships between the component biomass and explanatory variables are generally expressed as a power function, such that
W = β 0 X 1 β 1 X 2 β 2 X n β n + ε , ε ~ N 0 , σ 2
where W represents the biomass (kg), Xi (i = 1, 2, …, n) represent the easily measured explanatory variables that reflect the tree dimensions, βi (i = 1, 2, …, n) are model coefficients and ε is the error term, which is assumed to be normally distributed. As biomass data are significantly heteroscedastic, some approaches should be therefore taken to eliminate heteroscedasticity before parameter estimation [30]. In the present study, the weighted nonlinear regression was adopted, and the specific weighting function expressed as w = 1 / D Q , with a parameter Q, was derived from the residuals of the biomass models fitted separately by the ordinary least squares method [15,31].
The number of explanatory variables used in the allometric biomass models always ranges from one single predictor (D) to several or multiple predictors (e.g., H, CW and CL) [32]. Since the tree-dimension information available from the oak datasets in this study were D, H, CW and CL, we established the basic biomass models based on D alone and tested the model fitting improvement by adding the H, CW and CL variables as additional predictors. Thus, the following seven candidate models were fitted to the data:
W = β 0 D β 1 + ε
W = β 0 D β 1 H β 2 + ε
W = β 0 D β 1 C W β 3 + ε
W = β 0 D β 1 C L β 4 + ε
W = β 0 D β 1 H β 2 C W β 3 + ε
W = β 0 D β 1 H β 2 C L β 4 + ε
W = β 0 D β 1 H β 2 C W β 3 C L β 4 + ε
where W represents the biomass (kg), βi are coefficients and ε is the error term.
To ensure the additivity, tree aboveground biomass and its components were simultaneously fitted using the NSUR method based on the aforementioned seven nonlinear models (Equations (2)–(8)), with D, H, CW and CL as explanatory variables. Due to the difference in the sample size of the root and aboveground biomass, root biomass models were separately developed using these equations. Following the model structure specified by Parresol [15], the additive model system constrains the components’ biomass to equal the aboveground biomass, and can be written as:
W wd = f wd X wd , β wd + ε wd W bk = f bk X bk , β bk + ε bk W br = f br X br , β br + ε br W fo = f fo X fo , β fo + ε fo W ag = f wd X wd , β wd + f bk X bk , β bk + f br X br , β br + f fo X fo , β fo + ε ag
where Wm represents components’ biomass (kg); m = wd, bk, br, fo and ag represent the wood, bark, branch, foliage and aboveground biomass, respectively; fm (Xm, βm) is a nonlinear equation of the biomass component m; and εm is an error term for biomass component m.
In the additive model system, all components and aboveground biomass models were jointly fitted adopting the weighted NSUR [15,20]. Fitting was conducted using the PROC MODEL procedure of SAS 9.3 (SAS Institute Inc., Cary, NC, USA).

2.3.2. Model Evaluation and Selection

The aboveground additive biomass model systems and root biomass equations were fitted to the entire dataset. The model fitting was assessed by looking at two goodness-of-fit statistics: root mean square error (RMSE) and adjusted coefficient of determination ( R a d j 2 ). The best equation with the most suitable predictors for each component was selected according to minimum RMSE and maximum R a d j 2 from the models with significant parameter estimates. The statistical significance (p < 0.05) of the estimated coefficients was taken into consideration as well. The best additive model system was reconstructed by combining the selected best biomass equations with the available predictors for each component. Since the diameter is an imperative factor in the field measurement and other factors may be missing in some forest inventory data, an additive model system using D as the only independent variable was considered as an alternative approach for predicting biomass. Both model systems were assessed by the aforementioned criteria. The leave-one-out cross-validation method was further used to test the selected aboveground and root biomass models. Graphical analyses of the predicted vs. observed values were plotted for each component and the prediction performance was evaluated by two statistical indices: mean prediction error (MPE) and mean percent standard error (MPSE). The mathematical expressions of these statistics are as follows:
RMSE = y j y ^ j 2 / n k
R adj 2 = 1 1 y j y ^ j 2 / y j y ¯ 2 × n 1 / n k
MPE = t α × y j y ^ j ,   j   2 / n p / y ¯ × n × 100
MPSE = y j y ^ j , j / y ^ j , j / n × 100
where yj is the j-th observed biomass value; y ^ j is the j-th biomass value estimated by the model; y ¯ is the mean of observed biomass value; n is the total number of samples; k is the number of parameters; and y ^ j , j is the j-th value predicted by the model fitting with n − 1 remaining observations, excluding the j-th observation.

2.3.3. Comparison to Existing Biomass Models

The measured biomass data of Mongolian oak in this study was used to compare the relative error (RE) of the existing species-specific equations reported by these studies [8,9,10], which included D and H as predictors. These models are only valid within the range of the independent variables, and the measured data within the specific range are therefore used. Table 2 provides a summary of these existing biomass models.
RE = W ^ i W i / W i × 100
where W ^ i and Wi represent the predicted and observed dry weight of tree i.

3. Results

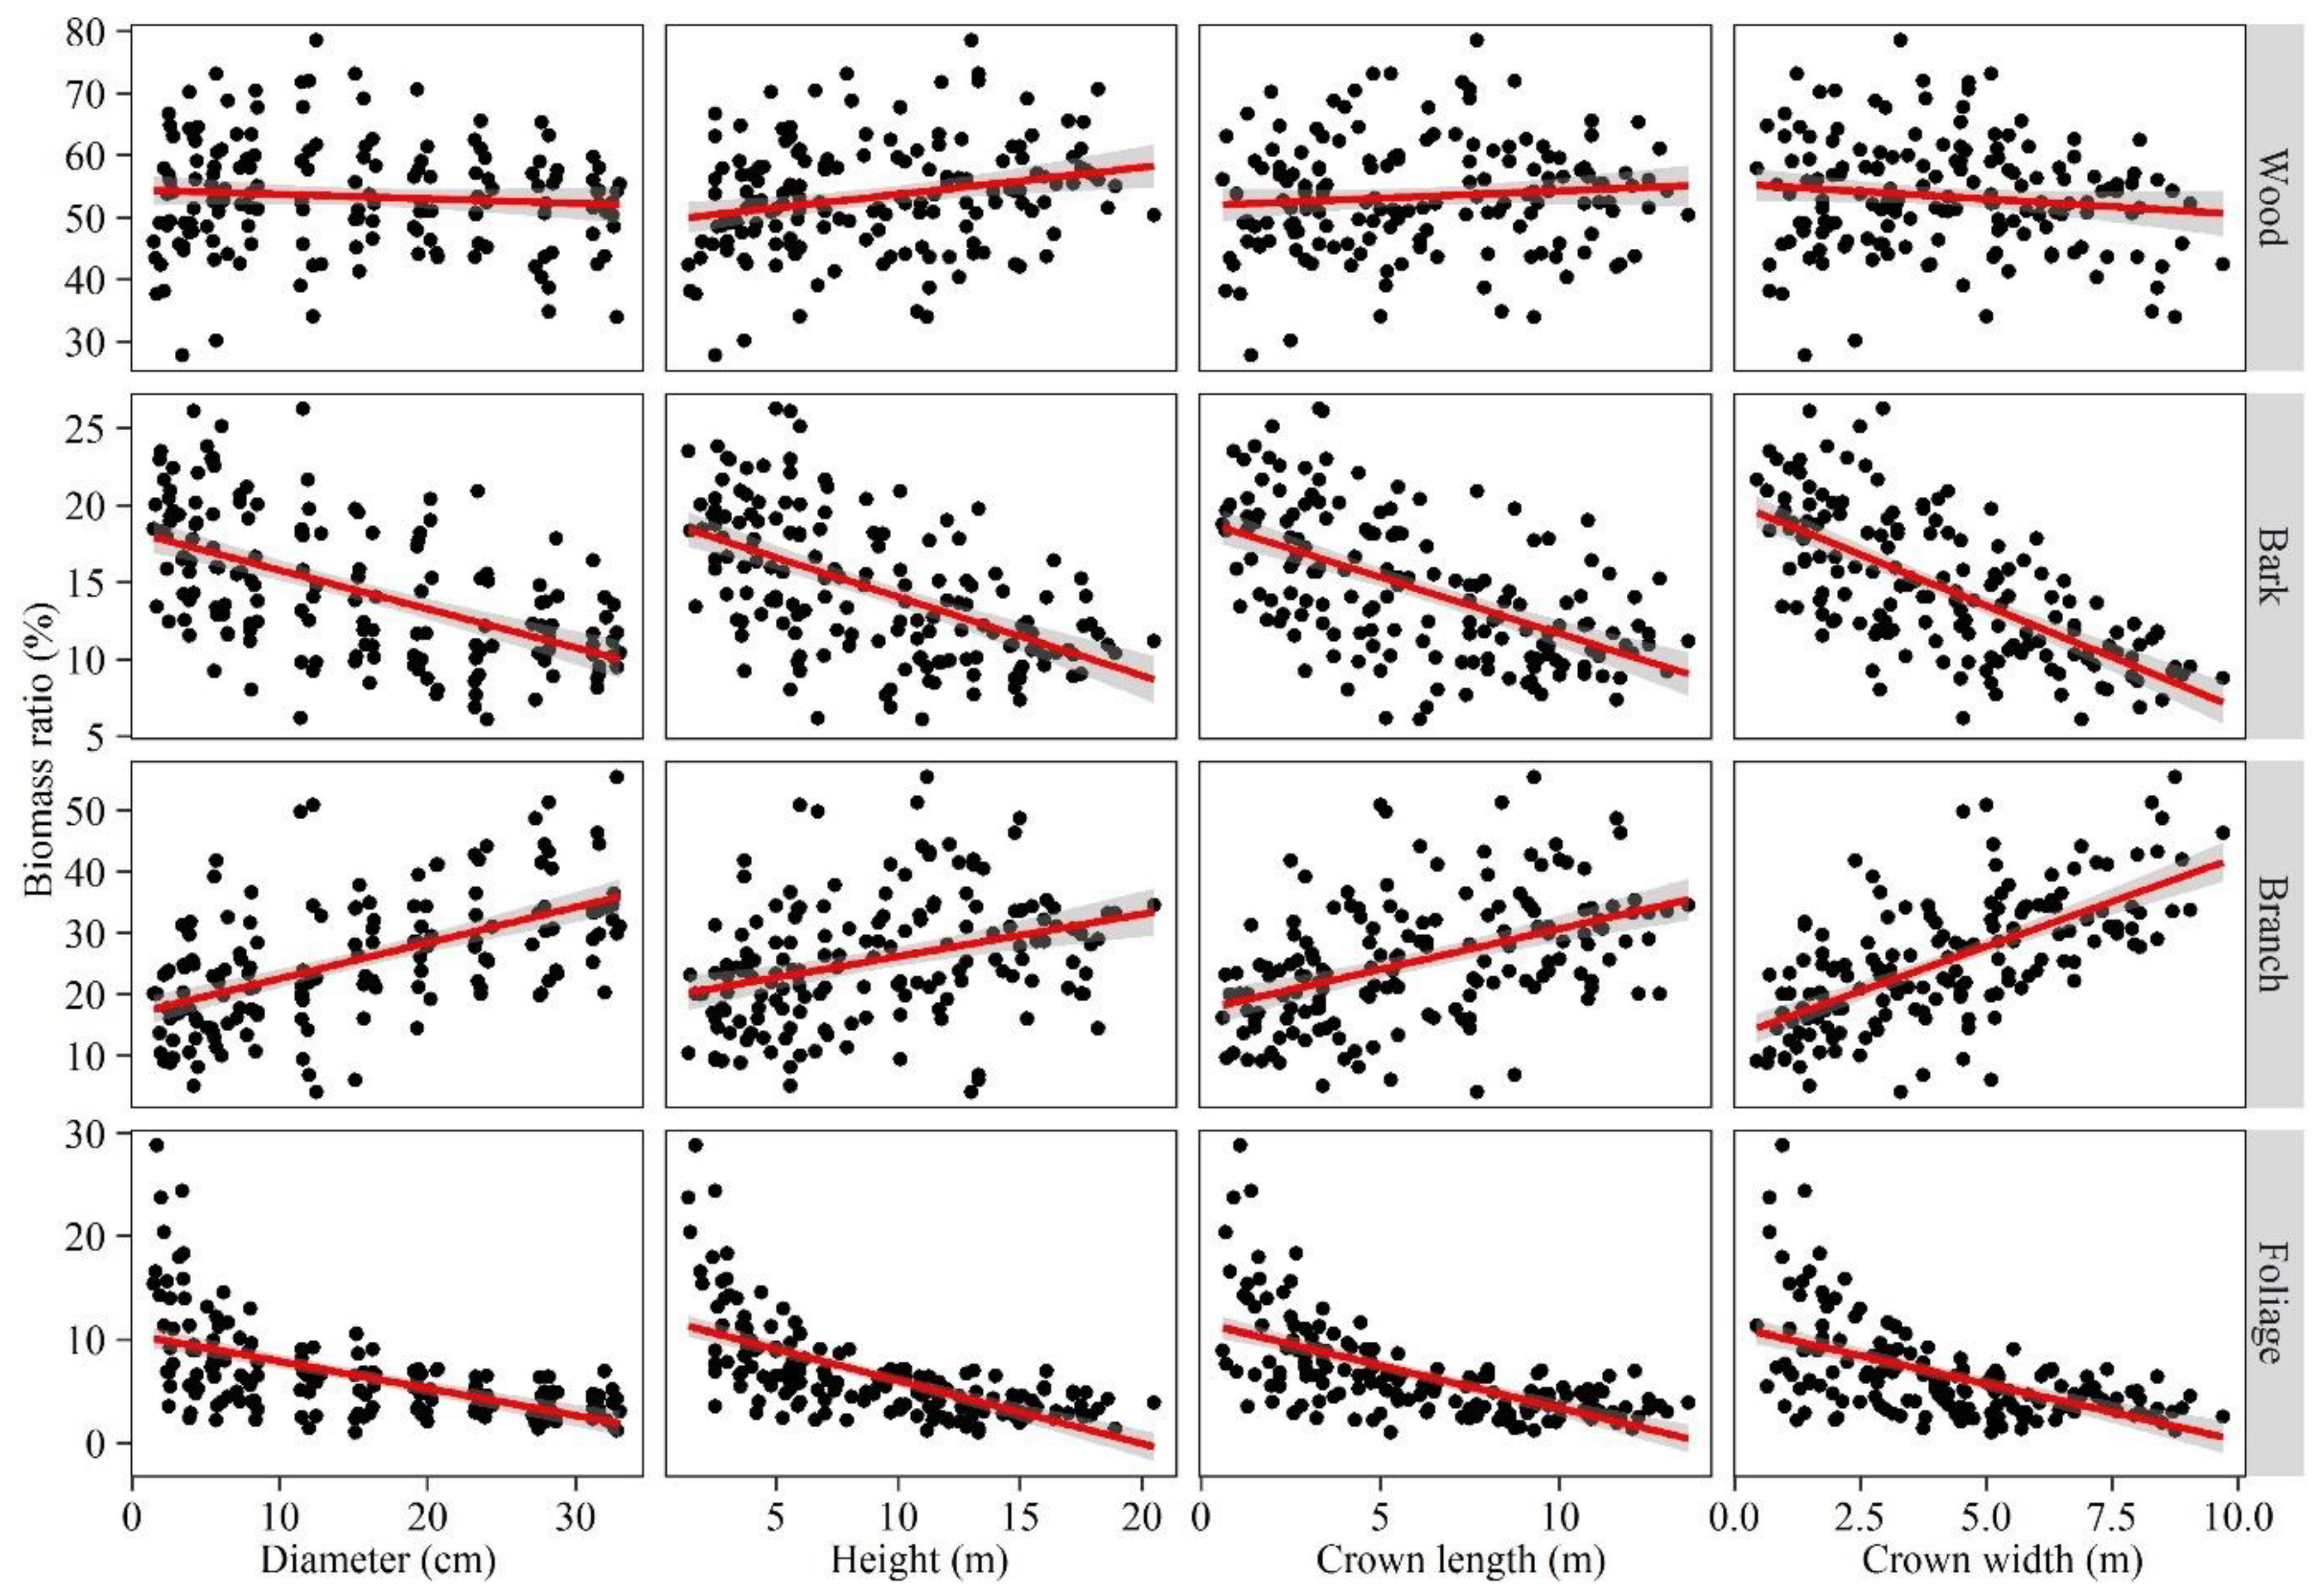
3.1. Aboveground Biomass Partitioning

There are large differences in the fractions of the different components that account for the aboveground biomass. Aboveground biomass allocated a large proportion to stems (approximately 68%), with a partitioning proportion of 53% and 15% for stem wood and bark, respectively. By contrast, crown biomass possesses a relatively small part of the aboveground biomass, with an average value of 32%, which can be separated into branches and foliage in the proportion of 25% and 7%, respectively. The relationships between the component biomass fractions and diameter, height, crown length and crown width were further examined graphically and displayed in Figure 3. In general, the ratio of wood biomass to aboveground biomass remains constant versus these factors. With the increase in D, H, CW and CL, both bark and foliage showed a decreasing percentage, while a reverse trend was observed for the branch component.

3.2. Root-to-Shoot Ratio

Among the individual trees that were sampled for both aboveground and root biomass, the RS ratio varied from 0.11 to 1.06 and was related to diameter (Figure 4). The RS ratio nonlinearly decreased with increasing D. The mean RS ratio of the 53 individuals was 0.37.

3.3. Biomass Models

The nonlinear trend in observed biomass of the stem wood, bark, branch, foliage, aboveground biomass and roots, as a function of D, H, CL and CW, is shown in Figure 5. The fitting results of the aboveground additive systems and root biomass equations based on the seven candidate models are summarized in Table 3. Regression coefficients of the D-based models were statistically highly significant (p < 0.001) for all components, with R a d j 2 ranging from 0.754 to 0.920. When adding other variables, some models yielded nonsignificant parameter estimates (p > 0.05) and were, therefore, considered invalid. For example, although both RMSE and R a d j 2 showed little improvements in several root biomass models using additional variables, the coefficients were not significant. The equation with D as the only predictor was therefore most suitable for root biomass. In turn, for the aboveground components’ biomass models, using additional explanatory variables can provide both significant model parameter estimates (p < 0.05) and better fitting results with a lower RMSE and higher R a d j 2 . The stem wood biomass models showed the best fitting effects when using D, H, CW and CL as predictors, which had a lower RMSE (18.548 kg) and higher R a d j 2 (0.958). The bark biomass equations showed less error with D, H and CW as predictors, and the corresponding RMSE and R a d j 2 were 4.466 kg and 0.946, respectively. In comparison with the improvement of the wood and bark biomass models using H as an additional predictor, the branch and foliage equations yielded larger errors as well as non-significant coefficients when H was included. Both the branch and foliage biomasses were better predicted with smaller estimation errors when using D and CW; the corresponding RMSE and R a d j 2 were 19.081 kg and 0.907 for branches and 3.275 kg and 0.765 for foliage, respectively.
The allometric equations considered to be appropriate and available for biomass estimation are displayed in Table 4. Since D is the most important factor in forest inventorying and a desirable predictor in tree growth models, the additive system of biomass equations using D as the single predictor was chosen for potential biomass prediction (System 1). The best additive model system of the aboveground biomass equations was obtained through assembling the selected equation for each biomass component (System 2). Less obvious changes were observed for the biomass equations in System 2 compared to that in their original systems. While in comparison with System 1, the fitting results showed an improvement for both aboveground biomass and its components, especially for stem wood, where the R a d j 2 increased from 0.886 to 0.959 and RMSE decreased by 12.191 kg.

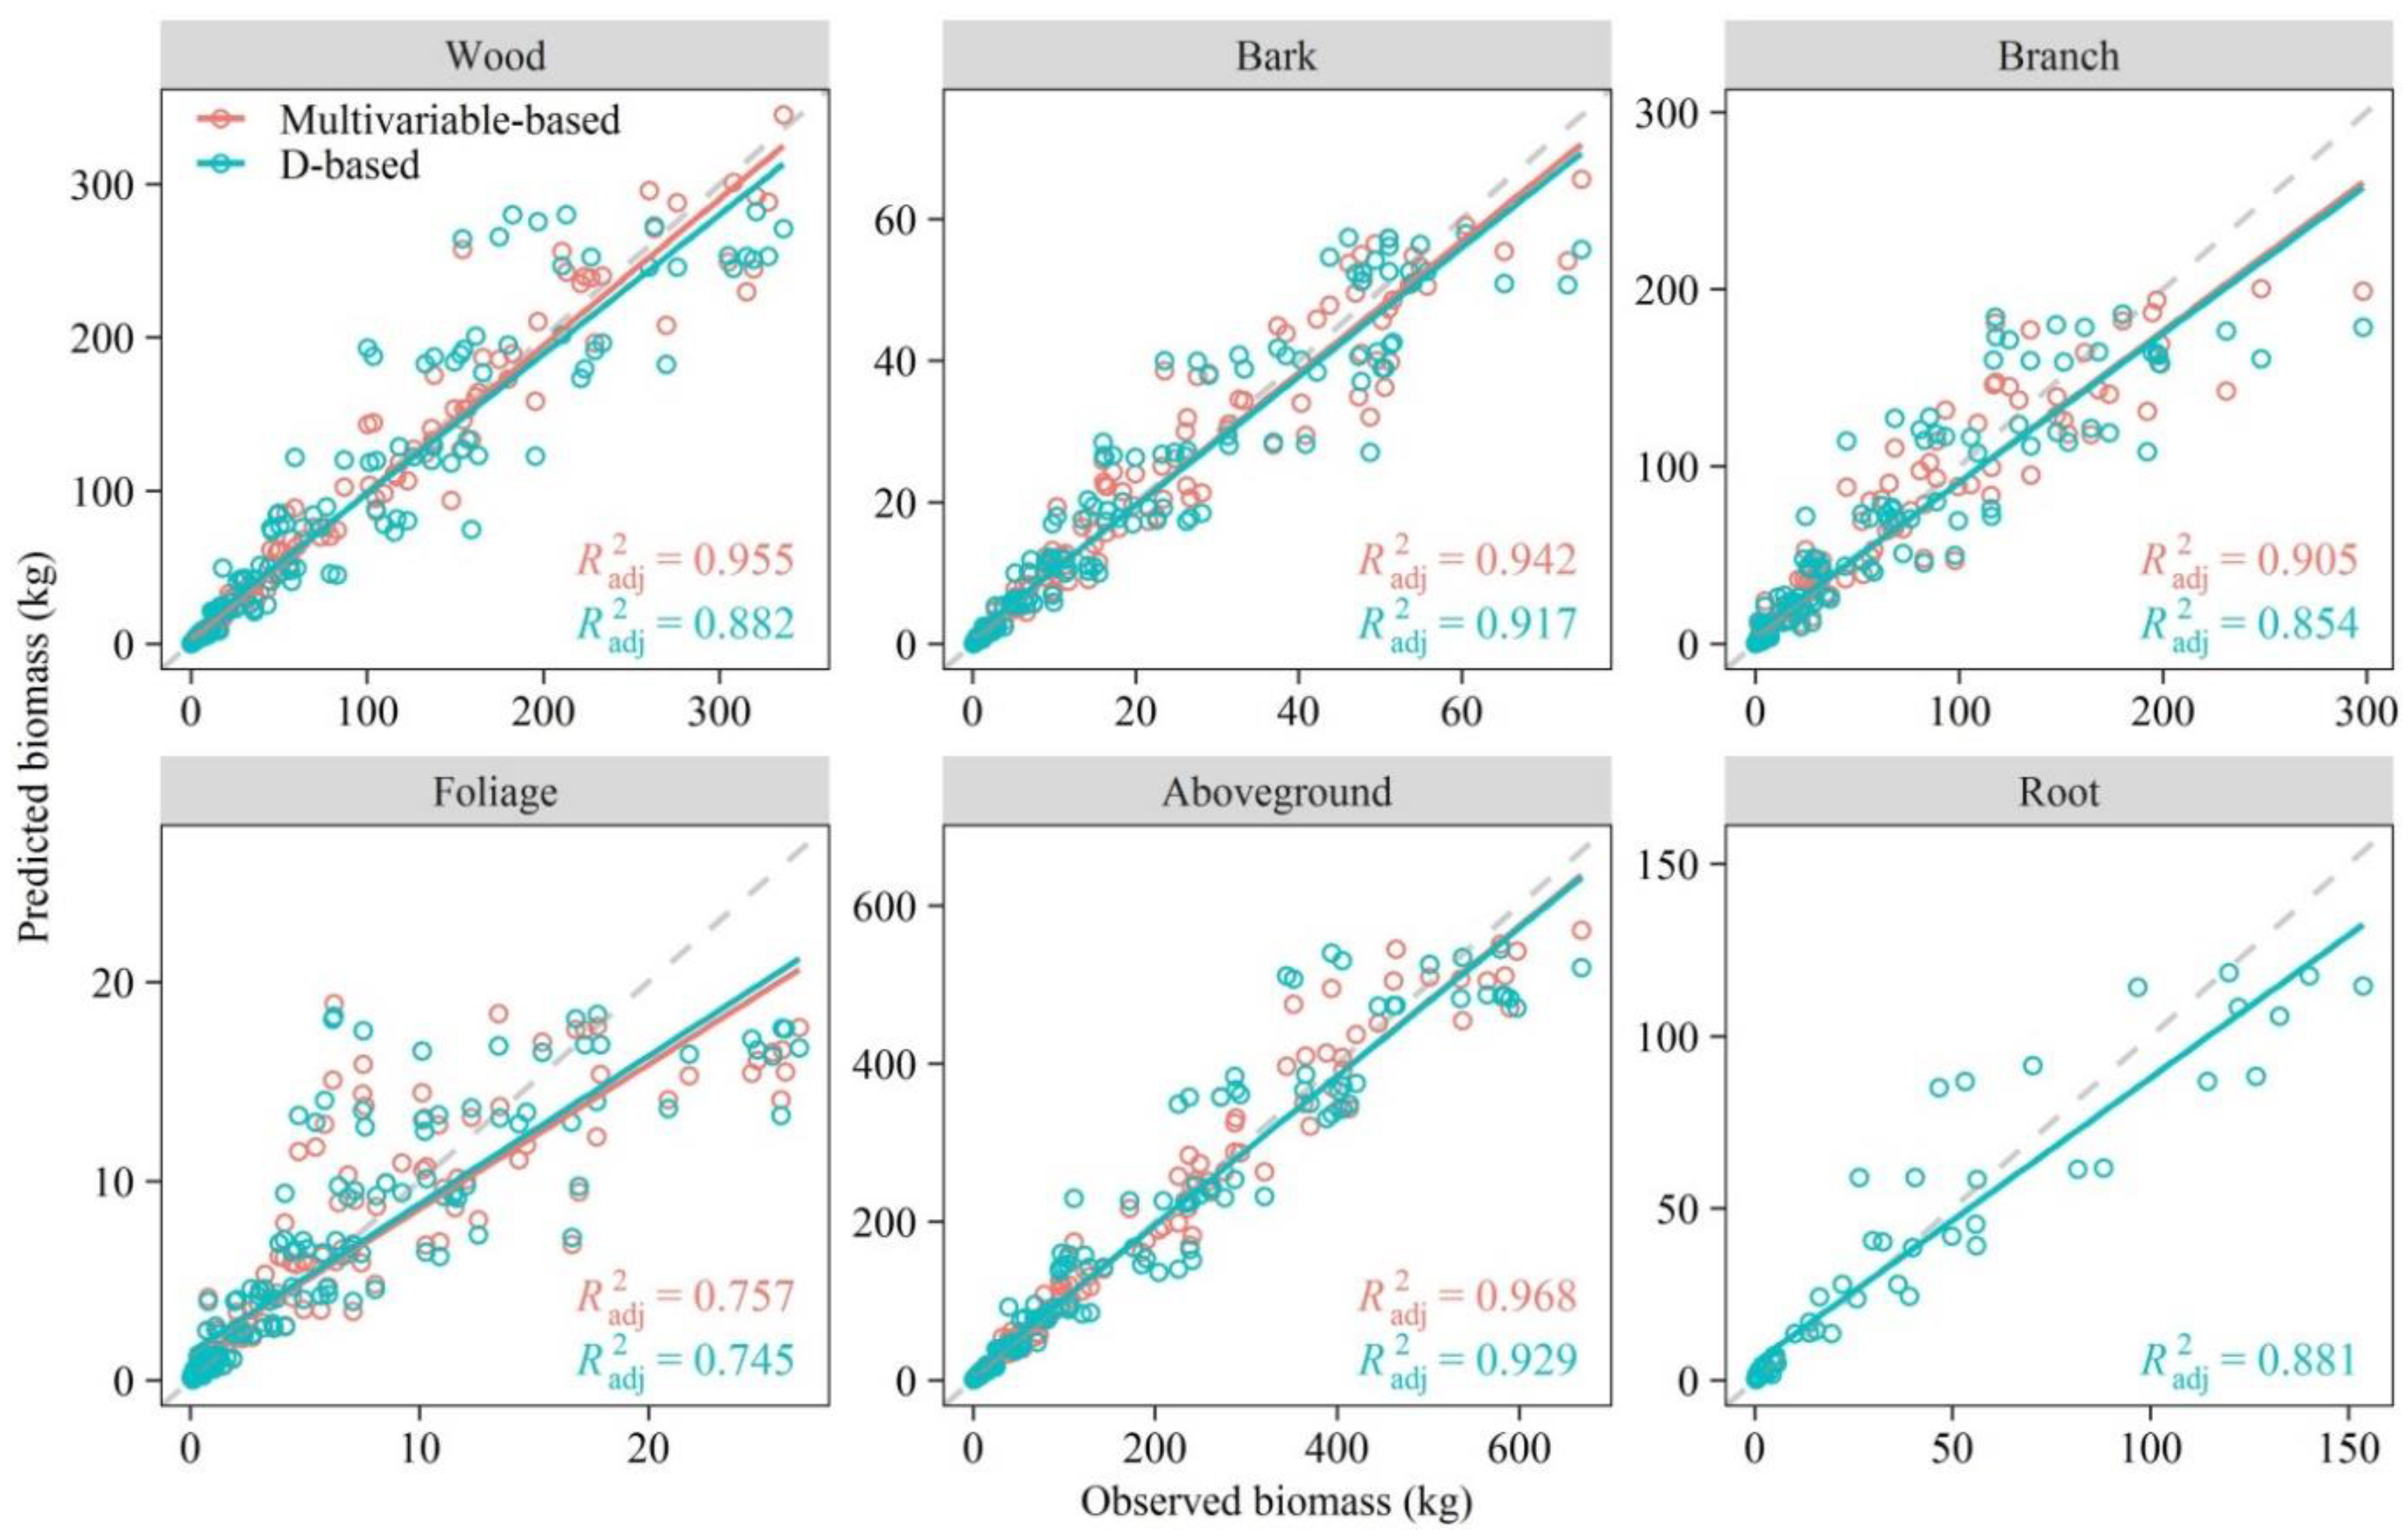
3.4. Model Cross-Validation

The predicting performance of the appropriate allometric equations, including System 1 (D-based) and System 2 (multivariable-based) for the aboveground biomass components and D-based equation for roots, was assessed through the leave-one-out cross-validation method. The predicted biomass versus observed biomass for each component is displayed in Figure 6. Biomass equations for wood, bark and aboveground biomass showed small prediction errors (the slopes were close to 1:1 line), whereas relatively large errors were obtained for the branch, foliage and root equations. For each component, the linear fitting slopes for the scatter plot of the predicted against observed biomass were essentially the same for the two additive systems of the biomass equations. The linear fitting effects based on System 2 were better than that based on System 1 for all the aboveground components, with a higher R a d j 2 and lower MPE and MPSE (Figure 7), indicating the predicted values of System 2 were closer to the observed values than System 1.

4. Discussion

Developing individual-based biomass models and estimating forest biomass has long become a prerequisite for studying productivity and in more recent times for assessing carbon accounting and its potential in mitigating climate change [33,34]. The two additive systems of aboveground biomass equations (Table 4) and the D-based root biomass equation obtained in the present study for two natural oak species (Mongolian oak and Liaodong oak) provide an operational approach for gaining precise biomass estimation in northeastern China.

4.1. Biomass Partitioning

The share of biomass of the tree components out of the aboveground biomass is commonly observed when making a comparison among species, diameter classes and tree ages [5,35]. The results of the present study indicated that wood biomass had the largest portion of aboveground biomass, and tree stems (both wood and bark included) accounted for about 68% of the total aboveground, while the crown had relatively less aboveground biomass allocation and foliage represented the smallest portion. The aboveground biomass allocation characteristic is consistent with previous studies for oak [8,9]. The relatively steady contribution of the wood to the aboveground biomass and the increased ratio of branch biomass versus tree size suggest that oak enhances the competitiveness of aboveground resource acquisition, such as light, perhaps mainly through promoting crown area growth to outcompete neighboring competitors. The foliage biomass proportion that decreased against increasing tree size may be due to foliage being borne on the relatively new branches, implying that the production of foliage biomass per unit of woody biomass decreases [5]. The increase in woody mass fraction, including the wood and branch components, and decrease in foliage with increasing tree size obtained in the present study could be explained by the fact that woody mass usually accumulates at the expense of foliage mass [35,36].

4.2. Root–Aboveground Biomass Link

Belowground biomass is commonly missing in most biomass datasets and is often indirectly obtained through the RS ratio based on aboveground biomass [22]. The RS ratio decreased significantly with an increase in diameter, namely, tree growth; this trend is similar to other relevant studies [24,25]. The mean value of the RS ratio observed in this study (0.37) is comparatively higher than the global mean value (0.26) reported by Cairns et al. [37] and the mean value (0.29) of broad-leaved species, including oak in China [38]. Mugasha et al. [2] reported a mean value of 0.40 in miombo woodlands, which is slightly higher. Since there is a nonlinear relationship between the RS ratio and diameter, the large difference among the mean RS ratios may be attributed to the sample size in the different diameter classes. Although the mean RS ratios have frequently been accepted for root biomass estimation for purposes such as productivity quantification and carbon accounting, the nonlinear trend indicates that using a fixed RS ratio to predict belowground biomass could introduce a bias [2,39]. Therefore, if root allometric biomass equations are not available, the application of RS ratios should be done with caution.

4.3. Allometric Equations

Biomass additivity has long been recognized as a desirable and important property when developing models to predict components and whole tree biomass [40] since the additive property eliminates the logical inconsistency between the sum of the estimated values for the tree components and the estimation provided by the total tree equation [14,41]. However, many biomass models reported to date are non-additive and established using the ordinary least square method [10,13]. The merits of NSUR make it an approach of selection to fit the system of biomass equations, considering the synergetic correlations for each component and correcting the inherent errors among the estimates of each model. In this case, the explanatory variables of the components’ biomass models constitute the predictors of the total tree biomass model and the additive property is thus guaranteed through setting parameter restrictions [15,19]. Furthermore, an additive system of biomass equations, when estimated by considering the contemporaneous correlations between the biomass components, has greater statistical efficiency and reduces the confidence and prediction intervals of the biomass estimates, resulting in lower variance [12,15,40].
Tree diameter, the most important index in forest inventories, is always used for developing biomass models, and tree height is often added to the models as an additional predictor [27,41]. Besides these, we also tested two other commonly suggested explanatory variables (CW and CL) in explaining the components’ biomass variability. Our results in Table 3 show that the root biomass equation with D as the single explanatory variable performed best with significant model coefficients, although the goodness-of-fit was not optimum. This was consistent with Djomo and Chimi [22] in that D alone was a good predictor for the belowground biomass estimation. As confirmed in many studies, the aboveground biomass models using only D as a predictor also gave good fitting results with significant coefficients for all components [24,42,43]. Using D reduces the limitations in reliability of the H and crown dimension (CW and CL) in most forest inventories, since the height and crown dimension measurements are difficult to measure in the field due to many factors, such as a dense canopy, taller trees and obstructions that hinder seeing the top of the tree [22,44].
Despite the difficulty in accurate measurements, including H as a second predictor in aboveground biomass models is often recommended as it improves the fitting effects [45,46]. In our case, the inclusion of H improved the stem wood and bark biomass estimations but reduced the fitting efficiency for branch and foliage biomass models, in which the coefficients for the H variable were nonsignificant and not always positive (Table 3). These results are in agreement with previous relevant studies [20,47,48,49]. In general, the crown dimension varies greatly among species, reflecting different biomass allocation strategies [45]. This study found that the inclusion of CW and/or CL slightly improved the model fits for the aboveground components, especially for stem wood and bark, contradicting the results that adding crown radius could greatly improve model performance and reduce error [50].

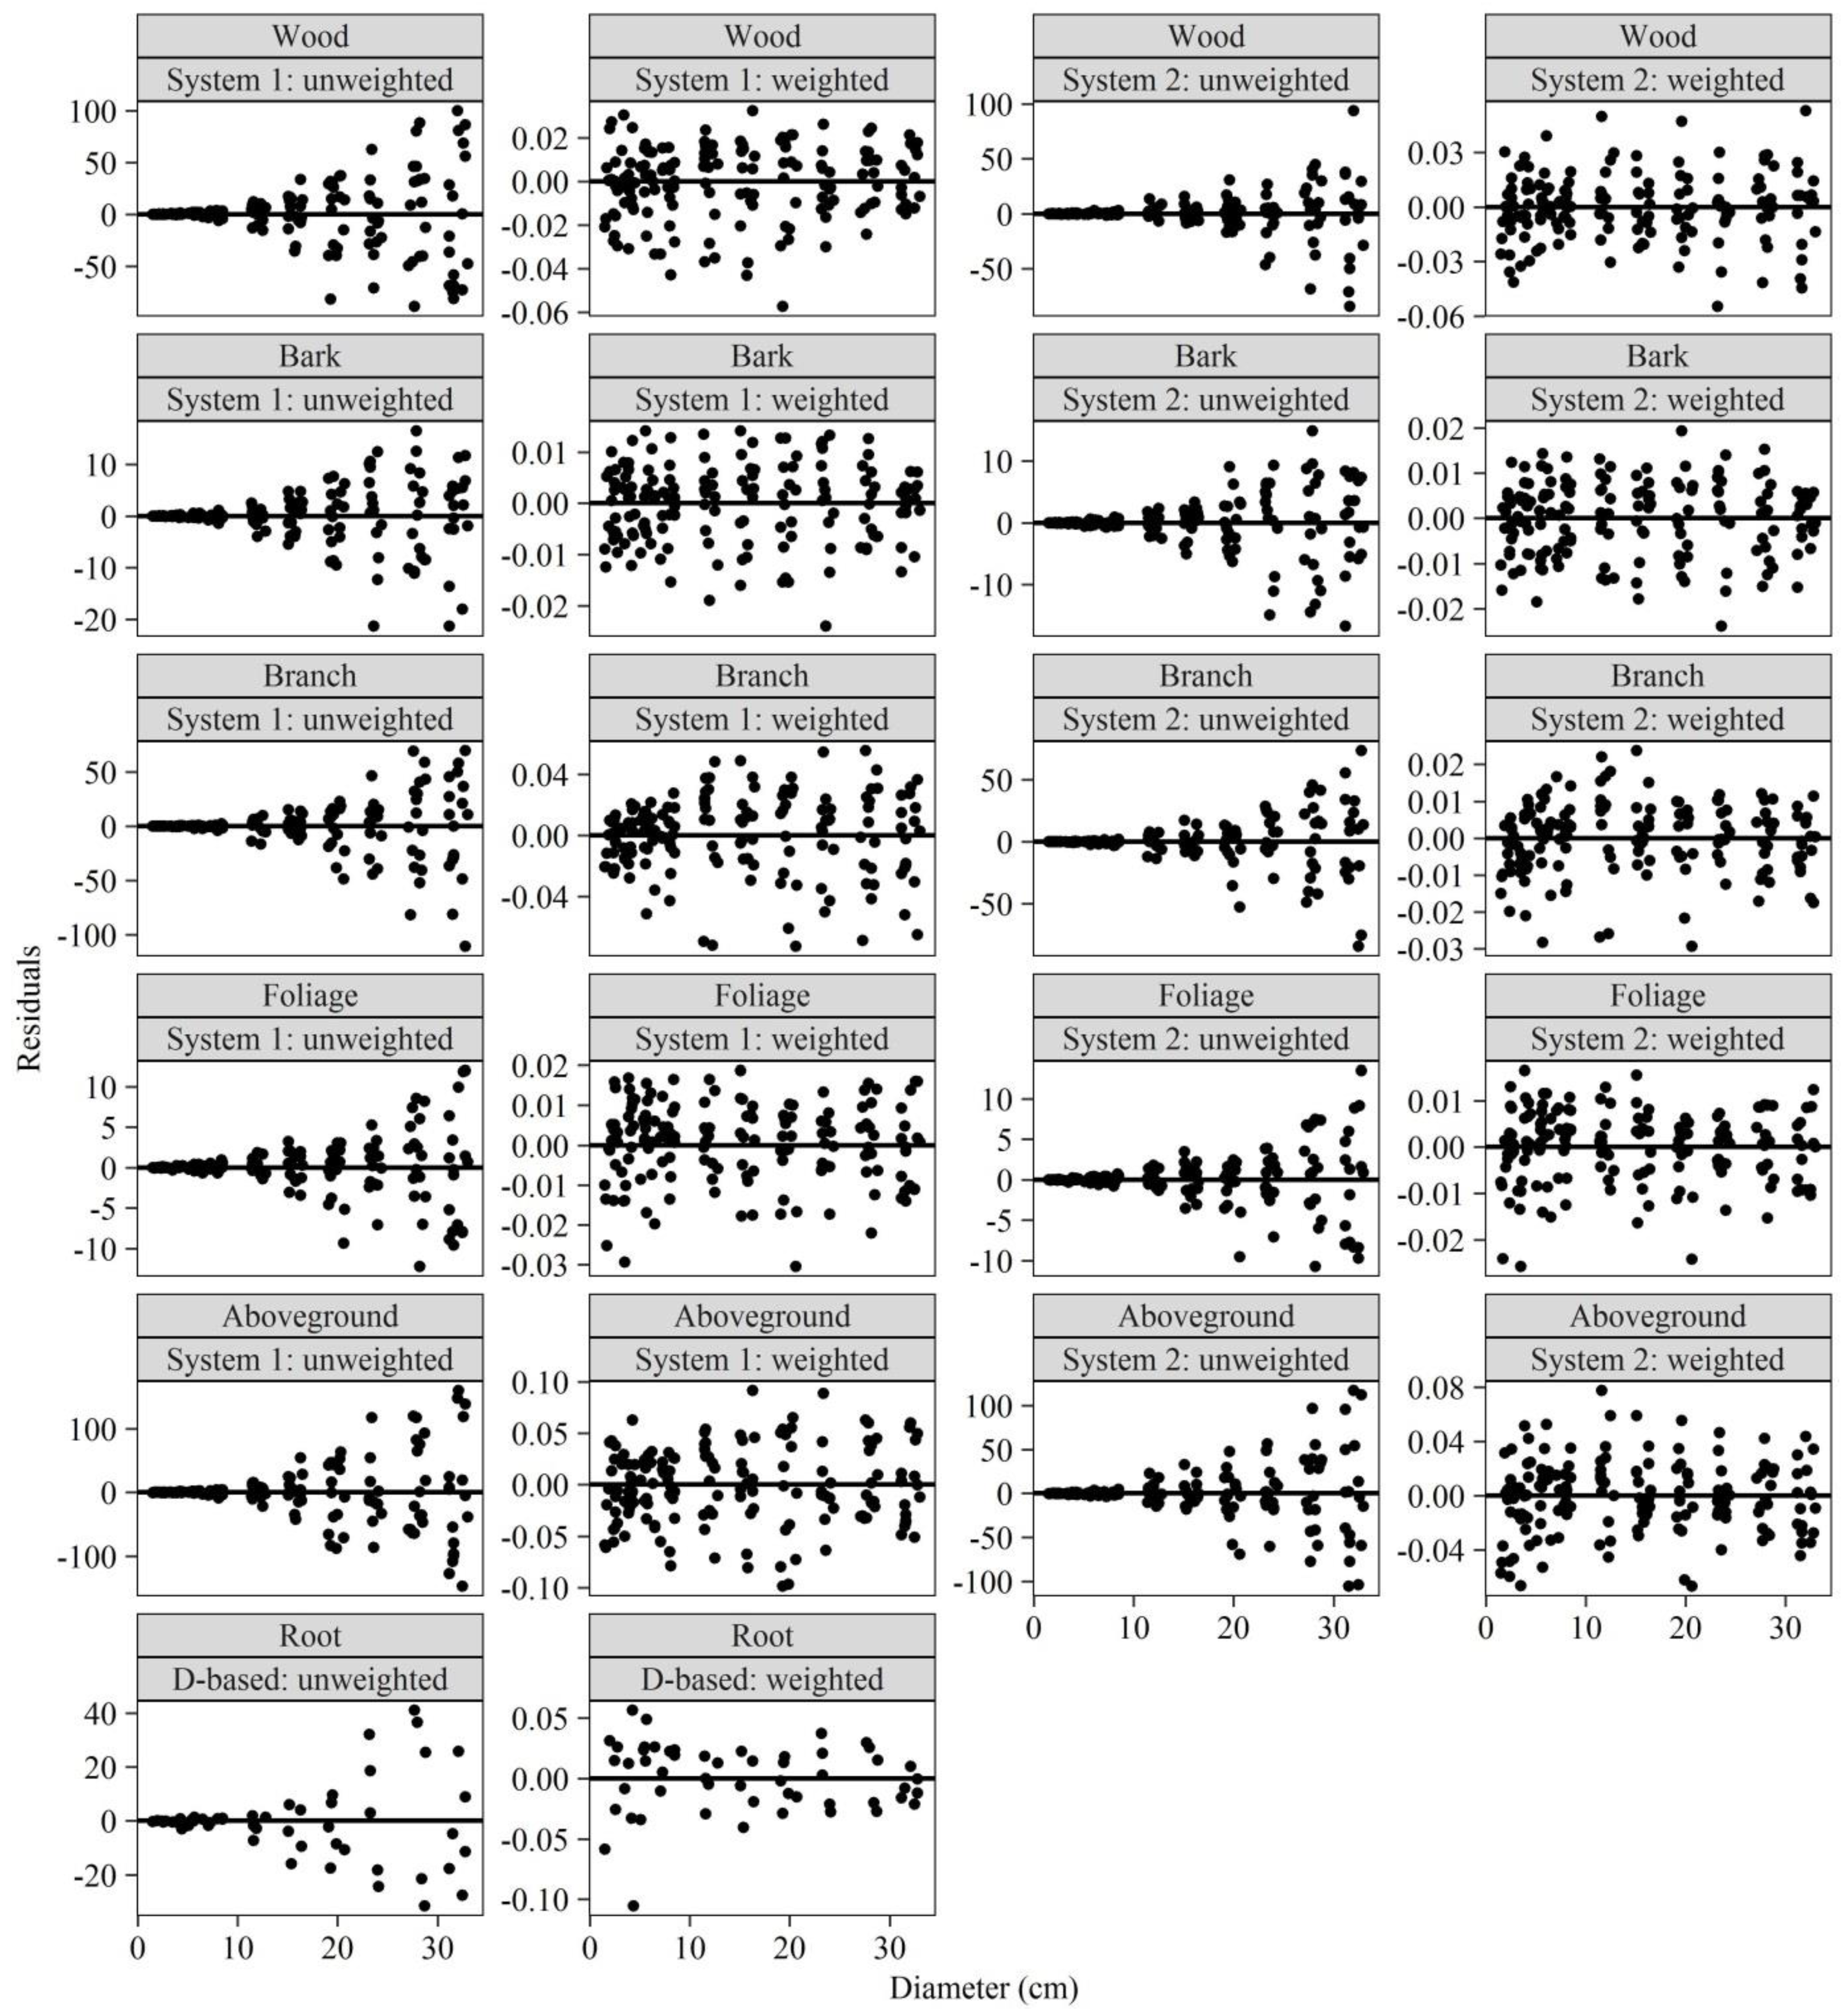
4.4. Heteroscedasticity Elimination

The heteroscedastic residual error is a common problem when developing nonlinear biomass equations with additive error terms [41]. Logarithmic transformation of both the response and explanatory variables is opted for in most cases to deal with the heteroscedasticity of the original arithmetic data, e.g., [13,22,51]. However, the nonlinear transformation of converting arithmetic units to logarithms alters the relationship between the response and explanatory variables and can lead to substantial bias when estimating the allometric model parameters on the original scale through logarithmic linear fitting [52,53]. A correction factor is usually selected to remove the systematic bias generated by converting the estimated logarithmic value to the original scale [54]. While correcting bias, the additive property of the biomass models is simultaneously tending to be destroyed. The weighted NSUR method with a unique weighting function for each equation is likely preferred to address heteroscedasticity during biomass model development, e.g., [30,41,55,56]. In line with previous studies, our study also showed good performance of the weighted NSUR for addressing the heteroscedasticity (Figure 8).

4.5. Performance of Existing Equations

Through the literature review, several equations have been established for estimating the components’ biomass applicable to this study area [8,9,10]. The biomass measured in this study was used to compute REs from these models and to test their reliability to the present study area (Figure 9). The four models all overestimated stem biomass (including both stem wood and bark), and only model type 2 could keep the mean relative error under 10%. While for branch biomass, all of these models gave underestimation, and the smallest mean RE was obtained by model type 1. Both model type 1 and 2 provided better estimations for foliage biomass, with a mean RE less than 5%, yet model type 3 and 4 yielded relatively large underestimations. Since stems account for a large portion of the aboveground biomass, the distribution of REs for aboveground biomass estimation is similar to the stem component, namely, model type 2 gave the smallest RE (slight underestimation). For belowground biomass, model type 1 provided overestimation while the other three models gained underestimation, and model type 4 provided the closest value to the measured biomass with a mean RE of −0.37%.
Although some equations performed well, most equations provided REs larger than 15%. The small sample sizes might affect the model’s predictive ability, especially for model type 3 and 4. Furthermore, biomass data for developing model type 3 were gathered in Heilongjiang province, and that for model type 4 was obtained in Jilin province, while model type 1 and 2 were based on data collected in the two provinces (Table 2). However, in the western Daxing’anling mountains located in Inner Mongolia, no trees were sampled. Since allometric biomass equations vary with forest type, size and stand condition, the application of biomass models not suitable to the specific environment may lead to making large systematic errors from the observed data [26,27,40].

5. Conclusions

Appropriate allometric biomass equations are critical in reducing the uncertainties for obtaining reliable forest biomass estimation, especially for carbon accounting. In the present study, we developed two systems of oak tree biomass equations: one based on tree D only, and another based on multiple variables, including D, H, CW and CL. Both systems guarantee the additive property between the tree components and aboveground biomass. The additive systems of equations were estimated using the NSUR method by considering the inherent errors among the equations and addressed the heteroscedasticity by making each equation have its own weighting function. Diameter alone proved to be a good predictor for all of the components’ biomass estimation, especially for root biomass. The system with additional crown dimensions slightly improved the prediction of the aboveground biomass components, but adding CW to the branch and foliage biomass models could yield more improvements than stem wood and bark. The additive system of biomass equations with D, H, CW and CL as predictors can be applied to natural oak species distributed in northeastern China for carbon accounting purposes, while the additive system of equations using D as a single predictor can be used when height and crown information are not available. Both systems of equations must be used with caution when predicting the biomass of trees outside the range of the data used for model development and outside the range of the site conditions.

Author Contributions

Conceptualization, S.M. and H.W. (Huimin Wang); methodology, S.M.; software, S.M. and F.Y.; validation, S.M., H.W. (Haibin Wang) and S.H.; formal analysis, S.M.; investigation, S.M., F.Y. and S.H.; data curation, S.M.; writing—original draft preparation, S.M.; writing—review and editing, H.W. (Huimin Wang); supervision, H.W. (Huimin Wang); project administration, S.M.; funding acquisition, S.M. All authors have read and agreed to the published version of the manuscript.

Funding

This research was funded by the Foundation of President of the Zhongke-Ji’an Institute for Eco-Environmental Sciences.

Institutional Review Board Statement

Not applicable.

Informed Consent Statement

Not applicable.

Acknowledgments

The authors would like to thank Chang Guangjun and those individuals involved in data collection for their kind technical support during tree sampling. We also would like to thank the second forestry monitoring and planning institute of the Inner Mongolia Autonomous region for their great help in material and logistics during fieldwork.

Conflicts of Interest

The authors declare no conflict of interest.

References

  1. Yin, X.; Zhou, G.; Sui, X.; He, Q.; Li, R. Dominant climatic factors of Quercus mongolica geographical distribution and their thresholds. Acta Ecol. Sin. 2013, 33, 103–109. (In Chinese) [Google Scholar]
  2. Mugasha, W.A.; Eid, T.; Bollandsas, O.M.; Malimbwi, R.E.; Chamshama, S.A.O.; Zahabu, E.; Katani, J.Z. Allometric models for prediction of above- and belowground biomass of trees in the miombo woodlands of Tanzania. For. Ecol. Manag. 2013, 310, 87–101. [Google Scholar] [CrossRef]
  3. He, J.S. Carbon cycling of Chinese forests: From carbon storage, dynamics to models. Sci. China Life Sci. 2012, 55, 188–190. [Google Scholar] [CrossRef] [Green Version]
  4. Alongi, D.M.; Clough, B.F.; Dixon, P.; Tirendi, F. Nutrient partitioning and storage in arid-zone forests of the mangroves Rhizophora stylosa and Avicennia marina. Trees 2003, 17, 51–60. [Google Scholar] [CrossRef]
  5. Dimobe, K.; Mensah, S.; Goetze, D.; Ouédraogo, A.; Kuyah, S.; Porembski, S.; Thiombiano, A. Aboveground biomass partitioning and additive models for Combretum glutinosum and Terminalia laxiflora in West Africa. Biomass Bioenergy 2018, 115, 151–159. [Google Scholar] [CrossRef]
  6. Sanaei, A.; Ali, A.; Ahmadaali, K.; Jahantab, E. Generalized and species-specific prediction models for aboveground biomass in semi-steppe rangelands. J. Plant Ecol. 2019, 12, 428–437. [Google Scholar] [CrossRef]
  7. Chave, J.; Rejou-Mechain, M.; Burquez, A.; Chidumayo, E.; Colgan, M.S.; Delitti, W.B.C.; Duque, A.; Eid, T.; Fearnside, P.M.; Goodman, R.C.; et al. Improved allometric models to estimate the aboveground biomass of tropical trees. Glob. Chang. Biol. 2014, 20, 3177–3190. [Google Scholar] [CrossRef]
  8. Dong, L.H.; Zhang, L.J.; Li, F.R. Developing additive systems of biomass equations for nine hardwood species in Northeast China. Trees 2015, 29, 1149–1163. [Google Scholar] [CrossRef]
  9. He, H.J.; Zhang, C.Y.; Zhao, X.H.; Fousseni, F.; Wang, J.S.; Dai, H.J.; Yang, S.; Zuo, Q. Allometric biomass equations for 12 tree species in coniferous and broadleaved mixed forests, Northeastern China. PLoS ONE 2018, 13, e0186226. [Google Scholar] [CrossRef] [PubMed] [Green Version]
  10. Wang, C.K. Biomass allometric equations for 10 co-occurring tree species in Chinese temperate forests. For. Ecol. Manag. 2006, 222, 9–16. [Google Scholar] [CrossRef]
  11. Eker, M.; Poudel, K.P.; Ozcelik, R. Aboveground biomass equations for small trees of brutian pine in turkey to facilitate harvesting and management. Forests 2017, 8, 477. [Google Scholar] [CrossRef] [Green Version]
  12. Parresol, B.R. Assessing tree and stand biomass: A review with examples and critical comparisons. For. Sci. 1999, 45, 573–593. [Google Scholar]
  13. Blujdea, V.N.B.; Pilli, R.; Dutca, I.; Ciuvat, L.; Abrudan, I.V. Allometric biomass equations for young broadleaved trees in plantations in Romania. For. Ecol. Manag. 2012, 264, 172–184. [Google Scholar] [CrossRef]
  14. Kozak, A. Methods for ensuring additivity of biomass components by regression analysis. For. Chron. 1970, 46, 402–405. [Google Scholar] [CrossRef]
  15. Parresol, B.R. Additivity of nonlinear biomass equations. Can. J. For. Res. 2001, 31, 865–878. [Google Scholar] [CrossRef]
  16. Tang, S.Z.; Zhang, H.R.; Xu, H. Study on establish and estimate method of compatible biomass model. Sci. Silvae Sin. 1999, 36, 19–27. (In Chinese) [Google Scholar]
  17. Chiyenda, S.S.; Kozak, A. Additivity of component biomass regression equations when the underlying model is linear. Can. J. For. Res. 1984, 14, 441–446. [Google Scholar] [CrossRef]
  18. Cao, L.; Li, H.K. Analysis of error structure for additive biomass equations on the use of multivariate likelihood function. Forests 2019, 10, 298. [Google Scholar] [CrossRef] [Green Version]
  19. Canga, E.; Dieguez-Aranda, I.; Afif-Khouri, E.; Camara-Obregon, A. Above-ground biomass equations for Pinus radiata D. Don in Asturias. For. Syst. 2013, 22, 408–415. [Google Scholar] [CrossRef] [Green Version]
  20. Zhao, D.H.; Westfall, J.; Coulston, J.W.; Lynch, T.B.; Bullock, B.P.; Montes, C.R. Additive biomass equations for slash pine trees: Comparing three modeling approaches. Can. J. For. Res. 2019, 49, 27–40. [Google Scholar] [CrossRef]
  21. Helmisaari, H.-S.; Derome, J.; Nöjd, P.; Kukkola, M. Fine root biomass in relation to site and stand characteristics in Norway spruce and Scots pine stands. Tree Physiol. 2007, 27, 1493–1504. [Google Scholar] [CrossRef] [PubMed] [Green Version]
  22. Djomo, A.N.; Chimi, C.D. Tree allometric equations for estimation of above, below and total biomass in a tropical moist forest: Case study with application to remote sensing. For. Ecol. Manag. 2017, 391, 184–193. [Google Scholar] [CrossRef]
  23. Xing, D.L.; Bergeron, J.A.C.; Solarik, K.A.; Tomm, B.; Macdonald, S.E.; Spence, J.R.; He, F.L. Challenges in estimating forest biomass: Use of allometric equations for three boreal tree species. Can. J. For. Res. 2019, 49, 1613–1622. [Google Scholar] [CrossRef]
  24. Kachamba, D.J.; Eid, T.; Gobakken, T. Above- and belowground biomass models for trees in the miombo woodlands of Malawi. Forests 2016, 7, 38. [Google Scholar] [CrossRef] [Green Version]
  25. Mokany, K.; Raison, R.J.; Prokushkin, A.S. Critical analysis of root:shoot ratios in terrestrial biomes. Glob. Chang. Biol. 2006, 12, 84–96. [Google Scholar] [CrossRef]
  26. Mensah, S.; Veldtman, R.; Du Toit, B.; Glèlè Kakaï, R.; Seifert, T. Aboveground biomass and carbon in a south African mistbelt forest and the relationships with tree species diversity and forest structures. Forests 2016, 7, 79. [Google Scholar] [CrossRef] [Green Version]
  27. Chave, J.; Andalo, C.; Brown, S.; Cairns, M.A.; Chambers, J.Q.; Eamus, D.; Folster, H.; Fromard, F.; Higuchi, N.; Kira, T.; et al. Tree allometry and improved estimation of carbon stocks and balance in tropical forests. Oecologia 2005, 145, 87–99. [Google Scholar] [CrossRef]
  28. Xu, Y.Z.; Zhang, J.X.; Franklin, S.B.; Liang, J.Y.; Ding, P.; Luo, Y.Q.; Lu, Z.J.; Bao, D.C.; Jiang, M.X. Improving allometry models to estimate the above- and belowground biomass of subtropical forest, China. Ecosphere 2015, 6, 289. [Google Scholar] [CrossRef]
  29. Alvarez, E.; Duque, A.; Saldarriaga, J.; Cabrera, K.; de Las Salas, G.; del Valle, I.; Lema, A.; Moreno, F.; Orrego, S.; Rodriguez, L. Tree above-ground biomass allometries for carbon stocks estimation in the natural forests of Colombia. For. Ecol. Manag. 2012, 267, 297–308. [Google Scholar] [CrossRef]
  30. Zeng, W.S.; Zhang, L.J.; Chen, X.Y.; Cheng, Z.C.; Ma, K.X.; Li, Z.H. Construction of compatible and additive individual-tree biomass models for Pinus tabulaeformis in China. Can. J. For. Res. 2017, 47, 467–475. [Google Scholar] [CrossRef]
  31. Zeng, W.S.; Duo, H.R.; Lei, X.D.; Chen, X.Y.; Wang, X.J.; Pu, Y.; Zou, W.T. Individual tree biomass equations and growth models sensitive to climate variables for Larix spp. in China. Eur. J. For. Res. 2017, 136, 233–249. [Google Scholar] [CrossRef]
  32. De-Miguel, S.; Pukkala, T.; Assaf, N.; Shater, Z. Intra-specific differences in allometric equations for aboveground biomass of eastern Mediterranean Pinus brutia. Ann. For. Sci. 2014, 71, 101–112. [Google Scholar] [CrossRef] [Green Version]
  33. Mensah, S.; Veldtman, R.; Seifert, T. Allometric models for height and aboveground biomass of dominant tree species in South African Mistbelt forests. South. Forests 2016, 79, 19–30. [Google Scholar] [CrossRef]
  34. Bi, H.Q.; Murphy, S.; Volkova, L.; Weston, C.; Fairman, T.; Li, Y.; Law, R.; Norris, J.; Lei, X.D.; Caccamo, G. Additive biomass equations based on complete weighing of sample trees for open eucalypt forest species in south-eastern Australia. For. Ecol. Manag. 2015, 349, 106–121. [Google Scholar] [CrossRef]
  35. Mensah, S.; Kakaï, R.G.; Seifert, T. Patterns of biomass allocation between foliage and woody structure: The effects of tree size and specific functional traits. Ann. For. Res. 2016, 59, 49–60. [Google Scholar] [CrossRef] [Green Version]
  36. Pajtik, J.; Konopka, B.; Lukac, M. Individual biomass factors for beech, oak and pine in Slovakia: A comparative study in young naturally regenerated stands. Trees 2011, 25, 277–288. [Google Scholar] [CrossRef]
  37. Cairns, M.A.; Brown, S.; Baumgardner, H.G.A. Root biomass allocation in the world’s upland forests. Oecologia 1997, 111, 1–11. [Google Scholar] [CrossRef]
  38. Zeng, W.S. Developing one-variable individual tree biomass models based on wood density for 34 tree species in China. For. Resour. Manag. 2017, 41–46. (In Chinese) [Google Scholar]
  39. George, G. Prediction bias and response surface curvature. For. Sci. 1991, 37, 755–765. [Google Scholar]
  40. Riofrio, J.; Herrero, C.; Grijalva, J.; Bravo, F. Aboveground tree additive biomass models in Ecuadorian highland agroforestry systems. Biomass Bioenergy 2015, 80, 252–259. [Google Scholar] [CrossRef]
  41. Bi, H.Q.; Turner, J.; Lambert, M.J. Additive biomass equations for native eucalypt forest trees of temperate Australia. Trees 2004, 18, 467–479. [Google Scholar] [CrossRef]
  42. Meng, S.W.; Jia, Q.Q.; Liu, Q.J.; Zhou, G.; Wang, H.M.; Yu, J. Aboveground biomass allocation and additive allometric models for natural larix gmelinii in the western Daxing’anling mountains, northeastern China. Forests 2019, 10, 150. [Google Scholar] [CrossRef] [Green Version]
  43. Kuyah, S.; Sileshi, G.W.; Rosenstock, T.S. Allometric models based on bayesian frameworks give better estimates of aboveground biomass in the miombo woodlands. Forests 2016, 7, 13. [Google Scholar] [CrossRef]
  44. Abich, A.; Mucheye, T.; Tebikew, M.; Gebremariam, Y.; Alemu, A. Species-specific allometric equations for improving aboveground biomass estimates of dry deciduous woodland ecosystems. J. For. Res. 2019, 30, 1619–1632. [Google Scholar] [CrossRef]
  45. Tetemke, B.A.; Birhane, E.; Rannestad, M.M.; Eid, T. Allometric models for predicting aboveground biomass of trees in the dry afromontane forests of northern Ethiopia. Forests 2019, 10, 1114. [Google Scholar] [CrossRef] [Green Version]
  46. Rutishauser, E.; Noor’An, F.; Laumonier, Y.; Halperin, J.; Rufi’ie; Hergoualc’H, K.; Verchot, L. Generic allometric models including height best estimate forest biomass and carbon stocks in Indonesia. For. Ecol. Manag. 2013, 307, 219–225. [Google Scholar] [CrossRef]
  47. Lambert, M.C.; Ung, C.H.; Raulier, F. Canadian national tree aboveground biomass equations. Can. J. For. Res. 2005, 35, 1996–2018. [Google Scholar] [CrossRef]
  48. Meng, S.W.; Liu, Q.J.; Zhou, G.; Jia, Q.Q.; Zhuang, H.X.; Zhou, H. Aboveground tree additive biomass equations for two dominant deciduous tree species in Daxing’anling, northernmost China. J. For. Res. 2017, 22, 233–240. [Google Scholar] [CrossRef]
  49. Wagner, R.G.; Ter-Mikaelian, M.T. Comparison of biomass component equations for four species of northern coniferous tree seedlings. Ann. For. Sci. 1999, 56, 193–199. [Google Scholar] [CrossRef] [Green Version]
  50. Goodman, R.C.; Phillips, O.L.; Baker, T.R. The importance of crown dimensions to improve tropical tree biomass estimates. Ecol. Appl. 2016, 24, 680–698. [Google Scholar] [CrossRef] [Green Version]
  51. Xiao, X.; White, E.P.; Hooten, M.B.; Durham, S.L. On the use of log-transformation vs. nonlinear regression for analyzing biological power laws. Ecology 2011, 92, 1887–1894. [Google Scholar] [CrossRef] [PubMed] [Green Version]
  52. Packard, G.C. On the use of logarithmic transformations in allometric analyses. J. Theor. Biol. 2009, 257, 515–518. [Google Scholar] [CrossRef] [PubMed]
  53. Packard, G.C. On the use of log-transformation versus nonlinear regression for analyzing biological power laws. Biol. J. Linn. Soc. 2014, 113, 1167–1178. [Google Scholar] [CrossRef] [Green Version]
  54. Sprugel, D.G. Correcting for bias in log-transformed allometric equations. Ecology 1983, 64, 209–210. [Google Scholar] [CrossRef]
  55. Zhao, D.H.; Kane, M.; Markewitz, D.; Teskey, R.; Clutter, M. Additive tree biomass equations for Midrotation loblolly pine plantations. For. Sci. 2015, 61, 613–623. [Google Scholar] [CrossRef] [Green Version]
  56. Wang, X.W.; Zhao, D.H.; Liu, G.F.; Yang, C.J.; Teskey, R.O. Additive tree biomass equations for Betula platyphylla Suk. plantations in Northeast China. Ann. For. Sci. 2018, 75, 60. [Google Scholar] [CrossRef] [Green Version]
Figure 1. The location of the study area and sampling sites in northeastern China.
Forests 12 00715 g001
Figure 2. The scatter points depict height against diameter and the vertical bars represent the sample distribution across the 4-cm diameter class.
Forests 12 00715 g002
Figure 3. The fraction of aboveground biomass allocated to the wood, bark, branches and foliage varied with diameter, height, crown length and crown width. Red solid lines and grey areas are loess smoothing with 95% confidence intervals.
Forests 12 00715 g003
Figure 4. Root-to-shoot ratio against diameter (n = 53). The red line represents the fitted power function, and the blue short dashed line represents the mean value of the root-to-shoot ratio.
Forests 12 00715 g004
Figure 5. Relationships between the stem wood, bark, branch, foliage, aboveground and root biomass of the sampled trees and diameter, height, crown length and crown width.
Forests 12 00715 g005
Figure 6. Scatterplots of the predicted (y-axis) and the observed (x-axis) values for the wood, bark, branch, leaf, aboveground and root biomass using the leave-one-out cross-validation method.
Forests 12 00715 g006
Figure 7. Model predictive ability tested by the leave-one-out cross-validation method.
Forests 12 00715 g007
Figure 8. The heteroscedastic and homoscedastic residual errors of the original biomass models (unweighted) and the biomass models with weighting functions (weighted).
Forests 12 00715 g008
Figure 9. Distributions of the relative error of published Mongolian oak biomass models. The length of the box indicates the 25th–75th percentile, the horizontal lines attached to the box represent the smallest and maximum values, the dot inside the box represents the mean value, the horizontal line inside the box represents the median and outliers are marked as asterisks. The violin represents a probability density.
Forests 12 00715 g009
Table 1. Summary statistics of D (cm), H (m), CW (m), CL (m), stem wood, bark, branch, foliage, aboveground and root biomass (kg) for the sampled oak trees.
StatisticsnMeanMinMaxSD
D15915.11.53310.0
H1599.111.420.54.94
CW1594.220.459.703.51
CL1596.130.6013.613.51
Wood15973.550.14336.2790.67
Bark15916.260.0674.6619.13
Branch15945.190.03298.3262.55
Foliage1595.590.0326.576.75
Aboveground159140.590.33668.12173.45
Root5337.660.23153.714.08
n, sample size; Min, minimum; Max: maximum; SD, standard deviation.
Table 2. Comparison of existing models using the measured biomass data in this study.
StudyModel TypePredictorD Range (cm)Sample SizeSiten
Dong et al. [8]Type 1D4.2–37.164HLJ, JL100
Type 2D, H
Wang [10]Type 3D4.3–57.110HLJ99
He et al. [9]Type 4D4.2–41.210JL100
n is the number of measured trees used for testing the existing equations. HLJ: Heilongjiang province; JL: Jilin province.
Table 3. Regression coefficients and statistics of the aboveground additive systems and root biomass equations with a specific weighting function.
ComponentModel PredictorRegression CoefficientsFitting StatisticsWeight Function
β0β1β2β3β4RMSE (kg) R a d j 2
WoodD0.050 ***2.473 *** 30.6020.886D4.9241
D, H0.033 ***1.761 ***1.043 *** 19.1380.955D4.2932
D, CW0.061 ***2.252 *** 0.271 *** 30.6050.886D3.3857
D, CL0.059 ***1.845 *** 0.826 ***25.1210.923D3.6802
D, H, CW0.034 ***1.689 ***1.031 ***0.121 * 18.8330.957D4.3493
D, H, CL0.030 ***1.834 ***1.191 *** −0.235 ***18.9680.956D5.1990
D, H, CW, CL0.034 ***1.723 ***1.173 ***0.174 ***−0.252 ***18.5480.958D4.3589
BarkD0.022 ***2.249 *** 5.3970.920D4.2996
D, H0.018 ***1.916 ***0.491 *** 4.5710.943D4.1216
D, CW0.022 ***2.291 *** −0.076 ns 5.3540.922D4.2709
D, CL0.024 ***1.975 *** 0.367 ***4.8350.936D4.0130
D, H, CW0.017 ***2.022 ***0.467 ***−0.146 * 4.4660.946D4.1201
D, H, CL0.018 ***1.939 ***0.565 *** −0.107 ns4.6230.942D4.1430
D, H, CW, CL0.017 ***2.003 ***0.560 ***−0.090 ns−0.109 ns4.5610.943D4.1967
BranchD0.011 ***2.772 *** 23.3200.861D4.2891
D, H0.012 ***2.716 ***0.035 ns 23.4400.860D4.3426
D, CW0.018 ***2.090 *** 0.939 *** 19.0810.907D4.9263
D, CL0.014 ***2.504 *** 0.290 **23.0520.864D5.0652
D, H, CW0.020 ***2.128 ***−0.110 ns0.964 *** 19.0600.907D4.8475
D, H, CL0.019 ***2.572 ***−0.538 ** 0.692 ***22.6060.869D3.4718
D, H, CW, CL0.033 ***1.976 ***−0.655 ***0.985 ***0.607 ***19.4260.904D4.6120
FoliageD0.019 ***1.964 *** 3.3500.754D3.7889
D, H0.025 ***1.981 ***−0.126 ns 3.4290.742D2.9305
D, CW0.023 ***1.626 *** 0.473 *** 3.2750.765D3.9640
D, CL0.017 ***2.029 *** −0.050 ns3.3700.751D3.4793
D, H, CW0.020 ***1.747 ***−0.052 ns0.441 ** 3.2960.762D3.0790
D, H, CL0.025 ***1.930 ***−0.053 ns −0.018 ns3.4010.746D2.9473
D, H, CW, CL0.043 ***1.692 ***−0.704 ***0.590 ***0.323 *3.6640.706D3.9980
RootD0.086 ***2.072 *** 14.8430.887D4.2914
D, H0.077 ***2.118 ***−0.008 ns 14.7250.888D3.6076
D, CW0.087 ***2.033 *** 0.058 ns 14.9910.884D4.2293
D, CL0.076 ***2.091 *** 0.044 ns14.5180.892D3.3309
D, H, CW0.075 **2.112 ***0.012 ns−0.002 ns 14.7690.888D3.4907
D, H, CL0.081 **2.099 ***−0.076 ns 0.083 ns14.8810.886D3.5074
D, H, CW, CL0.081 **2.104 ***−0.069 ns−0.008 ns0.081 ns15.0080.884D3.4890
β1 for D, β2 for H, β3 for CW, β4 for CL, respectively. * p < 0.05, ** p < 0.01, *** p < 0.001, ns non-significant; aboveground weight function: D4.5621, D4.6374, D4.5688, D4.0230, D4.0223, D5.2550, D5.4720 for Equations (2)–(8), respectively. The selected models, according to both parameter significance and performance criteria, are given in bold.
Table 4. Aboveground additive systems of the biomass models based on D and the selected predictors.
Model SystemComponentModel ExpressionsRMSE (kg) R a d j 2
System 1WoodWwd = 0.050D2.47330.6020.886
BarkWbk = 0.022D2.2495.3970.920
BranchWbr = 0.011D2.77223.3200.861
FoliageWfo = 0.019D1.9643.3500.754
AbovegroundWag = 0.050D2.473 + 0.022D2.249 + 0.011D2.772 + 0.019D1.96445.4780.931
System 2WoodWwd = 0.028D1.740H1.299CW0.140CL−0.31218.4110.959
BarkWbk = 0.017D2.010H0.502CW−0.1324.4730.945
BranchWbr = 0.017D2.156CW0.87019.0050.908
FoliageWfo = 0.023D1.645CW0.4383.2800.764
AbovegroundWag = 0.028D1.740H1.299CW0.140CL−0.312 + 0.017D2.010H0.502CW−0.132 + 0.017D2.156CW0.870 + 0.023D1.645CW0.43831.0210.968
All coefficients are significant.
Publisher’s Note: MDPI stays neutral with regard to jurisdictional claims in published maps and institutional affiliations.

