Article

Growth and Photosynthetic Responses of Seedlings of Japanese White Birch, a Fast-Growing Pioneer Species, to Free-Air Elevated O3 and CO2

1
Hokkaido Research Center, Forestry and Forest Products Research Institute, Sapporo 062-8516, Japan
2
Key Laboratory of Agrometeorology of Jiangsu Province, School of Applied Meteorology, Nanjing University of Information Science & Technology (NUIST), Nanjing 210044, China
3
Department of Mushroom Science and Forest Microbiology, Forestry and Forest Products Research Institute, Tsukuba 305-8687, Japan
4
Research Faculty of Agriculture, Hokkaido University, Sapporo 062-0809, Japan
5
Department of Plant Ecology, Forestry and Forest Products Research Institute, Tsukuba 305-8687, Japan
*
Author to whom correspondence should be addressed.
Forests 2021, 12(6), 675; https://doi.org/10.3390/f12060675
Submission received: 15 March 2021 / Revised: 20 May 2021 / Accepted: 21 May 2021 / Published: 25 May 2021
(This article belongs to the Special Issue Ecophysiology of Forest Succession under Changing Environment)

Abstract

:
Plant growth is not solely determined by the net photosynthetic rate (A), but also influenced by the amount of leaves as a photosynthetic apparatus. To evaluate growth responses to CO2 and O3, we investigated the effects of elevated CO2 (550–560 µmol mol−1) and O3 (52 nmol mol−1; 1.7 × ambient O3) on photosynthesis and biomass allocation in seedlings of Japanese white birch (Betula platyphylla var. japonica) grown in a free-air CO2 and O3 exposure system without any limitation of root growth. Total biomass was enhanced by elevated CO2 but decreased by elevated O3. The ratio of root to shoot (R:S ratio) showed no difference among the treatment combinations, suggesting that neither elevated CO2 nor elevated O3 affected biomass allocation in the leaf. Accordingly, photosynthetic responses to CO2 and O3 might be more important for the growth response of Japanese white birch. Based on A measured under respective growth CO2 conditions, light-saturated A at a light intensity of 1500 µmol m−2 s−1 (A1500) in young leaves (ca. 30 days old) exhibited no enhancement by elevated CO2 in August, suggesting photosynthetic acclimation to elevated CO2. However, lower A1500 was observed in old leaves (ca. 60 days old) of plants grown under elevated O3 (regulated to be twice ambient O3). Conversely, light-limited A measured under a light intensity of 200 µmol m−2 s−1 (A200) was significantly enhanced by elevated CO2 in young leaves, but suppressed by elevated O3 in old leaves. Decreases in total biomass under elevated O3 might be attributed to accelerated leaf senescence by O3, indicated by the reduced A1500 and A200 in old leaves. Increases in total biomass under elevated CO2 might be attributed to enhanced A under high light intensities, which possibly occurred before the photosynthetic acclimation observed in August, and/or enhanced A under limiting light intensities.

1. Introduction

Atmospheric CO2 concentration is increasing globally [1,2], accompanied by an increase in tropospheric ozone (O3) concentration, particularly in East Asia [3,4,5,6]. O3 pollution reduces plant growth and productivity through a reduction in photosynthesis, an increase in leaf respiration and acceleration of leaf senescence [7,8,9,10,11]. O3 exposure reduces photosynthetic rate by a reduction in the maximum rate of Rubisco carboxylation (Vc,max) [12,13,14,15] as well as a decrease in stomatal conductance [14,16,17]. Conversely, elevated CO2 generally increases plant growth with an enhancement of photosynthesis [18,19,20]. However, long-term elevated CO2 leads to photosynthetic acclimation accompanied by a decrease in the Rubisco carboxylation capacity, indicated by a decrease in Vc,max (so-called “photosynthetic downregulation”) frequently accompanied by leaf starch accumulation and leaf nitrogen reduction [19,21].
Plant growth is not solely determined by photosynthetic rate, usually expressed as the rate of leaf-area-based CO2 assimilation, but is also influenced by the amount of leaf area as a photosynthetic apparatus [22]. An increase in the shoot to root ratio (S:R ratio) was observed in some plants grown under elevated O3 [23,24,25], which is considered a compensatory response against O3-induced photosynthesis reduction by investing biomass into the photosynthetic apparatus [26].
Deciduous broadleaf forests are broadly distributed in Japan, including various tree species with different morphological and physiological traits along with forest succession [27,28]. Early successional species, such as birch species, have a succeeding-type shoot development, whereas mid- and late-successional species, such as Japanese oak (Quercus mongolica var. crispula) and Siebold’s beech (Fagus crenata), have a flush-type shoot development, generally flushing once a year in spring. Consequently, early successional pioneer species have a relatively higher S:R ratio than mid- and late-successional species (Shukla and Ramakrishnan, 1984; Kitao et al., 2005, 2015). Such species-specific differences in the shoot development pattern might influence the growth responses to elevated O3 and CO2.
A significant growth enhancement was previously observed in seedlings of two mid-successional species (Q. mongolica var. crispula and Q. serrata) and late successional species (F. crenata) grown under the combination of elevated O3 and CO2 [29,30]. These tree species exhibited an increased S:R ratio under O3 exposure, with stimulation of new shoot development and enhanced photosynthetic rate under elevated CO2.
As an early successional species, Japanese white birch has a preferable biomass allocation into shoots with successional leaf development [27,31]. We hypothesized that the intrinsically higher S:R ratio in Japanese white birch would restrict the compensatory response against O3 exposure via a shift of biomass allocation into shoot. In this context, photosynthetic responses to O3 and CO2 exposure might directly affect the growth response of the pioneer Japanese white birch. To test this hypothesis, we investigated photosynthetic properties, growth, and biomass allocation in seedlings of Japanese white birch grown in a free-air, CO2 and O3 exposure system.

2. Materials and Methods

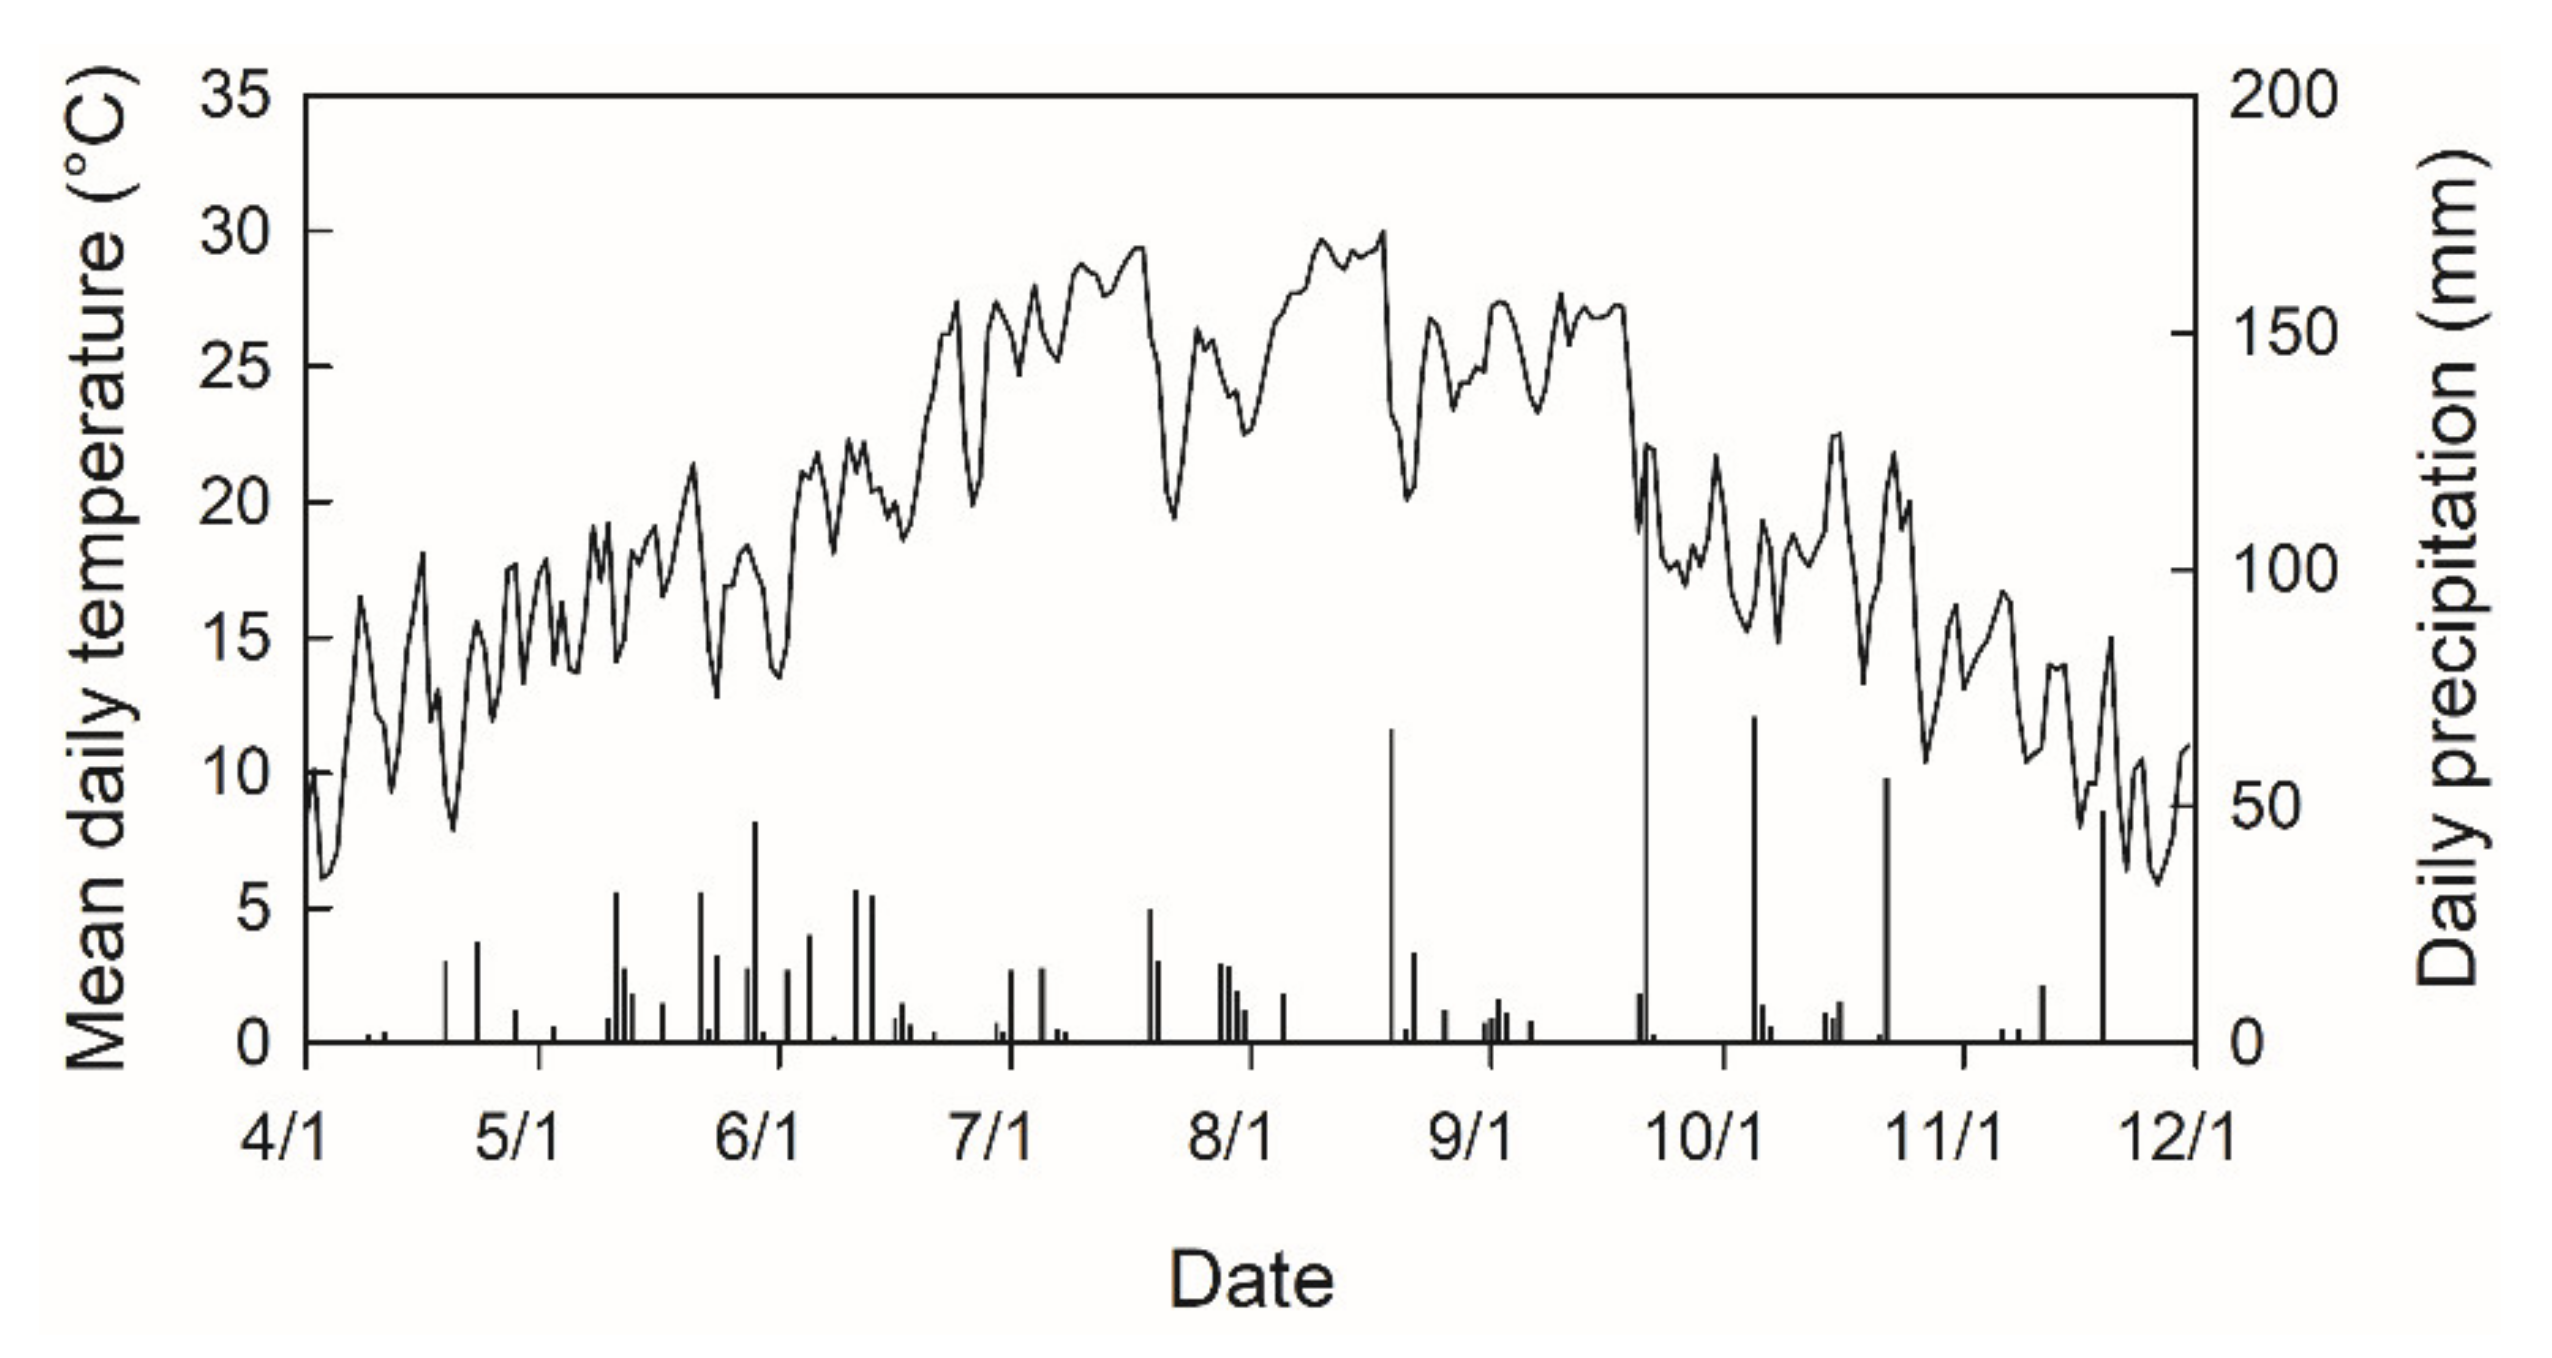
2.1. Plant Materials

Bare-rooted, 1 year old seedlings of Japanese birch (Betula platyphylla var. japonica) obtained from a commercial nursery (Hokkaido Engei-Ryokka Center, Kitahiroshima, Hokkaido) were planted directly in soil inside the frames of a free-air CO2 and O3 exposure system that was established in the nursery of Forestry and Forest Products Research Institute in Tsukuba, Japan (36°00′ N, 140°08′ E, 20 m a.s.l.) in March 2011. Twelve frames (2 × 2 × 2 m), partly surrounded by transparent windscreens (15 to 65 cm, and 75 to 125 cm in height above the soil) to reduce wind while not interfering with air exchange inside–outside, were installed for free-air CO2 and O3 enrichment. The free-air, CO2 and O3 exposure system is described in detail in [29]. The height of the seedlings was ca. 15 cm. Six seedlings were planted within each frame (totally 72 plants in the 12 frames). The CO2 and O3 treatments were as follows: control (unchanged ambient air), elevated CO2 (eCO2, target: 550 µmol mol−1), elevated O3 (eO3, target: 2.0 × ambient O3), and elevated CO2 + O3 (eCO2 + eO3, 550 µmol mol−1 CO2 and 2.0 × ambient O3). The twelve frames were divided into three replicates per gas treatment. The treatments lasted from the beginning of May to the middle of November 2011 (Table 1). During the experimental period, we had periodic precipitation (Figure 1), thus we only irrigated in the case of prolonged sunny days with no precipitation.

2.2. Measurements of Gas Exchange

Gas exchange measurements were conducted in the beginning of August 2011, for randomly selected young (≈30 day old) and old (≈60 day old) leaves of a representative seedling per frame, i.e., three replications for each treatment combination (CO2 × O3), using a portable photosynthesis system (Model LI-6400; LI-COR, Lincoln, NV, USA). A total of 12 seedlings were selected, and one young leaf (≈13th leaf position) and one old leaf (≈7th leaf position from the bottom leaf of main shoot) in the same seedling were used (a total of 24 leaves). Japanese birch has heterophyllous leaves (i.e., early leaves flushed in spring and late leaves succeedingly developed during summer) [15,31]. We used late leaves of different ages (young and old), where young leaves were flushed in July and old leaves flushed in June. Because of the succeeding-type leaf development, both young and old leaves were developed under a sunlit condition—considered sun leaves.
Measurements were conducted between 8:00 and 16:00. As the sunrise was around 4:30, and the sunset was around 19:00 in the beginning of August, we considered that the leaves had been photosynthetically activated under sunlight at the onset of the gas exchange measurements. The CO2 response evaluation was conducted as follows: at a saturating photon flux density (PFD) of 1500 µmol m−2 s−1, we first measured the net photosynthetic rate (A) at a CO2 concentration of 100 µmol mol−1 after 15 min acclimation, then measured A at CO2 concentrations of 200, 380, 550, and 1000 µmol mol−1 in sequence after ≈5 min acclimation for each CO2 concentration. Measurements were conducted under a block temperature of 27 °C (leaf temperature, 31.5 ± 0.3 °C, mean ± SE, n = 24) and a relative humidity of ≈80%. We monitored A, stomatal conductance (gs), and intercellular CO2 concentration (Ci) throughout the measurements and recorded their values after they reached the steady state. We then investigated light-acclimated photosynthesis as follows: after the measurement of A at a CO2 concentration of 1000 µmol mol−1, CO2 concentration was set to the respective growth CO2 concentration. At the respective growth CO2 concentration, A was measured at a PFD of 2000 µmol m−2 s−1 after a 10 min acclimation. Then, A was measured at the PFDs of 1500, 1000, 600, 300, 200, and 100 µmol m−2 s−1 in sequence after a 4 min acclimation for each PFD. We considered A measured at a PFD of 1500 under the respective growth CO2 concentrations (i.e., CO2 concentration of 380 µmol mol−1 for control and eO3 treatments, and 550 µmol mol−1 for eCO2 and eCO2 + eO3 treatments) as a measure of the light-saturated, net photosynthetic rate (A1500). As the quadratic equation for the light-response curve [32] failed to fit in some cases, especially for old leaves, we used A measured at a PFD of 200 µmol m−2 s−1 under the respective growth CO2 concentration as a direct measure of the light-limited photosynthetic rate (A200).
We used a traditional, steady-state A/Ci response technique [33] but with fewer CO2 points. The maximum rates of Rubisco carboxylase (Vc,max) and RuBP regeneration (Jmax) were estimated based on the protocol using linear regression in [33]. In the case that A is limited by Rubisco carboxylation, A is expressed as A = Vc,max f’ − Rd, where f’ = C i Γ * C i + K c 1 + O K o , and Rd is mitochondrial respiration under light. Г* is the CO2 compensation point, Kc Rubisco Michaelis constant for CO2, Ko Rubisco Michaelis constant for O2, and O oxygen concentration in air. Г*, Kc, and Ko at the leaf temperature during gas exchange measurements were estimated based on the temperature responses of them [34]. Vc,max is estimated as the slope of the A and f’ relationship, and Rd is estimated as the y-intercept. We used A at the CO2 concentrations of 100, 200, and 380 µmol mol−1 for Vc,max and Rd estimation, as A is generally limited by Rubisco carboxylation under ambient CO2 and saturated light [35,36]. Furthermore, we confirmed the linearity of the three points of A as a function of f’ (Supplemental Figure S1), supporting that A at 380 µmol mol−1 CO2 was limited by Rubisco carboxylation.
Similarly, when A is limited by RuBP regeneration under saturating light, Jmax is determined as the slope of the following equation: A = Jmax g’ − Rd, where g’ = C i Γ * 4.5   C i + 10.5   Γ * . In this case, Rd was determined as explained above [33]. A measured at the CO2 concentrations of 550 and 1000 µmol mol−1 was used for the Jmax determination since linearity was observed in the relationship between A+Rd at these CO2 concentrations and g’ through the origin (A + Rd = Jmax g’) (Supplemental Figure S1). This supports that A at 550 and 1000 µmol mol−1 CO2 was limited by RuBP regeneration.
Notably, gs stayed above 0.08 mol m−2 s−1 during the A/Ci measurements, which is the threshold of accurate A/Ci response measurement, regarding stomatal patchiness [37]. Vc,max and Jmax, estimated at the leaf temperature of ≈32 °C, were normalized to those at 25 °C by using their temperature responses according to [34].

2.3. Growth and Biomass Allocation

At the end of the experiments (November 2011), all seedlings were harvested. The soils were carefully removed by hand, using small, stainless-steel rakes (Bonsai rake, Kikuwa, Sanjo, Niigata, Japan). The biomasses of the leaves, stems, and roots were measured after oven-drying at 70 °C to a constant weight. We also collected all leaves that were shed before harvest. Senescent leaves with an abscission layer, which were easily detached by hand, were collected every day from 1 September 2011 to the end of the experiments; we considered them shed leaves. We calculated the ratio of shoot to root (S:R ratio), defined as [leaf + shed leaf + stem dry mass]/[root dry mass], and leaf weight ratio (LWR), calculated as [leaf + shed leaf dry mass]/[total dry mass]. As some seedlings died during the growth season irrespective of the treatment, due to some unidentified reason, 7 to 14 plants per treatment combination were sampled, where initially 18 plants were planted per treatment combination (totally 72 plants).

2.4. Leaf Nitrogen Content

The area-based leaf nitrogen content (Narea) was determined for the leaves used for the gas exchange measurements by the combustion method, using an analysis system composed of an N/C determination unit (SUMIGRAPH, NC 800, Sumika Chem. Anal. Service, Osaka, Japan), a gas chromatograph (GC 8A, Shimadzu, Kyoto, Japan), and a data processor (Chromatopac, C R6A, Shimadzu). The leaf area of the sampled whole leaves was determined, using a scanner (LiDE210, Canon, Tokyo, Japan) and an image analysis software (LIA32 ver 0.3781, http://www.agr.nagoya-u.ac.jp/~shinkan/LIA32/, accessed on 24 May 2021). The leaf mass per area (LMA = leaf dry mass/leaf area) was calculated from the leaf area and leaf dry mass measured after oven-drying at 70 °C. Using LMA, dry-mass-based leaf N was converted to Narea.

2.5. Statistical Analysis

As one representative plant per FACE frame (experimental unit; n = 3 for each treatment combination) was used for the gas exchange measurements and leaf N analysis, a two-factorial ANOVA was used to test the effects of CO2, O3 and their interaction on the photosynthetic properties and leaf N content of young and old leaves (R Development Core Team 2014). A linear mixed model was applied to analyze the total biomass and S:R ratio, with CO2 and O3 treatments as fixed factors and the frame as a random effect. We used the lmer function of the R package lme4 for the model fitting [38], and the ANOVA function of the R package car for the analysis of the deviance table [39]. The level of significance was 0.05.

3. Results

3.1. Growth Responses of Japanese white Birch Seedlings to Elevated CO2 and O3

The total biomass was increased by the elevated CO2 but decreased by the elevated O3 (Figure 2a). Conversely, the S:R ratio showed no significant difference among the treatment combinations (Figure 2b). Similar to the S:R ratio, LWR showed no significant difference among the treatment combinations (Figure 2c). The shed leaf to total leaf dry mass, defined as [shed leaf dry mass]/[leaf + shed leaf dry mass], was significantly increased by the elevated O3 (Figure 2d).

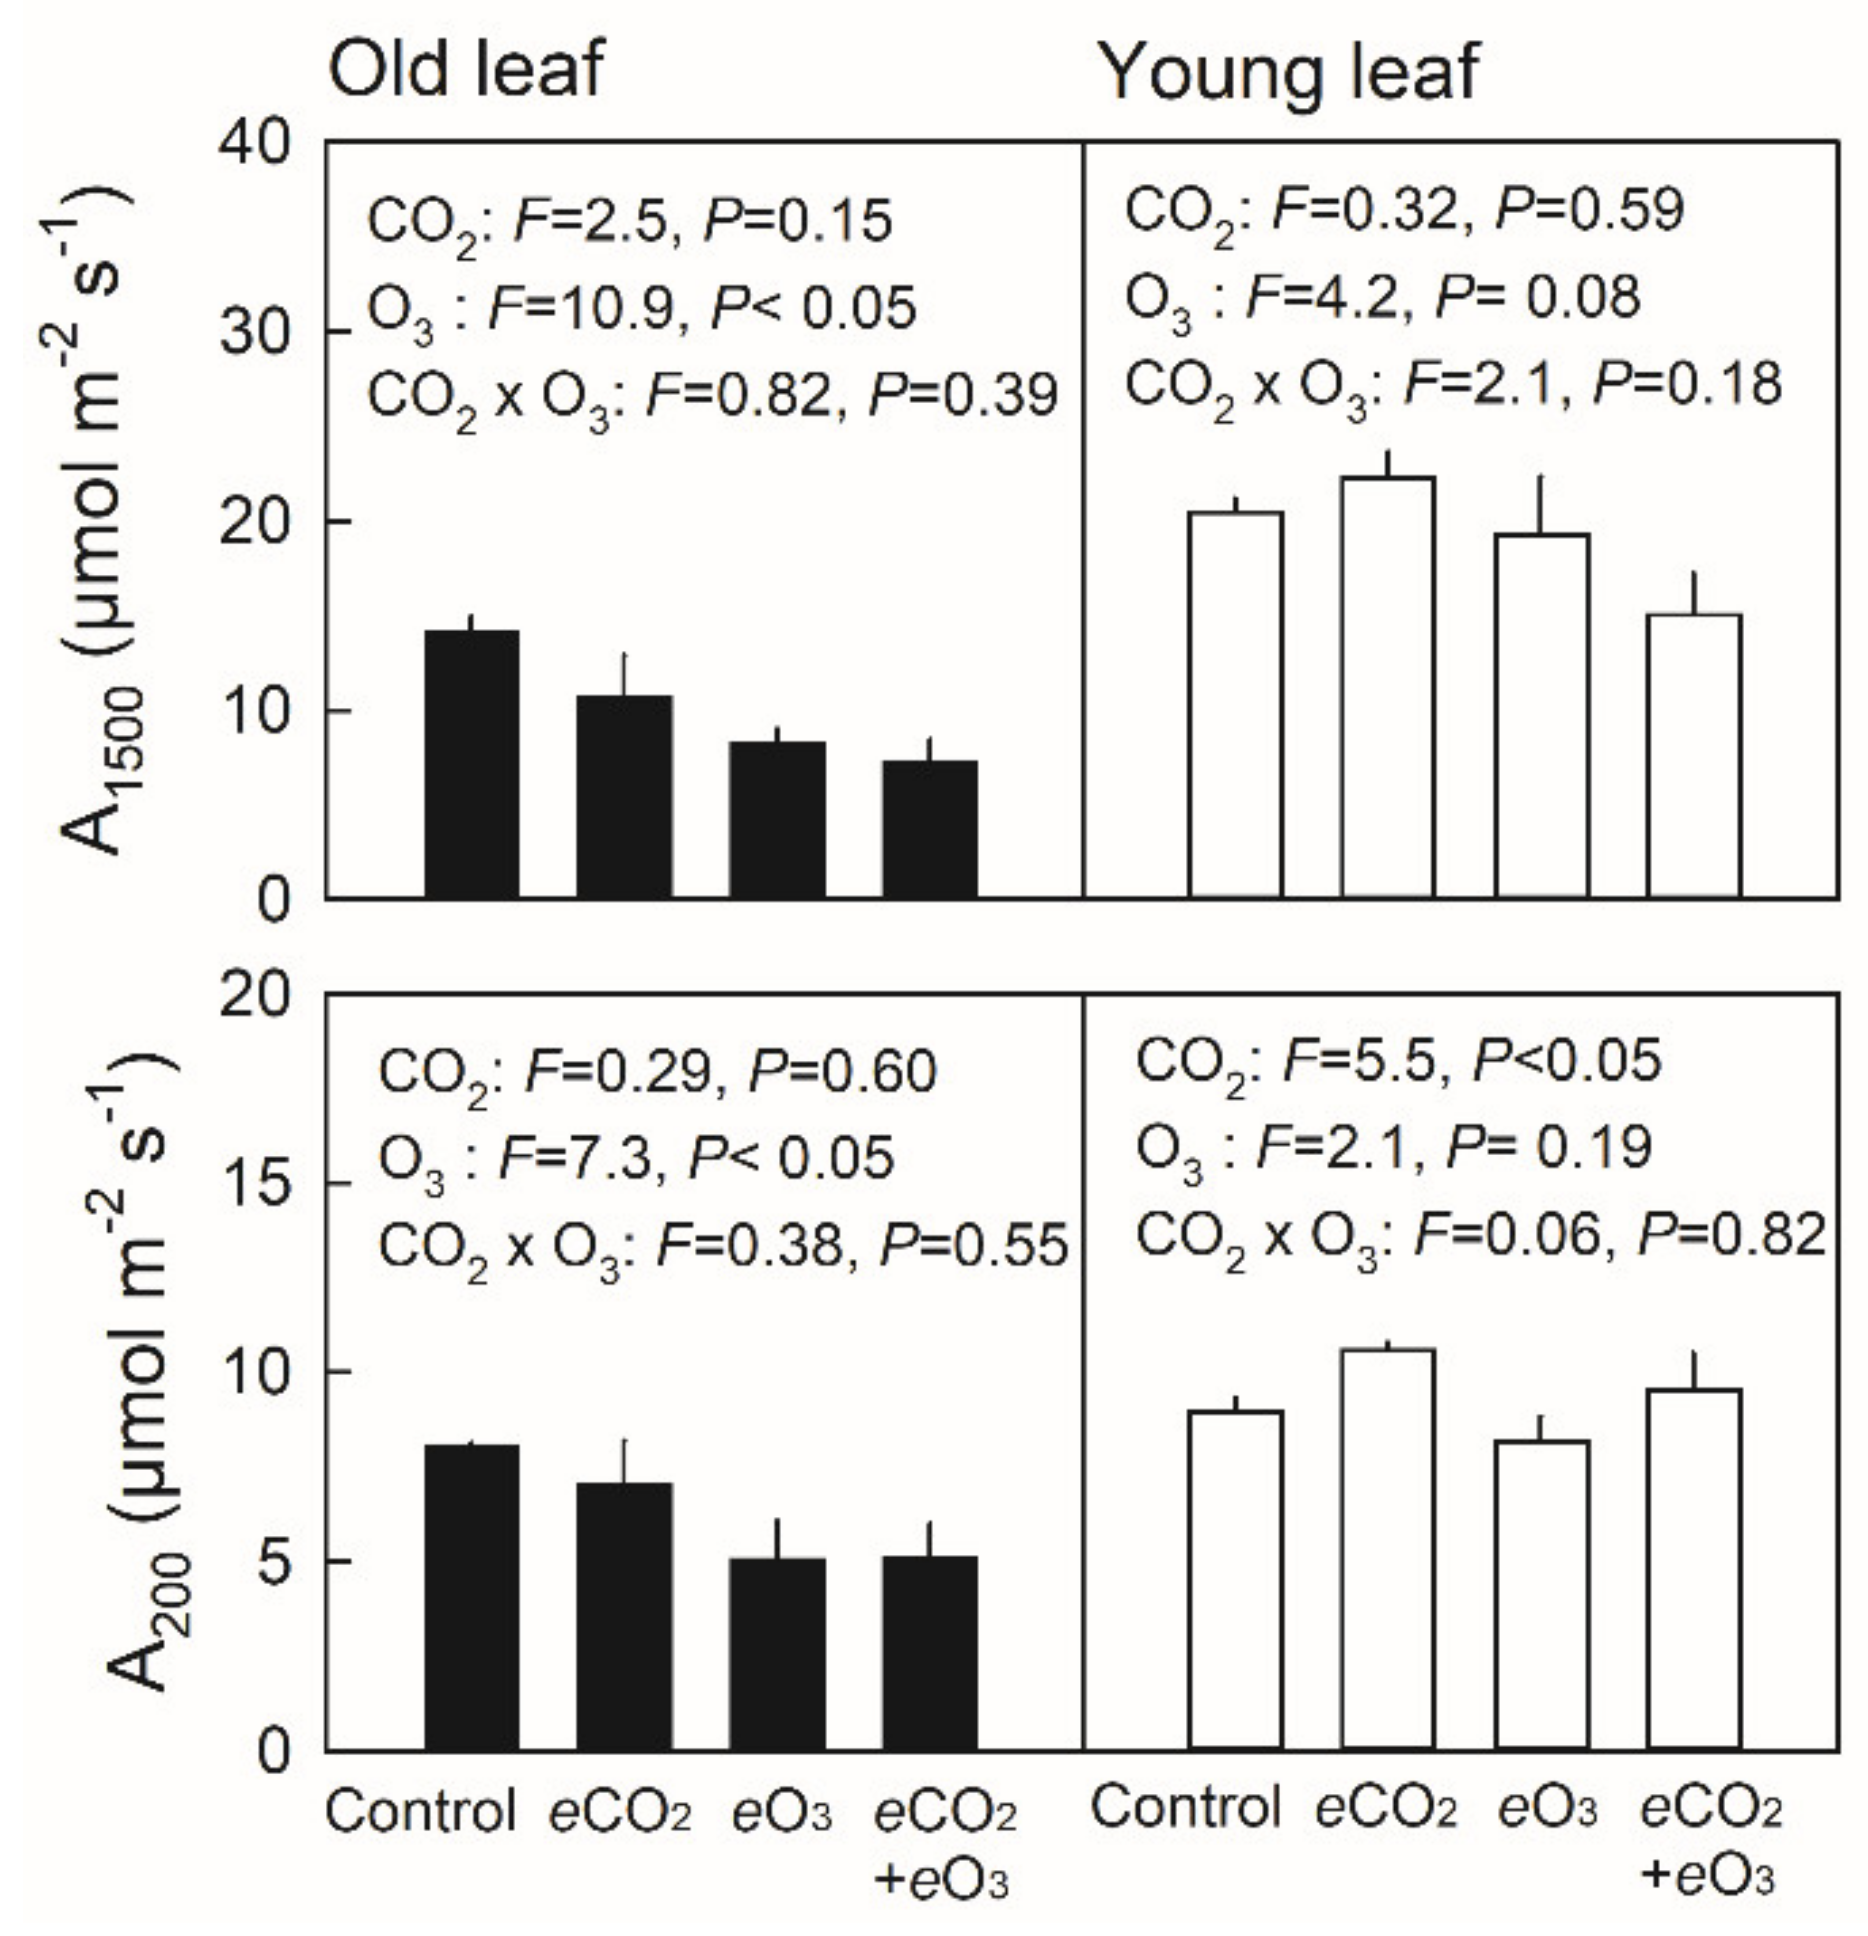
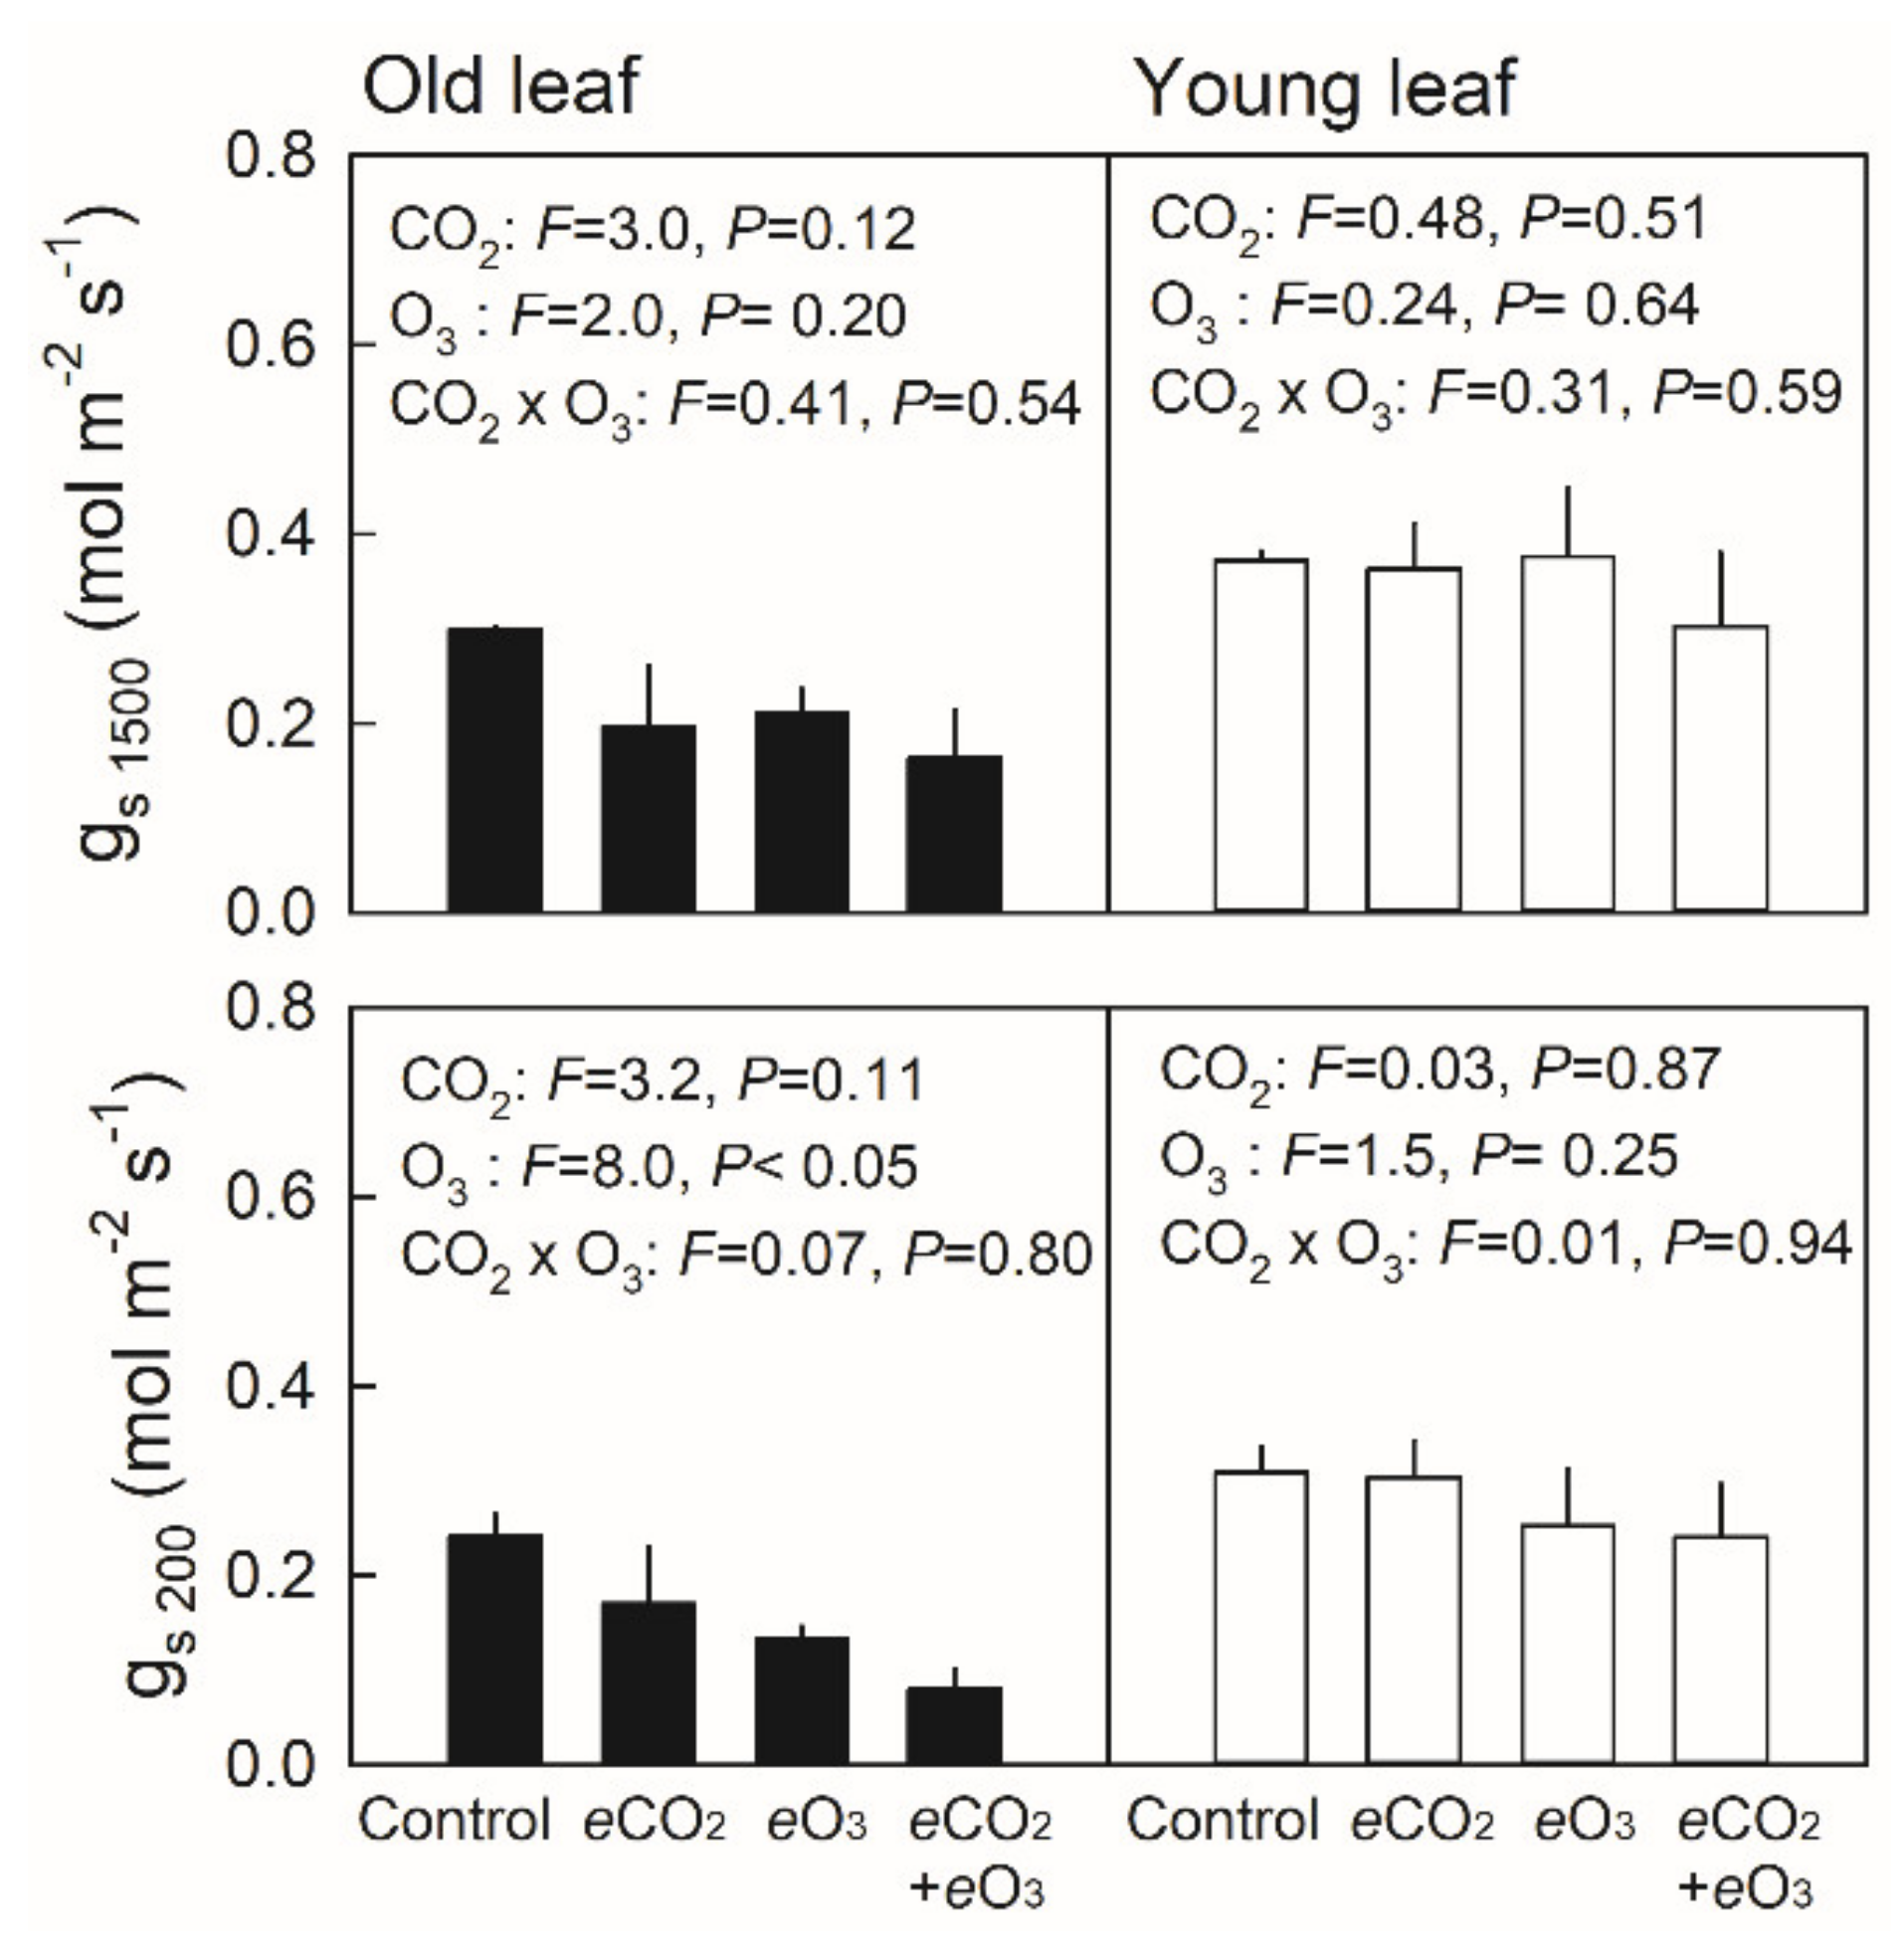
3.2. Net Photosynthetic Rate and Stomatal Conductance in Young and Old Leaves of Japanese Birch Seedlings Grown under the Combination of CO2 and O3

The light-saturated net photosynthetic rate under a light intensity of 1500 µmol m−2 s−1 (A1500) showed no significant difference in young leaves (≈ 30 day old) among the treatment combinations, whereas decreases in A1500 were observed in old leaves (≈ 60 day old) of plants grown under elevated O3 (Figure 3, upper panel). Conversely, the light-limited net photosynthetic rate, measured under a light intensity of 200 µmol m−2 s−1 (A200), showed higher values in young leaves of plants grown under elevated CO2, whereas elevated O3 decreased A200 in old leaves (Figure 3, lower panel). In all cases, no significant effect of the CO2 × O3 interaction was observed. Stomatal conductance under a saturating light intensity of 1500 µmol m−2 s−1 (gs1500) showed no significant difference among the treatment combinations both in young and old leaves (Figure 4, upper panel). Although stomatal conductance under a limiting light intensity of 200 µmol m−2 s−1 (gs200) showed no significant difference in young leaves, gs200 was significantly decreased by elevated O3 (Figure 4, lower panel).

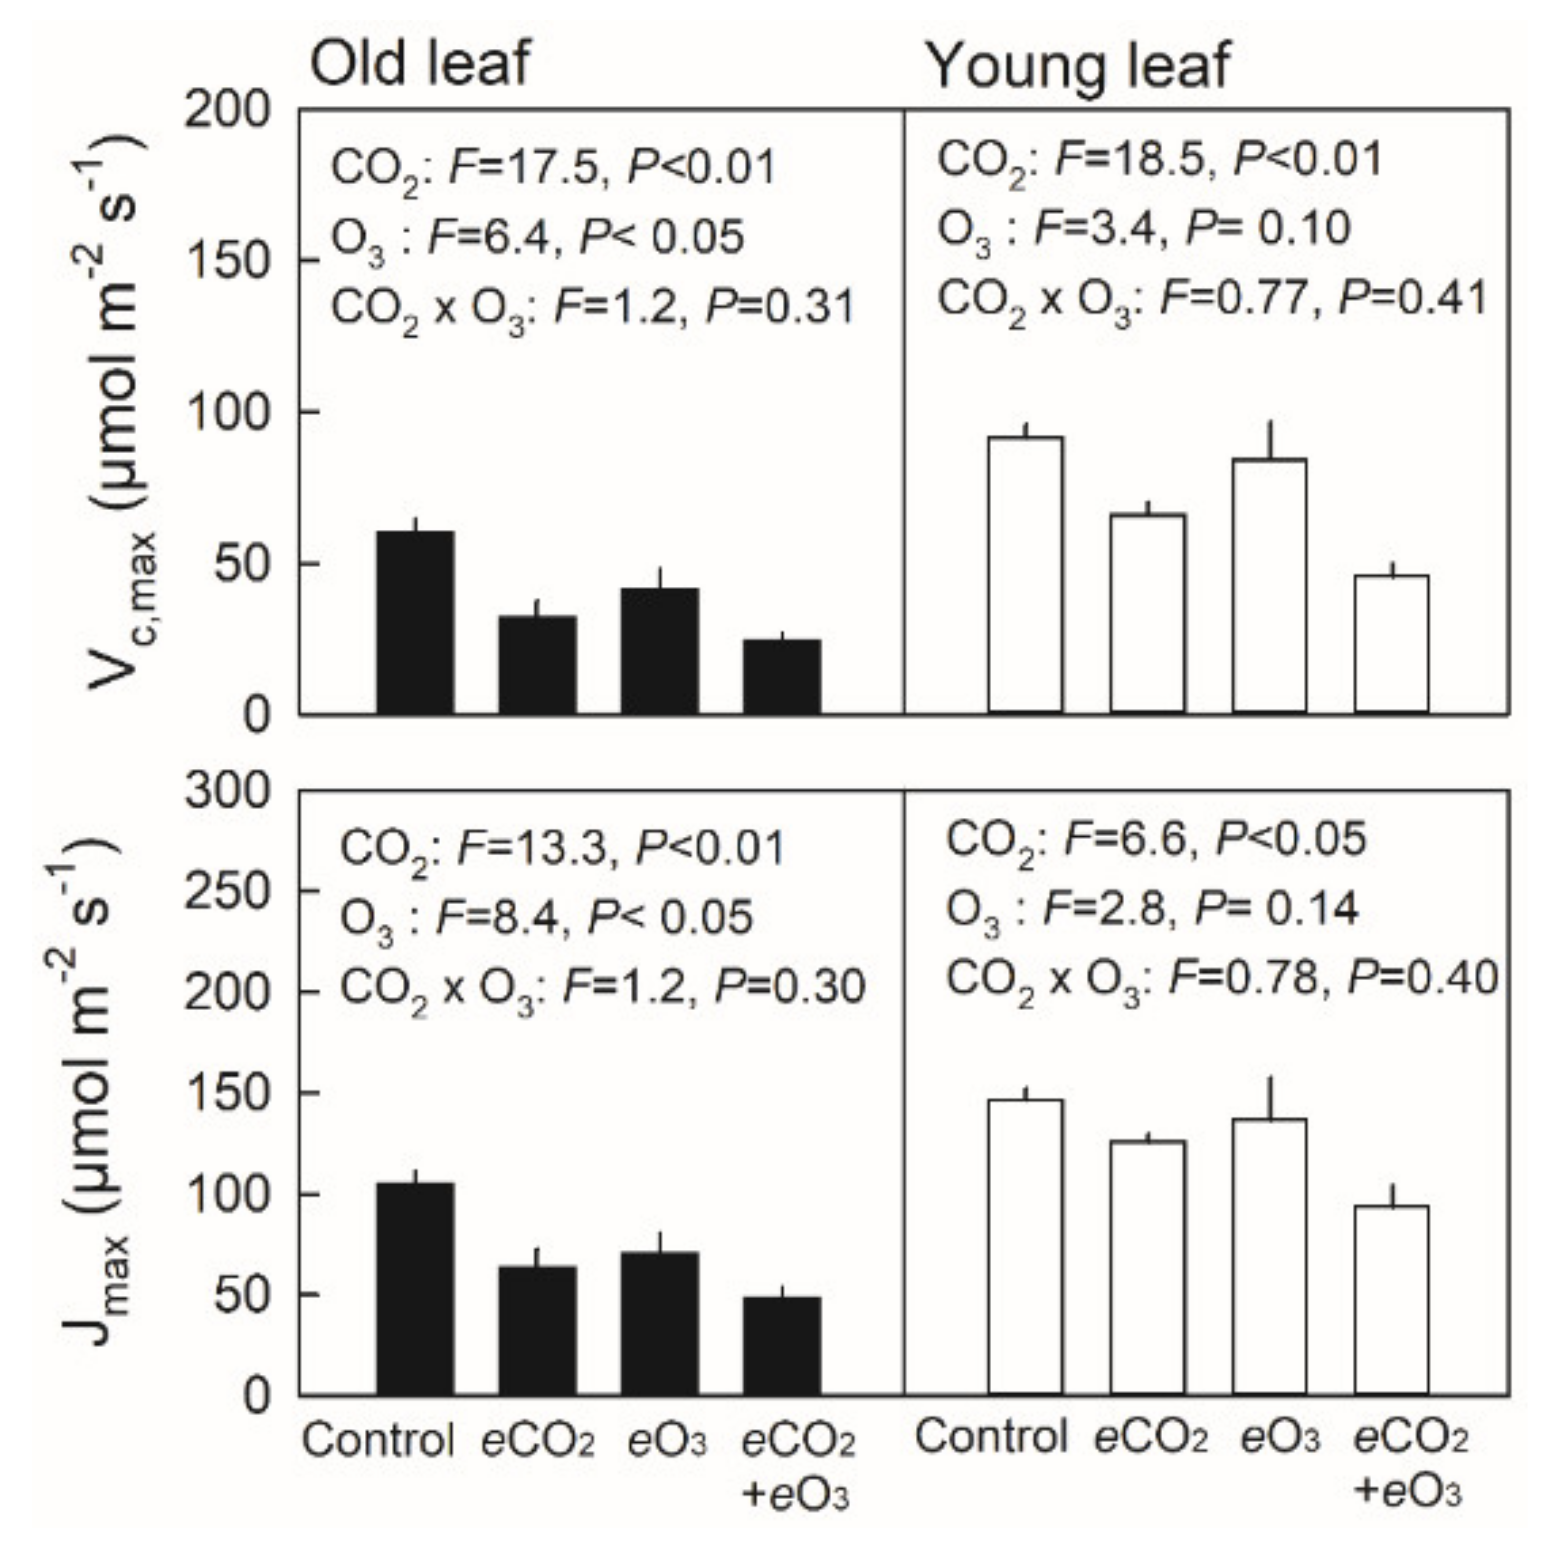
3.3. Maximum Rates of Rubisco Carboxylation (Vc,max) and RuBP Regeneration (Jmax) in Young and Old Leaves of Japanese Birch Seedlings Grown under the Combination of CO2 and O3

The maximum rate of Rubisco carboxylation (Vc,max) was decreased by the elevated CO2 in young leaves, whereas Vc,max was decreased by both the elevated CO2 and O3 in older leaves (Figure 5, upper panel). The maximum rate of RuBP regeneration (Jmax) was also decreased by the elevated CO2 in young leaves and decreased by the elevated CO2 and O3 in old leaves (Figure 5, lower panel). No significant effect of the CO2 × O3 interaction on Vc,max and Jmax was observed.

3.4. Leaf Nitrogen Content

The area-based leaf nitrogen content (Narea) generally decreased in older leaves, while leaves of plants grown under elevated CO2 showed significantly lower Narea for both young and old leaves of Japanese white birch seedlings (Figure 6). Conversely, no significant effect of the CO2 × O3 interaction was observed.

4. Discussion

In the present study, we observed growth enhancement by elevated CO2 but suppression by elevated O3 in Japanese white birch seedlings grown in a free-air CO2 and O3 exposure system without any limitation of root growth as it has been reported for the pioneer tree species Populus tremuloides [40]. However, the growth responses in Japanese white birch were quite different from those observed in mid- and late-successional tree species. Mid-successional tree species (Japanese oak (Quercus mongolica var. crispula) and Konara oak (Q. serrata)), and late-successional tree species (Sebold’s beech (Fagus crenata)), showed an enhancement of shoot growth relative to root growth by O3 exposure, which fully compensated the reduction in the photosynthetic rate by O3 regarding plant growth, and even led to significant increases in total dry mass under the combination of elevated CO2 and O3 [29,30,41]. Thus, growth responses to elevated CO2 and O3 might depend on both photosynthetic responses and biomass allocation into plant organs, especially into leaves.
Japanese white birch seedlings showed little change in biomass allocation as is indicated by the almost constant value of the S:R ratio (around 2) and leaf weight ratio (≈0.23) (Figure 2). As a pioneer tree species, Japanese white birch produces new leaves continuously throughout the growth season, while mid- and late-successional species generally flush several leaves at once in spring [27,42]. Such a difference in the shoot development pattern caused a different biomass allocation pattern, indicated by the S:R ratio; Japanese white birch showed a value of 2 but Japanese oak and Konara oak showed a value of 1 in control plants grown in ambient air [29]. Japanese white birch could not change the ratio under elevated O3, whereas Japanese oak and Konara oak, grown in the same FACE system, changed the ratio from 1 to 2 in the case of elevated O3 exposure [29], maybe because O3-induced hormonal changes might stimulate the intrinsically conservative shoot growth in the two oak species [43,44,45]. Thus, without any changes in biomass allocation, the growth of Japanese white birch might be influenced more directly by photosynthetic responses to elevated CO2 and O3, in comparison with mid- or late-successional tree species.
Growth responses of Japanese white birch among the treatment combinations could not be fully explained by the differences in A1500 measured in mid-summer, where a higher total dry mass was observed under elevated CO2 despite no significant enhancement in A1500 (Figure 2 and Figure 3). Conversely, decreases in total biomass in plants grown under O3 exposure could be attributed to the lower A1500 in old leaves. Although the light-saturated photosynthetic rate is often used as a measure of plant responses to environmental stresses, diurnal changes in environmental conditions, and the leaf-age-dependent photosynthetic capacity should be taken into consideration for assessing plant growth as an integration of photosynthetic performance.
Regarding the photosynthetic capacity indicated by Vc,max and Jmax, photosynthetic downregulation apparently occurred even in young leaves in August 2011, accompanied by a reduction in Narea [18,46,47]. Conversely, old leaves decreased photosynthetic capacity (Vc,max and Jmax) under both elevated CO2 and elevated O3, suggesting that O3-accelerated leaf senescence may be due to oxidative damage additionally occurred upon photosynthetic downregulation by the elevated CO2 [12,13,15,48]. Elevated CO2 can affect the photosynthetic capacity in a short term (significantly, even for young leaves), whereas O3 only affects it over a longer term. Furthermore, although elevated O3 did not affect leaf production (Figure 2c), O3-accelerated leaf senescence induced earlier leaf shedding in autumn (Figure 2d), which might also cause an adverse effect on plant growth. Conversely, photosynthetic performance (indicated by A1500, Figure 3) of young leaves under the respective growth CO2 concentrations showed no significant differences among the treatment combinations, suggesting that the photosynthetic downregulation (reduction in Vc,max or Jmax; Figure 5) could be compensated by the elevated CO2 by enhancing photosynthesis and suppressing photorespiration via higher intercellular CO2 concentrations [33,48]. Such a compensative effect of the elevated CO2 seemed still effective in old leaves, which showed lower A1500 only under elevated O3.
Photosynthetic downregulation occurs with enhanced plant growth, which results from nitrogen dilution due to increased biomass over the nitrogen acquisition capacity by the root system [19,49]. In this context, the leaves of plants grown under elevated CO2 were downregulated as of the time point of measuring photosynthesis in August 2011 as a consequence of growth enhancement, which was supported by the lower Narea in the young leaves of plants grown under elevated CO2. Soil N availability might have been limited as of that time because of the relatively poor root system in seedlings of Japanese white birch, indicated by the high S:R ratio.
It is also noteworthy that a significantly higher light-limited photosynthetic rate (A200) was observed in young leaves of plants grown under elevated CO2 (Figure 3). Elevated CO2-induced photosynthetic downregulation accompanied by decreased Narea might not influence the total electron flow under limiting light (Supplemental Figure S2). Conversely, a reduction in electron partitioning into photorespiration under elevated CO2 resulted in a higher photosynthetic rate under limiting light (A200) [50]. As Japanese white birch develops new leaves continuously during the growing season [27,42], most leaves are partially shaded except for the topmost ones. Accordingly, all leaves could not necessarily receive saturating light even around noon. Therefore, the higher A under limiting light in the elevated-CO2-grown plants could also contribute to the greater growth under elevated CO2. Such an increase in light-limited photosynthesis would be of relevance for shade tolerance among tree species with different successional traits [51].
Regarding gs, elevated O3 decreased gs only in old leaves of Japanese white birch under limiting light. This suggests that O3-induced stomatal closure, which contributes to preventing O3 influx [17,52], might not function well in Japanese white birch. Relatively higher gs (gs1500, up to 0.4 mol m−2 s−1) was observed in the control plants of Japanese white birch, compared with those in Q. mongolica (up to 0.3 mol m−2 s−1) and Q. serrata (up to 0.2 mol m−2 s−1) (cf. [29]), which suggests that photosynthesis of Japanese white birch might be more sensitive to elevated O3 exposure as a consequence of the higher phytotoxic O3 dose through the stomata [53].
In conclusion, a pioneer species, Japanese white birch, had no compensative biomass allocation into shoot growth under elevated O3, in contrast to mid- and late-successional species. This may be attributed to its intrinsically higher S:R ratio not allowing further changes. Accordingly, photosynthetic responses, including earlier leaf senescence, might be associated with the growth responses to elevated CO2 and O3. Nevertheless, age-dependent changes in photosynthetic capacity, and light-limited photosynthesis should be taken into consideration to predict growth response of Japanese white birch in future-coming atmospheric conditions.

Supplementary Materials

The following are available online at https://www.mdpi.com/article/10.3390/f12060675/s1, Figure S1: Light-saturated net photosynthetic rate (A) as a function of f’, and A + Rd as a function of g’ in a leaf of Japanese white birch. Figure S2: Electron transport rate under saturating or limiting light intensity in old and young leaves of Japanese white birch seedlings grown under CO2 and O3 treatment combinations.

Author Contributions

M.K. (Mitsutoshi Kitao) and H.T. designed the study. M.K. (Mitsutoshi Kitao), H.T., S.K., K.Y. and M.K. (Masabumi Komatsu) collected the photosynthetic data, performed the analysis, and hence equally contributed to this study. M.K. (Mitsutoshi Kitao) led the writing with input from E.A. All authors also discussed the results and commented on the manuscript. All authors have read and agreed to the published version of the manuscript.

Funding

This study was supported in part by JSPS KAKENHI Grant Number JP20H03036.

Institutional Review Board Statement

Not applicable.

Informed Consent Statement

Not applicable.

Data Availability Statement

The data presented in this study are available within the article and its supplementary materials.

Acknowledgments

We thank K. Sakai for leaf N analysis.

Conflicts of Interest

The authors declare no conflict of interest.

References

  1. IPCC. Climate Change 2007: The Physical Science Basis. Contribution of Working Group I to the Fourth Assessment Report of the Intergovernmental Panel on Climate Change; Solomon, S., Qin, D., Manning, M., Chen, Z., Marquis, M., Averyt, K.B., Tignor, M., Miller, H.L., Eds.; Cambridge University Press: Cambridge, UK, 2007; ISBN 978-0521705967. [Google Scholar]
  2. IPCC. Climate Change 2013: The Physical Science Basis. Contribution of Working Group I to the Fifth Assessment Report of the Intergovernmental Panel on Climate Change; Stocker, T.F., Qin, D., Plattner, G.-K., Tignor, M., Allen, S.K., Boschung, J., Nauels, A., Xia, Y., Bex, V., Midgley, P.M., Eds.; Cambridge University Press: Cambridge, UK, 2013; ISBN 978-1-107-05799-1. [Google Scholar]
  3. Takigawa, M.; Niwano, M.; Akimoto, H.; Takahashi, M.; Kobayashi, K. Projection of surface ozone over East Asia in 2020. J. Agric. Meteorol. 2009, 65, 161–166. [Google Scholar] [CrossRef]
  4. Li, K.; Jacob, D.J.; Liao, H.; Qiu, Y.; Shen, L.; Zhai, S.; Bates, K.H.; Sulprizio, M.P.; Song, S.; Lu, X.; et al. Ozone pollution in the North China Plain spreading into the late-winter haze season. Proc. Natl. Acad. Sci. USA 2021, 118, e2015797118. [Google Scholar] [CrossRef] [PubMed]
  5. Mukherjee, A.; Agrawal, M. Air pollutant levels are 12 times higher than guidelines in Varanasi, India. Sources and transfer. Environ. Chem. Lett. 2018, 16, 1009–1016. [Google Scholar] [CrossRef]
  6. Li, P.; De Marco, A.; Feng, Z.; Anav, A.; Zhou, D.; Paoletti, E. Nationwide ground-level ozone measurements in China suggest serious risks to forests. Environ. Pollut. 2018, 237, 803–813. [Google Scholar] [CrossRef]
  7. Matyssek, R.; Wieser, G.; Ceulemans, R.; Rennenberg, H.; Pretzsch, H.; Haberer, K.; Löw, M.; Nunn, A.J.J.; Werner, H.; Wipfler, P.; et al. Enhanced ozone strongly reduces carbon sink strength of adult beech (Fagus sylvatica)—Resume from the free-air fumigation study at Kranzberg Forest. Environ. Pollut. 2010, 158, 2527–2532. [Google Scholar] [CrossRef] [Green Version]
  8. Ainsworth, E.A.; Yendrek, C.R.; Sitch, S.; Collins, W.J.; Emberson, L.D. The effects of tropospheric ozone on net primary productivity and implications for climate change. Annu. Rev. Plant Biol. 2012, 63, 637–661. [Google Scholar] [CrossRef] [Green Version]
  9. Agathokleous, E.; Kitao, M.; Kinose, Y. A review study on ozone phytotoxicity metrics for setting critical levels in Asia. Asian J. Atmos. Environ. 2018, 12, 1–16. [Google Scholar] [CrossRef] [Green Version]
  10. Feng, Z.; De Marco, A.; Anav, A.; Gualtieri, M.; Sicard, P.; Tian, H.; Fornasier, F.; Tao, F.; Guo, A.; Paoletti, E. Economic losses due to ozone impacts on human health, forest productivity and crop yield across China. Environ. Int. 2019, 131, 104966. [Google Scholar] [CrossRef]
  11. Mukherjee, A.; Yadav, D.S.; Agrawal, S.B.; Agrawal, M. Ozone a persistent challenge to food security in India: Current status and policy implications. Curr. Opin. Environ. Sci. Health 2021, 19, 100220. [Google Scholar] [CrossRef]
  12. Hoshika, Y.; Watanabe, M.; Inada, N.; Koike, T. Growth and leaf gas exchange in three birch species exposed to elevated ozone and CO2 in summer. Water. Air. Soil Pollut. 2012, 223, 5017–5025. [Google Scholar] [CrossRef] [Green Version]
  13. Watanabe, M.; Hoshika, Y.; Inada, N.; Wang, X.; Mao, Q.; Koike, T. Photosynthetic traits of Siebold’s beech and oak saplings grown under free air ozone exposure in northern Japan. Environ. Pollut. 2013, 174, 50–56. [Google Scholar] [CrossRef] [PubMed] [Green Version]
  14. Li, P.; Feng, Z.; Catalayud, V.; Yuan, X.; Xu, Y.; Paoletti, E. A meta-analysis on growth, physiological and biochemical responses of woody species to ground-level ozone highlights the role of plant functional types. Plant Cell Environ. 2017, 40, 2369–2380. [Google Scholar] [CrossRef]
  15. Hoshika, Y.; Watanabe, M.; Inada, N.; Mao, Q.; Koike, T. Photosynthetic response of early and late leaves of white birch (Betula platyphylla var. japonica) grown under free-air ozone exposure. Environ. Pollut. 2013, 182, 242–247. [Google Scholar]
  16. Kitao, M.; Löw, M.; Heerdt, C.; Grams, T.E.E.; Häberle, K.-H.; Matyssek, R. Effects of chronic elevated ozone exposure on gas exchange responses of adult beech trees (Fagus sylvatica) as related to the within-canopy light gradient. Environ. Pollut. 2009, 157, 537–544. [Google Scholar] [CrossRef] [PubMed]
  17. Hoshika, Y.; Watanabe, M.; Kitao, M.; Häberle, K.-H.; Grams, T.E.E.; Koike, T.; Matyssek, R. Ozone induces stomatal narrowing in European and Siebold’s beeches: A comparison between two experiments of free-air ozone exposure. Environ. Pollut. 2015, 196, 527–533. [Google Scholar] [CrossRef] [PubMed]
  18. Norby, R.J.; Zak, D.R. Ecological Lessons from Free-Air CO2 Enrichment (FACE) Experiments. Annu. Rev. Ecol. Evol. Syst. 2011, 42, 181–203. [Google Scholar] [CrossRef] [Green Version]
  19. Ainsworth, E.A.; Long, S.P. What have we learned from 15 years of free-air CO2 enrichment (FACE)? A meta-analytic review of the responses of photosynthesis, canopy properties and plant production to rising CO2. New Phytol. 2005, 165, 351–372. [Google Scholar] [CrossRef]
  20. Koike, T.; Watanabe, M.; Watanabe, Y.; Agathokleous, E.; Eguchi, N.; Takagi, K.; Satoh, F.; Kitaoka, S.; Funada, R. Ecophysiology of deciduous trees native to Northeast Asia grown under FACE (Free Air CO2 Enrichment). J. Agric. Meteorol. 2015, 71, 174–184. [Google Scholar] [CrossRef]
  21. Rogers, A.; Ellsworth, D.S. Photosynthetic acclimation of Pinus taeda (loblolly pine) to long-term growth in elevated pCO2 (FACE). Plant Cell Environ. 2002, 25, 851–858. [Google Scholar] [CrossRef] [Green Version]
  22. Poorter, H. Interspecific variation in relative growth rate: On ecological causes and physiological consequences. In Causes and Consequences of Variation in Growth Rate and Productivity of Higher Plants; Lambers, H., Cambridge, M.L., Konings, H., Pons, T.L., Eds.; SPB Academic Publishing: The Hague, The Netherlands, 1989; pp. 45–68. ISBN 9051030339. [Google Scholar]
  23. Landolt, W.; Bühlmann, U.; Bleuler, P.; Bucher, J. Ozone exposure–response relationships for biomass and root/shoot ratio of beech (Fagus sylvatica), ash (Fraxinus excelsior), Norway spruce (Picea abies) and Scots pine (Pinus sylvestris). Environ. Pollut. 2000, 109, 473–478. [Google Scholar] [CrossRef]
  24. Oksanen, E.; Rousi, M. Differences of Betula origins in ozone sensitivity based on open-field experiment over two growing seasons. Can. J. For. Res. 2001, 31, 804–811. [Google Scholar] [CrossRef]
  25. Calatayud, V.; Cerveró, J.; Calvo, E.; García-Breijo, F.J.; Reig-Arminana, J.; Sanz, M.J. Responses of evergreen and deciduous Quercus species to enhanced ozone levels. Environ. Pollut. 2011, 159, 55–63. [Google Scholar] [CrossRef] [PubMed]
  26. Agathokleous, E.; Saitanis, C.J.; Wang, X.; Watanabe, M.; Koike, T. A review study on past 40 years of research on effects of tropospheric O3 on belowground structure, functioning, and processes of trees: A linkage with potential ecological implications. Water Air Soil Pollut. 2016, 227, 33. [Google Scholar] [CrossRef]
  27. Kikuzawa, K. Leaf survival of woody plants in deciduous broad-leaved forests. 1. Tall trees. Can. J. Bot. 1983, 61, 2133–2139. [Google Scholar] [CrossRef]
  28. Koike, T. Leaf structure and photosynthetic performance as related to the forest succession of deciduous broad-leaved trees 1. Plant Species Biol. 1988, 3, 77–87. [Google Scholar] [CrossRef]
  29. Kitao, M.; Komatsu, M.; Yazaki, K.; Kitaoka, S.; Tobita, H. Growth overcompensation against O3 exposure in two Japanese oak species, Quercus mongolica var. crispula and Quercus serrata, grown under elevated CO2. Environ. Pollut. 2015, 206, 133–141. [Google Scholar] [PubMed]
  30. Tobita, H.; Komatsu, M.; Harayama, H.; Yazaki, K.; Kitaoka, S.; Kitao, M. Effects of combined CO2 and O3 exposures on net CO2 Assimilation and biomass allocation in seedlings of the late-successional Fagus crenata. Climate 2019, 7, 117. [Google Scholar] [CrossRef] [Green Version]
  31. Koike, T. Physiological ecology of the growth characteristics of Japanese mountain birch in northern Japan: A comparison with Japanese mountain white birch. In Vegetation Science in Forestry: Global Perspective Based on Forest Ecosystems of East and Southeast Asia; Box, E.E.O., Peet, R.K., Masuzawa, T., Yamada, I., Fujiwara, K., Maycock, P.F., Eds.; Kluwer Academic Publishers: Dordrecht, The Netherlands, 1995; pp. 409–422. ISBN 978-0-7923-2679-3. [Google Scholar]
  32. Leverenz, J.W.; Falk, S.; Pilström, C.M.; Samuelsson, G. The effects of photoinhibition on the photosynthetic light-response curve of green plant cells (Chlamydomonas reinhardtii). Planta 1990, 182, 161–168. [Google Scholar] [CrossRef]
  33. Long, S.P.; Bernacchi, C.J. Gas exchange measurements, what can they tell us about the underlying limitations to photosynthesis? Procedures and sources of error. J. Exp. Bot. 2003, 54, 2393–2401. [Google Scholar] [CrossRef] [Green Version]
  34. Bernacchi, C.J.; Singsaas, E.L.; Pimentel, C.; Portis, A.R., Jr.; Long, S.P. Improved temperature response functions for models of Rubisco-limited photosynthesis. Plant Cell Environ. 2001, 24, 253–259. [Google Scholar] [CrossRef]
  35. Wilson, K.B.; Baldocchi, D.D.; Hanson, P.J. Spatial and seasonal variability of photosynthetic parameters and their relationship to leaf nitrogen in a deciduous forest. Tree Physiol. 2000, 20, 565–578. [Google Scholar] [CrossRef] [Green Version]
  36. De Kauwe, M.G.; Lin, Y.; Wright, I.J.; Medlyn, B.E.; Crous, K.Y.; Ellsworth, D.S.; Maire, V.; Prentice, I.C.; Atkin, O.K.; Rogers, A.; et al. A test of the ‘one-point method’ for estimating maximum carboxylation capacity from field-measured, light-saturated photosynthesis. New Phytol. 2016, 210, 1130–1144. [Google Scholar] [CrossRef] [PubMed] [Green Version]
  37. Kitao, M.; Agathokleous, E.; Harayama, H.; Yazaki, K.; Tobita, H. Constant ratio of Cc to Ci under various CO2 concentrations and light intensities, and during progressive drought, in seedlings of Japanese white birch. Photosynth. Res. 2021, 147, 27–37. [Google Scholar] [CrossRef] [PubMed]
  38. Bates, D.; Mächler, M.; Bolker, B.; Walker, S. Fitting linear mixed-effects models using lme4. J. Stat. Softw. 2015, 67, 1–48. [Google Scholar] [CrossRef]
  39. Fox, J.; Weisberg, S. An R Companion to Applied Regression, 3rd ed.; Sage Publications: Thousand Oaks, CA, USA, 2019; ISBN 9781544336473. [Google Scholar]
  40. McDonald, E.P.; Kruger, E.L.; Riemenschneider, D.E.; Isebrands, J.G. Competitive status influences tree-growth responses to elevated CO2 and O3 in aggrading aspen stands. Funct. Ecol. 2002, 16, 792–801. [Google Scholar] [CrossRef] [Green Version]
  41. Watanabe, M.; Umemoto-Yamaguchi, M.; Koike, T.; Izuta, T. Growth and photosynthetic response of Fagus crenata seedlings to ozone and/or elevated carbon dioxide. Landsc. Ecol. Eng. 2010, 6, 181–190. [Google Scholar] [CrossRef] [Green Version]
  42. Seiwa, K.; Kikuzawa, K.; Kadowaki, T.; Akasaka, S.; Ueno, N. Shoot life span in relation to successional status in deciduous broad-leaved tree species in a temperate forest. New Phytol. 2006, 169, 537–548. [Google Scholar] [CrossRef]
  43. Sakakibara, H. Cytokinins: Activity, biosynthesis, and translocation. Annu. Rev. Plant Biol. 2006, 57, 431–449. [Google Scholar] [CrossRef] [Green Version]
  44. Kiba, T.; Takei, K.; Kojima, M.; Sakakibara, H. Side-chain modification of cytokinins controls shoot growth in Arabidopsis. Dev. Cell 2013, 27, 452–461. [Google Scholar] [CrossRef] [Green Version]
  45. Winwood, J.; Pate, A.E.; Price, A.J.; Hanke, D.E. Effects of long-term, free-air ozone fumigation on the cytokinin content of mature beech trees. Plant Biol. 2007, 9, 265–278. [Google Scholar] [CrossRef]
  46. Kitao, M.; Koike, T.; Tobita, H.; Maruyama, Y. Elevated CO2 and limited nitrogen nutrition can restrict excitation energy dissipation in photosystem II of Japanese white birch (Betula platyphylla var. japonica) leaves. Physiol. Plant. 2005, 125, 64–73. [Google Scholar] [CrossRef]
  47. Koike, T.; Kitao, M.; Hikosaka, K.; Agathokleous, E.; Watanabe, Y.; Watanabe, M.; Eguchi, N.; Funada, R. Photosynthetic and photosynthesis-related responses of Japanese native trees to CO2: Results from phytotrons, open-top chambers, natural CO2 springs, and free-air CO2 enrichment. In The Leaf: A Platform for Performing Photosynthesis. Advances in Photosynthesis and Respiration (Including Bioenergy and Related Processes); Adams, W.W., III, Terashima, I., Eds.; Springer: Cham, Switzerland, 2018; pp. 425–449. ISBN 978-3-319-93592-8. [Google Scholar]
  48. Sperdouli, I.; Moustakas, M. Leaf developmental stage modulates metabolite accumulation and photosynthesis contributing to acclimation of Arabidopsis thaliana to water deficit. J. Plant Res. 2014, 127, 481–489. [Google Scholar] [CrossRef] [PubMed]
  49. Taub, D.R.; Wang, X. Why are nitrogen concentrations in plant tissues lower under elevated CO2? A critical examination of the hypotheses. J. Integr. Plant Biol. 2008, 50, 1365–1374. [Google Scholar] [CrossRef] [PubMed]
  50. Von Caemmerer, S. Biochemical Models of Leaf Photosynthesis; CSIRO Pub: Collingwood, Australia, 2000; ISBN 064306379X. [Google Scholar]
  51. Kitao, M.; Hida, T.; Eguchi, N.; Tobita, H.; Utsugi, H.; Uemura, A.; Kitaoka, S.; Koike, T. Light compensation points in shade-grown seedlings of deciduous broadleaf tree species with different successional traits raised under elevated CO2. Plant Biol. 2016, 18, 22–27. [Google Scholar] [CrossRef] [Green Version]
  52. Matyssek, R.; Baumgarten, M.; Hummel, U.; Häberle, K.-H.; Kitao, M.; Wieser, G. Canopy-level stomatal narrowing in adult Fagus sylvatica under O3 stress—Means of preventing enhanced O3 uptake under high O3 exposure? Environ. Pollut. 2015, 196, 518–526. [Google Scholar] [CrossRef] [PubMed]
  53. Yamaguchi, M.; Kinose, Y.; Matsumura, H.; Izuta, T. Evaluation of O3 Effects on Cumulative Photosynthetic CO2 Uptake in Seedlings of Four Japanese Deciduous Broad-Leaved Forest Tree Species Based on Stomatal O3 Uptake. Forests 2019, 10, 556. [Google Scholar] [CrossRef] [Green Version]
Figure 1. Mean daily temperature (solid line) and daily precipitation (solid bar) at the nursery of Forestry and Forest Products Research Institute in Tsukuba, Japan (36°00′ N, 140°08′ E, 20 m a.s.l.).
Forests 12 00675 g001
Figure 2. Dry mass of plant organs (a), shoot to root ratio (b), leaf weight ratio (c), and shed to total leaf dry mass (d) in seedlings of Japanese white birch grown under combinations of CO2 and O3 treatments. Seedlings were planted to the ground in the frames in March 2011, and harvested in November 2011. Enrichment of CO2 and O3 concentrations was conducted from May to November 2011. Shoot to root ratio is defined as [leaf + shed leaf + stem dry mass]/[root dry mass]. Leaf weight ratio = [leaf + shed leaf dry mass]/[total dry mass]. Shed to total leaf dry mass = [shed leaf dry mass]/[leaf + shed leaf dry mass]. Control—ambient air, eCO2—elevated CO2, eO3—elevated O3, and eCO2+eO3—elevated CO2 and O3. Chi-square (χ2) and probability (P) of the effects of CO2, O3 and their interaction are indicated in the panel. Values are mean + SE (n = 7–14).
Forests 12 00675 g002
Figure 3. Net photosynthetic rate under saturating (upper panel) or limiting light intensity (lower panel) in old (closed bar) and young leaves (open bar) of Japanese white birch seedlings grown under the CO2 and O3 treatment combinations. Control—ambient air, eCO2—elevated CO2, eO3—elevated O3, and eCO2 + eO3—elevated CO2 and O3. Young leaves were ≈ 30 days old, and old leaves were ≈ 60 days old. Measurements were conducted under the respective growth CO2 concentrations, where a CO2 concentration of 380 µmol mol−1 was applied for control and eO3 plants, and that of 550 µmol mol−1 was applied for eCO2 and eCO2 + eO3 plants. F-value and probability (P) of the effects of CO2, O3 and their interaction are indicated in the panel. Values are mean + SE (n = 3).
Forests 12 00675 g003
Figure 4. Stomatal conductance (gs) under saturating (upper panel) or limiting light intensity (lower panel) in old (closed bar) and young leaves (open bar) of Japanese white birch seedlings grown under the CO2 and O3 treatment combinations. Control—ambient air, eCO2—elevated CO2, eO3—elevated O3, and eCO2 + eO3—elevated CO2 and O3. Young leaves were ≈30 days old, and old leaves were ≈ 60 days old. Measurements were conducted under the respective growth CO2 concentrations, where a CO2 concentration of 380 µmol mol−1 was applied for control and eO3 plants, and that of 550 µmol mol−1 was applied for eCO2 and eCO2+eO3 plants. F-value and probability (P) of the effects of CO2, O3 and their interaction are indicated in the panel. Values are mean + SE (n = 3).
Forests 12 00675 g004
Figure 5. Maximum rates of Rubisco carboxylation (Vc,max, upper panel) and RuBP regeneration (Jmax, lower panel) in old (closed bars) and young leaves (open bars) of Japanese white birch seedlings grown under CO2 and O3 treatment combinations. Control—ambient air, eCO2—elevated CO2, eO3—elevated O3, and eCO2 + eO3—elevated CO2 and O3. Vc,max and Jmax were normalized to those at 25 °C. Young leaves were ≈ 30 days old, and old leaves were ≈ 60 days old. F-value and probability (P) of the effects of CO2, O3 and their interaction are indicated in the panel. Values are mean + SE (n = 3).
Forests 12 00675 g005
Figure 6. Area-based leaf nitrogen content in old (closed bars) and young leaves (open bars) of Japanese white birch seedlings grown under CO2 and O3 treatment combinations. Control—ambient air, eCO2—elevated CO2, eO3—elevated O3, and eCO2 + eO3—elevated CO2 and O3. Young leaves were ≈ 30 days old, and old leaves were ≈ 60 days old. F-value and probability (P) of the effects of CO2, O3 and their interaction are indicated in the panel. Values are mean + SE (n = 3).
Forests 12 00675 g006
Table 1. CO2 and O3 concentrations in the free-air fumigation system. Values are means ± SD (n = 3) of daytime CO2 and O3 concentrations (6:00 to 18:00) during the growth season (May to November 2011).
TreatmentControleCO2eO3eCO2 + eO3
CO2 (µmol mol−1)377 ± 1.0563 ± 9.0381 ± 1.2546 ± 2.3
O3 (nmol mol−1)30.2 ± 0.430.2 ± 0.752.2 ± 2.151.6 ± 3.1
Publisher’s Note: MDPI stays neutral with regard to jurisdictional claims in published maps and institutional affiliations.

