1. Introduction
Ice storms have occurred intermittently across northeastern North America for decades and will recur at unpredictable intervals in years ahead [
1,
2,
3,
4]. Each time, landowners must decide about continuing to manage a damaged stand, or remove it to recover the value in standing and fallen trees. Much depends on the kinds and quality of trees affected by the ice loading, the extent of damage to them, and the prospects for crown and growth recovery.
This became a widespread concern after a large-scale ice storm in January 1998 damaged crowns of sugar maple (
Acer saccharum Marsh.) and other northern hardwoods across northern New York, New England, and eastern Canada. The degree of damage depended on wind exposure, length of the storm, duration of ice loading, and tree and stand characteristics. Species composition, topography, slope, aspect, previous management history, overall tree health, tree age, growth form, size, diameter, and crown structure and position all influenced the level of damage [
1,
4,
5,
6].
Many affected stands had a major component of sugar maple. The species has high economic, ecologic, and intrinsic value. So, landowners worried about the impacts from crown breakage and other damages, and the potentials for recovery. Compared to American beech (
Fagus grandifolia Ehrh.) and yellow birch (
Betula alleghaniensis. Brit.), sugar maples of upper canopy positions have relatively high resistance to ice damage [
7]. Crowns rebuild due to epicormic branches forming from dormant buds along the bole within the former crown area [
2,
4,
8]. Even so, loss of half to three quarters of the crown will cause at least short-term growth suppression [
4]. While heavily damaged trees have a greater probability of mortality than lightly or undamaged ones [
8,
9], dominant and codominant trees in even-aged stands have a lower average rate of mortality than ones in intermediate and overtopped crown positions [
10].
Shortly after the storm, several agencies began assessing tree survival, immediate post-storm growth, and other effects (See review by [
4]). Among them, members of SUNY College of Environmental Science and Forestry [
8] established permanent plots in three northern hardwood stands in northern New York, USA, to assess impacts of the ice loading and test the potential for rehabilitation by releasing selected upper canopy trees to reduce losses and promote crown rebuilding after icing events [
4,
11]. These stands had moderate (40–60 mm of ice) to heavy (>60 mm of ice) damage from the 1998 storm [
12]. A decade later, researchers [
13] returned to the plots to examine the age of sugar maple borer (
Glycobius speciosus Say) scars and compare the incidence and timing of bole damage during 10 years prior to and 10 years after the ice storm. They found no significant difference in the incidence of borer injuries between the two time periods.
Early findings from the New York plots showed an initial decrease of radial increment among storm-damaged sugar maples [
4]. Later assessments indicated extensive crown rebuilding among upper canopy trees of that species, and growth recovery [
8]. Other researchers [
6] also observed post-storm growth responses among stands in Quebec. Yet, when exactly the growth recovery started and whether radial increment returned to pre-storm levels remained unclear.
Five years after the 1998 ice storm, forest tent caterpillar (
Malacosoma disstria Hubner) defoliated portions of the ice-damaged area. Outbreaks of this early season defoliator have occurred every 6 and 16 years, and may recur for as many as five consecutive years in the northeastern United States [
14,
15]. However, moderate (>50%) to heavy (≥75%) defoliation in New York State and eastern Canada usually lasts for only two or three years before populations collapse [
16,
17]. Such defoliation will result in growth reduction, and may lead to extensive tree dieback and mortality [
15,
18]. Repeated defoliation over consecutive years may deplete nutrient reserves and trigger a decline in sensitive or weakened trees [
19,
20,
21], especially if occurring in conjunction with other stresses such as drought or defoliation by a leaf disease or insect defoliators [
22].
Potentially, pest outbreaks, as well as damage from ice loading, have at least short-term effects on growth of surviving trees. However, the timing and pattern of recovery has remained unclear. We sought to evaluate patterns of periodic annual radial increment in sugar maple trees damaged by the 1998 ice storm, and later defoliated by the forest tent caterpillar. In addition, we wanted to compare those responses to growth in stands not affected by the 1998 ice storm, but defoliated during the forest tent caterpillar outbreak.
2. Methods and Materials
The project elaborated on earlier findings [
8] by exploring the duration of reduced post-storm growth reported earlier [
4,
23], describing the temporal pattern of annual radial increment recovery following both ice damage and defoliation, and assessing effects a release treatment had on residual trees affected by the ice storm. Since sugar maple trees of upper-canopy positions in even-aged stands have the highest vigor and best growth potential after release by thinning (e.g., [
24,
25,
26,
27]), we focused the assessment on ones of that stature. Our research hypotheses included: (1) radial growth would recover within two years of the ice storm, and upper canopy trees released by a rehabilitation treatment would have greater tree-ring widths than similar trees in a control area; (2) radial growth would recover within the first year after the defoliation, and released upper canopy trees would have greater tree-ring widths than similar ones in the control area; and (3) radial growth responses will differ between upper canopy trees damaged by the ice storm and later defoliated, compared to ones only affected by a defoliation. To test these hypotheses, we sampled two previously thinned even-aged northern hardwood stands with no history of tapping for maple sap production. Past crown thinning had favored vigorous trees of upper canopy positions, leaving high-quality stems as the residuals. We suspected that the 1974 thinning at one site might still influence tree growth through 2010, so we also hypothesized that current growth rates differed across plots thinned earlier to different levels of residual density.
For the current research, we revisited one of the stands used earlier [
8] to assess impacts of the 1998 ice storm. The previously thinned 12-ha even-aged northern hardwood stand lies in the Taylor Creek State Forest near West Pierrepont in St. Lawrence County, NY, USA (44.47132° N, 75.03469° W,
Figure 1). It had damage from the 1998 ice storm, and defoliation by forest tent caterpillar in 2004–2005. Following the ice storm, the stand had trees with tops broken within the crown (estimated at about 70% of all present) and/or broken branches, as well as some bent over and uprooted by the ice loading. Permanent sample plots established in 1999 documented the species, diameter, and condition of standing trees [
8]. We sampled trees from that inventory.
In 2000, half the Taylor Creek area received a rehabilitation treatment that removed all except selected single-stem upper-canopy trees at 7.6–10.7 m intervals, leaving a residual relative density of 40–45% (after [
28,
29]). The released trees had tops broken within the crown and/or broken branches. However, all had some residual live branches, signs of crown rebuilding, no major structural damage to the bole, no important lean (>10%), no evidence of cavities or fungal fruiting bodies on the bole, and bark characteristics and other features indicative of high vigor prior to the crown loss. They represented the best trees available within the treated area (
Figure 2a). The other half of the stand remained untreated as a control. It had comparable kinds of damage due to the ice loading, but remained at a greater density of trees having a wider range of heights and diameters. Among them, we randomly sampled trees from the same range of diameters as the residuals in the rehabilitated area, assuming that they also came from the main canopy and had like kinds and degrees of damage (see [
8] for details about the rehabilitation cutting and the condition of trees in the treated and control areas).
The second site lies 35.7 km to the south, on the SUNY College of Environmental Science and Forestry Ranger School Forest near Wanakena, NY, USA (44.15677° N, 74.92923° W,
Figure 1). It has northern hardwood plots used for a 1974 thinning study that included an uncut control (96% relative density), plus 1.4-ha sub-plots thinned in winter 1974 to 71%, 61%, or 42% residual relative density [
30]. Permanent BAF-10 point samples installed prior to and resampled periodically after thinning had numbered trees, with data about species, diameter, and crown position. The 1974 treatments used crown thinning to release the best trees of upper-canopy positions, leaving residuals at uniform spacing (
Figure 2b). The plots had no additional management after the initial thinning. Within each of the plots, we used inventory data gathered from the permanent points in 2010 to randomly select trees for sampling as noted below, and removed cores from them in 2012. While the ice storm did not affect this stand, forest tent caterpillar defoliated the site in 2005–2007.
One other factor might have affected diameter growth of sugar maple trees at both sites. Precipitation data from 2006 indicate that during July and August only 50% and 30%, respectively, of average monthly precipitation fell at Canton, NY (6.8 km northeast of the Taylor Creek site), and no precipitation fell during July and August at the Wanakena Ranger School station (2.45 km southeast of the Ranger School plots). Levels reached 128% and 135%, respectively, during June 2006 for the two locations, and 115% and 130% for September [
31].
2.1. Data Collection
During 1999–2000, monitoring began at the Taylor Creek site (
Table 1). It used a systematic grid of permanent plots (809 m
2 per plot) with numbered and tagged trees, and recorded species and diameter at breast height (DBH). After a 10-year period, researchers remeasured the plots [
8] to determine if crowns had recovered, how well the trees had grown after the storm damage, and the rates of mortality. The observations did not include any data to characterize the annual patterns of pre- and post-ice storm growth. We therefore returned to the stand in 2012 and took increment cores for a thorough tree-ring analysis. Since the Taylor Creek site had a major forest tent caterpillar defoliation in 2004–2005, we sought to use the tree-ring measurements there to compare response patterns following both the ice storm damage and the defoliation.
The Ranger School thinning plots had a systematic grid of permanent point samples (BAF-10) with numbered and tagged trees. Periodic remeasurements through 36 years after thinning included species and DBH. To characterize the annual patterns of post-defoliation growth, we returned in 2012 to take increment cores for a thorough tree-ring analysis.
2.2. Tree Core Collections
We cored a total of 242 trees: 126 trees at Taylor Creek, and 116 at Ranger School. Within the rehabilitated area at Taylor Creek, sugar maple trees were selected based on a stratified random sample, stratified across the full range of residual tree diameters (
Table 1). For the control area, we randomly drew trees within the same range of diameters, but did not sort them for crown position or likely vigor. At the Ranger School, we collected cores from 29 sugar maple trees within each sub-plot, randomly selecting ones from the 2010 list of trees >22.9 cm DBH (
Table 1). We extracted a single 10.16 cm long core at a height of 1.37 m from the east side of each sample tree, noting the site, plot, tree number, and current DBH. We later dried and polished the cores using progressively finer grit sandpaper, and scanned them into digital images (1200 dpi, equating to a precision of 0.02 mm). Then we measured annual tree-ring widths and crossdated the cores using Cybis Elektronik’s CooRecorder and CDendro 7.6 programs [
32].
2.3. Taylor Creek Data Analysis
All statistical analyses were carried out using SAS 9.3 statistical software [
33]. Tree-ring widths included 9 years before the ice storm and 14 years afterward. We compared differences in tree-ring widths between the control and rehabilitated areas (α = 0.05) using a linear mixed model in PROC MIXED with ring width as a function of the 1989 DBH,
treatment group,
year, and
year ×
treatment. This first order autoregressive model estimated future tree-ring width based on a weighted sum of the preceding ring widths, assuming that preceding values affected current ones. The Kenward-Rogers approach [
34] removed small-sample bias from the calculation of the F statistic for fixed effects. Least squares marginal means were calculated for each
treatment ×
year combination, and years with significant differences (
p-value < 0.05) between control and treated groups were identified. Next, we calculated a standardized ring width index (RWI) for each year based on mean ring width during the 9-year pre-ice storm growth period. This removed the excess variation in growth and other changes that might result from aging or tree size. These unit-less RWI’s represent a ratio of the observed to the expected values based on the null conditions of annual ring growth (after [
35]). Median inter-tree correlations in RWI were r = 0.197 and r = 0.186 for control and rehabilitated trees, respectively.
We again compared differences in RWI between treatment groups using a linear mixed model with a first order autoregressive covariance structure, and as a function of
treatment group,
year, and
year ×
treatment. Least squares means and percent change were used to compare the relative magnitude of growth between the treatment and control groups (
Table 2). Time series plots displaying least squares means estimates and standard error of ring width and RWI by year were obtained.
2.4. Ranger School Data Analysis
As a first step we explored whether the 1974 thinning treatments at Ranger School still influenced the growth of trees within the four thinning plots. For this, we used a 10-year period before the defoliation to represent relatively undisrupted growth within plots. By summarizing annual tree-ring widths and doubling that value we could get the total change in diameter. Then, subtracting that value from the known DBH in 2012, we used general linear models to test for differences in tree growth between thinning plots, and modeled the change in diameter as a function of the post-thinning relative stand density. Because the 42% relative density plot displayed significantly different growth for 1995 through 2005 compared with the other three plots, we developed four individual equations with different intercepts but common slopes. They indicated that trees within the 42% relative density plot grew significantly better than others during the 10-year period prior to the defoliation, with no significant difference between the 61%, 71%, and 96% plots (
Table 3). Therefore, we designated trees on the 42% plot as Group 1 to represented a treated condition for the statistical analyses, and pooled data from the 61%, 71%, and 96% plots into Group 2 to serve as a control. That allowed us to compare post-defoliation growth responses between trees with different levels of radial increment.
2.5. Testing for Defoliation Effects
We stratified the data for each site into three defoliation periods: (1) a four-year pre-defoliation period; (2) a during-defoliation period lasting three years for Ranger School (2005–2007), and two years for Taylor Creek (2004–2005); and (3) a four-year post-defoliation period. A linear mixed model was used to predict RWI as a function of site, treatment, and defoliation period. We included a first-order autoregressive covariance structure to account for the repeated measures within trees over time periods.
4. Discussion
Our study assessed responses among sugar maple trees of upper-canopy positions that managers would favor as residuals when doing a crown thinning or post-disturbance rehabilitation in even-aged northern hardwood stands. Generally, these trees have large crowns, high vigor, and better diameter growth than ones of lesser canopy positions (27). Past studies showed that growth rates of such trees decreased appreciably after damage from ice loading and/or defoliation by forest tent caterpillar. Then, the crowns rebuilt or refoliated, and growth rates eventually recovered [
4,
6,
8,
21,
23]. Primarily, we wanted to know how soon the growth increased after crown damage by ice loading and/or defoliation by forest tent caterpillar, and how long the rates remained depressed before reaching pre-damage levels. Further, since we used plots left at different levels relative density following past cutting treatments, we could also assess whether trees on plots of lower residual densities responded differently from others after either or both kinds of crown disturbance. Findings from the research address those questions.
4.1. Taylor Creek after the Ice Storm
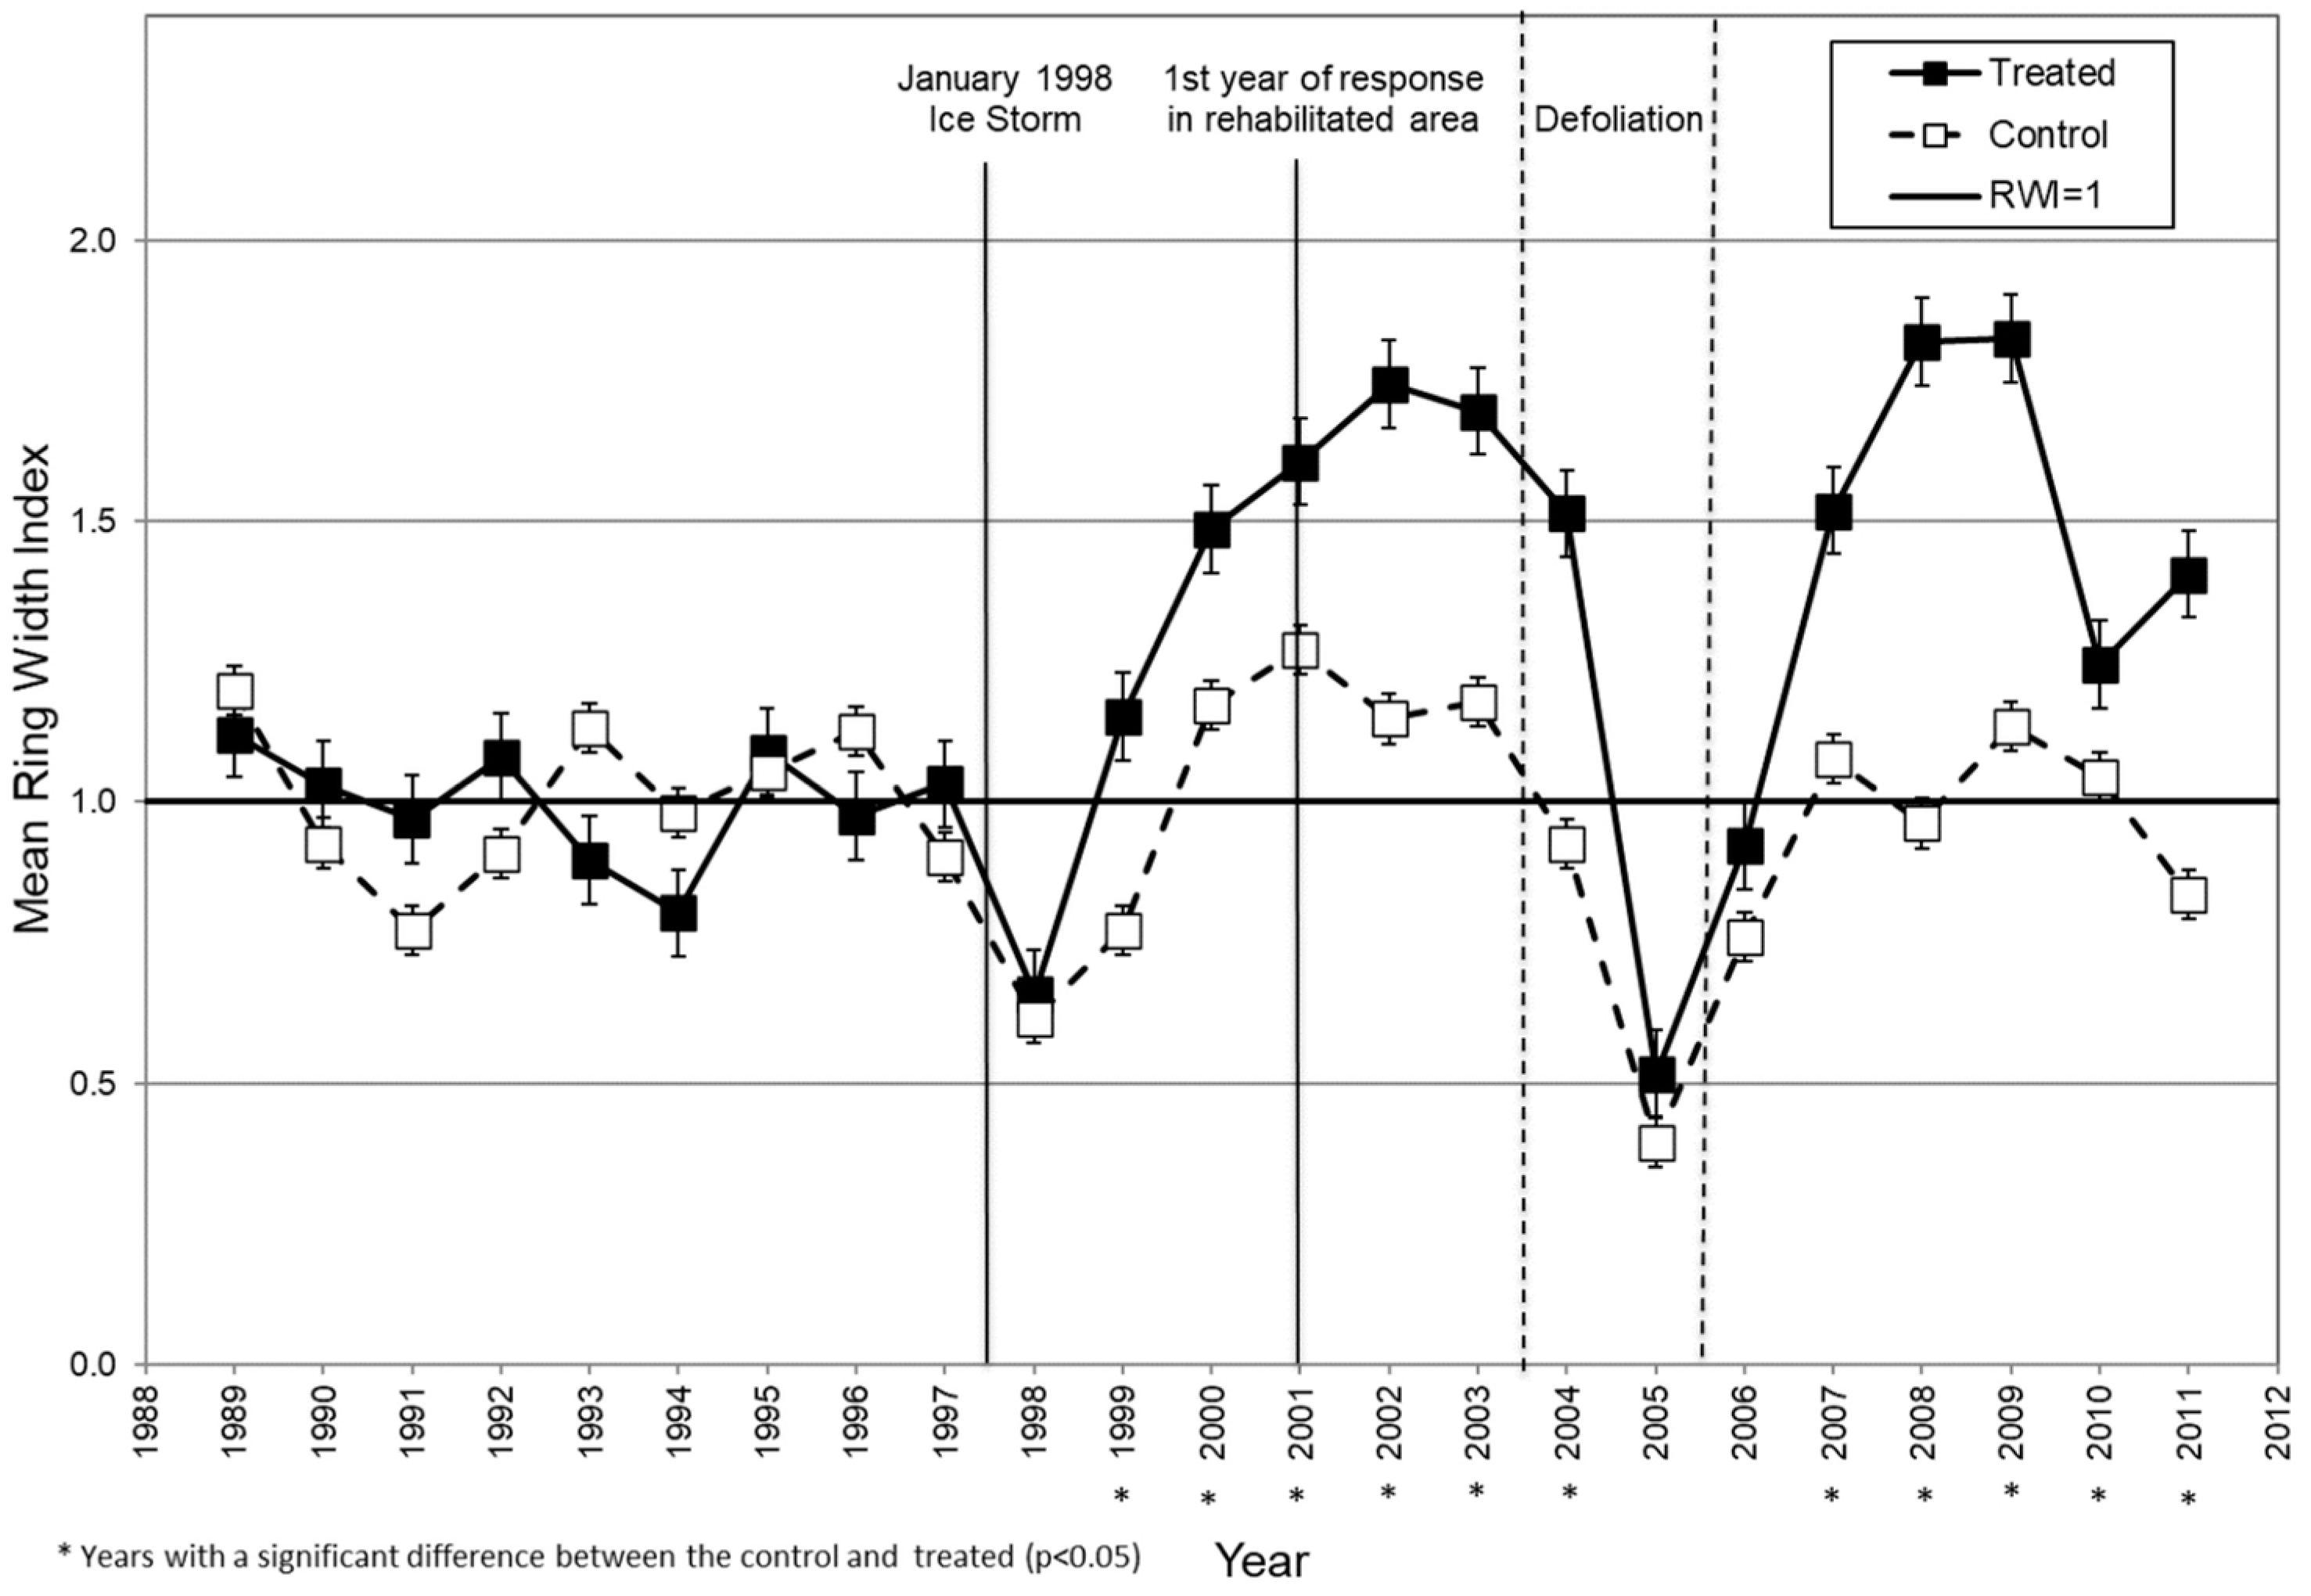
Mean tree-ring widths differed significantly between the control and treatment trees during four of the nine years prior to the ice storm (
Table 2,
Figure 3). Yet, both groups showed the same general growth pattern during that time (
Figure 3). The significant difference in pre-storm growth between control and treated trees at Taylor Creek might result from sample tree selection. Residual trees left at 7.6–10.7 m spacing in the treated area had been vigorous ones in upper canopy positions, while we randomly chose control trees only for similar diameters. These likely included trees with similar crown damage, but some of more average vigor and lesser growth potential. Even so, using RWI allowed us to standardize the growth response and account for differences in pre-storm growth rates between the treated and control trees (
Figure 4).
As reported earlier [
8], trees in the rehabilitation plots reduced to 40–45% relative density increased more in diameter than ones in the control area during the years following the ice-storm. This response was also observed among both measured tree-ring widths and RWI’s for the years 1999 and 2000 (
Figure 3 and
Figure 4). It likely reflects a higher vigor and seemingly greater potential for recovery among trees released by the rehabilitation treatment. Standardizing growth using RWI did not appear to dampen this selection bias.
For two growing seasons after the ice storm, control trees had lower than average radial growth than during the two previous years (
Figure 3 and
Figure 4). This supports earlier findings [
23,
36] about effects of crown loss on growth. Radial growth of control trees returned to pre-storm levels by the third year, and treated trees exceeded the pre-storm rates. Similarly, growth of sugar maples in Quebec recovered to some degree within six years after the 1998 ice storm [
6]. With our data, trees in the Taylor Creek rehabilitated area continued to increase in growth through the entire 10-year period, while that of control trees returned to around pre-storm rates.
4.2. Response to Forest Tent Caterpillar Defoliation Event
Radial growth during the first full growing season after defoliation (i.e., 2006) did not differ significantly between the control and released trees at Taylor Creek, suggesting that carbohydrate reserves remained adequate for crown recovery and radial growth. By the second year (i.e., 2007), control trees grew at pre-defoliation rates, while released trees grew better than before defoliation (
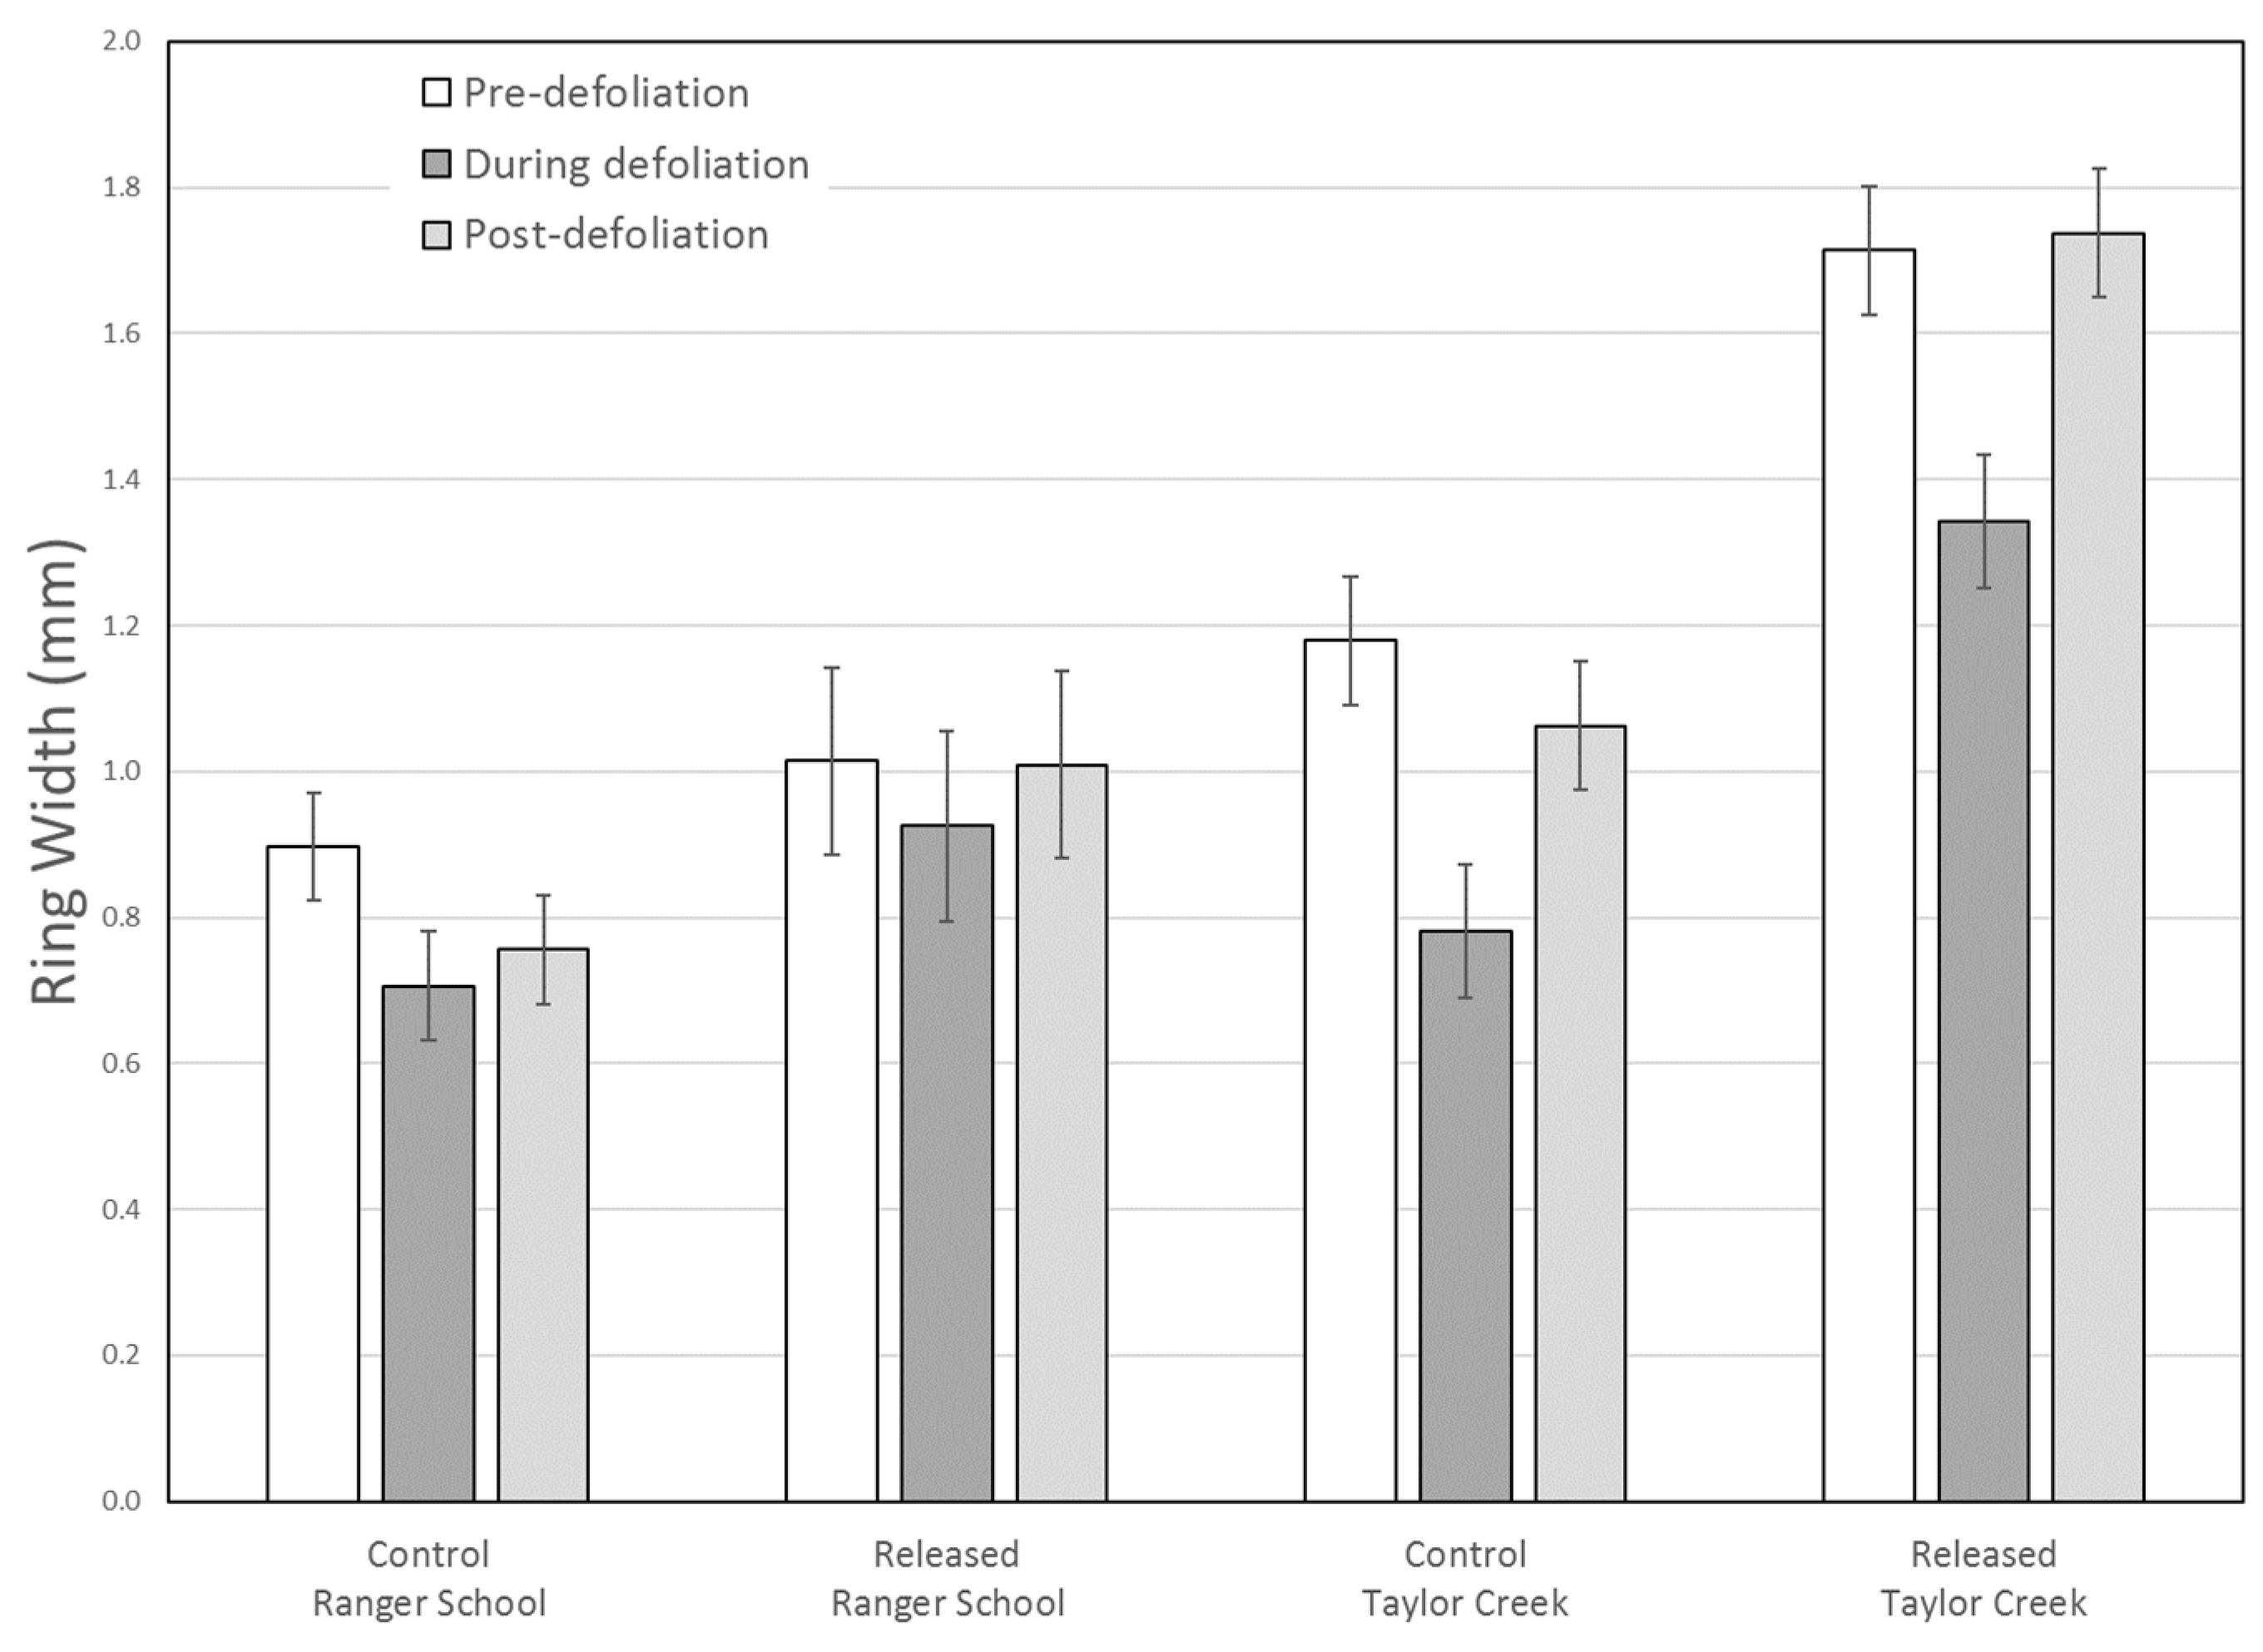
Figure 4). The second crown disturbance at Taylor Creek had a greater impact than a defoliation alone at Ranger School (
Figure 6), with overall radial growth during the defoliation event showing a greater decline at Taylor Creek. Yet, growth recovered at both sites during the four-year post-defoliation period, with treated trees responding slightly better than control trees (
Figure 6).
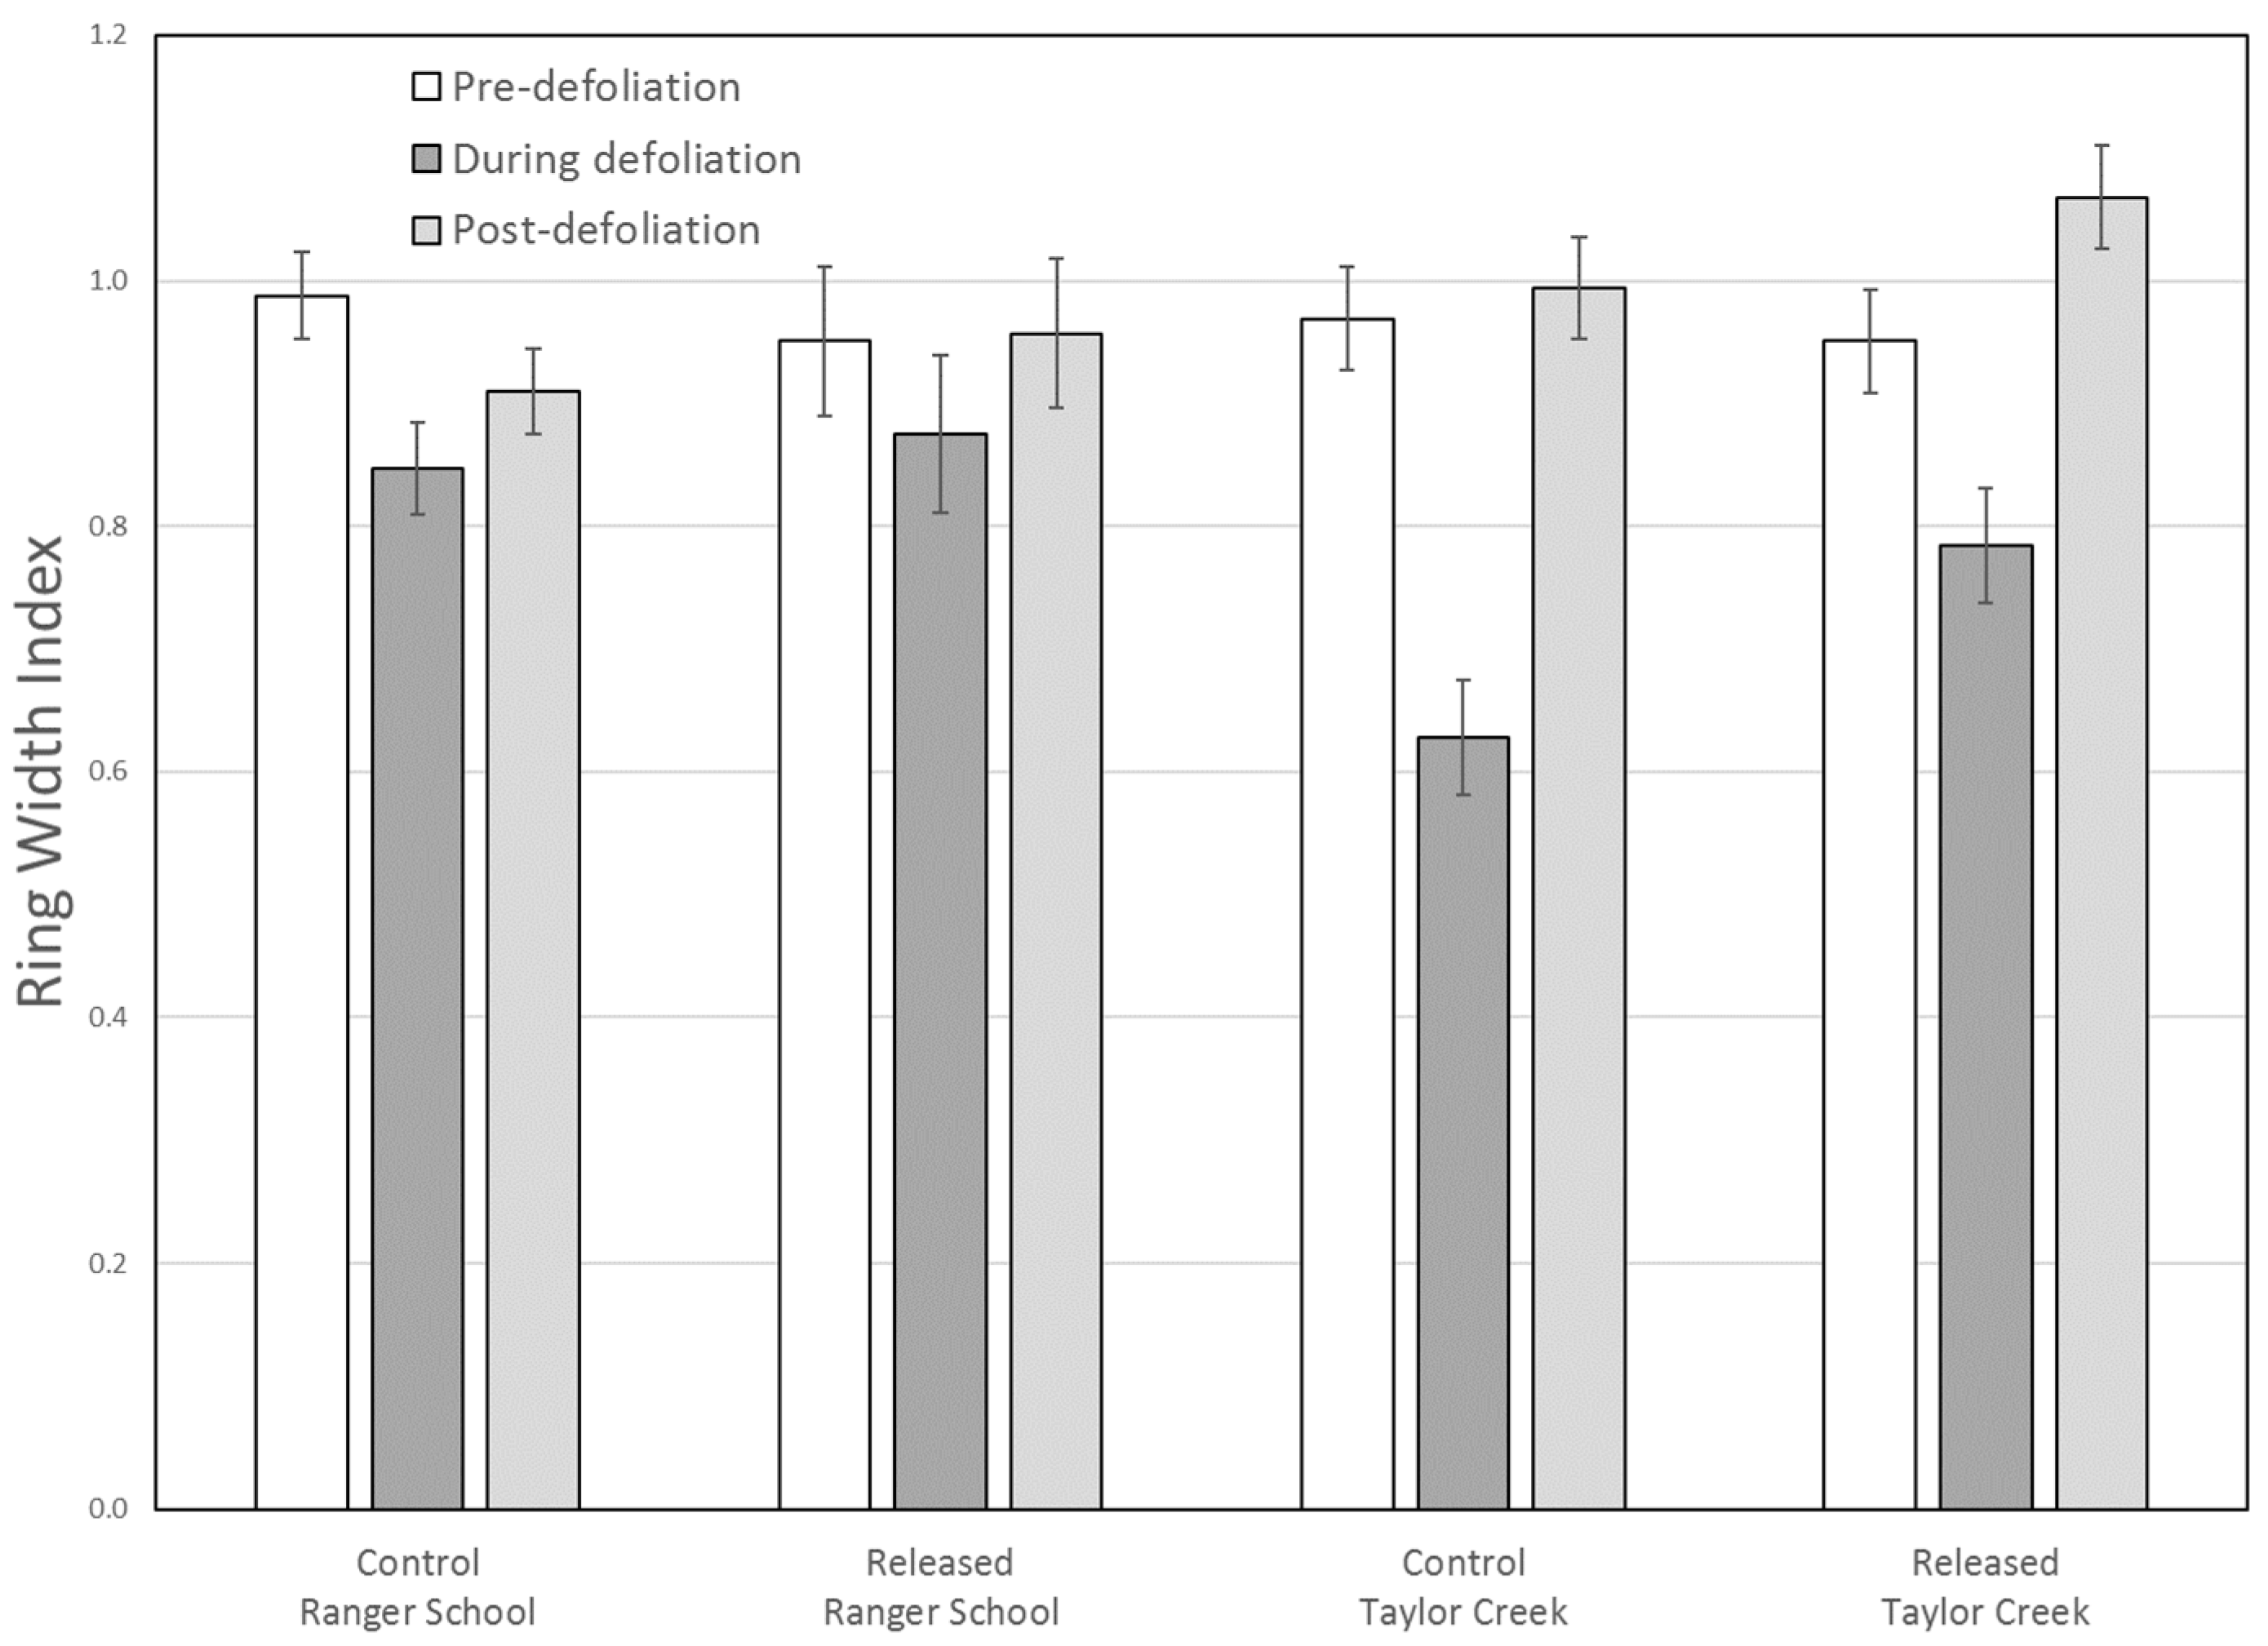
RWI revealed that growth of control (Group 2 at Ranger School) trees decreased more due to defoliation as compared to treated (Group 1 at Ranger School) trees at both sites (
Figure 7). At Taylor Creek, ring width and RWI data both showed radial growth in control trees was more severely impacted during defoliation as compared to released trees. For the treated trees, mean RWI after defoliation was 12% higher (non-significant) than pre-defoliation levels, suggesting a prompt recovery after a second crown disturbance, as well as a lasting effect of the 2000 release treatment.
At Ranger School, the mean ring width for the plots initially thinned to 60% or higher relative density (Group 2) decreased significantly during defoliation, with a modest (non-significant) increase afterward. For the trees in plot initially thinned to 45% relative density (Group 1), both the ring width and RWI analyses showed no significant difference in mean growth rates during any of the time periods evaluated, although there was a modest decrease during the defoliation years. This suggests that the forest tent caterpillar defoliation did not significantly alter the average growth rate of trees in the 42% relative density plot.
Due to the great variability in tree-ring widths between sample trees, the standardized RWI may better represent overall trends, independent of site. Our data revealed a significant difference in the average growth rates between the Group 1 and Group 2 trees at Ranger School only during the defoliation period, with Group 1 trees growing faster during that time. Growth decreased significantly among both groups from the pre- to the during-defoliation periods, and then increased significantly after defoliation. Neither groups of trees had significantly different mean RWI values between pre- and post-defoliation periods, indicating that sugar maple trees recovered within a relatively short time, consistent with findings from an earlier forest tent caterpillar outbreak at Ranger School [
37].
Our analyses did not specifically test for possible effects from the shortfall in growing season precipitation during 2006. Yet, neither the annual ring widths nor information from the ring width index analysis reflects any depression of diameter growth during that year. We did find a growth depression in the Taylor Creek control area during 2008, with growth increasing again during 2009. We cannot explain it. Growing season precipitation during 2008 exceeded the monthly average. Perhaps the single-year reduction resulted from an undetected error in field measurement or the ring width assessment.
Sugar maple borer also affected both stands, causing scars within 5 m of the ground on 19% of the sample trees in the rehabilitated plots, and 31% in the untreated area at Taylor Creek. Within both sets of plots, the average 24-year total radial increment did not differ significantly between trees with and lacking sugar maple borer scars. At Ranger School, an average of 10 % of Group 1 sample trees and 12% of those in Group 2 had sugar maple borer scars, but available data do not indicate what specific trees had scars. Therefore, we could not test for possible effects on growth rates between trees having or lacking scars. Yet, unlike a bark beetle infestation that destroys several sizeable areas or patches of the cambium, the gallery of a sugar maple borer is usually nearly vertical [
13]. Based on that characteristic, and the lack of significant differences in growth between trees with and lacking scars at Taylor Creek, it seems unlikely that a sugar maple borer injury would have affected the radial increment at Ranger School in a demonstrable way.
Overall, findings indicate that the growth of sugar maple trees at Taylor Creek recovered within one year after both damage by ice loading and the later defoliation by forest tent caterpillar, reflecting the overall effects of refoliation reported earlier [
8,
21]. In addition, trees in the lower-density rehabilitated plot grew more rapidly than ones in the untreated control area. At Ranger School, growth also rebounded within one year after defoliation, and trees in the plot thinned to 42% relative density 36 years earlier grew better than those in plots left at higher densities. Altogether, findings show the flexibility managers have for continuing the management of even-aged northern hardwood stands affected by similar kinds of disturbance.


