1. Introduction
University dropout is a big concern and a waste of resources for students, their families, schools, and society as well. High dropout rates (i.e., the percentage of students failing to complete studies) are on the agenda of many countries, including European countries [
1].
Since the last decade of the 20th century, the enrolment of young adults in the field of forestry has decreased in many countries (USA [
2], UK [
3]). The university education in forestry currently integrates knowledge from different sciences, as well as technical and self-directed skills. The number of competencies identified in forestry ranges from 48 [
4] to 65 [
5] or 73 [
6]. In addition to the diversity of expertise, the need for curriculum flexibility should also be considered [
7]. Expanding the forestry curricula with new courses, such as those which have an interdisciplinary approach, require students to improve their communication skills and expose them to work outdoors. Therefore, training for the forestry profession is complex and puts considerable pressure on students and their learning activities. A survey conducted on students enrolled in forestry and related natural resource degree programs on five continents shows that the main factors that contribute to hesitancy in their enrollment decision include minimal exposure to forestry and related natural resource issues during high school, a negative image of the forestry field, and gender to those who are female [
8]. These recent findings support earlier results obtained in US forestry schools, which show that female students report their own gender, work locations, and work conditions as causing more hesitancy to enroll compared to their male peers [
2]. The academic dropout and the low levels of attainment increase the importance of keeping students in university.
There are many factors that influence university dropout. For example, students from families with higher socioeconomic status are less likely to drop out of university in the UK [
9]. Low socioeconomic status is associated with the tendency of students to enroll part-time. A study carried out in Italy shows that students who participate less in the courses, such as those who work full-time or part-time, and older students have a higher probability of withdrawing from their courses [
10]. Moreover, parental education is more important than parental employment or financial status when determining access to higher education [
9].
A recent study in Spain shows that female students have a higher chance of continuing with their studies and achieving better academic performance than their male peers in most cases [
11]. However, there are reports indicating that female students have a higher dropout rate than their male peers in Norwegian and Italian universities [
10,
12]. Nevertheless, a study on the non-forestry students in US universities reveals female students’ positive perception of forestry but a low interest in pursuing the forestry profession [
2,
13].
The number of students that drop out has been directly correlated with the number of students from rural areas in a Romanian university [
14], while findings in Thailand show that the greater the distance between the university and the student’s family residence, the higher the risk of dropping out. An increased risk of dropping out may also be influenced by the cumulative effect of low entry grades and living away from family [
15].
Low pre-entry grades, particularly grades less than or equal to 7 in the Baccalaureate exam, and poor prerequisites are factors that increase the dropout rate in several European countries, including Romania [
14,
16]. Graduating from high schools with science academic programs and higher achievement scores reduces the dropout risk, while graduating from non-science academic programs is more likely to trigger students’ dropout [
10].
The dropout rate is higher for undergraduate freshmen than for students in subsequent years in Spain [
11]. A similar study in Germany considers the first year of study as a critical transition year [
17]. The upper limit of prolonged adolescence, 24 years, is the conventional limit of students’ attendance age as regards undergraduate programs. Traits of adolescence, such as low self-control and the desire to have a very active social life [
18], add to the learning pressure, thus increasing the likelihood of dropping out of university studies.
Higher levels of intrinsic motivation, students’ confidence in personal abilities, self-perception of competencies, and school performance expectation have been suggested as negative predictors of the dropout intention [
19,
20]. A study of freshmen in German universities [
17] emphasizes the importance of anxiety for undergraduate students and its strong relation with dropout intention, but no specific relationships between academic emotions and students’ achievement were revealed. A higher dropout rate occurs when students experience multiple risks [
15]. Thus, dropout appears to be a major concern for universities in many countries, and the most common criteria used for its analysis are gender, socioeconomic status, pre-entry grades, residence areas, and study year.
1.1. Research Context
In Romania, the percentage of early leavers from higher education was as high as 15.3% of the population aged 18–24 in 2019. For the same year, Romania has one of the lowest rates in Europe (25.8%) for completion of tertiary education in the population aged 30–34 [
21]. In 2017, the number of graduates relative to enrolments was 87.4% in the field of agriculture, forestry, fish farming and veterinary sciences [
22]. However, the percentage of early leavers may vary between study fields and universities.
In Romanian universities, undergraduate students in forestry are enrolled for a period of four years. The admission system is based on the numerus clausus principle, i.e., the number of entrants admissible to each study program is limited, and the candidates are enrolled in descending order of grades obtained at the Baccalaureate exam, which is the Romanian high school graduation exam. Candidates may have a very different academic background, including fields not directly related to forestry. Forestry degree programs do not attract only students with high pre-entry grades; therefore, some students have an admission GPA below seven, on a scale from 1 to 10, in which 6 is the minimum passing grade for the Baccalaureate exam. Such conditions enhance the heterogeneity of students’ communities and increase the risk of dropping out.
There are nine universities that currently offer forestry study programs in Romania. The Transilvania University of Brasov (UNITBV) has the largest and oldest school of forestry in the country, being the only higher education institution that offered forestry study programs for nearly four decades (1953‒1990). Since the early 1990s, in post-socialist Romania, eight state and private universities have diversified their educational offer by including forestry study programs. However, UNITBV remains the main forestry higher education institution in terms of the number of students and diversity of forestry degree programs (e.g., forest management, forest engineering). It has the highest academic standards according to the latest national ranking and has students from all over the country.
1.2. Theoretical Framework
Tinto’s persistence model (1997) and Ryan and Deci’s self-determination model [
19,
23] are considered the reference models to explain dropout [
24]. Tinto’s model considers internal and external interconnected factors and includes: (i) students’ pre-entry attributes related to family background, skills and abilities, and prior schooling; (ii) students’ goals/commitments showing that intentions and external commitments have a significant influence on institutional commitments of the students; (iii) institutional experiences with their direct and indirect effects on the student’s retention; and (iv) academic and social integration of the student. Based on this complex model, we used presumed factors closer to early dropout: individual attributes (gender, age), family background (SES index, residence), prior schooling (students’ high schools), and skills and abilities (admission GPA). Tinto’s model does not include contributions to the motivation theory and, as a consequence, we also used the self-determination theory. According to this theory, students who persist are actively engaged in educational activities, interested in learning, confident in their personal capabilities, and valuing education [
23].
In connection with their study program, students may experience negative emotions, such as anxiety, boredom, hopelessness, and shame, and positive emotions as enjoyment, hope and pride [
25]. The control-value theory [
26] assumes that the achievement emotions influence students’ academic engagement and performance, and the relationship becomes reciprocal, academic engagement and performance influencing academic emotions. The control-value theory explains students’ emotions by the valence associated with the task challenge: when the required skills are higher than the students’ skills and students perceive the task as useful, they feel fear or anxiety; when the required skills are adequate to students’ skills and students perceive the task as useful, they feel enjoyment, hope, or pride. According to these theories, students and their academic environment are interconnected. Moreover, teachers’ expectations influence students’ learning motivation and achievements. Positive expectations of faculty influence students’ performance positively. This self-fulfilling prophecy is called the Pygmalion effect [
27]. Mixed theoretical models have been used in empirical studies and particularly in case studies [
24].
In the present study, we investigate early dropout intention in relation to individuals’ attributes (gender and age), family background (socio-economic status and residence), and motivational aspects, such as perceived competence, performance expectancy, and barriers to completion of studies.
1.3. Hypotheses Development
A set of hypotheses has been elaborated to test for differences related to students’ gender, family socioeconomic status, urban or rural residence, high school academic programs, admission GPA, and the number of risk sources, in line with the previous studies mentioned above.
The socioeconomic status (SES), particularly parental education, is considered a major dropout factor [
1]. Thus, we explored the association of socioeconomic status with the main explored variables.
Hypothesis 1 (H1). The students’ socioeconomic status and parental education are negatively associated with the dropout intention and the perceived barriers regarding the completion of university studies (H1a), and positively with the GPA admission, the relationships with high school teachers, the self-perception of competencies, and with academic performance expectancy (H1b).
There are contradictory results regarding gender differences in relation to dropping out ([
10] vs. [
9]). We hypothesize:
Hypothesis 2 (H2). Male students have a higher intention to drop out than female students (H2a), and they perceive more obstacles in the completion of studies (H2b). Female students have higher scores on the self-perception of competence and on performance expectancy (H2c), and they report better relationships with high school teachers (H2d) and have higher GPAs when admitted than their male peers (H2e).
Based on previous studies indicating a higher dropout among university students from rural areas than from urban areas [
14], we formulated the third hypothesis.
Hypothesis 3 (H3). Students from rural areas have a higher dropout intention (H3a), and they report more barriers regarding the completion of studies (H3b), have lower scores on the self-perception of competence and performance expectancy (H3c), report unfavorable relationships with high school teachers (H3d), and have lower admission GPA (H3e) compared with students from urban areas. Students from families who reside at a greater distance from the university have a higher dropout intention compared to students whose families’ residence is closer to the university (H3f).
Some studies [
14] indicate that low high school GPA is an indicator of students’ dropout. This relationship was tested in H4.
Hypothesis 4 (H4). Students with an admission GPA lower than or equal to seven have a higher dropout intention than students with a GPA higher than seven (H4a), and they perceive more barriers to the completion of studies (H4b). Moreover, the self-perception of competence, performance expectancy (H4c), and the relationships with high school teachers are higher in the group of students with an admission GPA over seven (H4d).
Considering the effect of academic vulnerability and the proximity to students’ family residence [
15], we have added:
There is an interaction between the proximity to the students’ family residence and the admission GPA as regards the dropout intention (H4e).
With regard to the role of pre-entry qualifications ([
10] vs. [
28]), we assume that:
Hypothesis 5 (H5). Freshmen from high schools with non-science academic programs have a higher dropout intention (H5a), perceive more barriers to the completion of studies (H5b), and have lower scores on the self-perception of competence and lower performance expectancy (H5c). The freshmen from high schools with non-science academic programs have unfavorable relationships with high school teachers (H5d) and lower admission GPAs (H5e) compared with freshmen from high schools with science academic programs.
Assuming students’ vulnerability is connected to the different risk sources [
15], we hypothesize:
Hypothesis 6 (H6). Students thatexperience multiple risk factors have a higher dropout intention in comparison with those who haveno or only one risk source.
Gender, age, residence, family background, aspects of intrinsic motivation, expectations, the perception of future performance, and the perceived abilities are factors that influence dropout [
19,
29]. As a consequence, we assume that:
Hypothesis 7 (H7). Gender, admission GPA, urban, or rural residence, university proximity to the family residence, family SES, self-perceived competence, perceived barriers to the completion of the studies, and expectations concerning performance in the first year are predictors of early dropout intentions.
2. Materials and Methods
2.1. Participants
The sample population consists of 374 female and male undergraduate forestry students enrolled in the forestry study programs. The respondents were in the first two months of their study prior to failing any courses. The participants were only asked about females and males because in Romania the non-binary identification is not commonly used. The sample is accidental, drawn randomly from the students who participated in courses in the week dedicated to data collection, in compliance with the norm of voluntary participation. The data were collected for three consecutive years (2017, 2018, and 2019, respectively).
2.2. Research Tool
Socio-demographic questions cover the student’s gender, age, and urban or rural residence, and parents’ education and occupation. The admission GPA, equal to the grades at the Baccalaureate exam, has also been collected. To measure other variables, we used common psychological tools.
The
Perceived Competence, a brief scale extracted from the Activity Feeling Scale [
30], and the School Performance Expectancy Scale [
20] has three items each, and high scores show good self-perception of one’s ability and high-performance expectation, respectively.
The tool
Intentions to persist in versus drop out [
20] has three items, and high scores show higher dropout intention.
The last three tools use a 7-point Likert-type scale that ranges from 1 (Strongly disagree) to 7 (Strongly agree). Alpha Cronbach coefficients are 0.83, 0.76, and 0.86, respectively.
- 4.
The Relationship between the student and teachers in high school (RST-HS) measures the perception of the education experience (i.e., ‘I felt appreciated by the teachers’). The items use a 5-point Likert-type scale that ranges from 1 (Almost never) to 5 (Almost always). Cronbach’s alpha is 0.84 for three items, and high scores show positive relationships.
- 5.
The
Barriers to completion Scale has 10 items (i.e., ‘
Insufficient high school knowledge’). The scale uses a 5-point Likert scale that ranges from 5 (
Very true for me) to 1 (
Not true for me). Cronbach’s alpha is 0.79, and high scores indicate a strong perception of the threats to the completion of studies. To develop this tool, we selected anxiety and boredom that are reported as frequently negative emotions in the higher education setting [
17,
25], and students’ non-academic responsibilities or priorities (internal factor), and financial and family difficulties (external factor). All Cronbach’s alpha coefficients are performed in our sample and range from acceptable to good.
An index for the families’ socioeconomic status (SES Index) was computed by summing the indicators of parental education and parental occupation status.
Based on the university proximity to the students’ pre-university residence, the participants were assigned to the groups: Close to family, which includes students from the county in which the university is located, as well as from adjacent counties, and Far from family, which includes students from other counties. The high school academic program was considered depending on curriculum similarities: science (Mathematics, Natural Sciences, and Forestry) and non-science (Technological, Philological, and Theological), with minimum exposure to forestry issues during the high school.
After identifying the sources of risk for all participants, they were grouped into three categories: students without risk of dropout, students with a single source of risk and students with two or more sources of risk. The last category includes students from rural areas, with GPAs under or equal to seven, with chronic diseases, and from vulnerable groups (e.g., orphans of one or both parents).
2.3. Procedure
Data were collected using a paper-and-pencil format two months after the beginning of the academic year. Participation was voluntary and unpaid, and all participants signed an informed consent form. The study was approved by the Ethics Committee of the University.
Statistical analyses were performed with SPSS version 26.0. The rate of non-responses was very low (see
Supplementary Material 1). The missing values were excluded from further analyses by using the pairwise deletion option of the SPSS software.
We used
t-tests for independent samples and effect size, the bifactorial ANOVA, the Pearson correlation, Cronbach’s alpha coefficient and hierarchical regression. The effect size (d’ Cohen), as the magnitude of the difference between the compared groups, allowed us to compare them regardless of the number of scale points and studies. Ref [
31] suggested the following benchmarks for the effect size: small (d = 0.2), medium (d = 0.5), and large (d = 0.8). The effect size, together with the level of significance size, helps interpret the data. When the effect size is large, the result has stronger practical implications. When the level of significance is higher than 0.05, but the effect size is small, the result has weak practical implications. The effect size was calculated with G* Power.
Cronbach’s alpha, a measure of the internal consistency (reliability) of a multi-item scale, shows whether the tool accurately measures the investigated variable. It ranges from 0 to 1, and its benchmarks range from acceptable (0.70–0.79), good (0.80–0.89) to excellent (0.90 and above) internal consistency.
3. Results
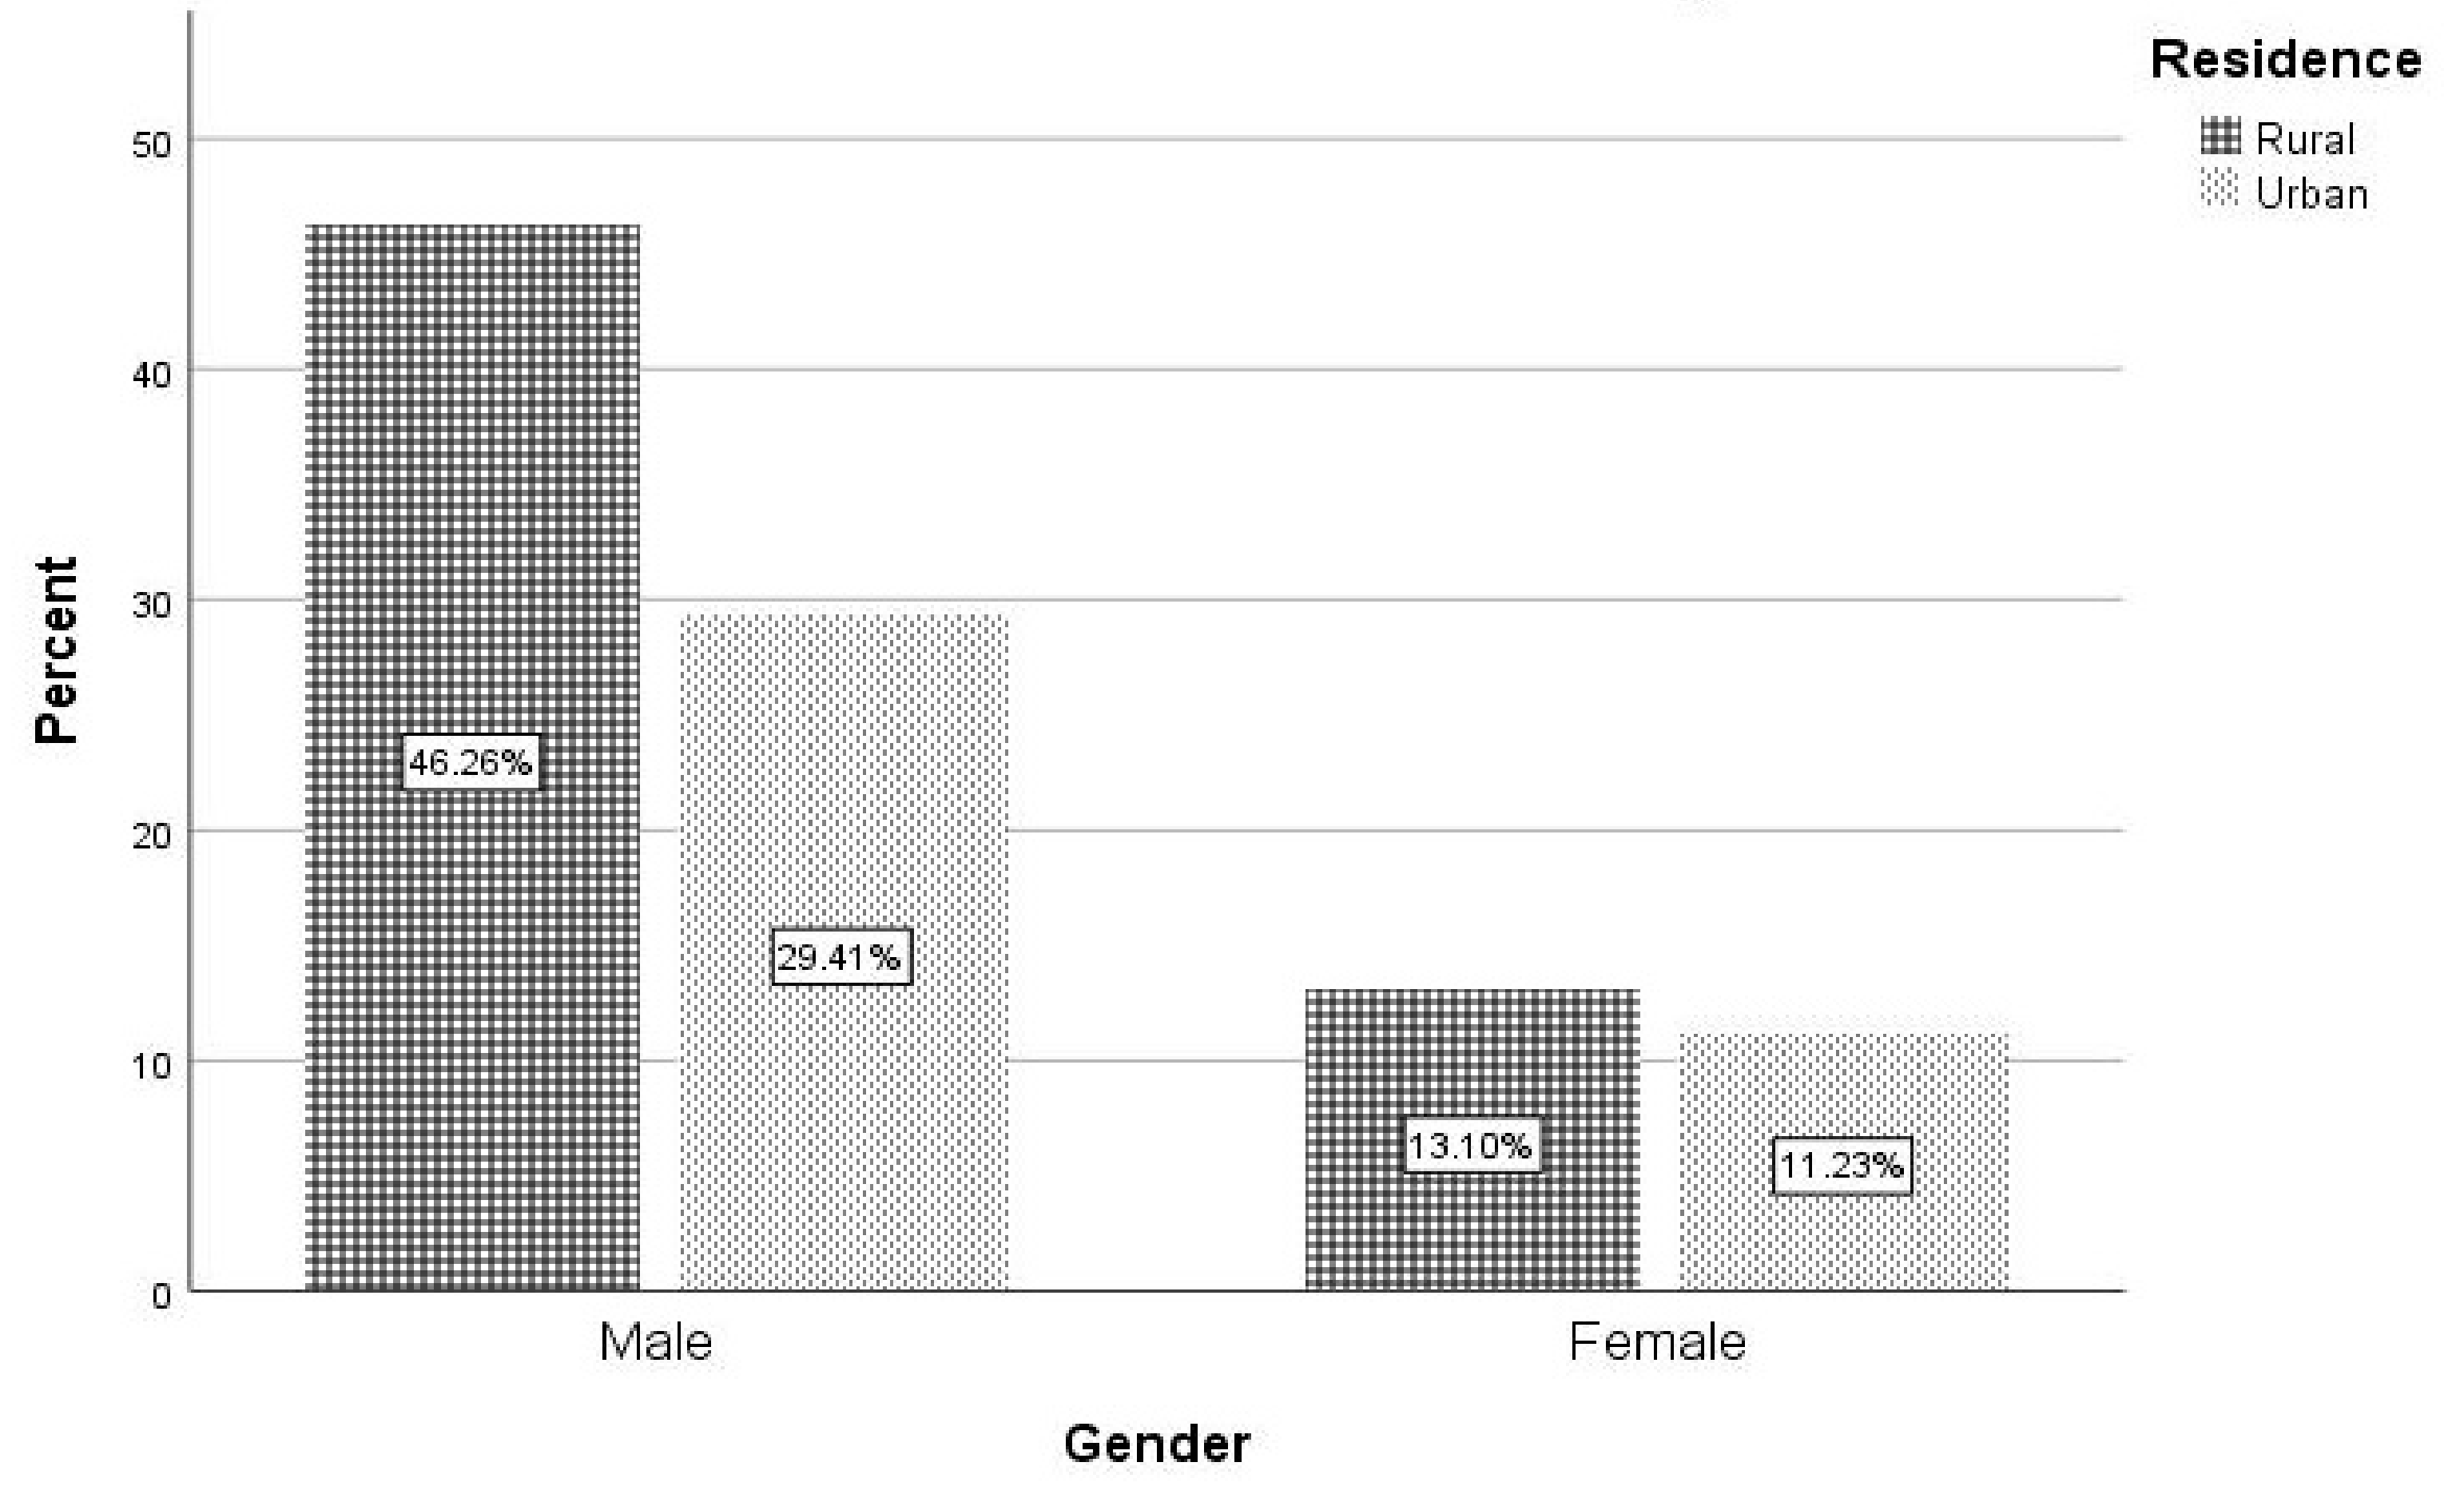
Male students were predominant in our sample and in the student population of the forestry school as a whole (75.7% and 77.0%, respectively). A similar pattern was observed for students from rural areas (59.4% and 55.2%, respectively) (
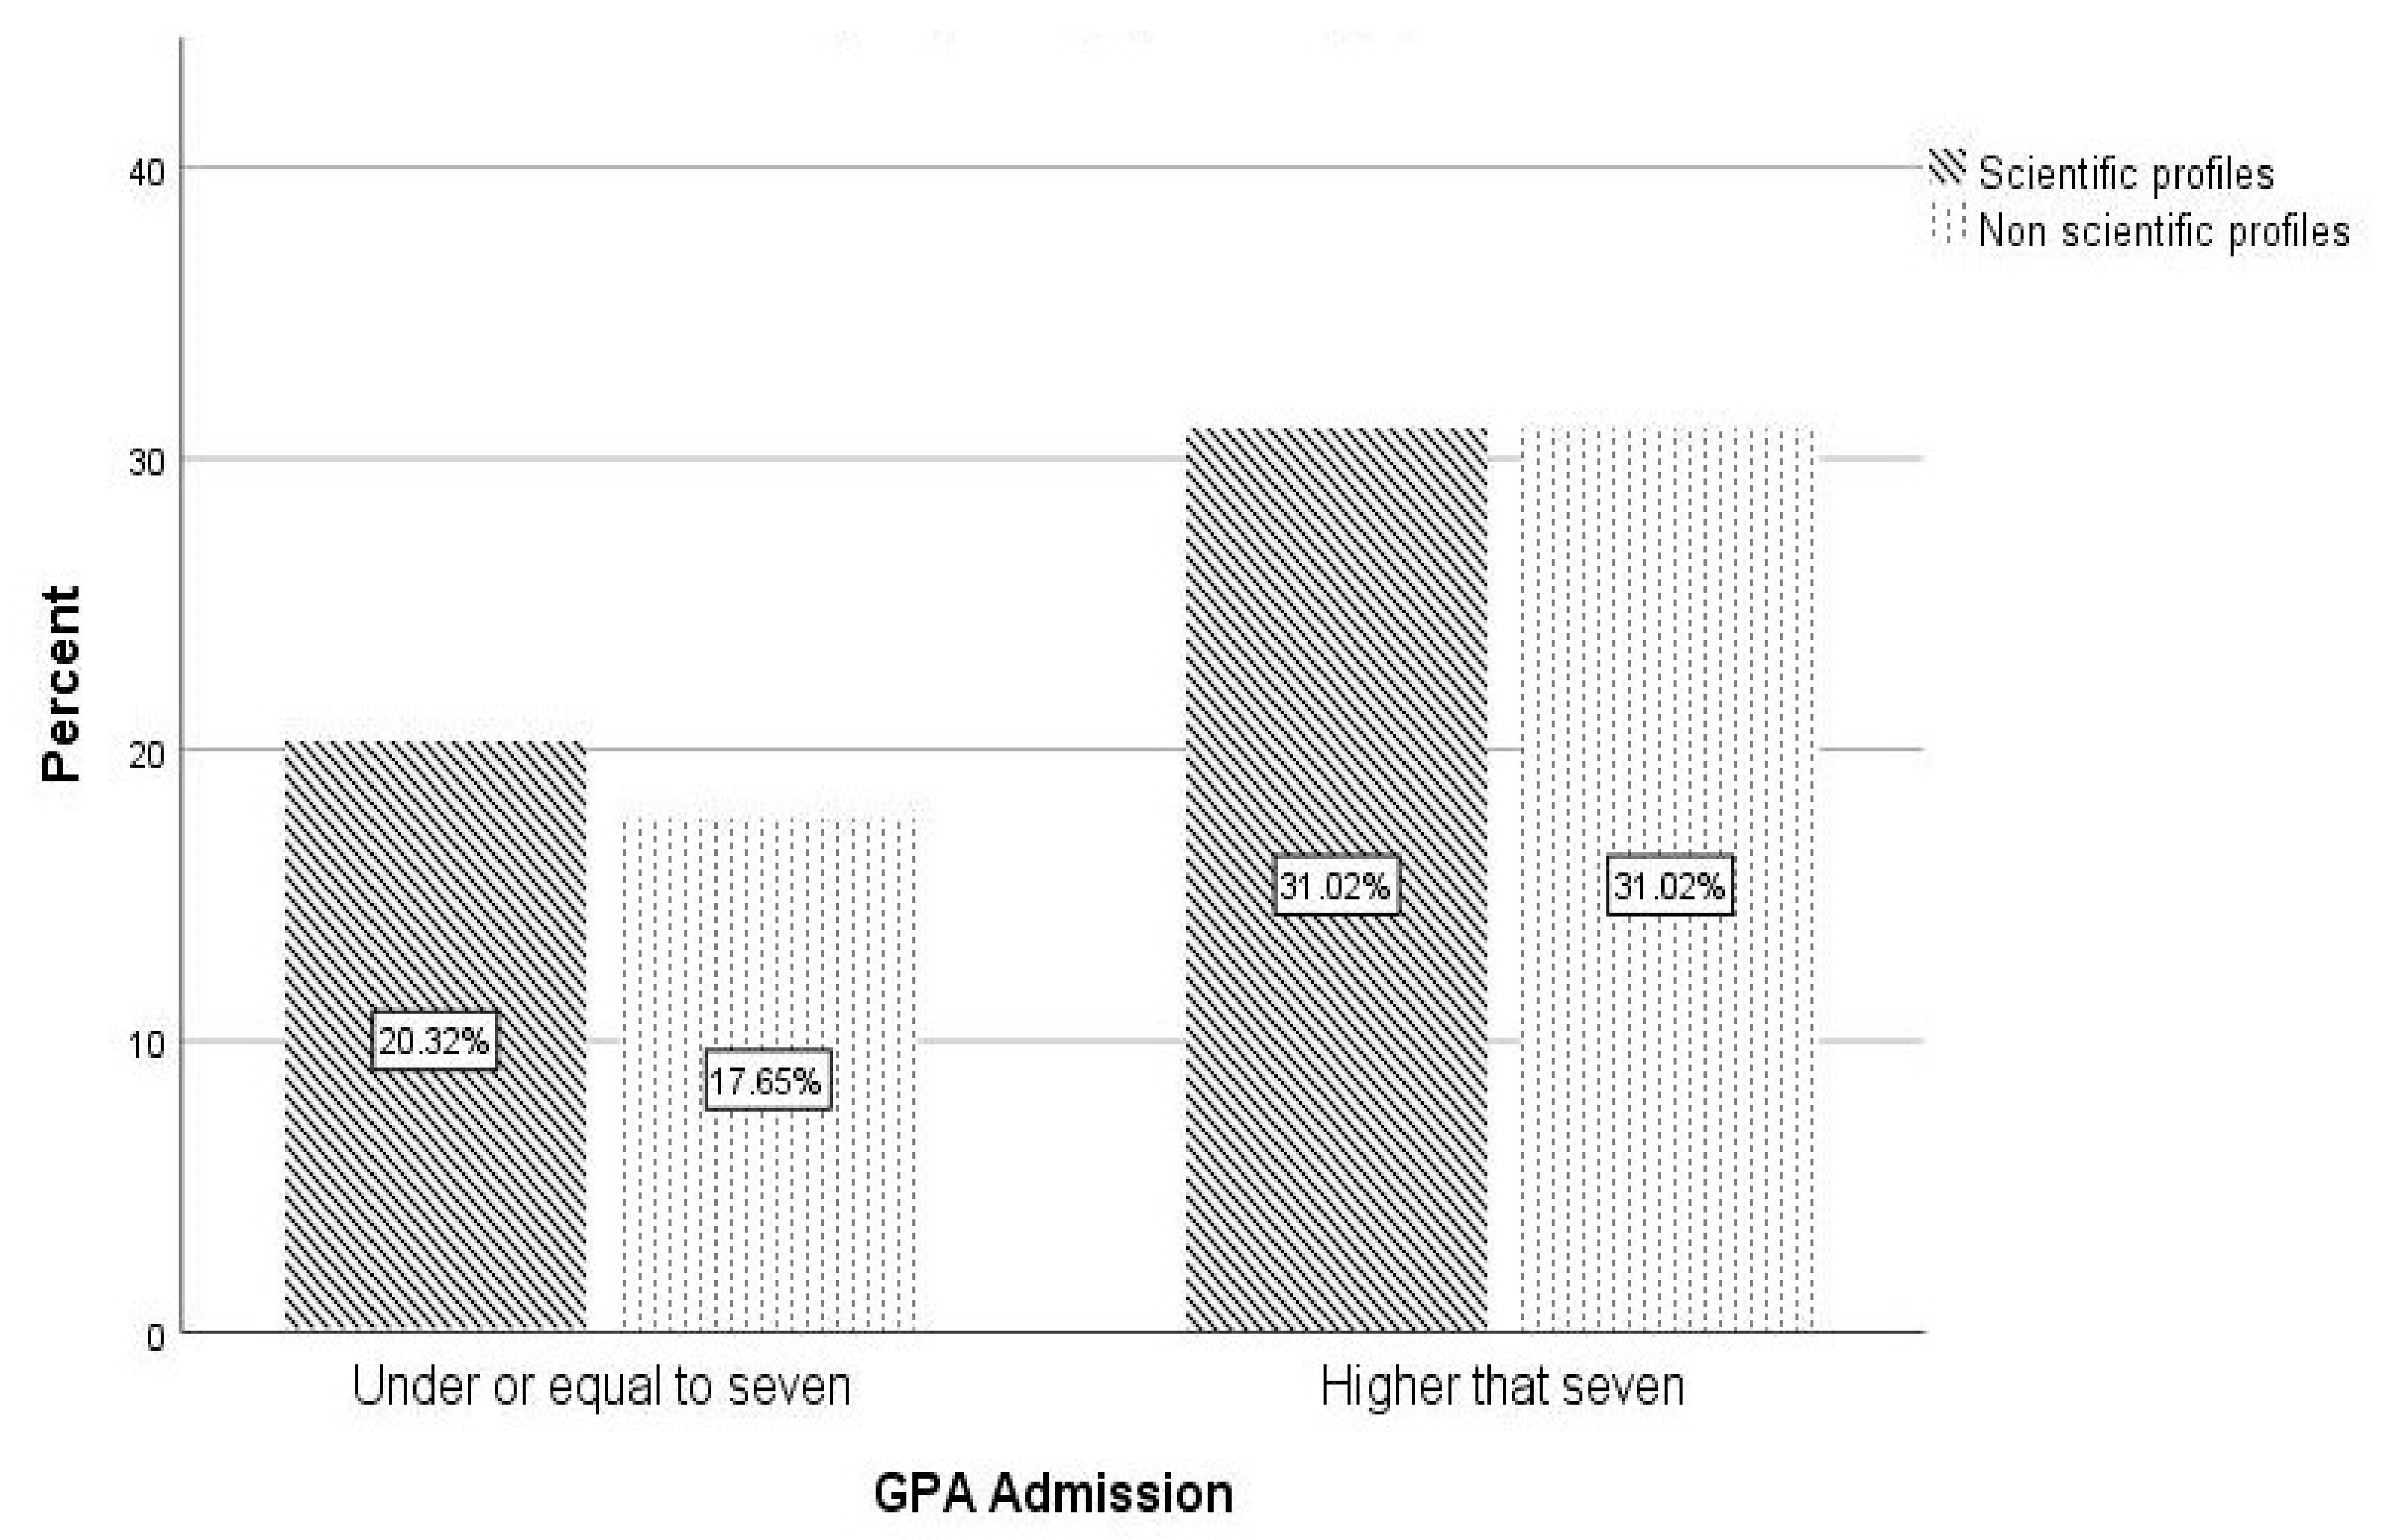
Figure 1). Ages ranged from 18 to 30 years, and the mean value was 19.1 (SD = 1.07). The mean value of the admission GPA in the Bachelor’s degree program was 7.38 (SD = 0.88), and students with an admission GPA higher than seven were 62% of the sampled population. The possible range of the admission GPA was 6–10, and the real admission GPA ranged between 6 and 9.68.
The percentage of students who attended high schools with science academic programs was 51.3, including Mathematics and Natural Sciences (35.6%) and Forestry (15.8%); non-science academic programs included Technological (25.1%) and Philological and Theological (23.5%) academic programs (
Figure 2). The group of students without dropout risk included 31% of participants, students with a single risk source made up 39%, and students with two or more risk sources were 29%. The group
Close to family included 52.7% of participants. The percentage of students whose fathers and mothers attended middle school only was 9.8 and 15, respectively. The percentage of students with fathers and mothers that graduated from high school was 69 and 57.2, respectively. The percentage of students with fathers and mothers having a university degree was 20.7 and 27.5, respectively. Other education levels were not applicable. The parents’ occupation status was as follows: 1. homemakers, unemployed (mothers 36.2% and fathers 15.3%); 2. traditional workers (mothers 22.6% and fathers 30.1%); 3. service and sales workers (mothers 19.5% and fathers 31.5%); 4. clerks and clerics (mothers 12.4% and fathers 9.4%); 5. intellectual occupations (mothers 8.2% and fathers 9.7%); and 6. business owners and managers (mothers 1.1% and fathers 4.0%). The mean value for the socioeconomic status was 9.58 (SD = 2.8). The possible range of the SES index was between 4 and 18, but the real range was 4–16.
Empirical results are listed considering the hypotheses order.
3.1. Family Socioeconomic Status
The participants whose family SES Index and parents’ education have lower levels reported a higher dropout intention (
Table 1). Participants whose parents’ education has higher levels perceived themselves as more competent in their first year at university and reported favorable relationships with high school teachers (
r = 0.124,
p < 0.05). We found no significant correlations between the family socioeconomic index and the main variables.
3.2. Gender-Related Differences
The self-perception of one’s own competence, performance expectancy, and admission GPA were higher for female students. The effect size was small or medium. In contrast, the dropout intention and the barriers to the completion of studies were higher for male students (
Table 2). There were differences between male and female students’ points of view regarding the barriers to the completion of studies (
Table 3). The items with the highest average score (M = 2.71) in the entire sample were
‘I’d rather already be on my own,’ ‘It scares me to see how much I have to learn,’ and ‘
Exams are too difficult.’ 3.3. Residence
Concerning the variables tested, there were no significant differences on whether students reside in rural or urban areas (H3a‒H3e). Students from families who live farther away from the university did not have a higher dropout intention compared with students whose families reside closer to the university (H4f) (
Table 4). Unexpectedly, the average score of the scale
Barriers to the completion of university studies was significantly higher for students whose families live closer to the university, and academic performance expectancy tended to be higher for the students whose families live far from the university. Thus, our hypothesis was not supported by data.
3.4. Pre-Entry High School Academic Programsand Admission GPA
No differences were detected between science and non-science high school academic programs concerning the dropout intention (H5a). Only the differences regarding the relationships with high school teachers were significant (Mscience = 8.97, SD = 3.88, Mnon-science = 7.05, SD = 3.42, t = 4.8, p = 0.001). Our data did not support the other parts of hypothesis H5.
The dropout intention, the barriers to the completion of studies and the relationships with high school teachers had higher scores for students with an average admission GPA lower than seven. Self-perception of abilities and expectations towards one’s own academic performance had higher scores for students with an average admission GPA higher than seven (
Table 5).
When testing the influence of the interaction between the proximity to family and the admission GPA with respect to the dropout intention (H4e), there was only one significant main effect between the admission GPA and the dropout intention (F = 7.004,
p = 0.008). The interaction of the two factors, admission GPA and the family’s proximity to the university, was not significant (
Table 6).
3.5. Multiple Risk Factors
Students who experience multiple risk factors did not have a higher dropout intention (H6). Students who do not experience any risk tended to have a higher socioeconomic status (t Games Howell = 2.18, sig = 0.077) and favorable relationships with high school teachers (t Games Howell = 2.12, p = 0.08) compared with their peers that experience a single risk source.
3.6. Dropout Intention as a Dependent Variable
To verify the association between dropout intention, family SES, admission GPA and the investigated aspects of motivation, Pearson correlations were performed (
Table 1). Based on these correlations, the hierarchical multiple regression was run to explain the dropout intention (H7). The values for R Square and models significance improved from the first to the third (R1
2 = 0.03, Fchange = 5.5,
p = 0.01; R2
2 = 0.05, Fchange = 6.13,
p = 0.013; and R3
2 = 0.341, Fchange = 64.04,
p = 0.001). The third model explained 34.1% of the total variance of the dropout intention. The independent variables that had the strongest influence on the dropout intention were the
barriers to completion (positive influence) and the
academic performance expectancy (negative influence). When the other four factors (gender, family SES, admission GPA, and academic performance expectancy) were controlled, the coefficient of determination was the highest for the barriers to the completion of studies that explains 15.3% (15.3 = 0.391
2) (
Table 7). Family socioeconomic status is significant if we consider the choice of independent variables not random, and the test implies a bilateral hypothesis. The significance test of the unilateral hypothesis was
p < 0.05 (0.078/2 = 0.039).
4. Discussion
The dropout intention of undergraduate freshmen in forestry was examined by using a quantitative approach. The early identification of students who intend to drop out is of high importance for students, university administrations, and society because such knowledge is very useful for the adoption of preventive measures. In contrast to other studies, we found that the perceived barriers to the completion of studies that are focused on students’ emotions, attitudes, and some external factors better explain the dropout intention than other variables investigated. As it is difficult to find a valid structure of the risk factors that fit every situation, the present study used a combination of educational persistence [
29], self-determination [
19], and control value theory [
26].
4.1. Family Socioeconomic Status
Low family income remains a predictor of dropout because students may experience financial difficulties due to living costs or tuition fees. In our sample, students from disadvantaged families had a higher dropout intention, while those from well-off families had higher academic performance expectancy. Family socioeconomic status negatively correlates with dropout intention, which is in line with previous studies [
1]. A common explanation is that family is the main source of financial support for students during their studies [
16].
Students whose parents have lower levels of education report a higher dropout intention and do not perceive themselves as more competent in their first year of education, as also reported by [
9]. The university environment may be unfamiliar for these students, and they may feel under pressure because of financial or social constraints [
16]. The positive correlation between parental education levels and self-perceived competencies and the negative correlation with dropout intention may be explained by the benefits of social and human capital and by the scarcity of family financial capital, respectively. Students from families with a lower socioeconomic index do not have a low admission GPA and report positive relationships with high school teachers. Students originating from socioeconomically disadvantaged families may show high academic performances and are likely to be motivated by exceeding their own family status. In these cases, the various forms of financial support received from the university may supplement family resources.
4.2. Gender Differences
In forestry education, women are underrepresented, the gender imbalance between men and women being a long-standing feature of the field [
32]. There is no clear dropout pattern that is gender-related, based on the review of literature. In our study, male students showed a higher dropout intention than female students, and they perceived more barriers to the completion of the forestry degree program. This result is not consistent with findings showing a very similar probability of dropping out for male and female students [
10,
12]. However, there are studies similar to ours that show a higher intention to continue with studies in Bachelor’s programs for female students [
11]. The appeal of the high occupational status of male-dominated programs and the value given to them by female students may be an explanation [
16]. Additionally, parents may act as an example to be followed since 13% of the respondents’ fathers work in the field of forestry.
In line with the self-determination theory, female students in our study report more intrinsic motivational resources that can explain their higher average admission GPA: they showed higher self-perception of abilities and performance expectancy compared with their male classmates. Male students appear to be less motivated to complete their studies. An explanation may reside in the different perceptions of the barriers to the completion of studies as reported by previous studies [
12]. A similar result was found in our study: thus, the boredom with courses, the desire for fun, the anxiety produced by the difficulty in learning, and the negative attitude towards school are higher in the case of male students. In contrast, female students’ confidence in personal capabilities is higher, and they are more involved in learning activities, and, probably, the teachers’ high expectations may increase their learning motivation and achievement, as in the Pygmalion effect [
27].
A lower dropout intention and perception of fewer barriers to the completion of their studies can be interpreted as a positive perception of the field of forestry for female students and reveal their interest in becoming forestry professionals. On the other hand, the relatively low percentage of females enrolled in forestry degree programs (24.3% in our sample) may show a lower attraction of the adolescent female population for forestry or a greater hesitance to enroll. This result is in line with previous studies [
2,
8,
13].
4.3. Rural or Urban Residence and Proximity to University
The students originating in rural areas do not have a higher dropout intention, which is not consistent with a previous study carried out in Romania [
14]. Only the family socioeconomic status index is higher for students originating in urban areas. The above-cited study examines the real dropout at the end of the first university year and uses a heterogeneous sample.
In the present study, students from families that reside at a greater distance from the university do not have a higher dropout intention, although the students’ need for emotional support is highlighted [
5]. Our data do not support the hypothesis of a cumulative effect of academic vulnerability and family proximity on the dropout intention, as previously reported [
15]. An explanation may be that Romanian students can visit their families over the weekend as the travel costs are supported by the government. Therefore, the respondents can meet the need for family emotional support.
In our sample, the students who live far from their families perceive fewer obstacles to the completion of their studies and have a higher performance expectancy compared with students whose families reside closer to university. We postulate that when selecting a certain academic institution, students who move farther away from their families are more motivated because they accept living farther away from their family from the very beginning of their university studies.
4.4. Highschool Academic Programs and Admission GPA
We found that graduating from a high school with a science academic program does not reduce dropout intention compared to high schools with a non-science academic program; this result does not support previous findings [
10]. Students with low academic performance have higher scores on the dropout intention, which is consistent with previous results [
14,
15,
16]. Students who enrolled having grades higher than seven at the Baccalaureate exam perceive fewer obstacles in completing their studies; they are more confident in their own abilities and expect higher performance, as supported by the self-determination theory. These differences have stronger practical implications according to their effect size.
An unexpected result compared to previous studies carried out in other countries concerns the relationships with high school teachers, who are perceived as more unfavorably by students with higher grades. The academic pressure received by students with high grades from teachers and probably from parents might explain this finding.
4.5. Motivation
According to the self-determination theory, students who persist are actively engaged in educational activities, self-confident, and interested in learning [
19,
20]. Similarly, the respondents with higher perceived abilities and academic performance expectancy have a lower intention to drop out. Female students and students with an admission GPA higher than seven were persisting and were actively engaged in educational activities, self-confident, and interested in learning.
The perceived barriers to the completion of studies are higher for male students and for students with grades lower or equal to seven. They experience exam anxiety and anxiety to learning complex material; they get bored during classes and have a higher dropout intention. These students report a more significant lack of money and family difficulties. Their self-perception of competencies and of academic performance expectancy is lower compared to their peers who perceive fewer barriers to completion. Our findings are in line with Tinto’s interactional theory, which explains dropout as a result of internal and external factors, and with the self-determination theory (i.e., when internal resources are developed, the dropout intention is low [
19,
20]). According to the control-value theory, emotions (anxiety, boredom, frustration) are related to academic achievement [
25] and to dropout intention [
17]. Negative emotions diminish students’ attention, consume working memory, decrease learning motivation, and influence the choice of inefficient learning strategies [
25,
33].
4.6. Multiple Risk Factors
Students who experience multiple risk factors do not have a higher dropout intention compared to other studies [
9]. The only significant difference was regarding the relationships with high school teachers and the family SES as the group of students without any risk scored higher than the group of students with a single risk source, but the significance is marginal.
4.7. Factors That Explain the Dropout Intention
Both integration and motivational theories provide explanations for the student retention process [
20,
28]. The combined model we used moderately explains (34.1%) dropout intention, which is consistent with previous studies. In our sample, the barriers to the completion of studies and academic performance expectancy strongly influence the dropout intention: the former is positive, in line with Pekrun’s findings and the latter negative, according to the theory of self-determination. When gender and admission GPA are considered in the second model, family socioeconomic status has a negative influence on dropout intention. When the four variables of the last model are controlled, the variable
barriers to the completion of studies better explain the dropout intention.
To summarize, undergraduate freshmen with a higher dropout intention perceive more obstacles to the completion of studies, have lower academic performance expectancy in the first year of study, originate from socioeconomically disadvantaged families, have a lower admission GPA, and are male.
Social desirability may explain the results obtained for
Relationships with high school teachers and some other items such as ‘
I don’t really like school.’ Similarly, the lack of answers for parents’ occupation and level of education (the rate of non-responses was more than 5%) may be a consequence of students’ frustration or shame in disadvantaged cases. These students can benefit from psychological counselling to reframe unfavorable situations. The absence of answers in the survey may also be the consequence of low motivation to participate in the investigation, although the participation was voluntary. The non-responses may bias the results, but there are no firm guidelines regarding the amount of data needed [
34].
Another limitation of our work may arise from the nonprobability sampling and the imbalance of male and female students, but this imbalance reflects the gender proportions in the forestry profession in many countries. A limitation may also come from the holistic perception of all abilities and from the self-reported data. There might be other factors that can influence the students’ behavior, such as personality traits or teacher-student relationships in the academic environment. Further investigations should examine these factors.
5. Conclusions
Our study emphasizes the influence of both socio-demographic and personal variables and the importance of the institutional context in the early dropout by students in forestry. The strongest explanation of the early intention to drop out was provided by the perceived barriers to completion, which are more focused on negative emotions. In contrast to previous reports, we did not find a high dropout intention among female students in a male-dominated school, any significant differences between students from rural and urban areas, from high schools with science and non-science academic programs, and between students who live close or far away from their families.
Our findings have several practical implications. Thus, the identification of students at risk of dropping out in the first two months of the academic year prior to failing any courses offers an opportunity for early intervention.
The institutional measures in terms of academic, social, and financial support may reduce dropout intention. Providing well-structured instructional material may decrease anxiety and boredom. Basic sciences are frequent in the first-year forestry curriculum. An explicit presentation of the link between the abstract content of basic sciences and its practical relevance can help freshmen identify and assume proximal goals and can stimulate their learning motivation [
25,
33].
The focus on remedial activities with those students who have a low admission GPA, or those who come from high schools with a curriculum not directly related to forestry, can reduce the learning pressure. Teaching strategies and measures for students’ social integration may be different for female and male individuals, in line with their motivation. Through psychological counselling, students can be helped to understand their negative emotions as a result of their own outlook, not just of situations. Understanding the factors of intention to drop out and offering academic, financial, social, and psychological support may help students continue their university studies.


