Article

Trees at a Moderately Arid Site Were More Sensitive to Long-Term Drought

1
Research Institute of Forest Ecology, Environment and Protection, Chinese Academy of Forestry, Key Laboratory of Forest Ecology and Environment of National Forestry and Grassland Administration, Beijing 100091, China
2
State Key Laboratory of Urban and Regional Ecology, Research Center for Eco-Environmental Sciences, Chinese Academy of Sciences, Beijing 100085, China
3
University of Chinese Academy of Sciences, Beijing 100049, China
4
Academy of Water Resource Conservation Forests of Qilian Mountains in Gansu Province, Zhangye 734000, China
*
Author to whom correspondence should be addressed.
Forests 2021, 12(5), 579; https://doi.org/10.3390/f12050579
Submission received: 17 March 2021 / Revised: 1 May 2021 / Accepted: 3 May 2021 / Published: 6 May 2021
(This article belongs to the Special Issue Drought Resilience of Forest Trees)

Abstract

:
Climate change has dramatically altered the frequency and intensity of droughts, thereby altering tree growth. Understanding whether tree growth in semiarid areas in response to long-term drought and the post-drought recovery rate of tree growth vary along moisture gradients is crucial for predicting future forest change. Here, we assessed the spatial variation in both the growth resistance of Qinghai spruce (Picea crassifolia Kom.) to long-term drought and its post-drought recovery using a stand-total sampling strategy along a moisture gradient that covered three sites (with an annual precipitation of 330.4, 394.2, and 515.9 mm for the western, middle, and eastern sites, respectively) with six plots. Resistance and recovery were evaluated by analyzing the tree growth trends during a long-term drought period (1980–2001) and the subsequent post-drought period (2001–2013), respectively. Our results indicate that the trees with the highest temporal stability were those at the wetter eastern site; specifically, during the long-term drought period, the trees at the wetter eastern site showed the highest resistance (−0.015) and the lowest recovery (0.002). The trees in moderately arid conditions were much more sensitive to climate change than those at the relatively arid western site, showing the lowest resistance (−0.050) and highest recovery (0.020). Climate change had the strongest impact on tree growth at the moderately arid site, contributing 60.6% to the tree growth decreasing trend during the long-term drought period and 65.4% to the tree recovery during the post-drought period, respectively. Climate change had a lower impact on tree growth at the wet and dry sites, contributing less than 50% to the tree growth trends at these sites. The results indicate that a trade-off relationship exists between resistance and recovery at the different sites; that is, the highly resistant trees at the wetter eastern site tend to have lower recovery, whereas the weakly resistant trees at the moderately arid site tend to have higher recovery. These results have implications for predicting tree growth in response to future climate change.

1. Introduction

Drought exerts a strong suppressive effect on tree growth through water deficit or carbon starvation and thus has important effects on forest structure and biomass [1,2], terrestrial carbon stocks [3,4], and ecosystem functioning [5]. The frequency and intensity of droughts have been altered dramatically by climate change, and their effects on tree growth are a research hotspot. Many studies have assessed the impact of drought on tree growth, identifying it as an important factor affecting the growth and death of trees [6,7,8]. The effects of single extreme droughts on tree growth have been widely studied in many parts of the world [9,10,11,12].
In many cases, tree growth has been affected by long-term drought stress [13,14,15]. However, the response of tree growth to long-term drought (resistance) and the post-drought recovery rate of tree growth (recovery) remains poorly understood. Evidence indicates that the response of tree growth to drought varies among different regions [2,10,16]. Resistance and recovery have been used in many studies to describe the responses of tree growth to drought [9,11,17,18]. Resistance can be used to describe the direct effect of drought on tree growth; that is, the ability of a tree to maintain its original growth rate or function during drought [11]. Recovery is used relative to the response induced by the disturbance episode [18], i.e., their post-drought recovery rate. Many studies have focused on short-term drought (e.g., within one year). However, forests cannot recover immediately and completely after extreme drought and exhibit what are known as “legacy effects” [16,17]. For 1–4 years after severe drought, tree growth is reduced, and recovery is incomplete. Due to legacy effects, studies of the impact of a single extreme drought event on tree growth cannot easily capture the impact of frequent drought, especially when tree growth has not recovered from a previous drought.
Furthermore, spatial heterogeneity of habitat (i.e., spatial variation in drought conditions) leads to differences in the response of tree growth to drought among different regions [2,10,16]. For example, Amazon forest along a gradient from a high-biomass moist area to a dry and woody savannah-like area shows an immediate, graded, and heterogeneous transition in response to drought [2]. At forest sites in Inner Asia, trees in semiarid sites have been found to be more sensitive to drought variability that those in semihumid sites [19]. Furthermore, the same tree species can show different drought responses in different regions. In the Eastern Mediterranean, trees in permanent dry conditions have higher resilience to drought than those in humid conditions [10]. Therefore, understanding the response of tree growth to long-term drought under different drought conditions and its post-drought recovery can benefit projections of forest ecosystem feedback under future climate change.
Recent studies have shown that forests in the Qilian Mountains in northwest China have been affected by drought stress caused by warming since 1980. However, the drought stress was relieved due to the warming hiatus after 2000 [15,20]. In addition, the climate in the Qilian Mountains has great heterogeneity, and the precipitation decreases gradually from east to west. From east to west in the Qilian Mountains, Qinghai spruce (Picea crassifolia Kom.) occurs in bands or patches along altitudinal gradients, which can meet the sampling requirements from east to west in the Qilian Mountains in a closed forest belt. Therefore, the Qilian Mountain region is an ideal place to study differences in the growth response to long-term drought caused by the spatial heterogeneity of habitats.
Tree rings provide long-term, annual-resolution records and are therefore widely used to study growth in response to drought [18,21,22]. Tree growth plasticity enables trees to grow slowly when drought occurs and to undergo post-drought growth recovery when conditions improve [15,16,21]. The tree response to drought is an eco-physiological process affected by many extrinsic factors (e.g., stand density, canopy position, and habitat) [23,24,25,26]. Compared to tree ring-width chronologies, the stand-level biomass increment (SBI) may be more informative for assessing climate effects on overall tree growth [26,27]. Therefore, in this study, we used annual ring width to calculate the biomass increment, which can be directly summed by species or by area. In addition, the SBI avoids the effects of individual level competition or canopy position differences.
We investigated the response of stand-level biomass growth to long-term drought in different regions based on a stand-total sampling strategy along a moisture gradient in the Qilian Mountains. We hypothesized that along this gradient, the trees in the wetter, eastern site have the strongest resistance to long-term drought, whereas those in the arid, western site have the strongest post-drought recovery. In particular, we aimed to answer the following questions: (i) What are the patterns of tree growth under long-term drought and post-drought in different habitats along the moisture gradient? (ii) Do climate-growth relationships in drier environments differ from those in wetter environments during a long-term drought period and a post-drought period?

2. Materials and Methods

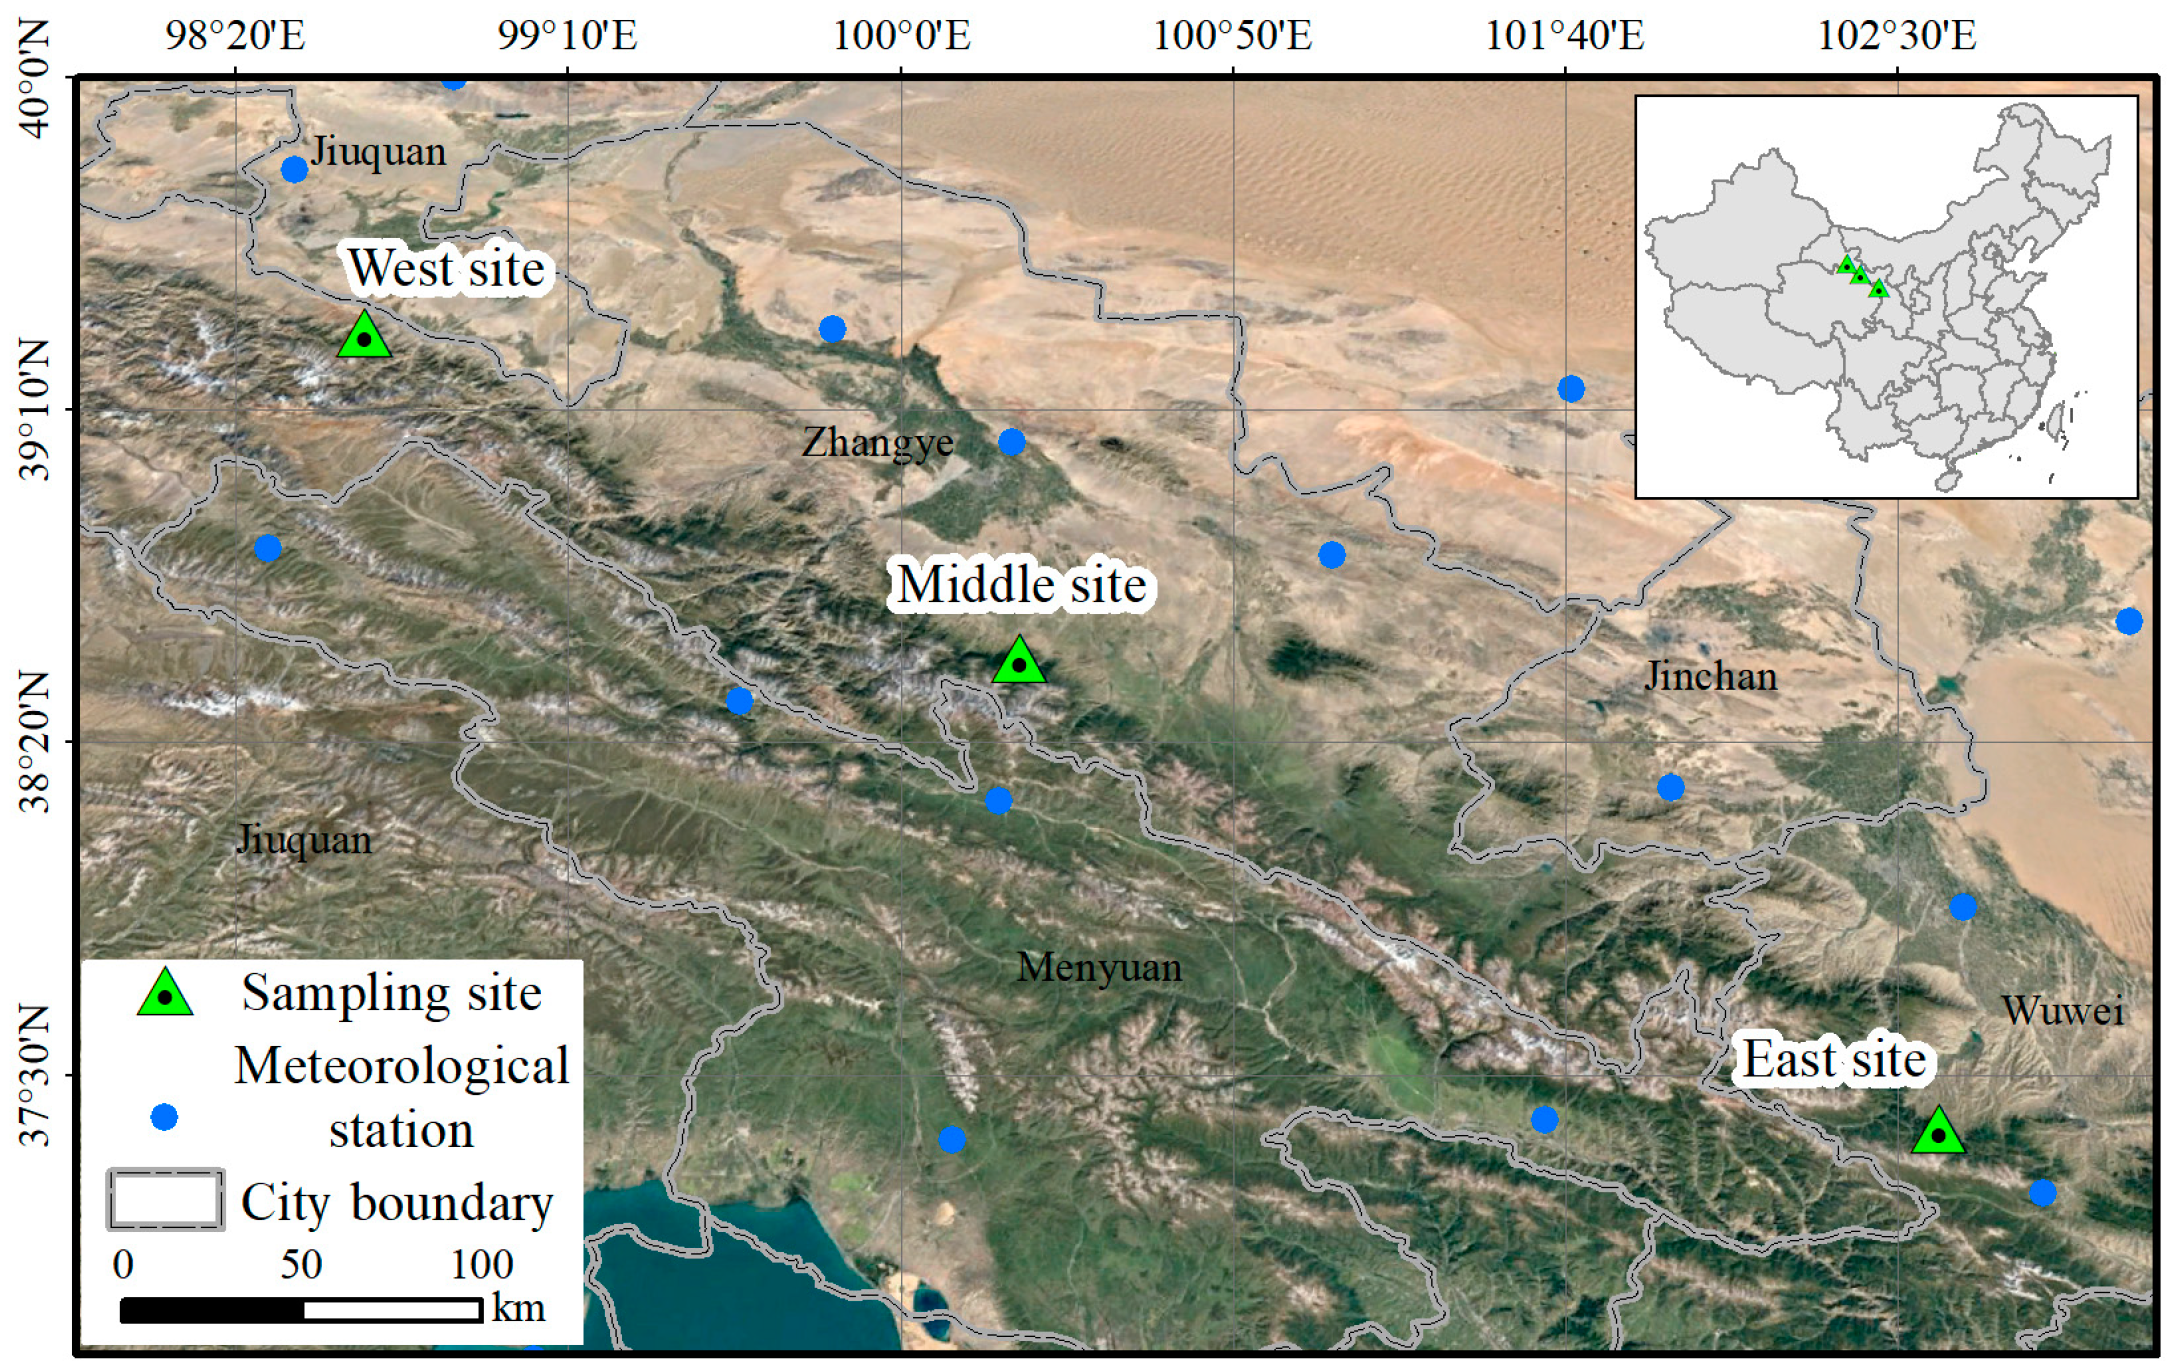
2.1. Study Area and Sampling Sites

The Qilian Mountains in Central Eurasia, located on the Tibetan Plateau, the Loess Plateau, and the junction of the Inner Mongolia–Xinjiang deserts, are distributed along the border between the Qinghai and Gansu Provinces of northern China. The study area is on the northeastern margin of the Tibetan Plateau in a transition zone between the two dominant climates of the East Asian monsoon and the westerlies [28]. Qinghai spruce dominates most of the cold evergreen coniferous forest belt on the northern slopes of the Qilian Mountains, occurring between 2600 and 3300 m a.s.l. In the summers of 2014 and 2017, three sites along the precipitation gradient in this region were sampled (Figure 1): one in the western Qilian Mountains (“West site”, near Qiuquan city), one in the middle of the Qilian Mountains (“Middle site”, near Zhangye city), and one in the eastern Qilian Mountains (“East site”, near Haxi city).

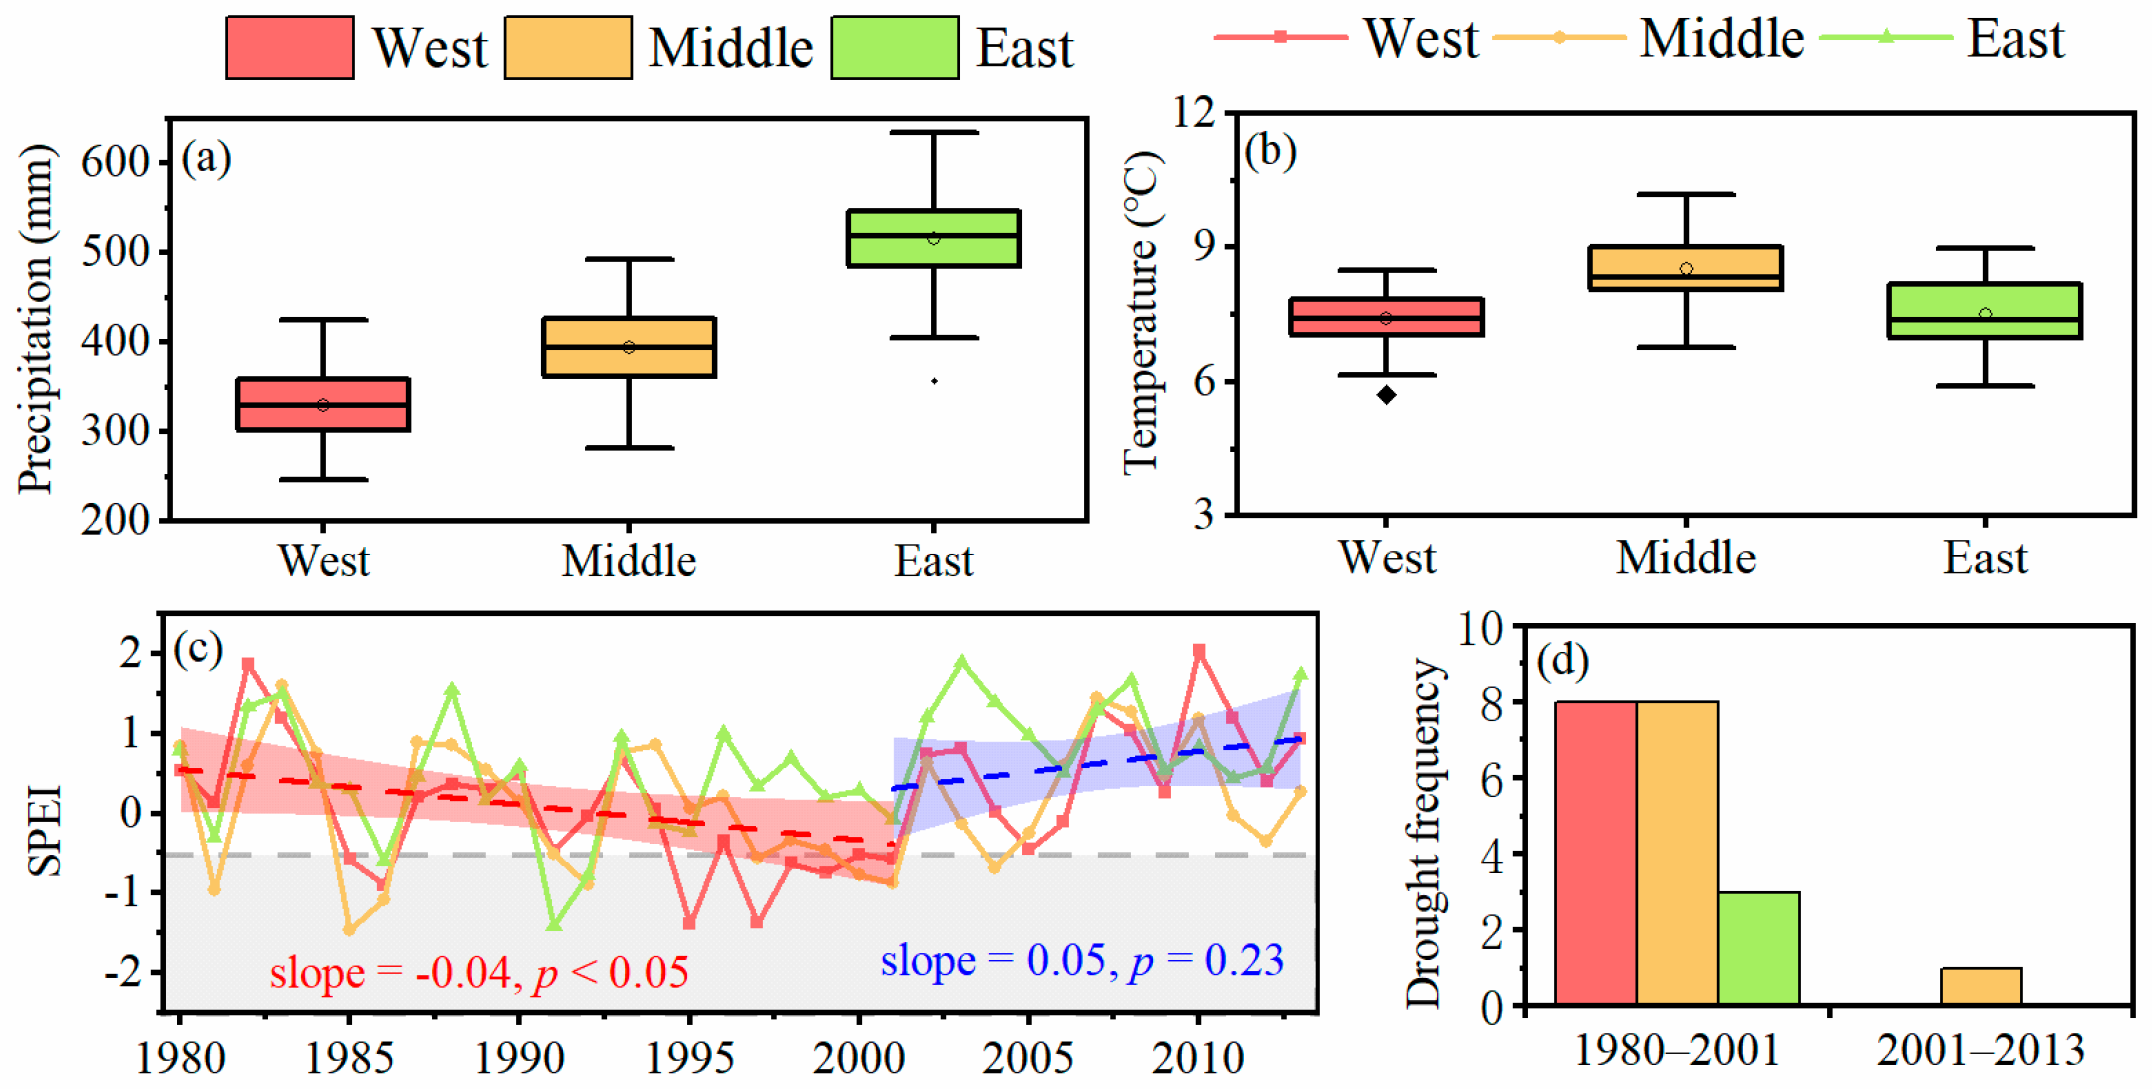
2.2. Climate Data and Drought Periods

Climate data from 11 meteorological stations in this region were collected and used to calculate temperature and precipitation at the different sites. The meteorological stations are generally far from the sampling sites and occur at different altitudes. Therefore, the climate data were interpolated to a 1 × 1 km grid with ANUSPLIN software using the thin plate smooth spline method [29]. The latitude and longitude of the sampling sites were used to extract the climate data of the grid. Drought indices were determined using the standardized precipitation evapotranspiration index (SPEI, v2.5, Zaragoza, Spain, available at http://sac.csic.es/spei/database.html (accessed on 6 May 2021)) for the past decades. We used 0.5 × 0.5° grid data to directly obtain the SPEI value of the grids in which the sample sites were located.
Figure 2 shows the climate variations from west to east in the Qilian Mountains over 1980–2013. Overall, the annual precipitation increased from west to east (Figure 2a). The mean annual precipitation was 330.4 mm per year at the western site, and the annual precipitation at the middle site was approximately 394.2 mm per year. In contrast, the annual precipitation was generally higher than 515.9 mm per year at the site in the eastern Qilian Mountains. We found that the average air temperature for the growing season (from May to October, 8 °C) in the 1980–2013 period, from the western to the eastern site did not significantly change.
The annual SPEI in the study area showed a significantly decreasing trend over the period of 1980 to 2001, with a rate of −0.04 per year (p < 0.05), indicating a long-term drought in this period. During this period, the drought frequency in the western, middle, and eastern Qilian Mountains was 8, 8, and 2 years, respectively. This result indicates that the intensity and frequency of drought at the western and middle sites were greater than those at the eastern site. After 2001, the SPEI exhibited an increasing trend, and the drought was alleviated. During this period, drought frequency was much lower than that during 1980–2001. Only the middle site experienced a severe drought during this time, in 2004; no severe drought occurred at the eastern and western sites.

2.3. Tree-Ring Sampling and Laboratory Treatment

Two plots with similar elevations (2800 and 2900 m) located in closed forest and without signs of recent disturbance were established at each study site. Each plot was 20 × 20 m. Basic information, including the elevation, aspect, slope, and canopy density of each plot and the density and diameter at breast height (DBH) of the trees, was recorded (Table 1). In each plot, one or two increment cores were collected from all trees with DBH > 5 cm using a 5.15-mm increment borer.
The cores were extracted at 1.3 m above the ground. The cores were air dried and fixed into grooved wooden strips. The samples were sanded with coarse-to-fine-grained sandpaper until the tree rings became clearly visible and then measured using a LINTAB semiautomatic measuring device. Ring-width series were measured to an accuracy of 0.01 mm. The quality of all measurement series was checked using COFECHA software, e.g., Holmes (1983) [30]. We discarded series that were not correlated with the entire dataset.

2.4. Biomass Increment Data

In this study, we used the summed stand-level biomass increment (SBI) from all cored trees (all trees, DBH ≥ 5 cm) to illustrate the year-to-year variability of tree growth at each site. The SBI was calculated using the following formula:
S B I n = i = 1 I w n i
where SBIn represents the SBI of year n, and Wni is the biomass increment value for year n of tree i.
Annual biomass increments of each tree from 1960 to 2013 were calculated using Qinghai spruce allometric equations, which include the bole, branches, leaves, and coarse roots.
Diameter was converted into biomass increment according to the following standard formula:
W n = a ( D n b D n 1 b )
where Dn and Dn−1 represent the tree DBH of year n and year n − 1, respectively [31], and Wn is the biomass increment for year n. When calculating the bole, branches, leaves, and coarse roots, the corresponding value of coefficient a was 0.0578, 0.0148, 0.0784, and 0.0307, respectively, and that of coefficient b was 2.3485, 2.4307, 1.8411, and 2.2282, respectively.

2.5. Indices of Tree Resistance to and Recovery from Long-Term Drought

In this study, we used standardized SBI to calculate the indices of tree resistance to and recovery from long-term drought. The effect of drought on the temporal stability of tree growth can generally be described by the capacity to withstand the disturbance (resistance) and the post-drought recovery rate of tree growth (recovery). The slope of standardized SBI during the long-term drought subperiod (1980–2001) indicates resistance. The slope of standardized SBI after long-term drought (2001–2013) was used to represent the recovery of trees.
We first standardized the SBI, i.e., the ratio of the annual SBI anomaly to the multiyear SBI mean. Furthermore, the trends of standardized SBI in different subperiods were calculated to indicate the resistance to and recovery of tree growth from long-term drought. The greater the absolute slope value, the greater the sensitivity to drought or the greater the post-drought recovery rate. In other words, during the period of long-term drought, the greater the absolute value of the slope, and the worse the tree resistance to drought. For the period after the drought was relieved, the greater the slope, the stronger the recovery of tree growth.

2.6. Statistical Analyses

Tree growth–climate relationships were analyzed to determine the main climate variables that affected tree growth for the period 1980–2013. Pearson correlation analysis was performed to investigate the relationships between biomass increment and the seasonal climate variables. Other periods, such as the period from the prior July to the current June and May–August of the current growing season, were also investigated. The main climate variables, identified according to the magnitude of the Pearson correlation coefficient, were then selected for further analysis.
To derive the relative importance of the main climate variables in determining the biomass growth trend, the Lindeman–Merenda–Gold (LMG) method was used in this study. Applying this method via a multiple linear regression model in R software v3.2.4 (https://www.R-project.org/) with the package “relaimpo”, we differentiated the contributions of the main climate variables.

3. Results

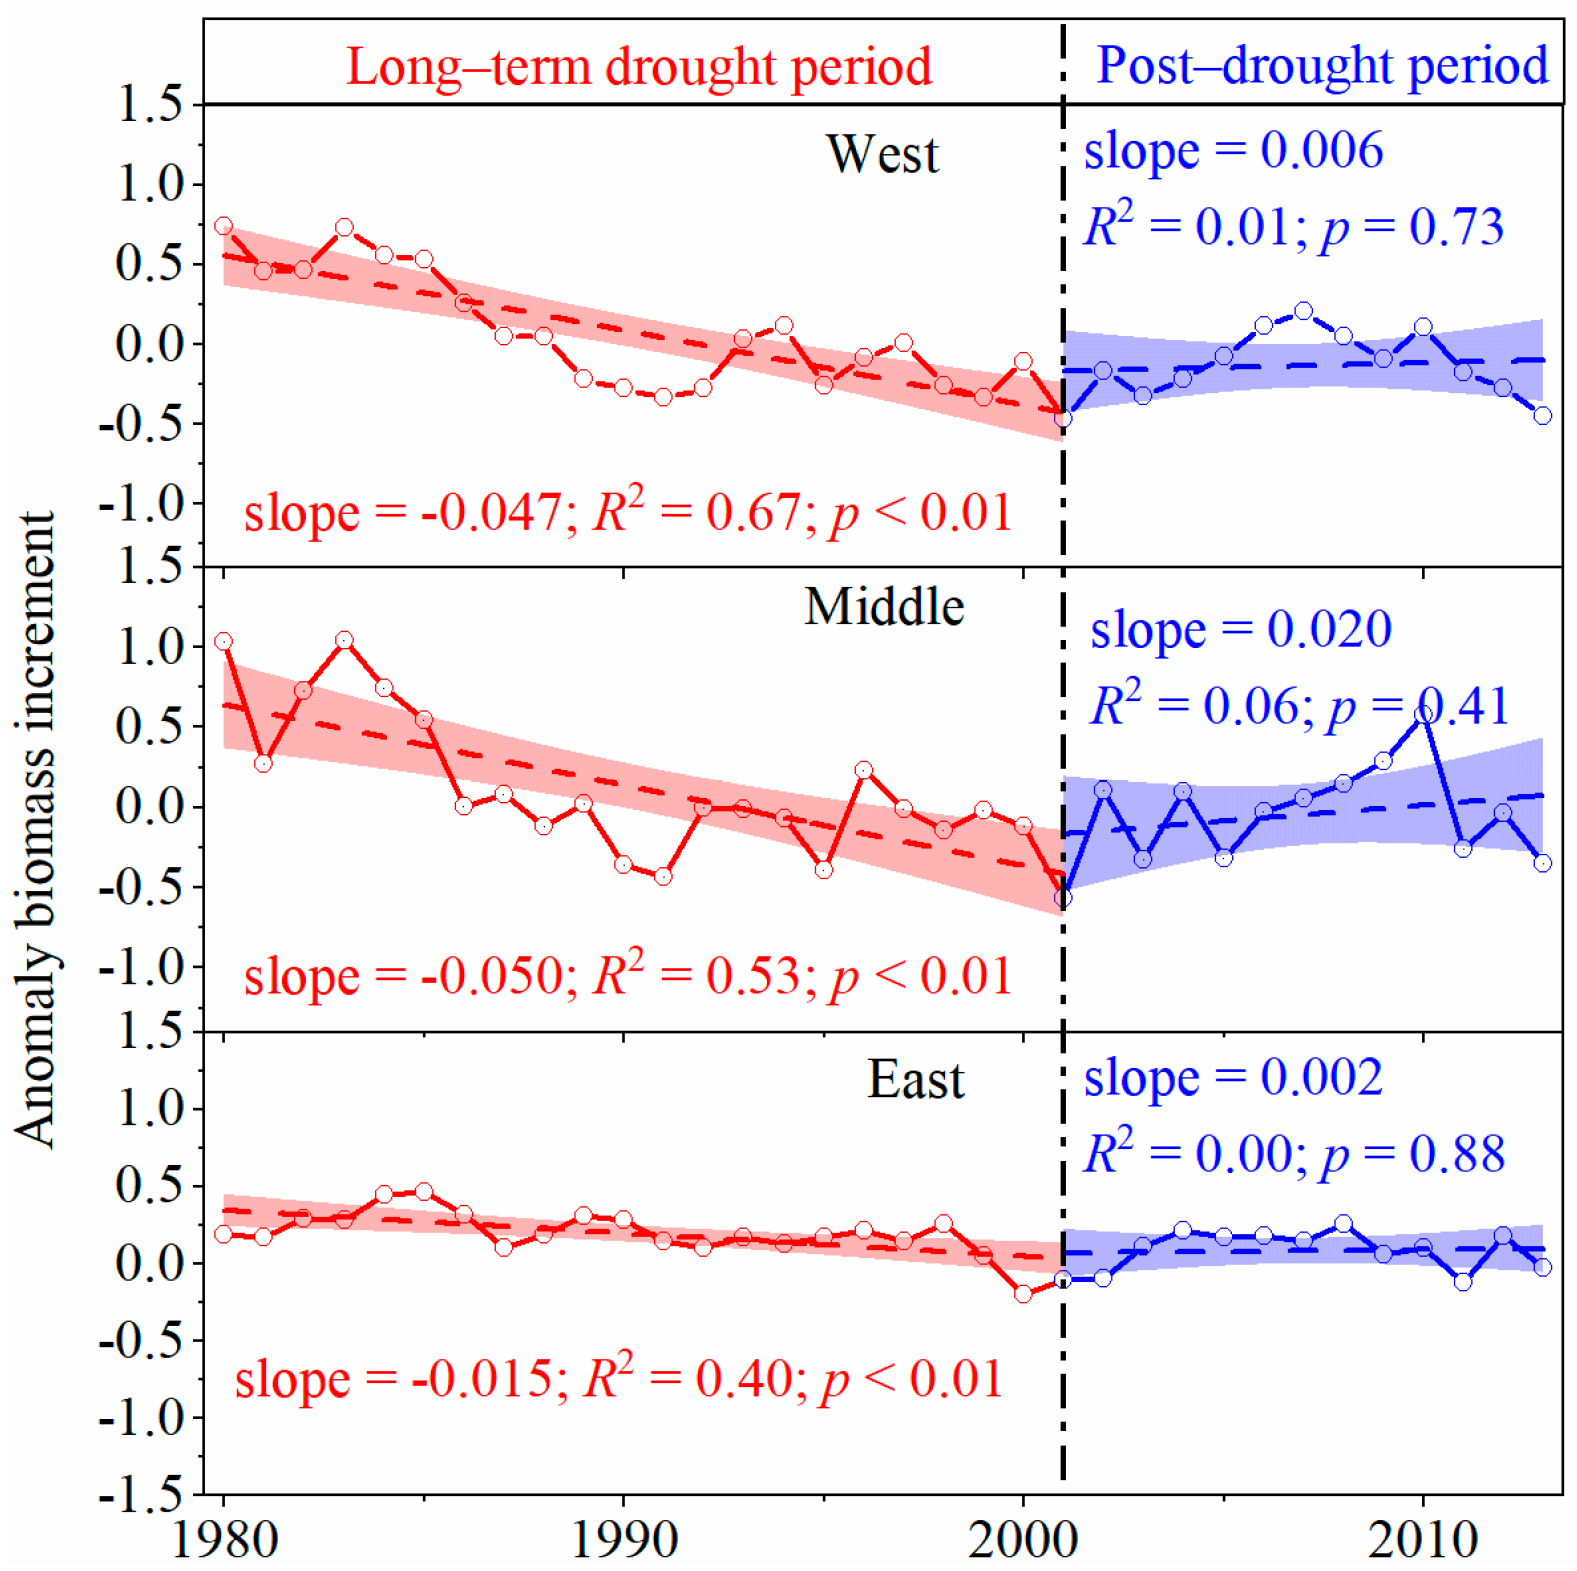
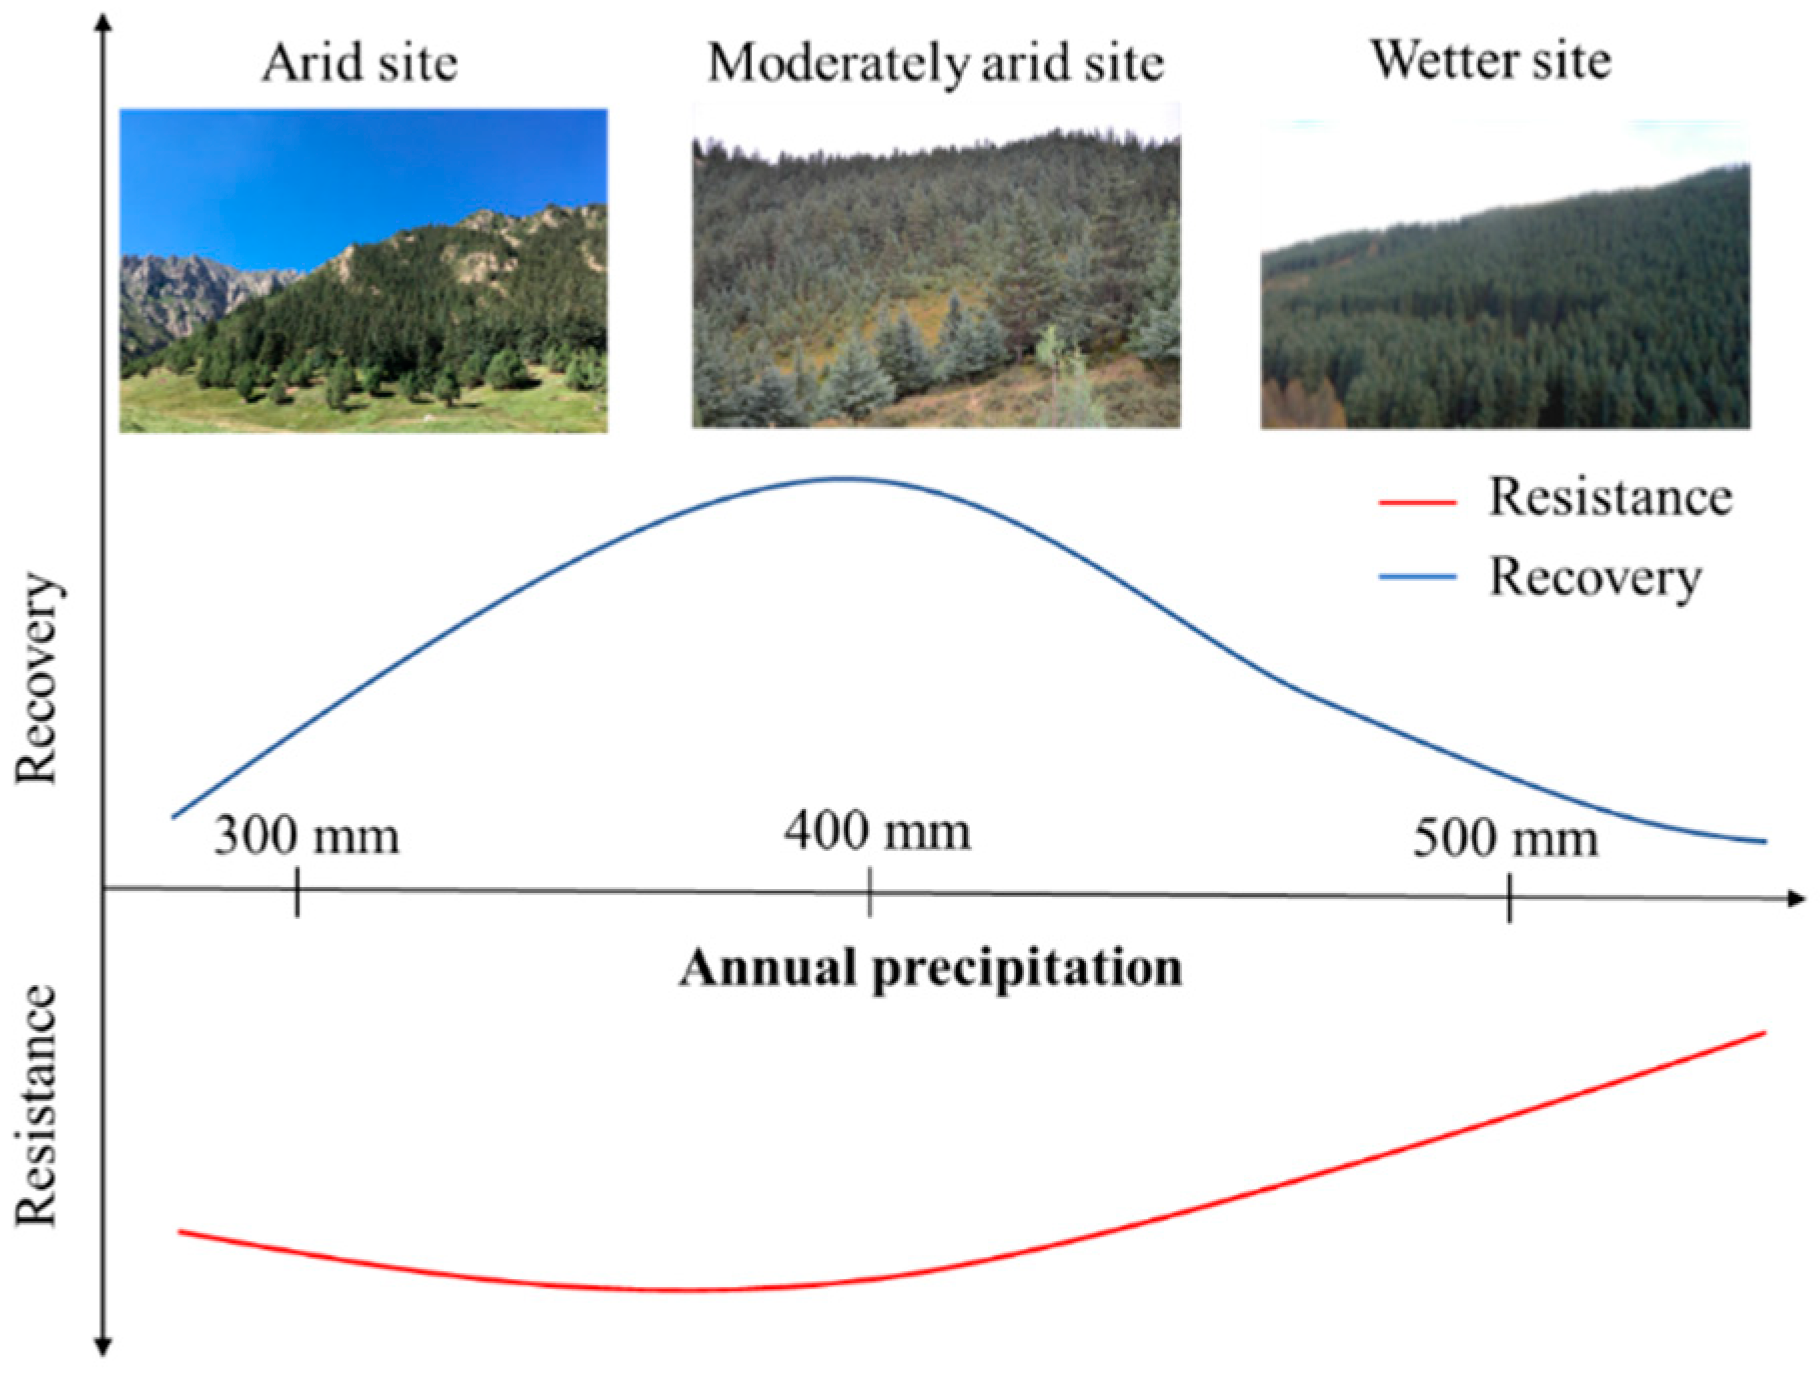
3.1. Tree Resistance to and Recovery from Long-Term Drought

Tree sensitivity to drought differed among the three sites (Figure 3), and tree resistance at the eastern site (−0.015) was significantly higher than that at the other two sites (−0.050 and −0.047 for the middle and western sites, respectively). However, tree growth at the eastern site showed lower recovery (0.002) than that at the other two sites (0.020 and 0.006 for the middle and western sites, respectively), and their recovery was not significant in any of the sites. These findings indicate a trade-off between resistance and recovery at the different sites. In the wetter eastern Qilian Mountains, trees exhibited the highest resistance to long-term drought (−0.015) but the weakest recovery after drought (0.002). Therefore, trees in the eastern site exhibited the highest temporal stability to drought. In contrast, at the moderately arid middle site, tree growth had less resistance to long-term drought (−0.050) and much more recovery after drought (0.020). Trees showed much greater sensitivity to long-term drought at the moderately arid middle site. The resistance of trees at the western site was similar to that at the middle site, but their recovery was weaker.

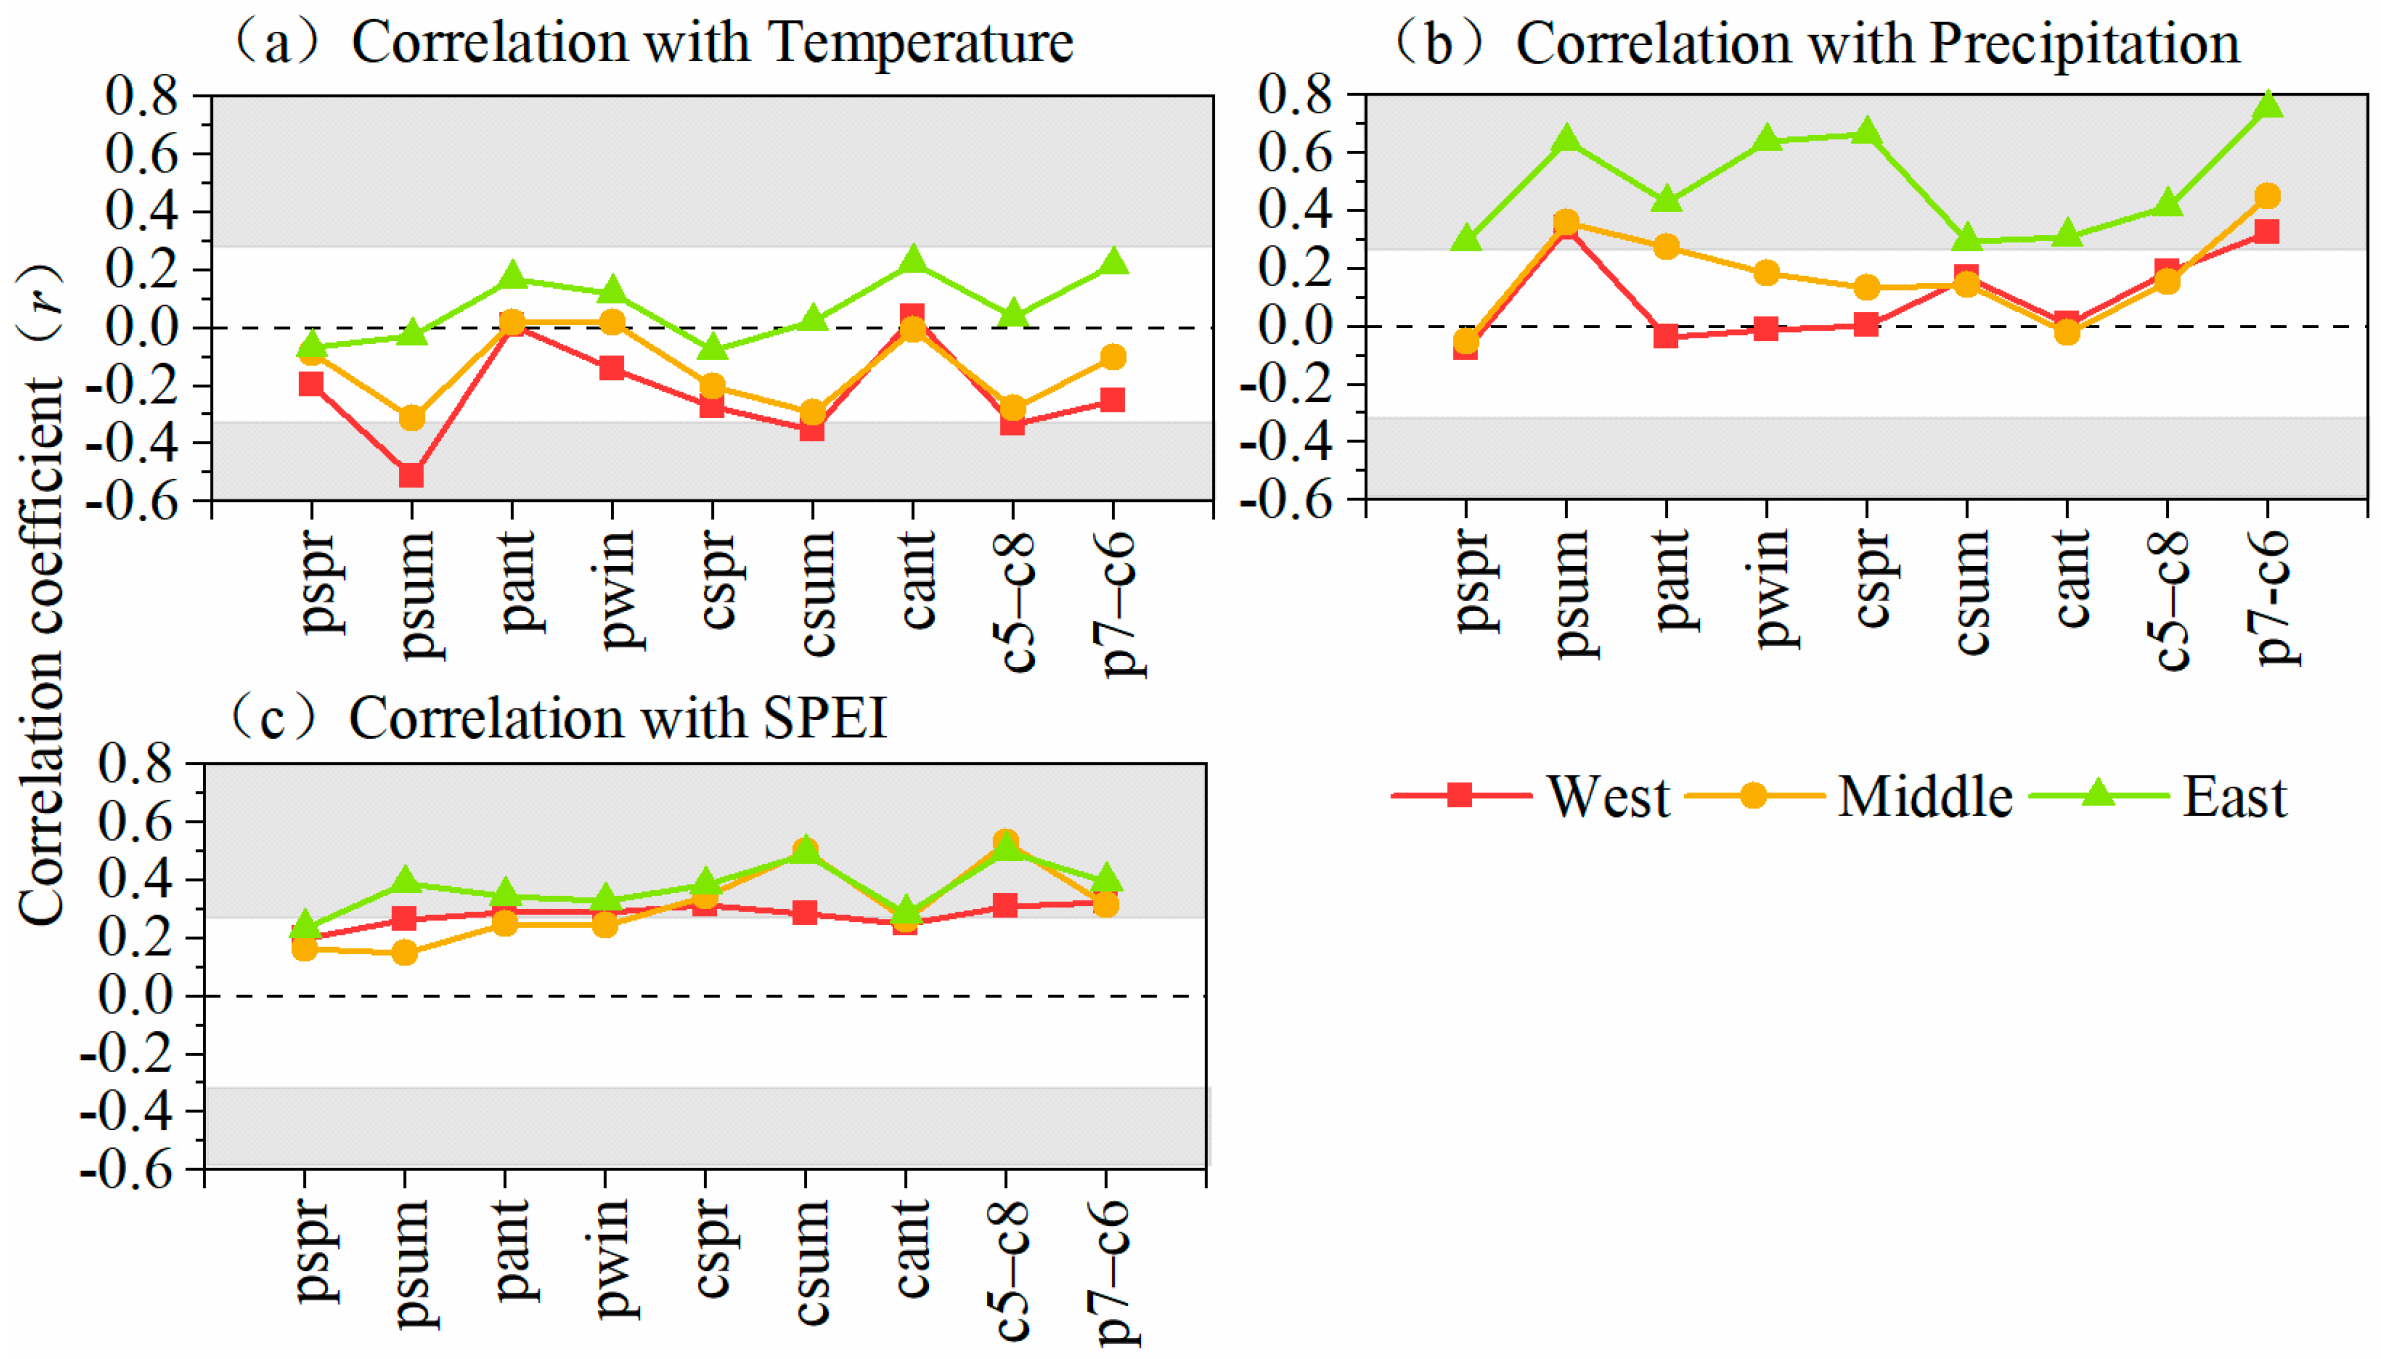
3.2. Growth–Climate Relationships

In our study region, there were striking changes in the correlation patterns between different seasonal variables and biomass increment, and there were obvious differences among the sampling sites, especially with respect to temperature and precipitation. The biomass increment at the eastern site showed no significant positive correlation with temperature (Figure 4), whereas trees at the western and middle sites mainly showed negative correlations with temperature. Significant (p < 0.05) negative correlations were found between biomass increment and both summer temperature (including previous and current summer temperature) and May-to-August temperature. The biomass increment at the eastern site showed significant positive correlations with precipitation for all seasons (or periods). In contrast, the trees at the western and middle sites showed very weak positive correlations between biomass increment and precipitation. Significant (p < 0.05) positive correlations were found only for precipitation in the previous summer and precipitation from the prior July to the current June. The trees at the three different sites mainly showed positive correlations of biomass increment with SPEI. The strongest positive relationship with SPEI was found for the current May to August SPEI. We chose the seasonal (or other period) variables with the most significant correlations with biomass increment as the key climatic factors. Previous summer temperature, precipitation from the prior July to the current June, and current May to August SPEI were the main climate factors.

3.3. Impacts of Main Climate Factors on Tree Resistance to and Recovery from Drought

We assessed the spatial dynamics of tree growth sensitivity to long-term drought and of post-drought recovery rate based on the effects of climate change (main climate factors) during the long-term drought period and the post-drought period (Figure 5). The correlation coefficients between tree growth and the main climate factors were conspicuously different among the three sites during these two periods.
During the long-term drought period, the climate responses at the different sites (the western, middle, and eastern sites) revealed similarities to each other. Previous summer temperature and current May to August SPEI had significant relationships with tree growth (p < 0.05) at all three sites. Tree growth at the eastern site in the Qilian Mountains demonstrated a significant positive relationship with precipitation from the preceding July to the current June. However, tree growth at the western and middle sites did not respond significantly to precipitation from the preceding July to the current June.
During the post-drought period, the impacts of the main climate factors on tree growth were weakened compared to those during the long-term drought period. There was no significant correlation between tree growth and any of the key climatic factors (temperature, precipitation, and SPEI) at the western site. Precipitation from the preceding July to the current June and the current May to August SPEI both had significant positive relationships with tree growth at the middle site. Tree growth at the eastern site only had a significant positive correlation with SPEI.
Overall, tree growth was limited by drought conditions at all three sites during the long-term drought period. During the post-drought period, the relationship between tree growth and climate change differed among the eastern, middle, and western Qilian Mountains. The trees in the middle Qilian Mountains were those most strongly affected by climate.

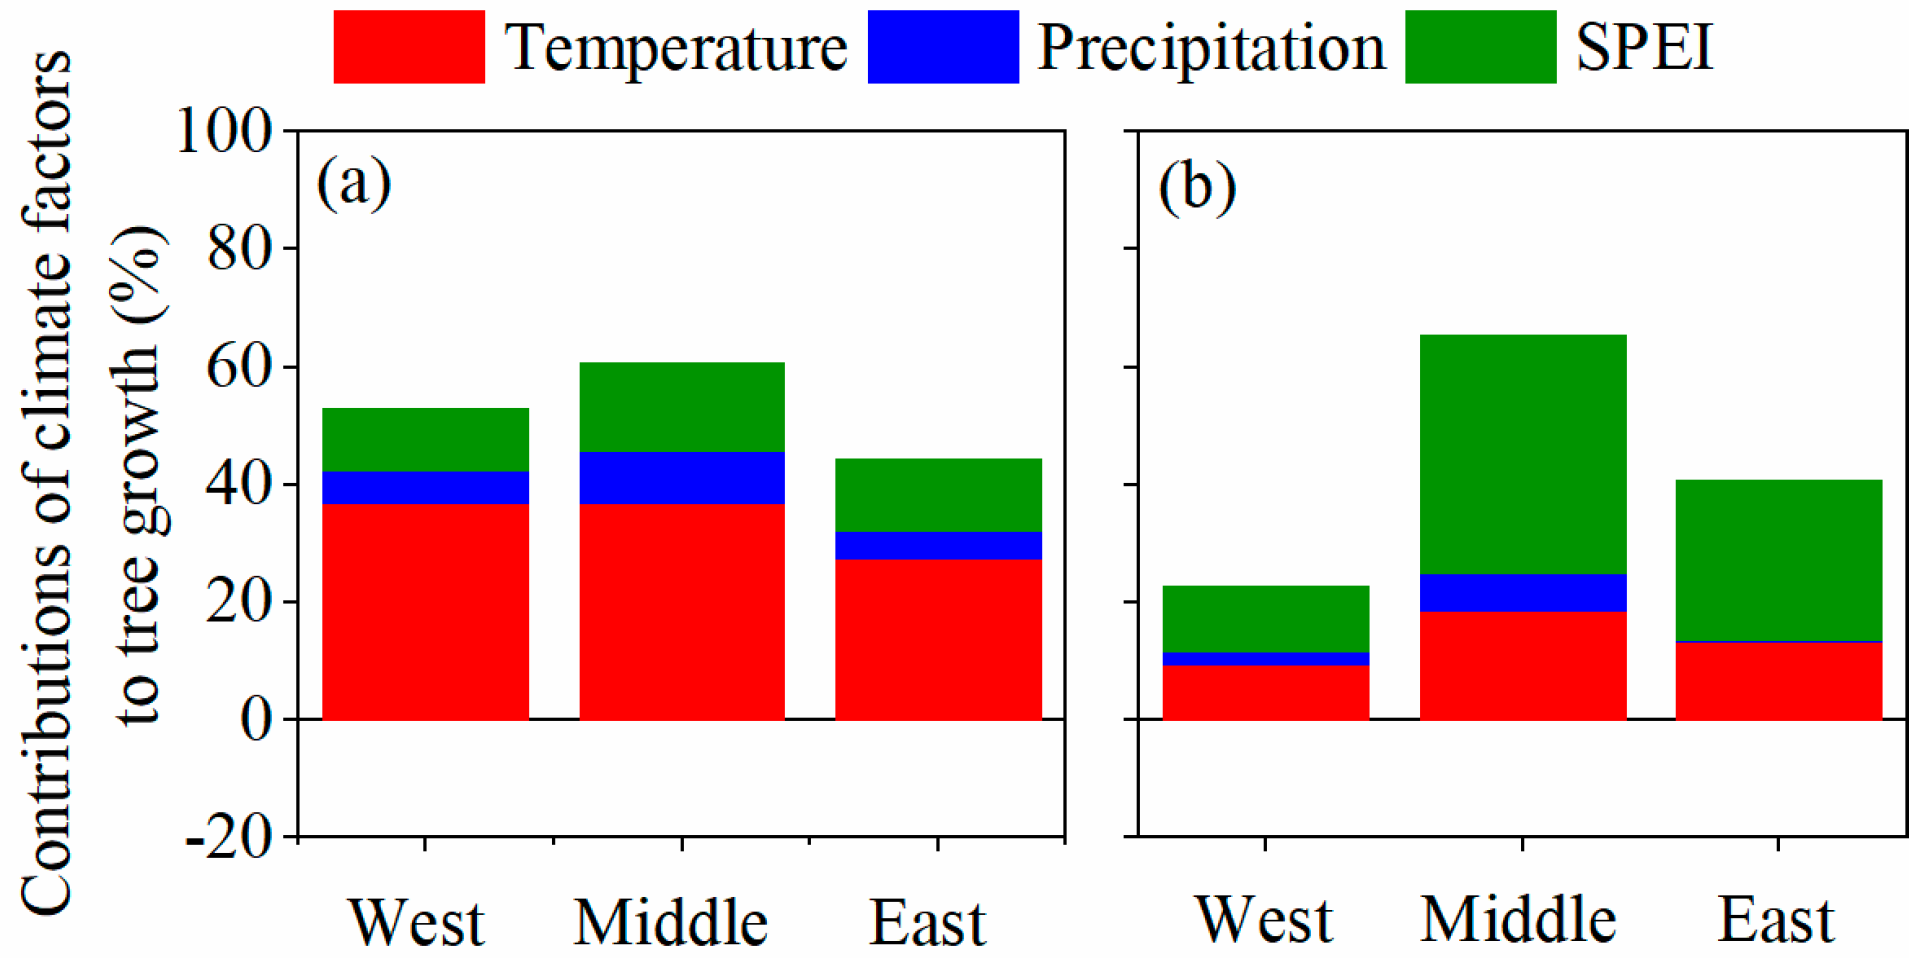
3.4. Climate Attribution in Different Sites

The contributions of the main climate factors to stand-level biomass growth at the different sites are shown in Figure 6. In 1980–2000, the main climatic factors had the greatest influence on the decreasing growth trend of trees at the middle site, contributing 60.6% to the tree growth decreasing trend. At the western site, the main climate factors contributed 52.9% to the tree growth decreasing trend. The key climatic factors contributed the least to the decreasing trend of trees at the eastern site, contributing less than 50% (44.5%). In 2000–2013, the contribution of the main climate factors to the growth trend of trees continued to be greater at the middle site than at the eastern or western sites, at 65.4%. The next largest contribution was at the eastern site, where the main climate factors contributed 40.7% to the tree growth trend. The contribution at the western site was only 22.6%.

4. Discussion

Long-term drought conditions occurred in the Qilian Mountains during 1980–2000 due to rapid warming [15,20]. This long-term drought period, characterized by rapid warming and nearly no change in precipitation [15], resulted in declines in tree growth in the Qilian Mountains (Figure 3). Previous studies have shown that Qinghai spruce is sensitive to moisture conditions; its growth and development are controlled by moisture availability [32]. Rapid warming in 1980–2000 led to increases in potential evapotranspiration and water demand for tree growth [15,20]. In such cases, if there is no increase in available water (due to a lack of a significant increase in precipitation), the water demand cannot be satisfied. As a result, the trees are subjected to intensified drought stress, which slows tree growth.
Stability in trees is usually evaluated in terms of resistance and recovery [11,33]. Previous work has shown trees in arid areas to be more responsive to climate fluctuations than trees in relatively humid areas [19,34]. We thus hypothesized that the sensitivity of trees to long-term drought varies over a moisture gradient. Our data did not fully support this hypothesis. In this study, although sensitivity varied, no trend along the moisture gradient (from the wetter eastern site to the moderately arid middle site, and then to the relatively arid western site) was observed; the trees in the wetter eastern area had the highest temporal stability (high resistance and low recovery), whereas those in the moderately arid conditions were much more sensitive to climate change (low resistance and high recovery) (Figure 3). The resistance of tree growth in the moderately arid middle site (−0.050) was similar to that in the relatively arid western site (−0.047) but less than that in the wetter eastern site (−0.015) during the long-term drought period. The variation in resistance of trees along the moisture gradient largely supports the above hypothesis. During the long-term drought period, trees at the three sites showed similar responses to the main climate variables. The significant negative correlation of tree growth with temperature and the significant positive correlations of tree growth with SPEI at the three sites suggest that these two climate variables played a major role in tree growth decline (Figure 4). In this subperiod, the contribution of the main climate variables to tree growth was greater at the western and middle sites than at the eastern site (Figure 5). Therefore, the trees at the western and middle sites, which represent drier habitats, were more strongly impacted by climate than those at the eastern site, consistent with recent reports in forests in Inner Asia and the southwestern United States [19,35].
Additionally, tree growth is the result of interactions between the environment and the internal metabolic activities of plants, and water availability plays an important role in various environmental factors [36]. Therefore, the different habitat conditions and vegetation characteristics among the sites might also partially explain the site differences in the sensitivity of tree growth to drought. When drought stress occurs, the relative water content and water potential of plant leaves decrease, and the guard cells lose water. As a result, the stomatal closure time is prolonged, which restricts the entry of CO2 into the leaves and leads to decreases in the photosynthesis and growth rates. Under such conditions, the amount of soil water determines whether plants can absorb water through their roots to alleviate the impact of drought. In our study, root depth and soil texture had less impact on the response of trees to long-term drought and after drought in different habitats along a moisture gradient. Specifically, the main soil type of Qinghai spruce forest is gray-drab forest soil, especially the area below 3000 m elevation [37]. Therefore, there was no significant difference in soil physical properties among the three sites. Meanwhile, the root system of Qinghai spruce showed obvious horizontal distribution without taproot. Because the soil thickness can basically meet the root growth range, there is no obvious difference in the root distribution depth of Qinghai spruce from different locations. In addition, water drains quickly on slopes (the steeper the slope, the faster), and trees suffer drought. The slope of the sampling plots at the western site was slightly steeper than that in the eastern and middle sites. Hence, trees in the western site were more susceptible to moisture limitation by soil water. Studies have shown that the soil water content in the eastern Qilian Mountains is greater than that in the middle and western regions [38,39], allowing the trees at eastern sites to obtain soil water more readily than those elsewhere to alleviate drought stress. On the other hand, canopy height is associated with recovery from drought [12,40]; this trait is important for the soil–tree hydraulic connection. In this study, the trees were tallest at the eastern site (Table 1). Taller trees with a larger water potential allow soil water to be transferred to the canopy more effectively. Therefore, the trees at the wetter eastern site showed greater resistance to drought. Our data for the post-drought period do not support the hypothesis that tree recovery varies along the moisture gradient; no trend from the wetter eastern site to the relatively arid western site was evident. The recovery of trees at the moderately arid middle site (0.020) was much greater than that at the wetter eastern site (0.002) and relatively arid western site (0.006) during the post-drought period. The main climate variables contributed most to the tree growth recovery rate at the moderately arid middle site (Figure 5). Therefore, compared with those at the other sites, the trees at the middle site experienced more positive effects from the main climate variables when drought stress was alleviated. In our study area, the annual precipitation at the middle site (400 mm year−1) was less than that in the eastern Qilian Mountains (500 mm year−1). Indeed, other studies have recently documented that trees at semiarid sites tend to be substantially more sensitive to drought variability than those at semihumid sites [33,34]. Our finding that recovery at the moderately arid site was much greater than that at the wetter site is consistent with the above result. On the other hand, annual precipitation was usually less than 350 mm year−1 at the site in the western Qilian Mountains, where moisture availability may still be a limiting factor for tree growth. Therefore, the recovery of trees at the relatively arid western site was less than that at the middle site. In addition to the influence of climate change on tree growth, the intense internal competition can further explain the resistance of trees to long-term drought and its post-drought recovery. It was clearly shown that the moderate site had a much higher tree density than the other two sites, which might help explain the lower resistance at the moderately arid site. High competition between trees for nutrients or water could explain the lower resistance at this site. When trees grow persistently under severe conditions, they develop compensatory responses, e.g., trees may adjust their ecological adaptation strategy. A previous study indicated that Qinghai spruce’s ecological adaptation strategy changes in different sites, and this adaptation is mainly reflected in the difference in metabolic rate [41]. Therefore, the recovery of trees in different sites may be complicated. Although our results do not fully support our hypothesis that the recovery of trees varies along a moisture gradient, they suggest that trees at the moderately arid site may be more resilient during post-drought periods.
Our results of tree growth resistance to long-term drought and recovery post-drought in different habitats lead us to suggest a conceptual model of tree resistance and recovery along a moisture gradient (Figure 7). Tree resistance and recovery do not change linearly with annual precipitation. Rather, trees at the moderately arid site (with an annual precipitation of approximately 400 mm) in our study area may be more sensitive to long-term drought; that is to say, they may have less resistance but high recovery.

5. Conclusions

In the present study, we assessed the response of Qinghai spruce growth to long-term drought and the post-drought recovery rate of tree growth along a precipitation gradient from west to east in the Qilian Mountains, by stand-total sampling at three sites and six plots. The results show that the Qinghai spruce trees at the wetter east site were highly resistant and tended to have lower recovery, whereas those at the moderately arid site had low resistance and tended to have higher recovery. Specifically, the trees at the wetter site showed the highest resistance (−0.015) and lowest recovery (0.002), whereas those at the moderately arid site showed the lowest resistance (−0.050) and highest recovery (0.020). Regarding climate factors, the increasing temperature and induced drought were the primary determinants of tree growth decline, whereas different habitat conditions and vegetation characteristics played important roles in determining tree resistance and recovery. Furthermore, resistance and recovery at the different sites showed a trade-off relationship; that is, highly resistant trees at the wetter eastern site tended to have lower recovery, and the weakly resistant trees at the moderately arid site tended to have higher recovery.

Author Contributions

Formal analysis, B.W. and Y.W. (Yanfang Wan); Investigation, B.W., L.Z., Y.Y., S.W., and X.L.; Writing—original draft, B.W. and P.Y.; Writing—review and editing, B.W., P.Y., and Y.W. (Yanhui Wang). All authors have read and agreed to the published version of the manuscript.

Funding

This work was funded by the National Natural Science Foundation of China (No. U20A2085, 91425301, 91225302, and 41671025).

Data Availability Statement

Not available.

Acknowledgments

We thank the staff of the sampled Academy of Water Resource Conservation Forests of Qilian Mountains in Gansu Province for their assistance in the field.

Conflicts of Interest

The authors declare no conflict of interest.

References

  1. Xu, C.; Liu, H.; Anenkhonov, O.A.; Korolyuk, A.Y.; Sandanov, D.V.; Balsanova, L.D.; Naidanov, B.B.; Wu, X. Long-term forest resilience to climate change indicated by mortality, regeneration, and growth in semiarid southern Siberia. Glob. Chang. Biol. 2016, 23, 2370–2382. [Google Scholar] [CrossRef]
  2. Levine, N.M.; Zhang, K.; Longo, M.; Baccini, A.; Phillips, O.L.; Lewis, S.L.; Alvarez-Dávila, E.; De Andrade, A.C.S.; Brienen, R.J.W.; Erwin, T.L.; et al. Ecosystem heterogeneity determines the ecological resilience of the Amazon to climate change. Proc. Natl. Acad. Sci. USA 2016, 113, 793–797. [Google Scholar] [CrossRef] [Green Version]
  3. Humphrey, V.; Zscheischler, J.; Ciais, P.; Gudmundsson, L.; Sitch, S.; Seneviratne, S.I. Sensitivity of atmospheric CO2 growth rate to observed changes in terrestrial water storage. Nat. Cell Biol. 2018, 560, 628–631. [Google Scholar] [CrossRef]
  4. Jung, M.; Reichstein, M.; Schwalm, C.R.; Huntingford, C.; Sitch, S.; Ahlström, A.; Arneth, A.; Camps-Valls, G.; Ciais, P.; Friedlingstein, P.; et al. Compensatory water effects link yearly global land CO2 sink changes to temperature. Nat. Cell Biol. 2017, 541, 516–520. [Google Scholar] [CrossRef] [PubMed] [Green Version]
  5. Berdugo, M.; Delgado-Baquerizo, M.; Soliveres, S.; Hernández-Clemente, R.; Zhao, Y.; Gaitán, J.J.; Gross, N.; Saiz, H.; Maire, V.; Lehmann, A.; et al. Global ecosystem thresholds driven by aridity. Science 2020, 367, 787–790. [Google Scholar] [CrossRef] [Green Version]
  6. Allen, C.D.; Breshears, D.D.; McDowell, N.G. On underestimation of global vulnerability to tree mortality and forest die-off from hotter drought in the Anthropocene. Ecosphere 2015, 6, art129. [Google Scholar] [CrossRef]
  7. DeSoto, L.; Cailleret, M.; Sterck, F.; Jansen, S.; Kramer, K.; Robert, E.M.R.; Aakala, T.; Amoroso, M.M.; Bigler, C.; Camarero, J.J.; et al. Low growth resilience to drought is related to future mortality risk in trees. Nat. Commun. 2020, 11, 545. [Google Scholar] [CrossRef]
  8. Vacchiano, G.; Garbarino, M.; Mondino, E.B.; Motta, R. Evidences of drought stress as a predisposing factor to Scots pine decline in Valle d’Aosta (Italy). Eur. J. For. Res. 2011, 131, 989–1000. [Google Scholar] [CrossRef]
  9. Flores, B.M.; Holmgren, M.; Xu, C.; Van Nes, E.H.; Jakovac, C.C.; Mesquita, R.C.G.; Scheffer, M. Floodplains as an Achilles’ heel of Amazonian forest resilience. Proc. Natl. Acad. Sci. USA 2017, 114, 4442–4446. [Google Scholar] [CrossRef] [Green Version]
  10. Helman, D.; Lensky, I.M.; Yakir, D.; Osem, Y. Forests growing under dry conditions have higher hydrological resilience to drought than do more humid forests. Glob. Chang. Biol. 2017, 23, 2801–2817. [Google Scholar] [CrossRef]
  11. Huang, K.; Xia, J. High ecosystem stability of evergreen broadleaf forests under severe droughts. Glob. Chang. Biol. 2019, 25, 3494–3503. [Google Scholar] [CrossRef] [PubMed]
  12. Li, X.; Piao, S.; Wang, K.; Wang, X.; Wang, T.; Ciais, P.; Chen, A.; Lian, X.; Peng, S.; Peñuelas, J. Temporal trade-off between gymnosperm resistance and resilience increases forest sensitivity to extreme drought. Nat. Ecol. Evol. 2020, 4, 1075–1083. [Google Scholar] [CrossRef]
  13. Jump, A.S.; Hunt, J.M.; Peñuelas, J. Rapid climate change-related growth decline at the southern range edge of Fagus sylvatica. Glob. Chang. Biol. 2006, 12, 2163–2174. [Google Scholar] [CrossRef] [Green Version]
  14. Peng, C.; Ma, Z.; Lei, X.; Zhu, Q.; Chen, H.; Wang, W.; Liu, S.; Li, W.; Fang, X.; Zhou, X. A drought-induced pervasive increase in tree mortality across Canada’s boreal forests. Nat. Clim. Chang. 2011, 1, 467–471. [Google Scholar] [CrossRef]
  15. Wang, B.; Yu, P.; Zhang, L.; Wang, Y.; Yu, Y.; Wang, S. Differential Trends of Qinghai Spruce Growth with Elevation in Northwestern China during the Recent Warming Hiatus. Forests 2019, 10, 712. [Google Scholar] [CrossRef] [Green Version]
  16. Anderegg, W.R.L.; Schwalm, C.; Biondi, F.; Camarero, J.J.; Koch, G.; Litvak, M.; Ogle, K.; Shaw, J.D.; Shevliakova, E.; Williams, A.P.; et al. Pervasive drought legacies in forest ecosystems and their implications for carbon cycle models. Science 2015, 349, 528–532. [Google Scholar] [CrossRef] [Green Version]
  17. Huang, M.; Wang, X.; Keenan, T.F.; Piao, S. Drought timing influences the legacy of tree growth recovery. Glob. Chang. Biol. 2018, 24, 3546–3559. [Google Scholar] [CrossRef] [Green Version]
  18. Vitasse, Y.; Bottero, A.; Cailleret, M.; Bigler, C.; Fonti, P.; Gessler, A.; Lévesque, M.; Rohner, B.; Weber, P.; Rigling, A.; et al. Contrasting resistance and resilience to extreme drought and late spring frost in five major European tree species. Glob. Chang. Biol. 2019, 25, 3781–3792. [Google Scholar] [CrossRef]
  19. Liu, H.; Williams, A.P.; Allen, C.D.; Guo, D.; Wu, X.; Anenkhonov, O.A.; Liang, E.; Sandanov, D.V.; Yin, Y.; Qi, Z.; et al. Rapid warming accelerates tree growth decline in semi-arid forests of Inner Asia. Glob. Chang. Biol. 2013, 19, 2500–2510. [Google Scholar] [CrossRef]
  20. Gao, L.; Gou, X.; Deng, Y.; Wang, Z.; Gu, F.; Wang, F. Increased growth of Qinghai spruce in northwestern China during the recent warming hiatus. Agric. For. Meteorol. 2018, 260–261, 9–16. [Google Scholar] [CrossRef]
  21. Piovesan, G.; Biondi, F.; Di Filippo, A.; Alessandrini, A.; Maugeri, M. Drought-driven growth reduction in old beech (Fagus sylvatica L.) forests of the central Apennines, Italy. Glob. Chang. Biol. 2008, 14, 1265–1281. [Google Scholar] [CrossRef]
  22. Prior, L.D.; Bowman, D.M. Big eucalypts grow more slowly in a warm climate: Evidence of an interaction between tree size and temperature. Glob. Chang. Biol. 2014, 20, 2793–2799. [Google Scholar] [CrossRef] [PubMed]
  23. Cabon, A.; Mouillot, F.; Lempereur, M.; Ourcival, J.-M.; Simioni, G.; Limousin, J.-M. Thinning increases tree growth by delaying drought-induced growth cessation in a Mediterranean evergreen oak coppice. For. Ecol. Manag. 2018, 409, 333–342. [Google Scholar] [CrossRef]
  24. D’Amato, A.W.; Bradford, J.B.; Fraver, S.; Palik, B.J. Effects of thinning on drought vulnerability and climate response in north temperate forest ecosystems. Ecol. Appl. 2013, 23, 1735–1742. [Google Scholar] [CrossRef] [PubMed] [Green Version]
  25. Fang, O.; Zhang, Q. Tree resilience to drought increases in the Tibetan Plateau. Glob. Chang. Biol. 2019, 25, 245–253. [Google Scholar] [CrossRef]
  26. Teets, A.; Fraver, S.; Weiskittel, A.R.; Hollinger, D.Y. Quantifying climate-growth relationships at the stand level in a mature mixed-species conifer forest. Glob. Chang. Biol. 2018, 24, 3587–3602. [Google Scholar] [CrossRef]
  27. Foster, J.R.; Finley, A.O.; D’Amato, A.W.; Bradford, J.B.; Banerjee, S. Predicting tree biomass growth in the temperate-boreal ecotone: Is tree size, age, competition, or climate response most important? Glob. Chang. Biol. 2016, 22, 2138–2151. [Google Scholar] [CrossRef]
  28. Li, D.L.; Liu, X.H. Climate in Gansu; China Meteorological Press: Beijing, China, 2000. [Google Scholar]
  29. Wang, J.; Wang, J.; Ye, H.; Liu, Y.; He, H. An interpolated temperature and precipitation dataset at 1-km grid resolution in China (2000–2012). China Sci. Data 2017, 2, 73–80. [Google Scholar]
  30. Holmes, R.L. Computer-assisted quality control in tree-ring dating and measurement. Tree-Ring Bull 1983, 43, 69–75. [Google Scholar]
  31. Monserud, R.A.; Sterba, H. A basal area increment model for individual trees growing in even- and uneven-aged forest stands in Austria. For. Ecol. Manag. 1996, 80, 57–80. [Google Scholar] [CrossRef]
  32. Liang, E.; Shao, X.; Eckstein, D.; Liu, X. Spatial variability of tree growth along a latitudinal transect in the Qilian Mountains, northeastern Tibetan Plateau. Can. J. For. Res. 2010, 40, 200–211. [Google Scholar] [CrossRef]
  33. De Keersmaecker, W.; Lhermitte, S.; Tits, L.; Honnay, O.; Somers, B.; Coppin, P. A model quantifying global vegetation resistance and resilience to short-term climate anomalies and their relationship with vegetation cover. Glob. Ecol. Biogeogr. 2015, 24, 539–548. [Google Scholar] [CrossRef]
  34. Zhang, L.; Jiang, Y.; Zhao, S.; Jiao, L.; Wen, Y. Relationships between Tree Age and Climate Sensitivity of Radial Growth in Different Drought Conditions of Qilian Mountains, Northwestern China. Forests 2018, 9, 135. [Google Scholar] [CrossRef] [Green Version]
  35. Williams, A.P.; Allen, C.D.; Macalady, A.K.; Griffin, D.; Woodhouse, C.A.; Meko, D.M.; Swetnam, T.W.; Rauscher, S.A.; Seager, R.; Grissino-Mayer, H.D.; et al. Temperature as a potent driver of regional forest drought stress and tree mortality. Nat. Clim. Chang. 2013, 3, 292–297. [Google Scholar] [CrossRef]
  36. Ryan, M.G. Tree responses to drought. Tree Physiol. 2011, 31, 237–239. [Google Scholar] [CrossRef] [PubMed] [Green Version]
  37. Dang, H.; Zhao, Y.; Chen, X.; Li, J.; Da, G.; Zhu, Y. Soil water characteristics in Picea crassifolia forestry lands in Qilian Mountains. J. Appl. Ecol. 2004, 15, 1148–1152. [Google Scholar]
  38. Wang, B.; Yu, P.; Wang, S.; Wang, Y.; Liu, X.; Jin, M.; Zhang, X. Response of soil water storage to slope position of forestland in Qilian Mountains. Sci. Soil Water Conserv. 2016, 14, 101–108. [Google Scholar]
  39. Bai, X. Estimation of Soil Moisture and Its Temporal-Spatial Variability by Remote Sensing in Qilian Mountain, Northwestern China; Lanzhou University: Lanzhou, China, 2017. [Google Scholar]
  40. Giardina, F.; Konings, A.G.; Kennedy, D.; Alemohammad, S.H.; Oliveira, R.S.; Uriarte, M.; Gentine, P. Tall Amazonian forests are less sensitive to precipitation variability. Nat. Geosci. 2018, 11, 405–409. [Google Scholar] [CrossRef]
  41. Gou, X.; Chen, F.; Yang, M.; Li, J.; Peng, J.; Jin, L. Climatic response of thick leaf spruce (Picea crassifolia) tree-ring width at different elevations over Qilian Mountains, northwestern China. J. Arid. Environ. 2005, 61, 513–524. [Google Scholar] [CrossRef]
Figure 1. Satellite image of the study area showing the locations of the sampling sites (green triangles) and meteorological stations (blue circles).
Forests 12 00579 g001
Figure 2. Climatic characteristics of the three study sites over 1980–2013. (a) Annual precipitation, (b) mean temperature during the growing season, (c) temporal dynamics of annual SPEI during 1980–2013 (severe drought represented by SPEI < −0.5, indicated by the gray area), (d) frequency of drought (SPEI < −0.5) during two sub-periods.
Forests 12 00579 g002
Figure 3. Resistance and recovery of biomass increment at the three sites. The dashed lines are regression lines. The shaded areas (red and blue) represent 95% confidence intervals.
Forests 12 00579 g003
Figure 4. Correlations between biomass increment and climate variables. The gray area indicates significant correlations (p < 0.05). The seasons are previous spring (pspr), previous summer (psum), previous autumn (paut), previous winter (pwin), current year spring (cspr), current year summer (csum), and current year autumn (caut); other periods include current May to August (c5–c8) and previous year July to current year June (p7–c6).
Forests 12 00579 g004
Figure 5. Correlation coefficients between tree growth and main climate factors (T: previous summer temperature, P: precipitation from the prior July to the current June, SPEI: current May to August SPEI). A star indicates a significant correlation (p < 0.05).
Forests 12 00579 g005
Figure 6. Contributions of temperature, precipitation, and SPEI to tree growth. (a) Long–term drought period, (b) post–drought period.
Forests 12 00579 g006
Figure 7. Conceptual model of changes in resistance and recovery along a moisture gradient.
Forests 12 00579 g007
Table 1. Summary information about the 6 plots.
PlotsElevation
(m a.s.l.)
Aspect (°)Slope (°)Stand Density (Trees/ha)DBH (cm)Tree Height (m)Number of Trees in Plot
E12800NE5921102527.74 (9.5–43.4)18.8 (6.5–24.0)41
E22900NE4231130018.59 (5.2–39)12.2 (3.0–23.5)52
M12800NE723302514.1 (6.6–29.5)10.3 (3.5–14.6)122
M22900NE2432272512.7 (5.5–31.9)7.9 (2.6–14.2)107
W12800NE73695014.78 (8.5–24)7.7 (3.5–12.4)38
W22930NE1637142517.67 (7.4–39)9.4 (2.8–13.0)57
Mean values for age and DBH are followed by the range in parentheses. DBH, diameter at breast height.
Publisher’s Note: MDPI stays neutral with regard to jurisdictional claims in published maps and institutional affiliations.

