Abstract
Community forestry, which is how local communities are involved in forest conservation and utilization activities, is an important forestry program in developing tropical countries. We evaluated the importance of geographical factors and community characteristics in the deforestation of community forests between 2000 and 2019 in the buffer zone of Inlay Lake Biosphere Reserve, Myanmar, using a mixed-effects logistic regression model. Distance to the nearest village, slope, and distance to the community forestry boundary were the most important variables explaining deforestation in community forests. Forests closer to human settlements and with gentle slopes faced higher risks of deforestation, presumably because such forests are more accessible. In addition, forests located far from the boundaries of community forests were more vulnerable to deforestation. Community characteristics were less important compared with geographical factors. Leadership was the most important variable among community characteristics, although not statistically significant. We conclude that deforestation depends more on forest accessibility. This indicates that the locations at which new community forests are established should receive increased consideration.
1. Introduction
Forests in tropical regions, which make up 45% of the world’s forests, have experienced and continue to experience severe deforestation, although the rate of deforestation has slowed since 1990 [1]. Deforestation in tropical regions adversely affects the carbon cycle [2], biodiversity [3,4], and climate [5,6,7]. There is thus a pressing need to mitigate deforestation in tropical regions. Although there are several approaches for mitigating deforestation, approaches that are compatible with the needs of local communities are essential given that many people living in and around the world’s tropical forests depend on forest resources for cooking and heating [8,9], hunting [10], and income [11,12,13].
Community forestry, which refers to forest management in which local community members play an active role in management activities, can provide both ecological and socio-economic benefits [14,15]. Since the concept of community forestry was introduced in the late 1970s [16,17], community forests (CFs) have become widely established in tropical countries (e.g., [15,18,19]). However, the effectiveness of community forestry for mitigating deforestation is still debated, as some studies have shown that community forestry positively affects forest conservation (e.g., [19,20,21,22,23]), whereas others have shown that the effects of community forestry on forest conservation are limited (e.g., [18,20]). One reason for this inconsistency is that a variety of site-specific factors can affect the effectiveness of community forestry (e.g., [19,20,23,24,25,26]).
Numerous studies have attempted to identify the factors affecting the effectiveness of CFs (e.g., [26,27]). Geographical factors such as elevation and the distance from the nearest village are important considerations for newly established CFs, as the locations that are most likely to succeed as CFs can be determined before their establishment. Some studies that have identified the geographical factors affecting the effectiveness of CF (e.g., [24,28,29,30]) have revealed that the accessibility to CFs affects the success of forest conservation. The characteristics of the local community managing CFs are also important to consider when evaluating the likelihood of success for a community forestry program. Previous studies have evaluated the importance of community characteristics such as group size [28,29,31,32], forest dependence [33,34,35,36], and leadership [37,38,39] in determining the success of CFs or community-based conservation projects. As numerous factors can affect the effectiveness of CFs, evaluation of the importance of these factors is critically important for the successful implementation of community forestry.
Another reason for the inconsistency among studies regarding the effectiveness of CFs is that previous studies have often been poorly designed and have not used robust indicators for evaluating the effectiveness of CFs [40]. As satellite remote sensing can capture large areas of quantitative forest cover change, an increasing number of studies have used satellite-derived datasets to more robustly assess the success of CFs [41]. These studies have mainly used causal inference to assess forest conservation effectiveness (e.g., [19,25,42]) and have compared the effectiveness of CFs with non-CF areas. However, few studies have characterized variation in conservation effectiveness among CFs. As studies identifying casual effects often only use geographical factors, meteorological factors, and census-derived community characteristics (e.g., population density), whether community characteristics that cannot be collected from censuses (e.g., forest dependence and leadership) affect the conservation effectiveness of CFs remains unclear. Here, we evaluated the importance of geographical factors and community characteristics using satellite-derived forest cover change datasets, which can provide more robust information for conservation managers and policymakers.
Myanmar is the largest country in mainland Southeast Asia and has a population of ca. 51 million [43]. Approximately 70% of the population lives in rural areas and depends on forests for their basic needs, such as cooking, heating, and shelter. Forests in Myanmar make up 42.19% of the country’s total area [44] and have experienced severe deforestation for decades [45,46,47]; Myanmar has the third highest deforestation rate globally, according to annual net forest cover loss from 2010 to 2015 [48]. The main drivers of deforestation are agricultural expansion and the extraction of forest resources (e.g., firewood, charcoal, timber, and household materials) [47,49,50,51,52,53,54]. To accommodate the needs of local communities and improve forest conditions, the participation of local communities in forest management in Myanmar was formally initiated by the Community Forestry Instructions in 1995. The government’s target is to place 9186 km2 under CF management by 2030. As of March 2020, 32% of this target has been achieved. Identifying the factors that affect the success of forest conservation is critically important for enhancing the effectiveness of the management of already established CFs and for ensuring the effectiveness of new areas placed under CF management in Myanmar.
The aim of this study was to explore the factors driving deforestation in CFs in the buffer zone of Inlay Lake Biosphere Reserve, Myanmar, with a special focus on the roles of geographical factors and community characteristics.
2. Case Study Context: Community Characteristics of CFs in Myanmar
In this study, we focused on three community characteristics—forest dependency, leadership, and group size—because previous studies have suggested that these characteristics are particularly important.
2.1. Forest Dependency
There are a variety of ways to measure forest dependency, such as economic dependence on forests, the non-economic benefits provided by forests, the environmental services of forests, and the monetary worth of forest products [55,56,57]. The effect of forest dependency on the outcome of community forestry can vary. For example, some studies have shown that forest dependency increases participation in CF activities and achieves successful outcomes [58,59]. However, other studies have shown that heavy forest dependency can lead to decreased forest cover and reduce the success of community forestry [35,60,61]. An analysis of a large dataset indicated that forest dependency was not associated with forest condition [62].
CFs in Myanmar are established to provide basic needs for local communities in addition to forest conservation. According to CF instructions, the establishment of CF is permitted in areas where forests have the potential to meet local needs, including forest products and income. Those who depend on forests can apply for the establishment of CFs. Thus, the relationship between forest benefits and local communities has been considered since the initiation of community forestry. The resources collected from CFs vary depending on the region. Community forestry user groups (CFUGs) often collect firewood from CFs (e.g., [8]). In addition, seasonal crops, fodder, fuelwood, and thetke (Cylindrical imperator) are the main forest products of plantation-type CFs in the dry zone [63]. Wood, non-timber forest products, mud crab (Scylla serrata), and nypa palm (Nypa fruticans) are also extracted from mangrove CFs in delta areas [64]. Although previous studies of forest dependency in the CFs of Myanmar have been conducted in different parts of the country, including the dry zone and delta areas (e.g., [63,64]), they have focused exclusively on forest dependency in terms of livelihood strategies [64] and participation in CF activities [63]. For example, Feurer et al. [64] reported that CF members earned higher forest income from mangrove CFs than non-CF members. The effect of forest dependency on deforestation in CFs remains unclear.
2.2. Leadership
Leadership is thought to greatly affect the success of resource management [65,66]. However, only a few studies have quantified the effect of leadership on the outcomes of resource management [65]. Most studies have defined leadership based on the presence or absence of a leader (e.g., [26,38,66]). A previous analysis of a cross-national dataset showed that the presence of leaders has a positive effect on CF management.
In Myanmar, the CF chairman should be unanimously elected by CFUG members according to the 2019 instructions. Being respected, fair, knowledgeable, and sociable are considered desirable qualities of CF chairmen per the procedures of community forestry in 2016. Although a previous case study of 4 CFUGs in Myanmar aimed to qualitatively characterize the effect of leadership on the participation of CFUG members in CF activities [63], no quantitative studies to date have evaluated the effect of leadership on deforestation.
2.3. Group Size
Group size, which has various effects on cooperative activities [67,68,69], greatly affects the success of community forestry [26,70]. An increasing number of studies have focused on group size, but the effect of group size is still debated because the findings of previous studies are often inconsistent. For example, one study showed that cooperation was difficult to achieve for large groups involved in CF activities [71]. However, studies from Nepal and India found that larger forest groups tended to be more successful because more people were involved in monitoring and management activities [60,72].
According to the Community Forestry Instructions (1995) in Myanmar, households that seek to establish CFs are grouped into CFUGs. In the 2019 instructions, a CFUG is defined as a group formed by households residing for five consecutive years in or within 8 km from the forest. This group includes households interested in forest activities as well as those dependent on forests for their livelihoods. Group size is not specified in both sets of instructions. The lower limit of group size is described in the Standard Operating Procedures of community forestry in 2016; thus, a proper balance between group size and forest size is required when a CF is established. Although CF studies in Myanmar have analyzed the social and economic attributes of CF group members [63,64,73], no studies to date have focused on group size.
3. Materials and Methods
3.1. Study Area
This study was conducted in CFs established in two watershed conservation forests—Inlay East Reserved Forest (RF) and Inlay West Protected Public Forest (PPF)—in Nyaungshwe Township, Taunggyi District, southern Shan State, Myanmar (Figure 1). Nyaungshwe Township is located between 19°58′ and 20°45′ N and 96°46′ and 97°07′ E.
The climate is humid and subtropical with three seasons: summer (March–June), rainy (July–October), and winter (November–February). The mean air temperature ranges from 21.9 to 31.3 °C [74]. The average annual precipitation is 928 mm [75], and approximately 70% of the annual rainfall occurs during July, August, and September in the southwest monsoon [76]. The geology of the western part of Inlay lake primarily comprises Mesozoic carbonate rock and Tertiary clastic sedimentary rock [77]. The eastern part is primarily composed of Lower Paleozoic carbonate and clastic sedimentary rock. The forest types of Nyaungshwe Township include dry forest and deciduous dipterocarp forest. We selected Nyaungshwe Township because it has one of the longest histories of CF management in Myanmar. The total land areas of Inlay East RF and Inlay West PPF are 213.26 and 140.86 km2, respectively. According to the internal report of the Myanmar Forest Department in 2019, approximately 172.66 km2 (80.96%) of Inlay East RF is covered with forests, and approximately 56.69 km2 (40.25%) of Inlay West PPF is forested.

Figure 1.
Location of the study area in Myanmar. The country border was obtained from Thematic Mapping [78]. The boundary of the Shan state was obtained from the Myanmar Information Management Unit—MIMU [79]. The boundaries of the township, RF, and PPF were obtained from the Myanmar Forest Department. Forest cover change data were downloaded from Global Forest Change 2000–2019 Data [80].
The CFs in Myanmar can be classified into two categories: natural forest conservation areas and plantations. As our aim was to evaluate the effectiveness of the forest conservation of CFs, we focused exclusively on the CFs of natural forest conservation areas. According to the 2019 internal report of the Forest Department, Myanmar, 76 CFs were registered as natural conservation areas in the two watershed conservation forests. Out of the 76 CFs, the earliest CFs, which were established between 2000 and 2001, were the focus of our study. One CF established in 2001 in Inlay West PPF is soon going to be terminated because of the migration of the local people. Another CF near the West PPF was located outside of the two watershed conservation forests. We thus excluded these two CFs from analyses. We examined a total of 24 CFs in our study. When CFs were located on the border of the watershed conservation forests and included areas both outside and inside of the watershed conservation forests, the areas outside of the forest boundaries were included in analyses. The CFs used in this study ranged in elevation from 893 to 1696 m and slope from 1° to 51°.
3.2. Data
The Global Forest Change dataset, which is a global map with a spatial resolution of 30 m derived from Landsat images, was used to assess forest cover change from 2000 to 2019 [80,81]. The dataset provides tree canopy cover for the year 2000, annual forest loss from 2001 to 2019, and forest gain during the period 2000–2012. Tree cover in 2000 was defined as canopy closure for all vegetation taller than 5 m in height. Forest loss was defined as a change from a forest to a non-forest state. Forest gain was defined as a change from a non-forest to forest state from 2000–2012. Areas with greater than 30% tree cover were defined as forest per a previous assessment of the accuracies of different tree cover thresholds for forest cover mapping derived from the Global Forest Change dataset in Myanmar [82]. The overlap of forest loss and gain pixels was assessed because forest loss and gain often occurred in the same pixels. Forest loss was defined as the change in pixels from forest in 2000 to non-forest from 2001 to 2019. If tree canopy cover was still forested in 2019, it was not defined as forest loss.
CF boundaries were obtained from the Forest Department of Nyaungshwe Township, Myanmar. As the accuracy of the CF boundaries was unclear, we confirmed the boundaries through a field survey with the help of CFUGs (see Section 3.3). A digital elevation model with a 30 m resolution from the Shuttle Radar Topography Mission (SRTM) was acquired from the U.S. Geological Survey (USGS) [83]. The slope values were identified using the elevation data. The locations of villages were downloaded from the Myanmar Information Management Unit (MIMU) [79]. A total of 519 villages (including villages located in a 2 km buffer of Nyaungshwe Township) were included in the analyses.
3.3. Field Survey
The semi-structured group interviews were conducted in the 24 CF villages between November and December 2019. In some CFs, two, three, or four villages are combined; in such cases, data from these villages were pooled. There were approximately ten respondents in each group interview. All respondents were members of CFUGs, and the CF chairman was included if one was designated. We informed the respondents of the academic purpose of the interviews before interviews began. CFUGs were queried about household characteristics, such as ethnicity, education status, livelihood activities, and types of cooking energy, along with community characteristics related to CFs, including forest dependency and CF activities. Forest dependency was defined as the extraction of forest resources from CFs to meet basic needs. CFUGs were asked whether they have extracted forest resources from CFs. If CFUGs indicated that they have extracted forest resources, information on the forest resources extracted from CFs was recorded. We collected information on CF activities since the establishment of CFs. We also asked whether there was a CF chairman, and whether the CF chairman participated in the CF activities, as we defined leadership based on the participation status of the CF chairman (see Results).
We also collected information on the CF boundaries in multiple ways. We first consulted the CF locations and a CF map in the Management Plan book. CFs are usually demarcated by prominent features in the landscape, such as valleys, mountain ranges, villages, roads, and streams. In the field survey, we confirmed the location of prominent features described in the Management Plan book and the locations of CF boundaries from CFUGs by showing the CF map received from the Forest Department of Nyaungshwe Township and a satellite map. We also visited some of the CF boundaries where the demarcation pillars are established with the help of CFUGs and took the coordinates of the pillars using a global navigation satellite system (GNSS; GPSmap 62SJ, Garmin Ltd., Schaffhausen, Switzerland). We finally updated the CF boundaries using the positions of demarcation pillars and prominent features with a satellite map in ArcGIS 10.6.
3.4. Data Analysis
We performed a generalized linear mixed model (GLMM) with a binomial distribution and a logit link function. The GLMM model was applied in R version 3.6.3 using the “lme4” package [84,85]. We used forest fate in 2019 relative to the baseline forest cover in 2000 as the binary response variable (1 = forest loss; 0 = no forest loss). We used forest dependency, leadership, group size, CF area, forest cover ratio, elevation, slope, distance to the nearest village, and distance to the CF boundary as independent variables (Table 1). Forest dependency was a binary variable that indicated the presence (1) or absence (0) of forest dependency. We assigned 1 to 17 CFs in which forest resources were extracted and 0 to the other CFs based on the results of the group interviews (see Section 4.1). Leadership was also a binary variable: 0 corresponded to strong leadership and 1 corresponded to all other scenarios. Previous studies categorized leadership based on the presence of a leader [26,38]. As some CF chairmen did not participate in any CF activities in this study, the presence of a leader did not necessarily reflect leadership. Thus, we considered the performance of CF chairmen in CF activities in addition to the presence of CF chairmen. Last, we assigned strong leadership to CFs that had a CF chairman who managed, organized, and participated in CF activities. Weak leadership was assigned to the other CFs. Group size is the number of households involved in CF activities in the CF in the year in which it was established. CF area refers to the area of the CF, and forest cover ratio refers to the proportion of forest pixels to non-forest pixels in the CF in 2000. The forest cover ratio was used to examine whether the baseline forest cover affected the outcomes of community management. Distance to the nearest village was calculated as the distance between the given pixel and the closest village. Distance to the CF boundary was measured as the distance between the given pixel to the nearest CF boundary. We included the identity (ID) of CF as a random effect. Before the analysis, we standardized group size, CF area, forest cover ratio, elevation, slope, distance to the nearest village, and distance to the CF boundary.

Table 1.
Summary statistics for the response and independent variables used in the GLMM model.
Twenty percent of pixels (4094 pixels) were randomly selected from the forest pixels in 2000. AIC-based model selection and model averaging approaches were used to estimate the relative importance of independent variables. We regressed independent variables against every possible combination of dependent variables and calculated delta AIC (ΔAIC), which is the difference in the AIC between the lowest AIC model and another model. Models with ΔAIC smaller than four were selected for model averaging, and relative model importance, which is the sum of Akaike weights, was calculated from the selected models. We used the “MuMIn” package for standardization and model selection and averaging [86].
4. Results
4.1. Community Characteristics Related to CFs
CFUGs in 15 CFs collected firewood from their forests for use in cooking. Four CFUGs in 15 CFs collected poles to build schools, monasteries, houses for teachers, and houses for CFUGs, in which meeting the needs of the poor was high-priority. In addition, CFUGs in two CFs collected medicinal plants, leaves (Dipterocarpus tuberculatus), bamboo, and bamboo shoots; however, neither of these CFUGs collected firewood. Overall, CFUGs in 17 CFs (i.e., 15 CFs and two CFs) extracted forest resources for subsistence needs such as cooking.
Among the 24 CFs (Table 2), two did not have a CF chairman or conduct CF activities. There was one CF that had a CF chairman, but no CF activities had been conducted since the establishment of this CF. The other 21 CFs have conducted CF activities, including planting, patrolling, wildfire protection, and participation in the training program. In these 21 CFs, three did not have a CF chairman. The CF chairmen of 13 of the 18 CFs with a CF chairman have managed, organized, and participated in CF activities. The CF chairmen of the other five CFs have not participated in CF activities.
Table 2.
Characteristics of 24 CFs.
In 11 of the 13 CFs in which the CF chairmen have managed, organized, and participated in the CF activities, more than one CF activity has been implemented since the CF’s establishment. Although several CF activities ceased a few years after CF establishment, 12 CFs among these 13 CFs have continued to carry out at least one CF activity. One CF among the 13 CFs stopped all CF activities, but did conduct planting and patrolling when the CF was first established. We thus categorized this CF as “weak leadership,” and we assigned “strong leadership” to the other 12 CFs in which the CF chairman participated in CF activities. “Weak leadership” was also assigned to all other remaining CFs.
4.2. Factors Affecting Deforestation
There were 23 models with ∆AIC values of less than four (Table 3). Distance to the nearest village and slope were present in all models. Distance to the CF boundary was present in 22 models. The remaining variables were in six models. Distances to the nearest village, slope, and distance to the CF boundary were the most important variables, followed by elevation, forest cover ratio, and leadership (Figure 2). Distance to the nearest village and slope were negatively related with the probability of deforestation, whereas distance to the CF boundary was positively related to the probability of deforestation (Figure 3). Elevation was negatively related to the probability of deforestation in CFs, but the 95% confidence interval included both positive and negative parameter estimates. Leadership was positively related to the probability of deforestation but with a 95% confidence interval that spanned both positive and negative parameter estimates. The coefficients of community characteristics other than leadership also had 95% confidence intervals that encompassed both positive and negative parameter estimates.
Table 3.
AIC model ranking of the component models.
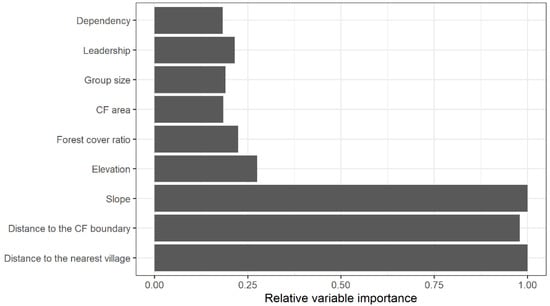
Figure 2.
Relative importance of independent variables.
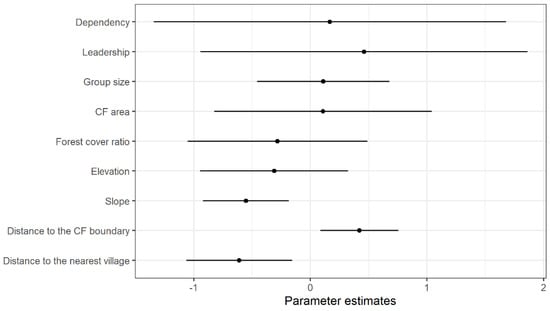
Figure 3.
Parameter estimates of independent variables used for model averaging. Black dots and lines represent coefficient estimates and 95% confidence intervals, respectively.
5. Discussion
In this study, the effects of geographical factors and community characteristics on deforestation in CFs in two watershed conservation forests in Myanmar were examined. Three geographical factors (distance to the nearest village, slope, and distance to the community forestry boundary) strongly affected the probability of deforestation. The two most important variables, distances to the nearest village and slope, are both related to forest accessibility. Distance to the nearest village was negatively related to deforestation, indicating that forests located closer to human settlements are more likely to experience deforestation. This result is consistent with similar studies conducted in Myanmar [52,54,87], Indonesia [88], and Mexico [29]. Slope is also known to affect the probability of deforestation [88,89,90,91]. In this study, slope was negatively related to deforestation, indicating that forest loss was higher in areas with lower slopes. This makes sense given that gentle slopes facilitate human activities such as firewood extraction and agricultural expansion.
Distance to the CF boundary showed a similar relative variable importance as distance to the nearest village and slope. Distance to the CF boundary was positively related to deforestation, which suggests that deforestation was more likely to occur far from the CF boundary. This is likely explained by the patrols of CFUGs being concentrated near the edge of the CFs, which were more accessible. CFs are typically demarcated by prominent features in the landscape, such as villages, roads, and streams. Thus, the edges of CFs are often more accessible than the CF interior and can be more easily patrolled; this also explains why illegal logging may occur in areas far from the CF boundary. A similar pattern was observed in a previous study showing that the probability of deforestation was high in closed forests located far from a national park in Myanmar [54]. Regular patrolling both along the CF boundary and inside CFs is thus essential for slowing deforestation in CFs.
Leadership was the most important factor among community characteristics. Leadership was positively related to deforestation, which indicates that the absence of leadership or weak leadership increased the probability of deforestation. Consistent with previous studies emphasizing the importance of leadership [26,38,66], this study confirmed that leadership contributes to deforestation. However, the 95% confidence interval of the parameter estimate for leadership included both positive and negative values. Thus, there is still some uncertainty regarding the effectiveness of leadership in our study area.
Previous studies on CFs and collective action have examined the effects of group size (e.g., [24,32]). In this study, group size was positively related to deforestation. However, the 95% confidence interval of the parameter estimate of group size included both positive and negative values, and its relative importance was the second lowest among all variables. Similar results were obtained by a country-scale analysis of forest cover change in CFs in Cambodia. Why group size was not an important variable remains unclear. One possible reason is that the forest use by CFUGs made a limited contribution to deforestation. Firewood collection was the main forest use in this study, and the demand for firewood is likely positively correlated with group size given that firewood is a material that is used on a daily basis by the local people. Thus, group size may reflect the intensity of firewood collection. Previous studies have shown that firewood collection might not be a direct cause of deforestation, especially in Myanmar [9], where firewood collection is a major cause of forest degradation [92,93,94]. This stems from the fact that the cutting of trees for firewood collection is highly selective: only a few tree species and sizes are typically cut [9]. Thus, the lack of importance of group size in our analysis might be explained by our study’s focus on deforestation, which does not capture the effects of selective cutting. The low relative importance of forest dependency also supports this hypothesis, as forest dependency was largely driven by firewood collection in our study.
Although we considered the potential effects of both geographical factors and community characteristics on deforestation, geographical factors were more closely tied to the probability of deforestation. This may be explained by our focus on deforestation. Although community characteristics made limited contributions to deforestation based on our analysis, they might actually play important roles in forest degradation. Monitoring forest degradation through satellite remote sensing is technically more difficult than monitoring deforestation [95,96], and improved methods are currently being developed (e.g., [97]). There is thus a need to develop forest degradation monitoring tools to characterize the importance of community characteristics for CF management.
6. Conclusions
This study examined the relative importance of geographical factors and community characteristics in regard to affecting deforestation in CFs. We found that three geographical factors strongly affected the likelihood of deforestation. Of these, distance to the nearest village and slope were the most important variables, which were associated with forest accessibility. We also found that community characteristics were low in relative importance, but leadership was the most important factor among community characteristics. We conclude that forest accessibility is a more important predictor of the probability of deforestation than the other factors. Therefore, the locations of CFs should receive increased consideration when new CFs are established.
Author Contributions
K.T.W.K. and T.O. performed the analysis and wrote the manuscript. N.M. supervised the research, provided comments and feedback, and reviewed drafts of the manuscript. All authors have read and agreed to the published version of the manuscript.
Funding
This study was funded by JSPS KAKENHI (grant number JP23405029, JP17H01477, and JP19H04339) and a Grant for Environmental Research Projects from the Sumitomo Foundation.
Informed Consent Statement
Informed consent was obtained from all subjects involved in the study.
Acknowledgments
We thank the Ministry of Education, Culture, Sports, Science, and Technology (MEXT) of Japan, which provided a scholarship to Khin Thu Wint Kyaw. We also thank the Myanmar Forest Department for their support during fieldwork. We thank Edanz Group (https://en-author-services.edanz.com/ac (accessed on 31 May 2020)) for editing drafts of this manuscript.
Conflicts of Interest
The authors declare no conflict of interest.
References
- FAO. Global Forest Resources Assessment 2020—Key Findings; FAO: Rome, Italy, 2020. [Google Scholar]
- Baccini, A.; Walker, W.; Carvalho, L.; Farina, M.; Sulla-Menashe, D.; Houghton, R.A. Tropical forests are a net carbon source based on aboveground measurements of gain and loss. Science 2017, 358, 230–234. [Google Scholar] [CrossRef]
- Lewis, S.L.; Edwards, D.P.; Galbraith, D. Increasing human dominance of tropical forests. Science 2015, 349, 827–832. [Google Scholar] [CrossRef]
- Newbold, T.; Hudson, L.N.; Phillips, H.R.P.; Hill, S.L.L.; Contu, S.; Lysenko, I.; Blandon, A.; Butchart, S.H.M.; Booth, H.L.; Day, J.; et al. A global model of the response of tropical and sub-tropical forest biodiversity to anthropogenic pressures. Proc. R. Soc. B Biol. Sci. 2014, 281, 20141371. [Google Scholar] [CrossRef]
- Alkama, R.; Cescatti, A. Biophysical climate impacts of recent changes in global forest cover. Science 2016, 351, 600–604. [Google Scholar] [CrossRef]
- Costa, M.H.; Foley, J.A. Combined Effects of Deforestation and Doubled Atmospheric CO 2 Concentrations on the Climate of Amazonia. J. Clim. 2000, 13, 18–34. [Google Scholar] [CrossRef]
- Lawrence, D.; Vandecar, K. Effects of tropical deforestation on climate and agriculture. Nat. Clim. Chang. 2015, 5, 27–36. [Google Scholar] [CrossRef]
- Kyaw, K.T.W.; Ota, T.; Mizoue, N. Forest degradation impacts firewood consumption patterns: A case study in the buffer zone of Inlay Lake Biosphere Reserve, Myanmar. Glob. Ecol. Conserv. 2020, 24, e01340. [Google Scholar] [CrossRef]
- Win, Z.C.; Mizoue, N.; Ota, T.; Kajisa, T.; Yoshida, S.; Oo, T.N.; Ma, H. Differences in consumption rates and patterns between firewood and charcoal: A case study in a rural area of Yedashe Township, Myanmar. Biomass Bioenergy 2018, 109, 39–46. [Google Scholar] [CrossRef]
- Robinson, J.G.; Redford, K.H. Measuring the sustainability of hunting in tropical forests. Oryx 1994, 28, 249–256. [Google Scholar] [CrossRef]
- Mamo, G.; Sjaastad, E.; Vedeld, P. Economic dependence on forest resources: A case from Dendi District, Ethiopia. For. Policy Econ. 2007, 9, 916–927. [Google Scholar] [CrossRef]
- Charlery, L.; Walelign, S.Z. Assessing environmental dependence using asset and income measures: Evidence from Nepal. Ecol. Econ. 2015, 118, 40–48. [Google Scholar] [CrossRef]
- Dash, M.; Behera, B.; Rahut, D.B. Determinants of household collection of non-timber forest products (NTFPs) and alternative livelihood activities in Similipal Tiger Reserve, India. For. Policy Econ. 2016, 73, 215–228. [Google Scholar] [CrossRef]
- Burivalova, Z.; Hua, F.; Koh, L.P.; Garcia, C.; Putz, F. A Critical Comparison of Conventional, Certified, and Community Management of Tropical Forests for Timber in Terms of Environmental, Economic, and Social Variables. Conserv. Lett. 2017, 10, 4–14. [Google Scholar] [CrossRef]
- Rasolofoson, R.A.; Ferraro, P.J.; Ruta, G.; Rasamoelina, M.S.; Randriankolona, P.L.; Larsen, H.O.; Jones, J.P.G. Impacts of Community Forest Management on Human Economic Well-Being across Madagascar. Conserv. Lett. 2017, 10, 346–353. [Google Scholar] [CrossRef]
- Gilmour, D. Forty Years of Community-Based Forestry: A Review of Its Extent and Effectiveness; FAO: Rome, Italy, 2016. [Google Scholar]
- Pandit, R.; Bevilacqua, E. Forest users and environmental impacts of community forestry in the hills of Nepal. For. Policy Econ. 2011, 13, 345–352. [Google Scholar] [CrossRef]
- Rasolofoson, R.A.; Ferraro, P.J.; Jenkins, C.N.; Jones, J.P.G. Effectiveness of Community Forest Management at reducing deforestation in Madagascar. Biol. Conserv. 2015, 184, 271–277. [Google Scholar] [CrossRef]
- Santika, T.; Meijaard, E.; Budiharta, S.; Law, E.A.; Kusworo, A.; Hutabarat, J.A.; Indrawan, T.P.; Struebig, M.; Raharjo, S.; Huda, I.; et al. Community forest management in Indonesia: Avoided deforestation in the context of anthropogenic and climate complexities. Glob. Environ. Chang. 2017, 46, 60–71. [Google Scholar] [CrossRef]
- Casse, T.; Milhøj, A. Community Forestry and Forest Conservation: Friends or Strangers? Environ. Policy Gov. 2011, 21, 83–98. [Google Scholar] [CrossRef]
- Min-Venditti, A.A.; Moore, G.W.; Fleischman, F. What policies improve forest cover? A systematic review of research from Mesoamerica. Glob. Environ. Chang. 2017, 47, 21–27. [Google Scholar] [CrossRef]
- Ota, T.; Lonn, P.; Mizoue, N. A country scale analysis revealed effective forest policy affecting forest cover changes in Cambodia. Land Use Policy 2020, 95, 104597. [Google Scholar] [CrossRef]
- Santika, T.; Wilson, K.A.; Budiharta, S.; Kusworo, A.; Meijaard, E.; Law, E.A.; Friedman, R.; Hutabarat, J.A.; Indrawan, T.P.; St. John, F.A.V.; et al. Heterogeneous impacts of community forestry on forest conservation and poverty alleviation: Evidence from Indonesia. People Nat. 2019, 1, 204–219. [Google Scholar] [CrossRef]
- Lonn, P.; Mizoue, N.; Ota, T.; Kajisa, T.; Yoshida, S. Biophysical Factors Affecting Forest Cover Changes in Community Forestry: A Country Scale Analysis in Cambodia. Forests 2018, 9, 273. [Google Scholar] [CrossRef]
- Oldekop, J.A.; Sims, K.R.E.; Karna, B.K.; Whittingham, M.J.; Agrawal, A. Reductions in deforestation and poverty from decentralized forest management in Nepal. Nat. Sustain. 2019, 2, 421–428. [Google Scholar] [CrossRef]
- Pagdee, A.; Kim, Y.; Daugherty, P.J. What Makes Community Forest Management Successful: A Meta-Study From Community Forests Throughout the World. Soc. Nat. Resour. 2006, 19, 33–52. [Google Scholar] [CrossRef]
- Baynes, J.; Herbohn, J.; Smith, C.; Fisher, R.; Bray, D. Key factors which influence the success of community forestry in developing countries. Glob. Environ. Chang. 2015, 35, 226–238. [Google Scholar] [CrossRef]
- Agrawal, A.; Chhatre, A. Explaining success on the commons: Community forest governance in the Indian Himalaya. World Dev. 2006, 34, 149–166. [Google Scholar] [CrossRef]
- Perez-Verdin, G.; Kim, Y.-S.; Hospodarsky, D.; Tecle, A. Factors driving deforestation in common-pool resources in northern Mexico. J. Environ. Manag. 2009, 90, 331–340. [Google Scholar] [CrossRef] [PubMed]
- Thakur, S.; Negi, V.S.; Pathak, R.; Dhyani, R.; Durgapal, K.; Rawal, R.S. Indicator based integrated vulnerability assessment of community forests in Indian west Himalaya. For. Ecol. Manag. 2020, 457, 117674. [Google Scholar] [CrossRef]
- Oldekop, J.A.; Bebbington, A.J.; Brockington, D.; Preziosi, R.F. Understanding the Lessons and Limitations of Conservation and Development. Conserv. Biol. 2010, 24, 461–469. [Google Scholar] [CrossRef] [PubMed]
- Yang, W.; Liu, W.; Vina, A.; Tuanmu, M.-N.; He, G.; Dietz, T.; Liu, J. Nonlinear effects of group size on collective action and resource outcomes. Proc. Natl. Acad. Sci. USA 2013, 110, 10916–10921. [Google Scholar] [CrossRef]
- Dietz, T. The Struggle to Govern the Commons. Science 2003, 302, 1907–1912. [Google Scholar] [CrossRef]
- Jumbe, C.B.L.; Angelsen, A. Forest dependence and participation in CPR management: Empirical evidence from forest co-management in Malawi. Ecol. Econ. 2007, 62, 661–672. [Google Scholar] [CrossRef]
- Okumu, B.; Muchapondwa, E. Determinants of successful collective management of forest resources: Evidence from Kenyan Community Forest Associations. For. Policy Econ. 2020, 113, 102122. [Google Scholar] [CrossRef]
- Soe, K.T.; Yeo-Chang, Y. Perceptions of forest-dependent communities toward participation in forest conservation: A case study in Bago Yoma, South-Central Myanmar. For. Policy Econ. 2019, 100, 129–141. [Google Scholar] [CrossRef]
- Brooks, J.; Waylen, K.; Mulder, M. Assessing community-based conservation projects: A systematic review and multilevel analysis of attitudinal, behavioral, ecological, and economic outcomes. Environ. Evid. 2013, 2, 2. [Google Scholar] [CrossRef]
- Gutiérrez, N.L.; Hilborn, R.; Defeo, O. Leadership, social capital and incentives promote successful fisheries. Nature 2011, 470, 386–389. [Google Scholar] [CrossRef] [PubMed]
- Zulu, L.C. Community forest management in Southern Malawi: Solution or part of the problem? Soc. Nat. Resour. 2008, 21, 687–703. [Google Scholar] [CrossRef]
- Bowler, D.E.; Buyung-Ali, L.M.; Healey, J.R.; Jones, J.P.G.; Knight, T.M.; Pullin, A.S. Does community forest management provide global environmental benefits and improve local welfare? Front. Ecol. Environ. 2012, 10, 29–36. [Google Scholar] [CrossRef]
- Hajjar, R.; Oldekop, J.A. Research frontiers in community forest management. Curr. Opin. Environ. Sustain. 2018, 32, 119–125. [Google Scholar] [CrossRef]
- Putraditama, A.; Kim, Y.-S.; Sánchez Meador, A.J. Community forest management and forest cover change in Lampung, Indonesia. For. Policy Econ. 2019, 106, 101976. [Google Scholar] [CrossRef]
- Department of Population. The 2014 Myanmar Population and Housing Census: The Union Report; Department of Population, Ministry of Immigration and Population: Nay Pyi Taw, Myanmar, 2015; Volume 2. [Google Scholar]
- FAO. Global Forest Resources Assessment 2020: Main Report; FAO: Rome, Italy, 2020. [Google Scholar]
- Bhagwat, T.; Hess, A.; Horning, N.; Khaing, T.; Thein, Z.M.; Aung, K.M.; Aung, K.H.; Phyo, P.; Tun, Y.L.; Oo, A.H.; et al. Losing a jewel—Rapid declines in Myanmar’s intact forests from 2002–2014. PLoS ONE 2017, 12, e0176364. [Google Scholar] [CrossRef]
- Estoque, R.C.; Myint, S.W.; Wang, C.; Ishtiaque, A.; Aung, T.T.; Emerton, L.; Ooba, M.; Hijioka, Y.; Mon, M.S.; Wang, Z.; et al. Assessing environmental impacts and change in Myanmar’s mangrove ecosystem service value due to deforestation (2000–2014). Glob. Chang. Biol. 2018, 24, 5391–5410. [Google Scholar] [CrossRef]
- Shimizu, K.; Ahmed, O.S.; Ponce-Hernandez, R.; Ota, T.; Win, Z.C.; Mizoue, N.; Yoshida, S. Attribution of Disturbance Agents to Forest Change Using a Landsat Time Series in Tropical Seasonal Forests in the Bago Mountains, Myanmar. Forests 2017, 8, 218. [Google Scholar] [CrossRef]
- FAO. Global Forest Resources Assessment 2015: How Are the World’s Forests Changing? 2nd ed.; FAO: Rome, Italy, 2016. [Google Scholar]
- Webb, E.L.; Jachowski, N.R.A.; Phelps, J.; Friess, D.A.; Than, M.M.; Ziegler, A.D. Deforestation in the Ayeyarwady Delta and the conservation implications of an internationally-engaged Myanmar. Glob. Environ. Chang. 2014, 24, 321–333. [Google Scholar] [CrossRef]
- Yang, R.; Luo, Y.; Yang, K.; Hong, L.; Zhou, X. Analysis of forest deforestation and its driving factors in Myanmar from 1988 to 2017. Sustainability 2019, 11, 3047. [Google Scholar] [CrossRef]
- Veettil, B.K.; Pereira, S.F.R.; Quang, N.X. Rapidly diminishing mangrove forests in Myanmar (Burma): A review. Hydrobiologia 2018, 822, 19–35. [Google Scholar] [CrossRef]
- Mon, M.S.; Mizoue, N.; Htun, N.Z.; Kajisa, T.; Yoshida, S. Factors affecting deforestation and forest degradation in selectively logged production forest: A case study in Myanmar. For. Ecol. Manag. 2012, 267, 190–198. [Google Scholar] [CrossRef]
- Leimgruber, P.; Kelly, D.S.; Steininger, M.K.; Brunner, J.; Müller, T.; Songer, M. Forest cover change patterns in Myanmar (Burma) 1990–2000. Environ. Conserv. 2005, 32, 356–364. [Google Scholar] [CrossRef]
- Htun, N.Z.; Mizoue, N.; Yoshida, S. Changes in Determinants of Deforestation and Forest Degradation in Popa Mountain Park, Central Myanmar. Environ. Manag. 2013, 51, 423–434. [Google Scholar] [CrossRef]
- Akamani, K.; Wilson, P.I.; Hall, T.E. Barriers to collaborative forest management and implications for building the resilience of forest-dependent communities in the Ashanti region of Ghana. J. Environ. Manag. 2015, 151, 11–21. [Google Scholar] [CrossRef] [PubMed]
- Nerfa, L.; Rhemtulla, J.M.; Zerriffi, H. Forest dependence is more than forest income: Development of a new index of forest product collection and livelihood resources. World Dev. 2020, 125, 104689. [Google Scholar] [CrossRef]
- Power, T.M. Public Timber Supply, Market Adjustments, and Local Economies: Economic Assumptions of the Northwest Forest Plan. Conserv. Biol. 2006, 20, 341–350. [Google Scholar] [CrossRef] [PubMed]
- Gatiso, T.T. Households’ dependence on community forest and their contribution to participatory forest management: Evidence from rural Ethiopia. Environ. Dev. Sustain. 2019, 21, 181–197. [Google Scholar] [CrossRef]
- Lise, W. Factors influencing people’s participation in forest management in India. Ecol. Econ. 2000, 34, 379–392. [Google Scholar] [CrossRef]
- Balooni, K.; Ballabh, V.; Inoue, M. Declining instituted collective management practices and forest quality in the central Himalayas. Econ. Polit. Wkly. 2007, 42, 1443–1452. [Google Scholar]
- Chhatre, A.; Agrawal, A. Forest commons and local enforcement. Proc. Natl. Acad. Sci. USA 2008, 105, 13286–13291. [Google Scholar] [CrossRef] [PubMed]
- Gibson, C.C.; Williams, J.T.; Ostrom, E. Local enforcement and better forests. World Dev. 2005, 33, 273–284. [Google Scholar] [CrossRef]
- Hlaing, E.E.S.; Inoue, M. Factors affecting participation of user group members: Comparative studies on two types of community forestry in the Dry Zone, Myanmar. J. For. Res. 2013, 18, 60–72. [Google Scholar] [CrossRef]
- Feurer, M.; Gritten, D.; Than, M. Community Forestry for Livelihoods: Benefiting from Myanmar’s Mangroves. Forests 2018, 9, 150. [Google Scholar] [CrossRef]
- Evans, L.S.; Hicks, C.C.; Cohen, P.J.; Case, P.; Prideaux, M.; Mills, D.J. Understanding leadership in the environmental sciences. Ecol. Soc. 2015, 20, 50. [Google Scholar] [CrossRef]
- Van Laerhoven, F. Governing community forests and the challenge of solving two-level collective action dilemmas—A large-N perspective. Glob. Environ. Chang. 2010, 20, 539–546. [Google Scholar] [CrossRef]
- Barcelo, H.; Capraro, V. Group size effect on cooperation in one-shot social dilemmas. Sci. Rep. 2015, 5, 7937. [Google Scholar] [CrossRef]
- Capraro, V.; Barcelo, H. Group size effect on cooperation in one-shot social dilemmas II: Curvilinear Effect. PLoS ONE 2015, 10, e0131419. [Google Scholar] [CrossRef]
- Pereda, M.; Capraro, V.; Sánchez, A. Group size effects and critical mass in public goods games. Sci. Rep. 2019, 9, 5503. [Google Scholar] [CrossRef]
- Agrawal, A. Common Property Institutions and Sustainable Governance of Resources. World Dev. 2001, 29, 1649–1672. [Google Scholar] [CrossRef]
- Negi, S.; Pham, T.; Karky, B.; Garcia, C. Role of Community and User Attributes in Collective Action: Case Study of Community-Based Forest Management in Nepal. Forests 2018, 9, 136. [Google Scholar] [CrossRef]
- Nagendra, H.; Karmacharya, M.; Karna, B. Evaluating Forest Management in Nepal: Views across Space and Time. Ecol. Soc. 2005, 10, art24. [Google Scholar] [CrossRef]
- Lin, H. Community Forestry Initiatives in Myanmar: An Analysis from a Social Perspective. Int. For. Rev. 2005, 7, 27–36. [Google Scholar] [CrossRef]
- Thin, M.M.; Setti, M.; Sacchi, E.; Re, V.; Riccardi, M.P.; Allais, E. Mineralogical and geochemical characterisation of alkaline lake sediments to trace origin, depositional processes, and anthropogenic impacts: Inle Lake (Southern Shan State, Myanmar). Environ. Earth Sci. 2020, 79, 166. [Google Scholar] [CrossRef]
- Michalon, M.; Gunnell, Y.; Lejot, J.; Mialhe, F.; Aung, T. Accelerated degradation of Lake Inle (Myanmar): A baseline study for environmentalists and developers. Land Degrad. Dev. 2019, 30, 928–941. [Google Scholar] [CrossRef]
- Re, V.; Thin, M.M.; Setti, M.; Comizzoli, S.; Sacchi, E. Present status and future criticalities evidenced by an integrated assessment of water resources quality at catchment scale: The case of Inle Lake (Southern Shan state, Myanmar). Appl. Geochem. 2018, 92, 82–93. [Google Scholar] [CrossRef]
- Aung, P.P.; Mao, Y.; Hu, T.; Qi, S.; Tian, Q.; Chen, Z.; Xing, X. Metal concentrations and pollution assessment in bottom sediments from Inle Lake, Myanmar. J. Geochem. Explor. 2019, 207, 106357. [Google Scholar] [CrossRef]
- Thematic Mapping. Available online: http://thematicmapping.org/ (accessed on 31 May 2020).
- MIMU. Available online: http://geonode.themimu.info/layers/?limit=100&offset=0 (accessed on 31 May 2020).
- Global Forest Change. Available online: https://earthenginepartners.appspot.com/science-2013-global-forest/download_v1.7.html (accessed on 9 August 2020).
- Hansen, M.C.; Potapov, P.V.; Moore, R.; Hancher, M.; Turubanova, S.A.; Tyukavina, A.; Thau, D.; Stehman, S.V.V.; Goetz, S.J.J.; Loveland, T.R.R.; et al. High-Resolution Global Maps of 21st-Century Forest Cover Change. Science 2013, 342, 850–853. [Google Scholar] [CrossRef] [PubMed]
- Lwin, K.K.; Ota, T.; Shimizu, K.; Mizoue, N. Assessing the Importance of Tree Cover Threshold for Forest Cover Mapping Derived from Global Forest Cover in Myanmar. Forests 2019, 10, 1062. [Google Scholar] [CrossRef]
- USGS. Available online: https://earthexplorer.usgs.gov/ (accessed on 13 May 2020).
- Bates, D.; Mächler, M.; Bolker, B.; Walker, S. Fitting Linear Mixed-Effects Models Using lme4. J. Stat. Softw. 2015, 67, 1–48. [Google Scholar] [CrossRef]
- R Core Team: A Language and Environment for Statistical Computing. Available online: https://www.r-project.org/ (accessed on 1 August 2020).
- Barton, K.; MuMIn: Multi-Model Inference. R Package Version 1.43.17. Available online: https://cran.r-project.org/package=MuMIn (accessed on 1 August 2020).
- Mon, M.S.; Kajisa, T.; Mizoue, N.; Yoshida, S. Factors Affecting Deforestation in Paunglaung Watershed, Myanmar using Remote Sensing and GIS. J. For. Plan. 2009, 14, 7–16. [Google Scholar] [CrossRef]
- Nugroho, H.Y.S.H.; van der Veen, A.; Skidmore, A.K.; Hussin, Y.A. Expansion of traditional land-use and deforestation: A case study of an adat forest in the Kandilo Subwatershed, East Kalimantan, Indonesia. J. For. Res. 2018, 29, 495–513. [Google Scholar] [CrossRef]
- Alix-Garcia, J. A spatial analysis of common property deforestation. J. Environ. Econ. Manag. 2007, 53, 141–157. [Google Scholar] [CrossRef]
- Busch, J.; Ferretti-Gallon, K. What Drives Deforestation and What Stops It? A Meta-Analysis. Rev. Environ. Econ. Policy 2017, 11, 3–23. [Google Scholar] [CrossRef]
- Nüchel, J.; Bøcher, P.K.; Svenning, J.-C. Topographic slope steepness and anthropogenic pressure interact to shape the distribution of tree cover in China. Appl. Geogr. 2019, 103, 40–55. [Google Scholar] [CrossRef]
- Démurger, S.; Fournier, M. Poverty and firewood consumption: A case study of rural households in northern China. China Econ. Rev. 2011, 22, 512–523. [Google Scholar] [CrossRef]
- Heltberg, R.; Arndt, T.C.; Sekhar, N.U. Fuelwood Consumption and Forest Degradation: A Household Model for Domestic Energy Substitution in Rural India. Land Econ. 2000, 76, 213–232. [Google Scholar] [CrossRef]
- Specht, M.J.; Pinto, S.R.R.; Albuquerque, U.P.; Tabarelli, M.; Melo, F.P.L. Burning biodiversity: Fuelwood harvesting causes forest degradation in human-dominated tropical landscapes. Glob. Ecol. Conserv. 2015, 3, 200–209. [Google Scholar] [CrossRef]
- Dupuis, C.; Lejeune, P.; Michez, A.; Fayolle, A. How Can Remote Sensing Help Monitor Tropical Moist Forest Degradation?—A Systematic Review. Remote Sens. 2020, 12, 1087. [Google Scholar] [CrossRef]
- Gao, Y.; Skutsch, M.; Paneque-Gálvez, J.; Ghilardi, A. Remote sensing of forest degradation: A review. Environ. Res. Lett. 2020, 15, 103001. [Google Scholar] [CrossRef]
- Bullock, E.L.; Woodcock, C.E.; Olofsson, P. Monitoring tropical forest degradation using spectral unmixing and Landsat time series analysis. Remote Sens. Environ. 2020, 238, 110968. [Google Scholar] [CrossRef]
Publisher’s Note: MDPI stays neutral with regard to jurisdictional claims in published maps and institutional affiliations. |
© 2021 by the authors. Licensee MDPI, Basel, Switzerland. This article is an open access article distributed under the terms and conditions of the Creative Commons Attribution (CC BY) license (https://creativecommons.org/licenses/by/4.0/).