
Understanding the Impact of Different Landscape-Level Fuel Management Strategies on Wildfire Hazard in Central Portugal


Abstract
1. Introduction
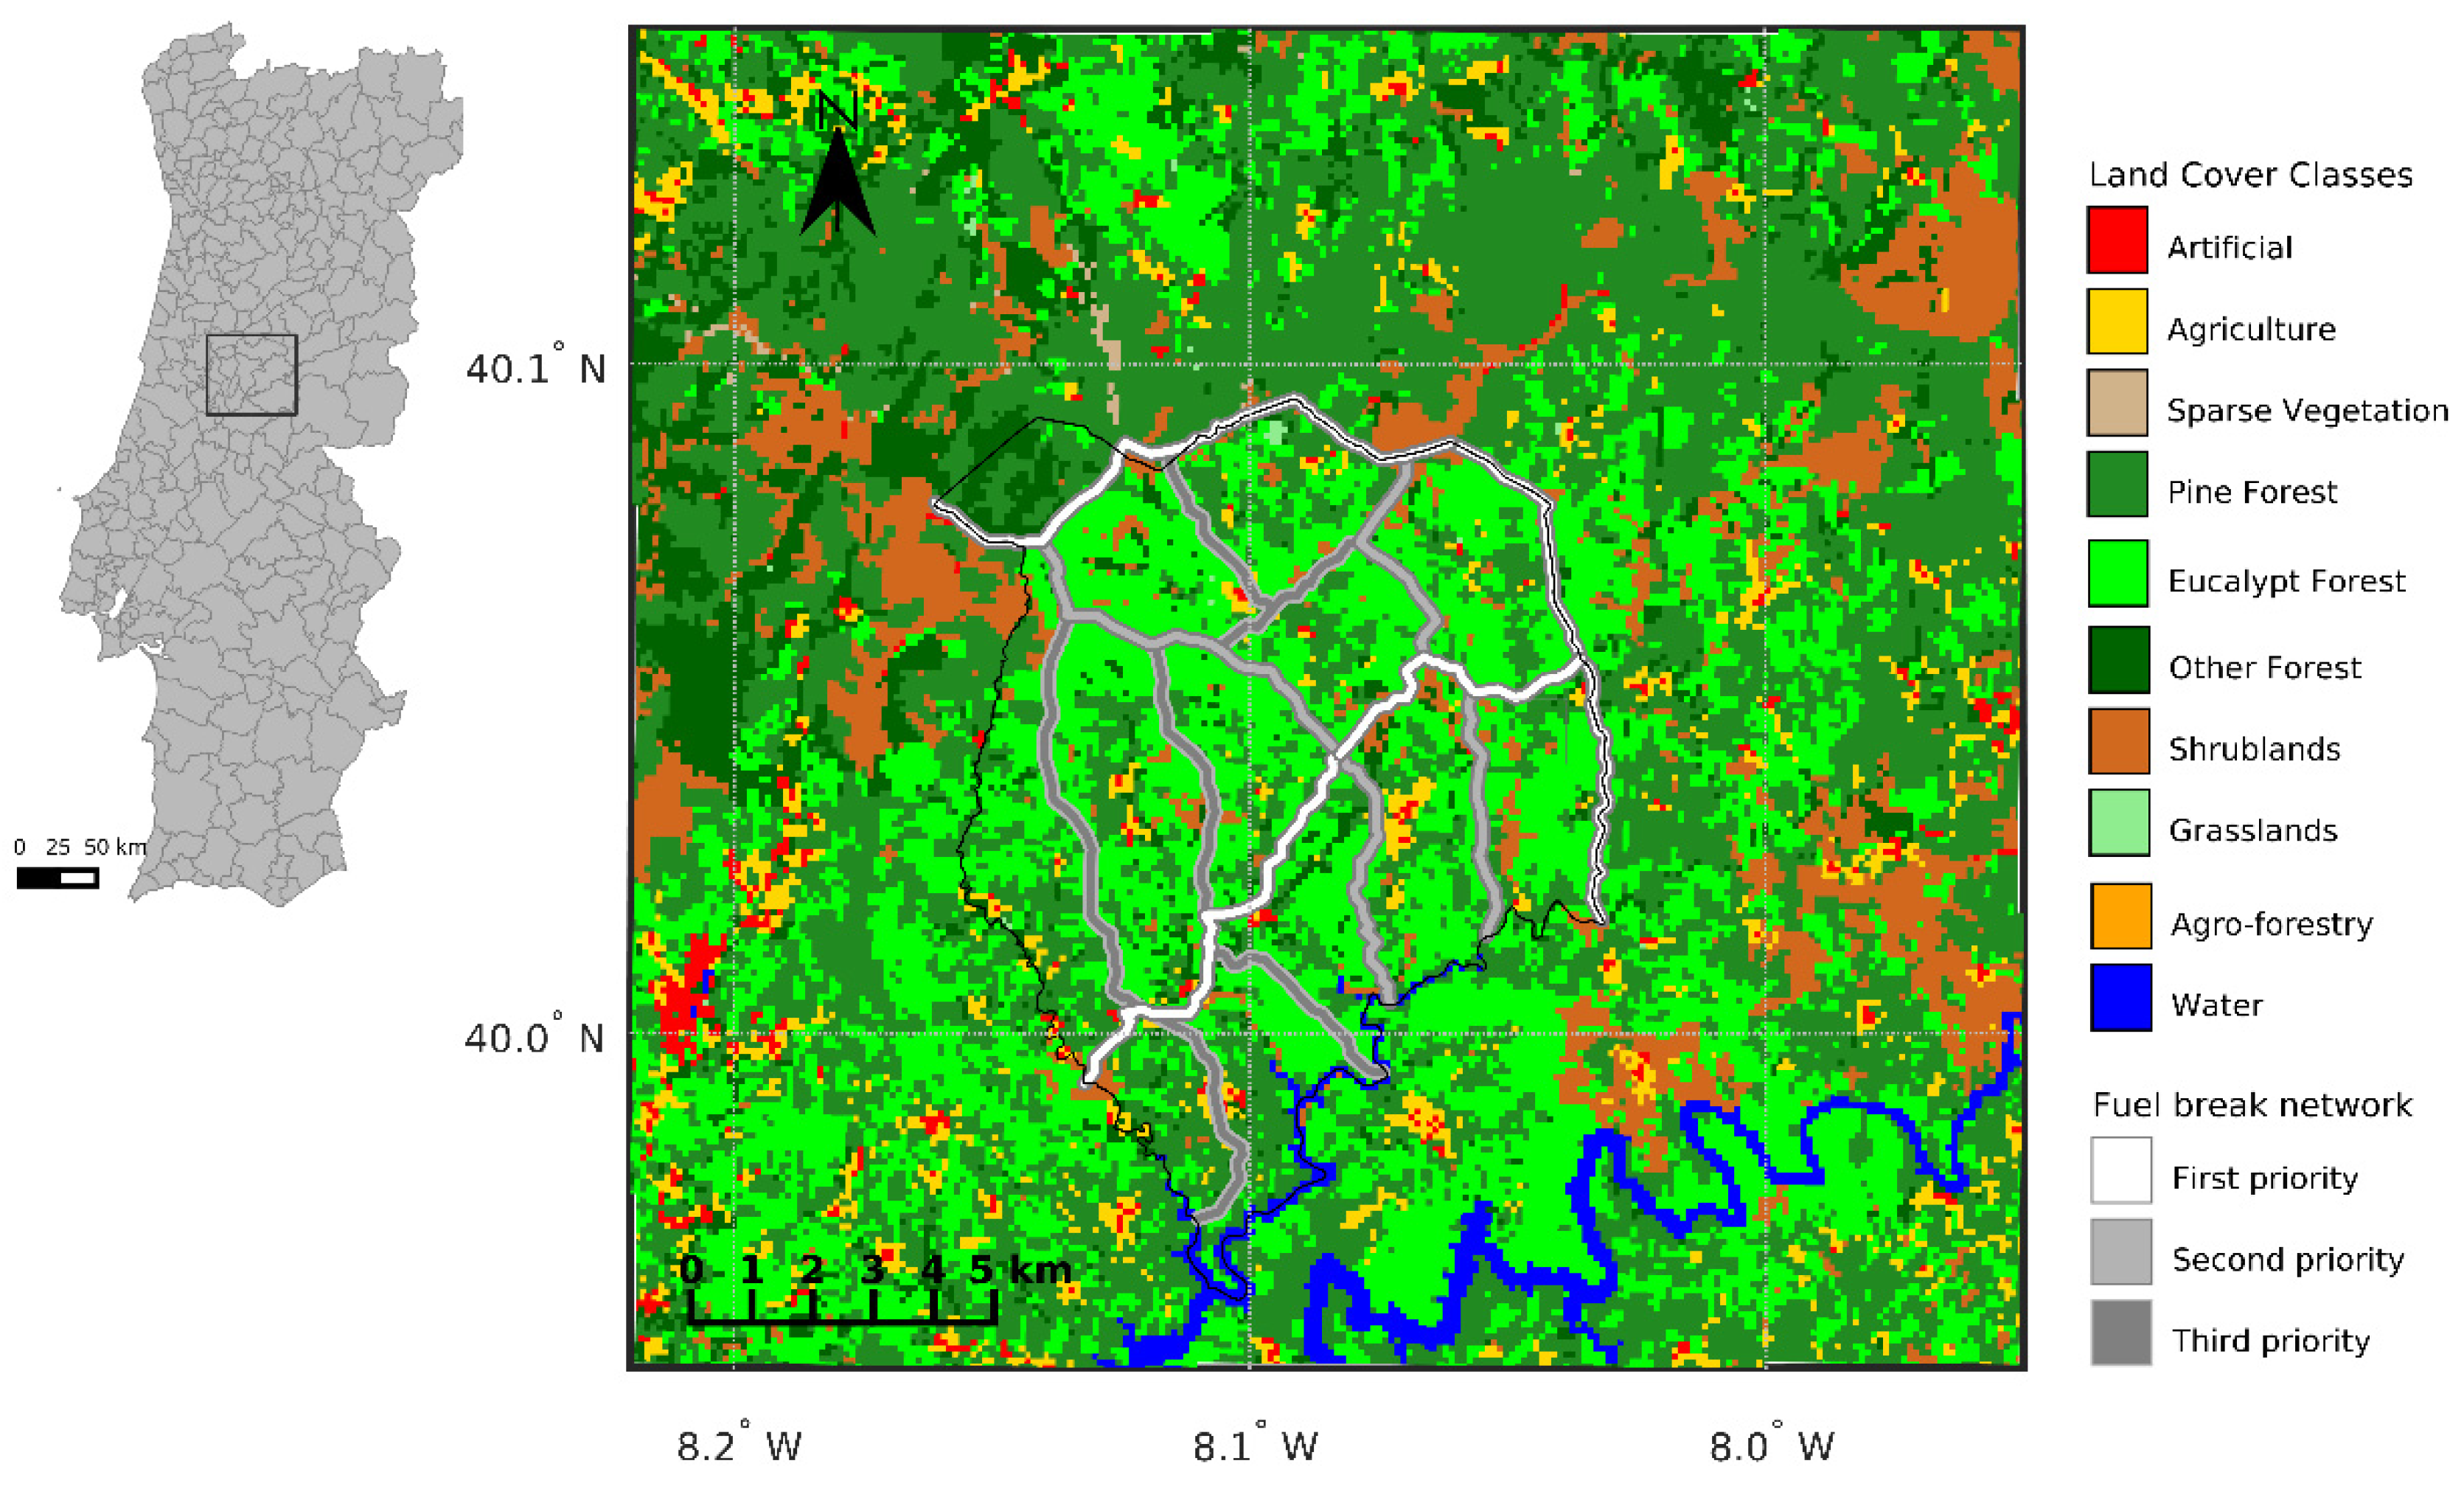
2. Study Area
3. Materials and Methods
3.1. Fire Spread Simulation
3.1.1. Data and Modeling Approach
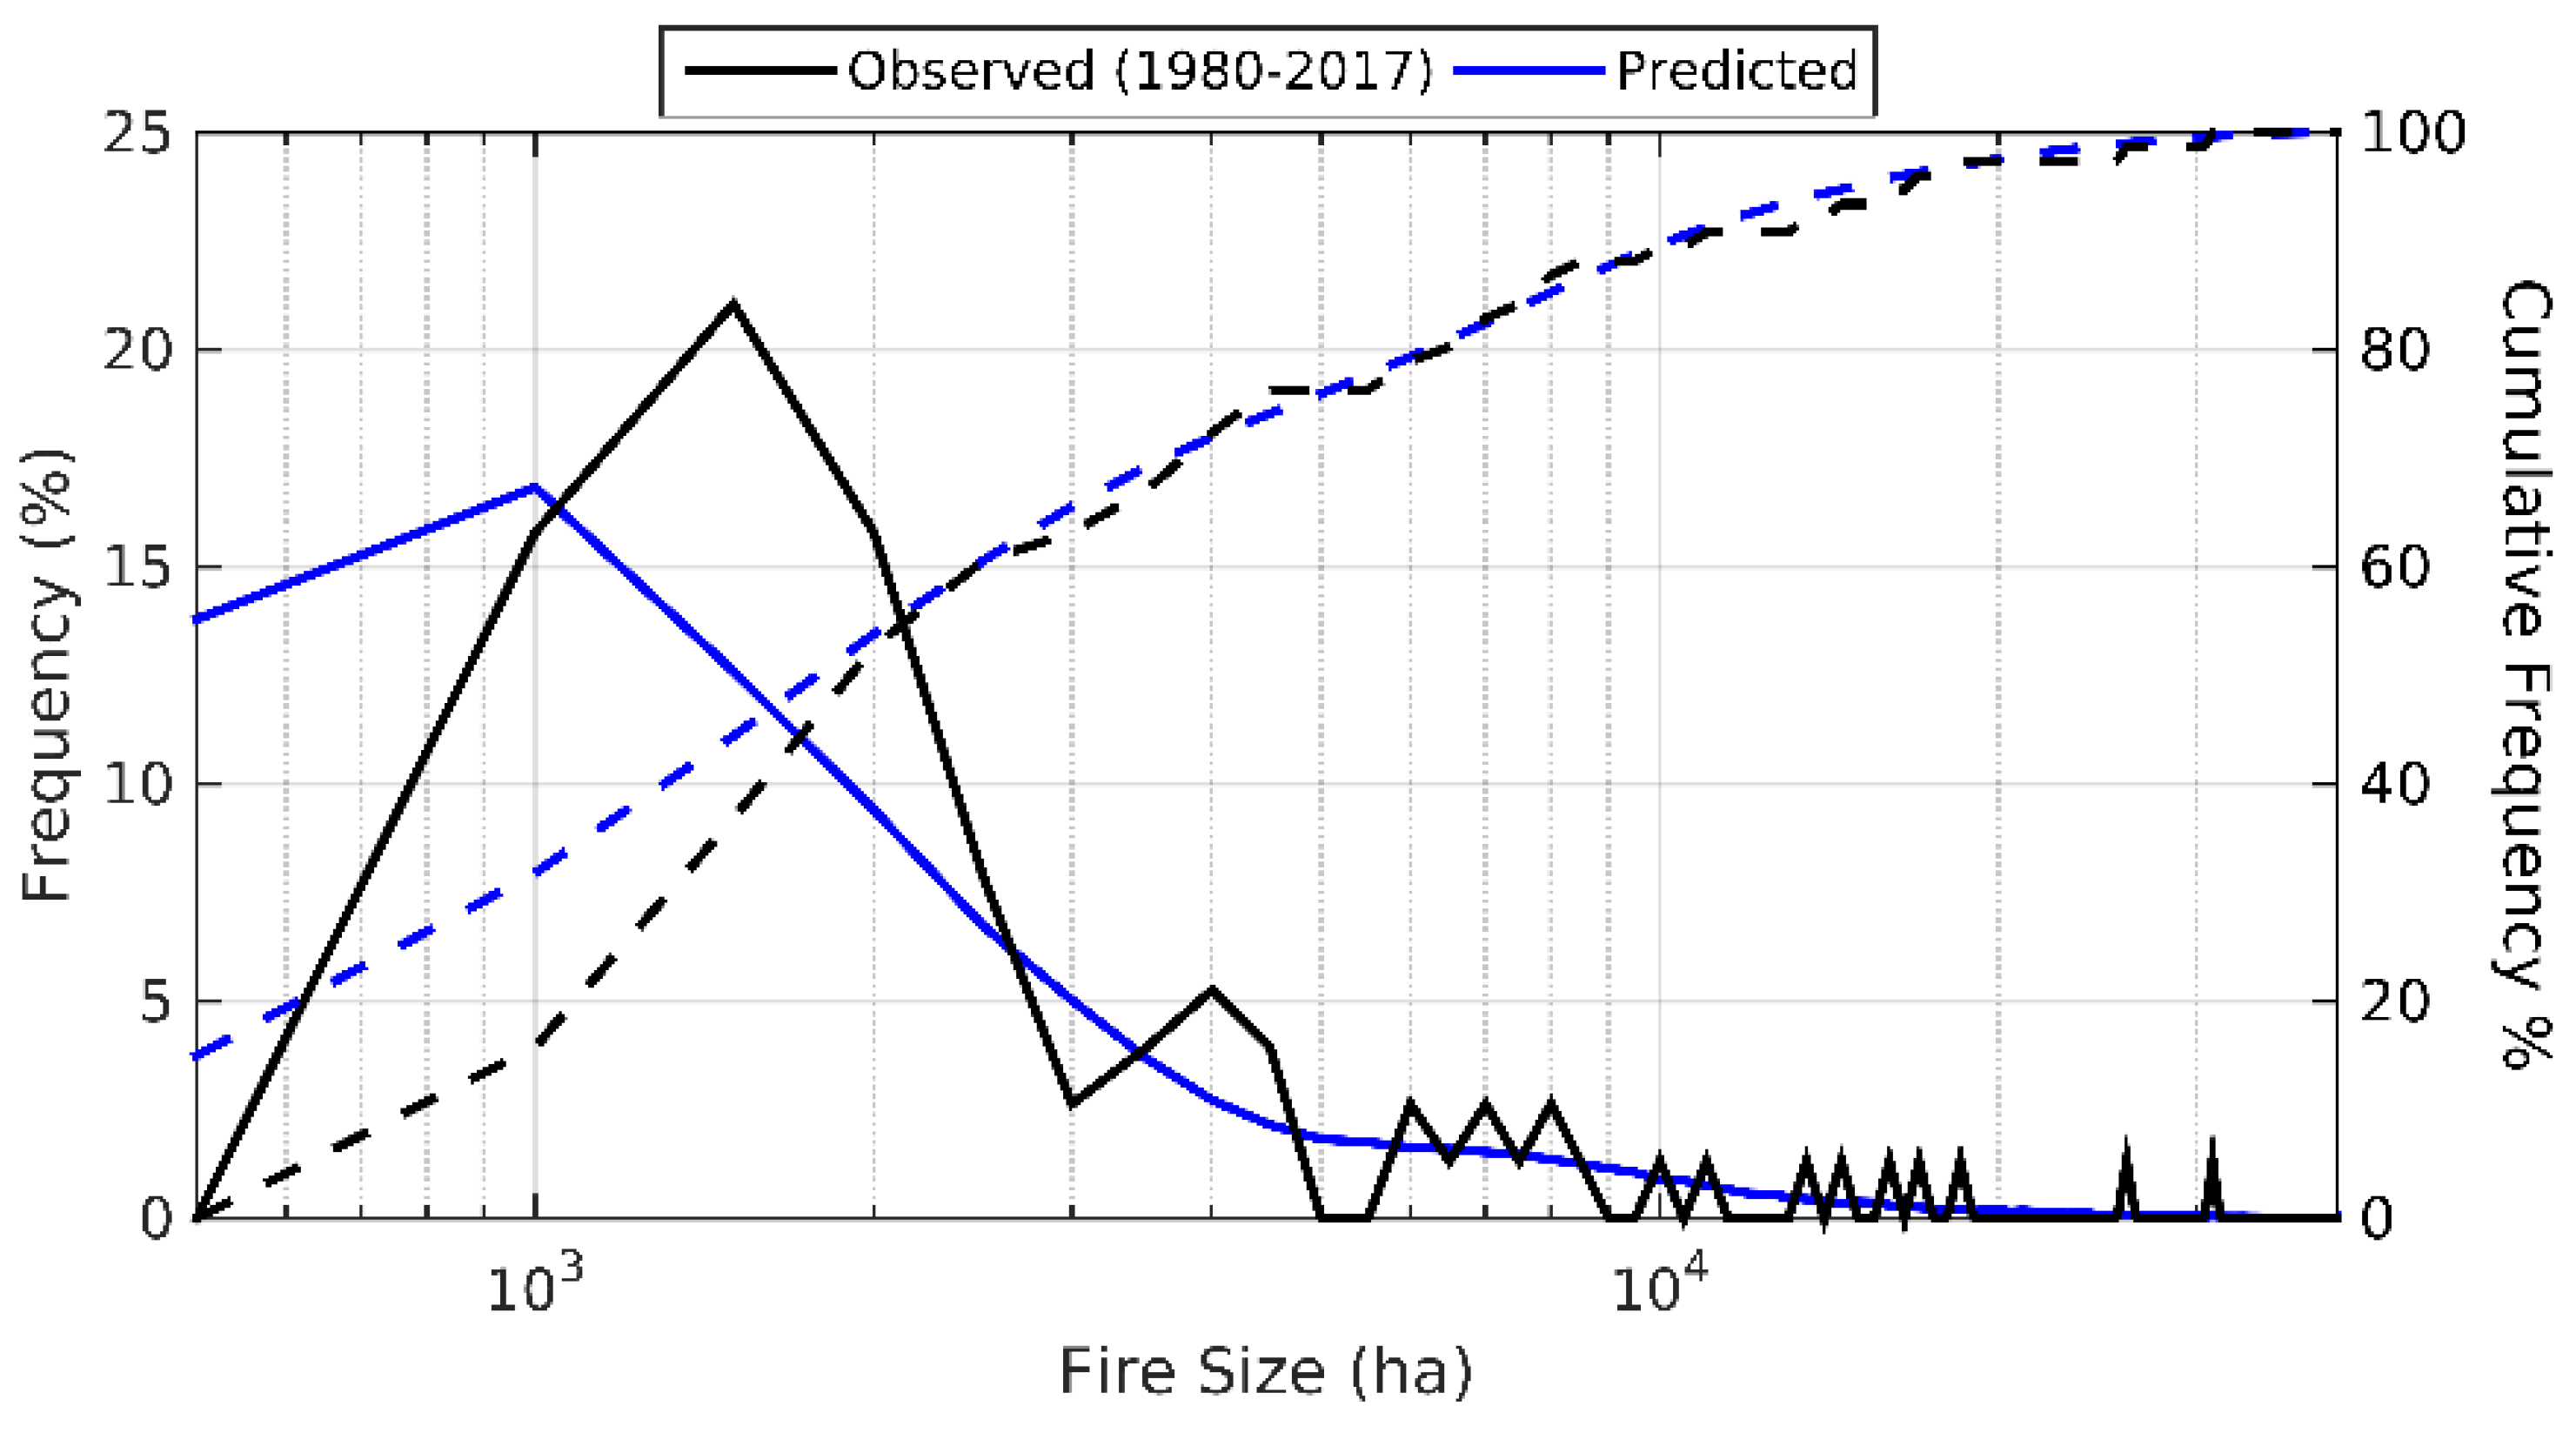
3.1.2. Model Calibration
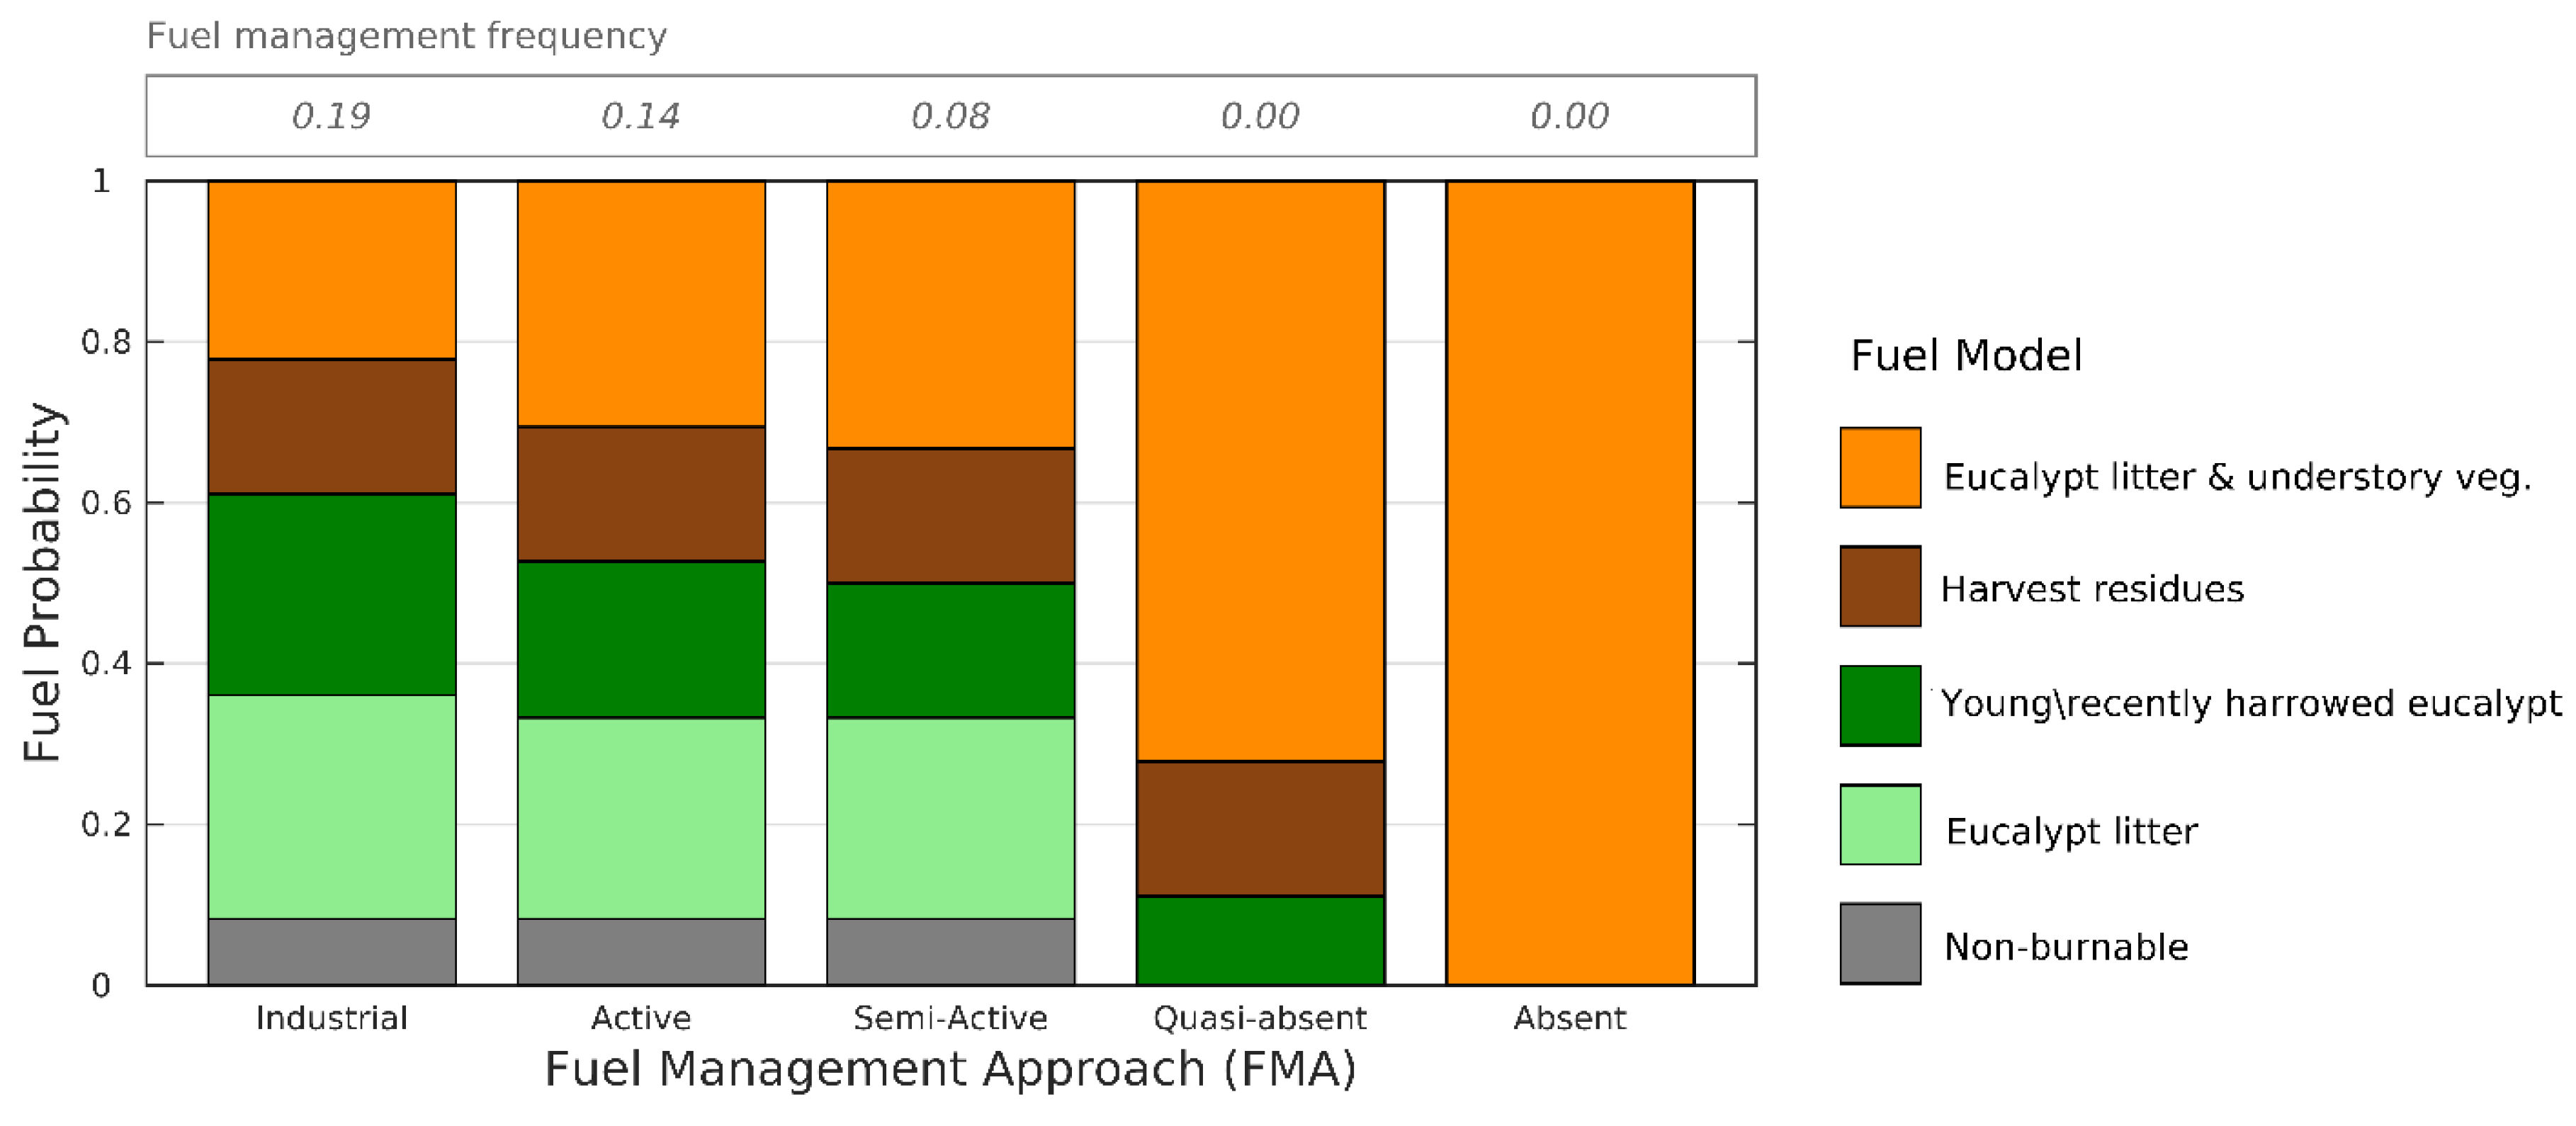
3.2. Fuel Management Scenarios
3.3. Simulating the Different Fuel Management Scenarios
4. Results
4.1. Model Calibration
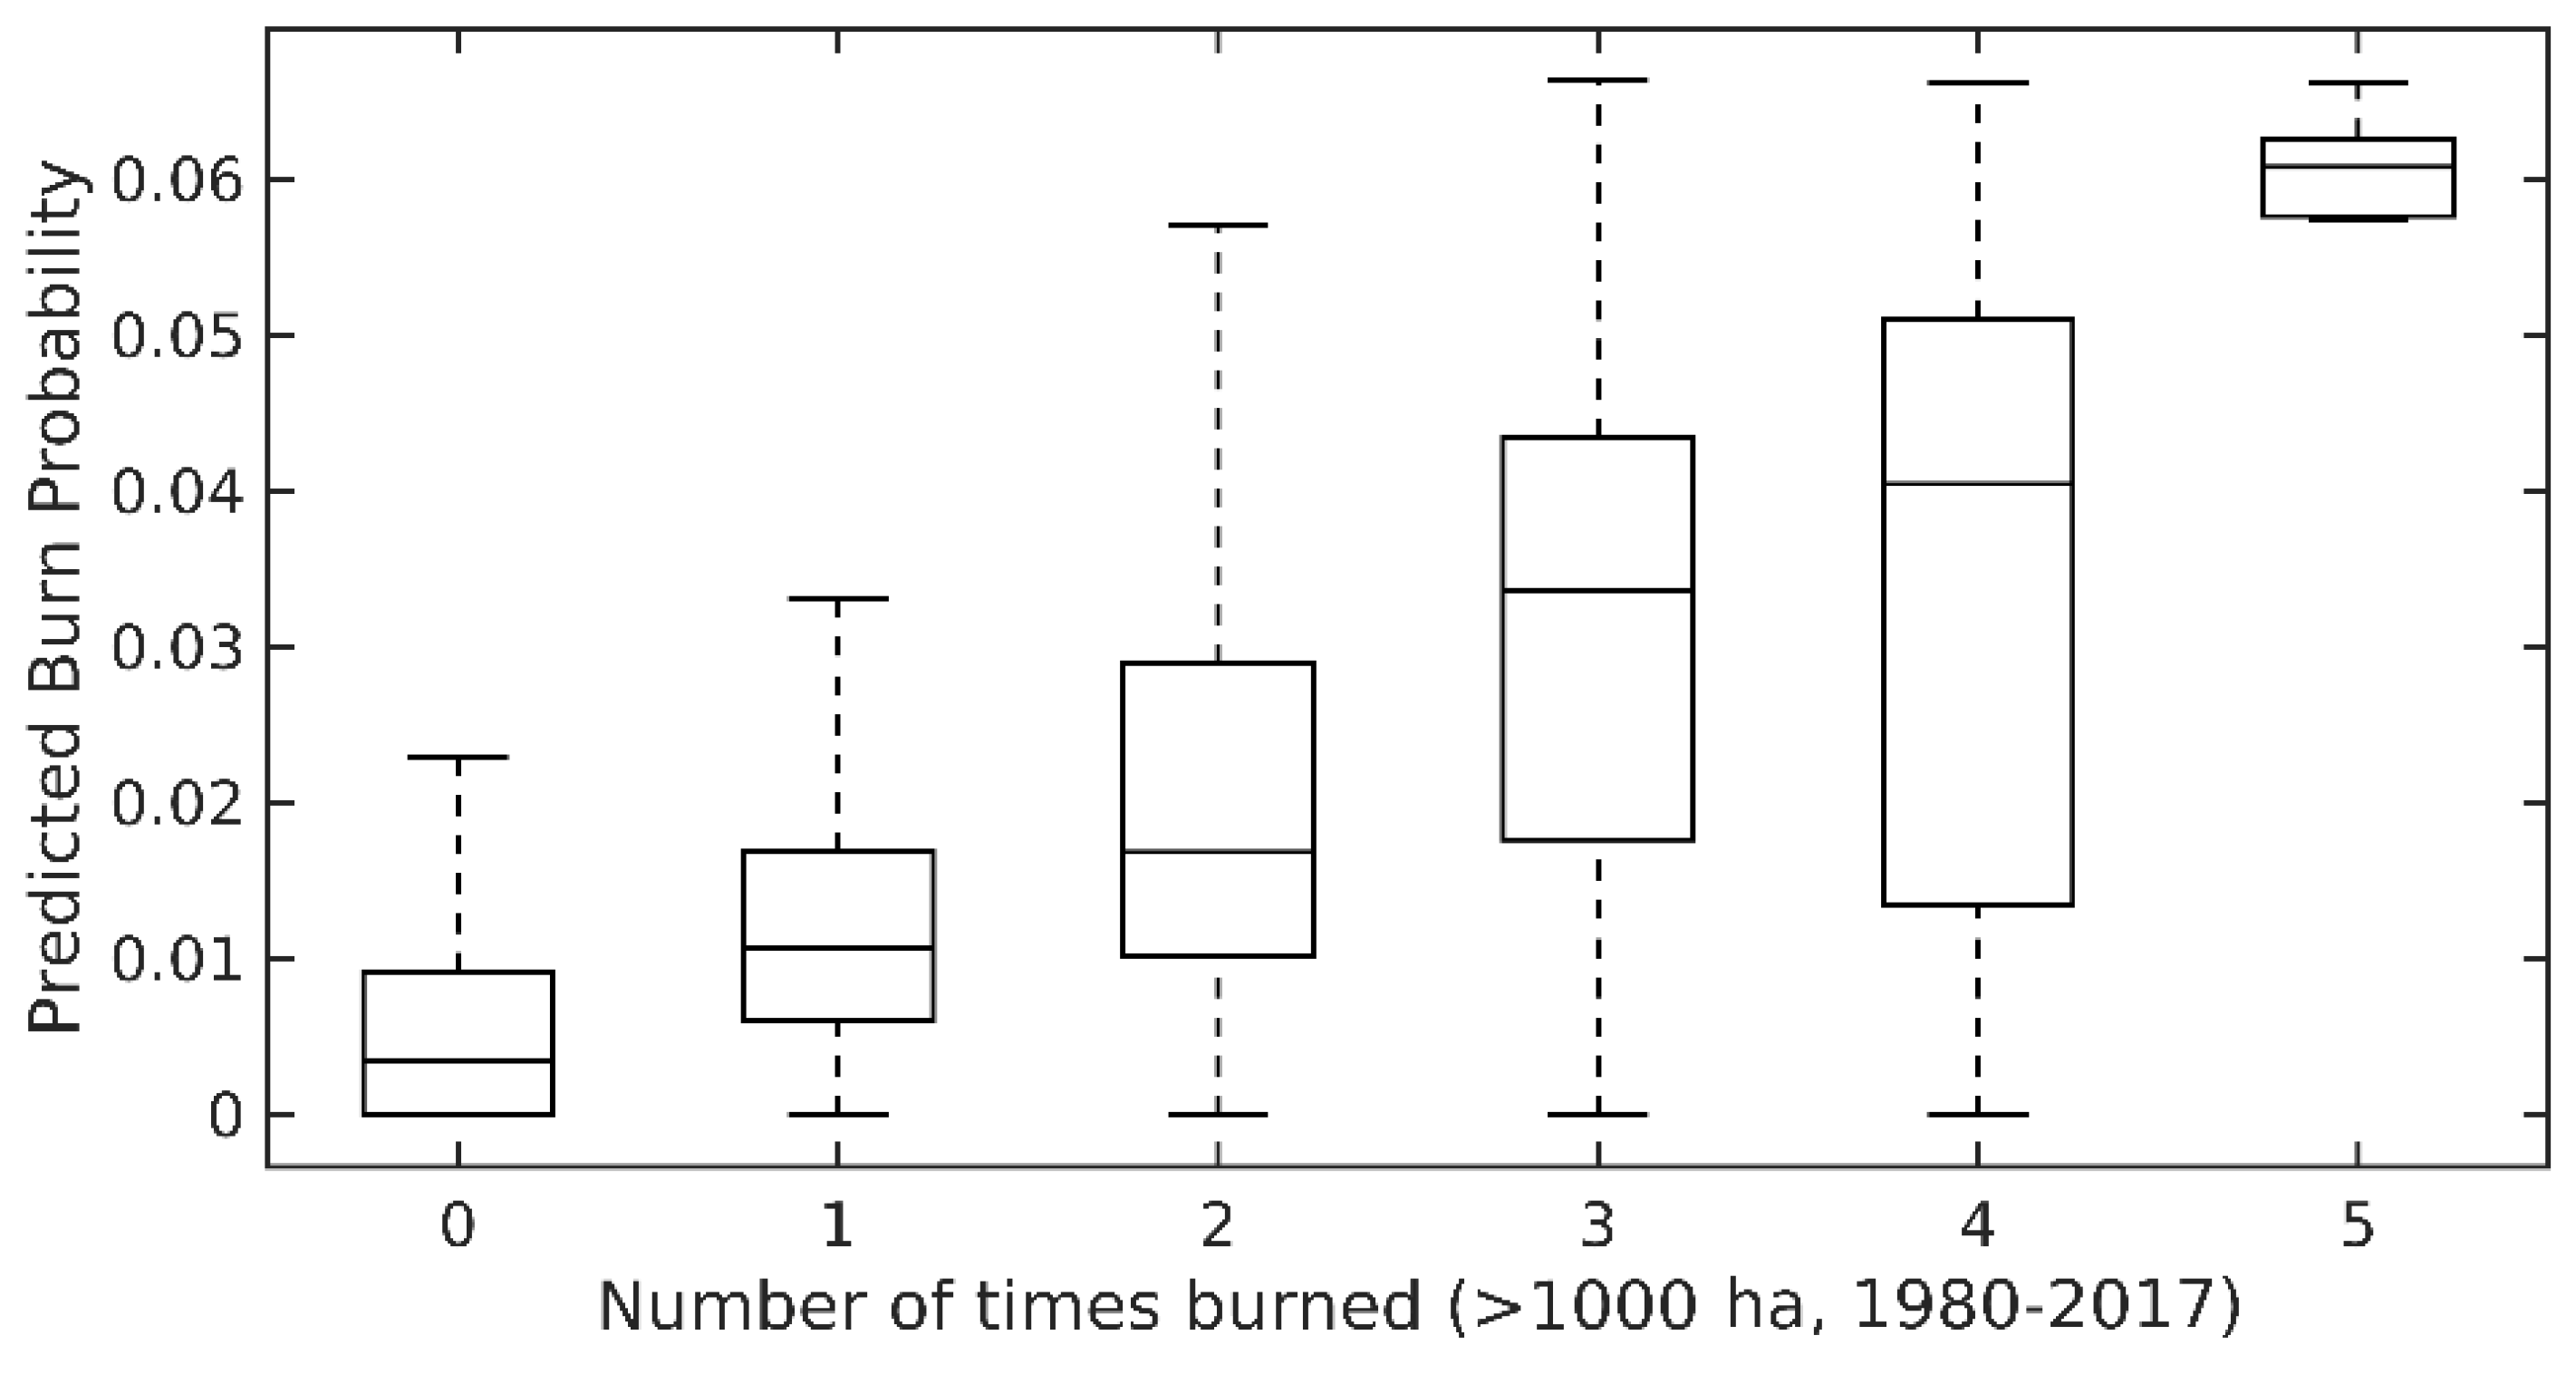
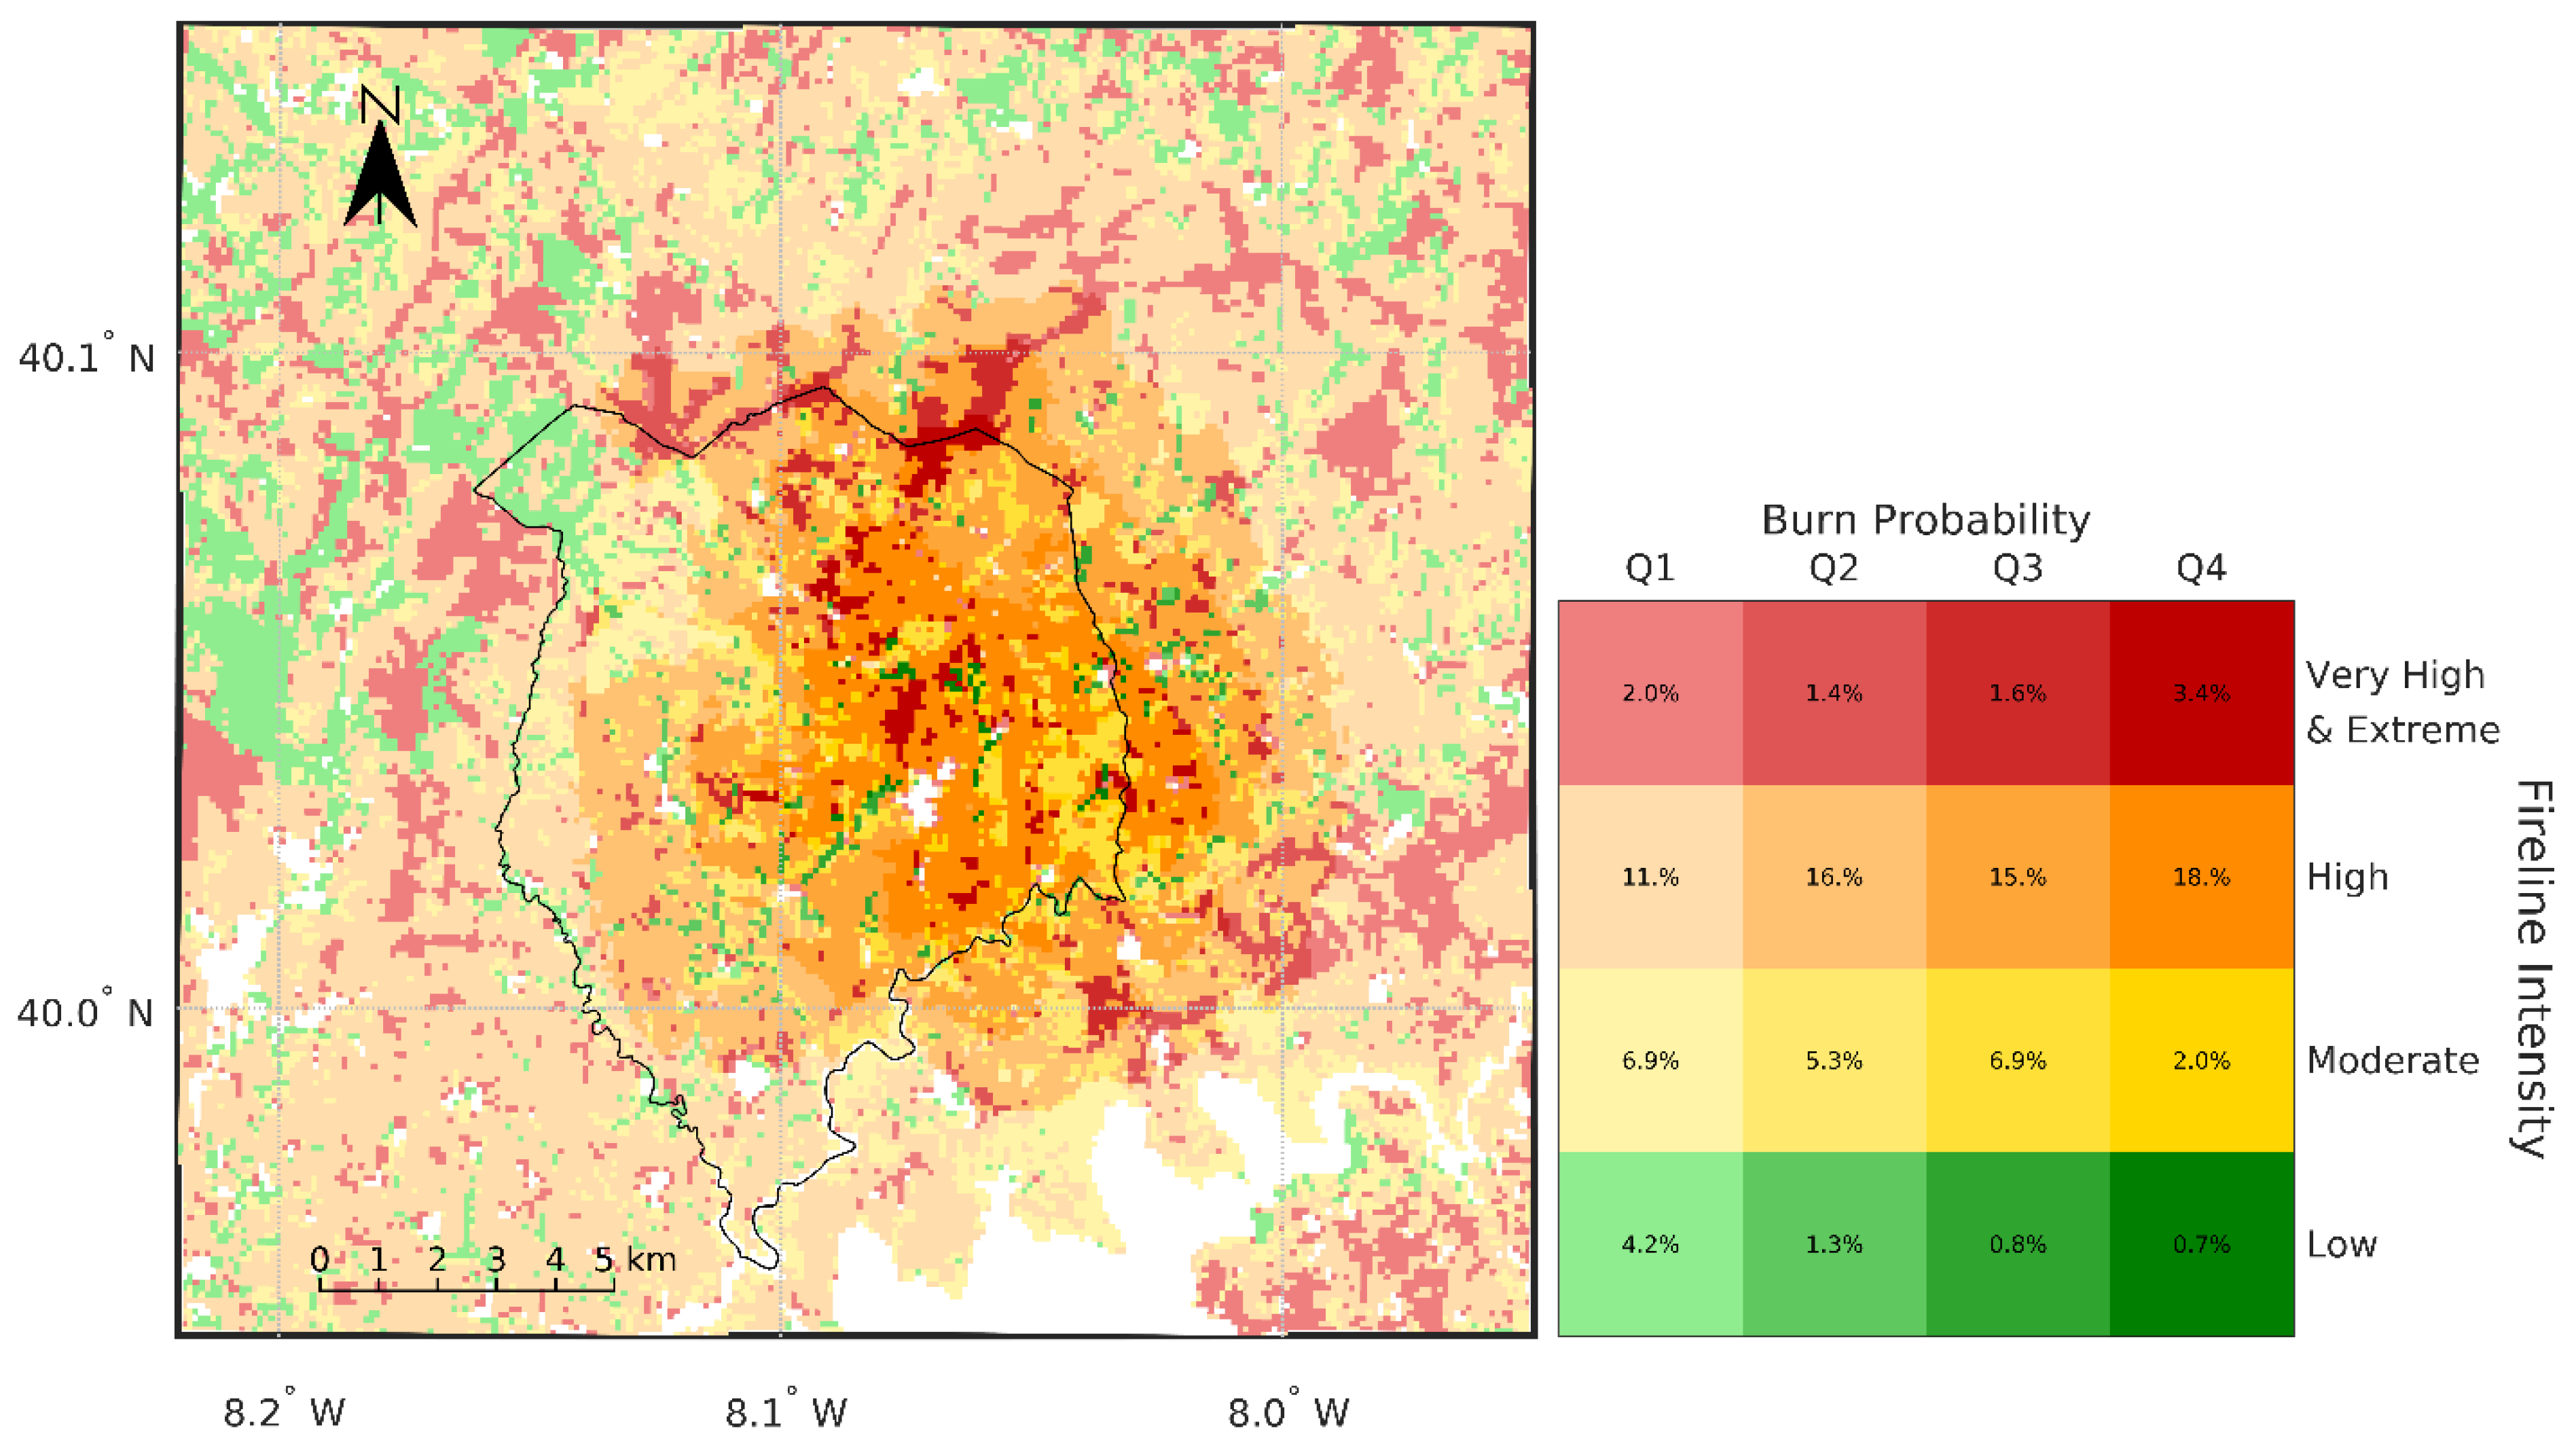
4.2. Wildfire Hazard in the Business-as-Usual (BAU) Scenario
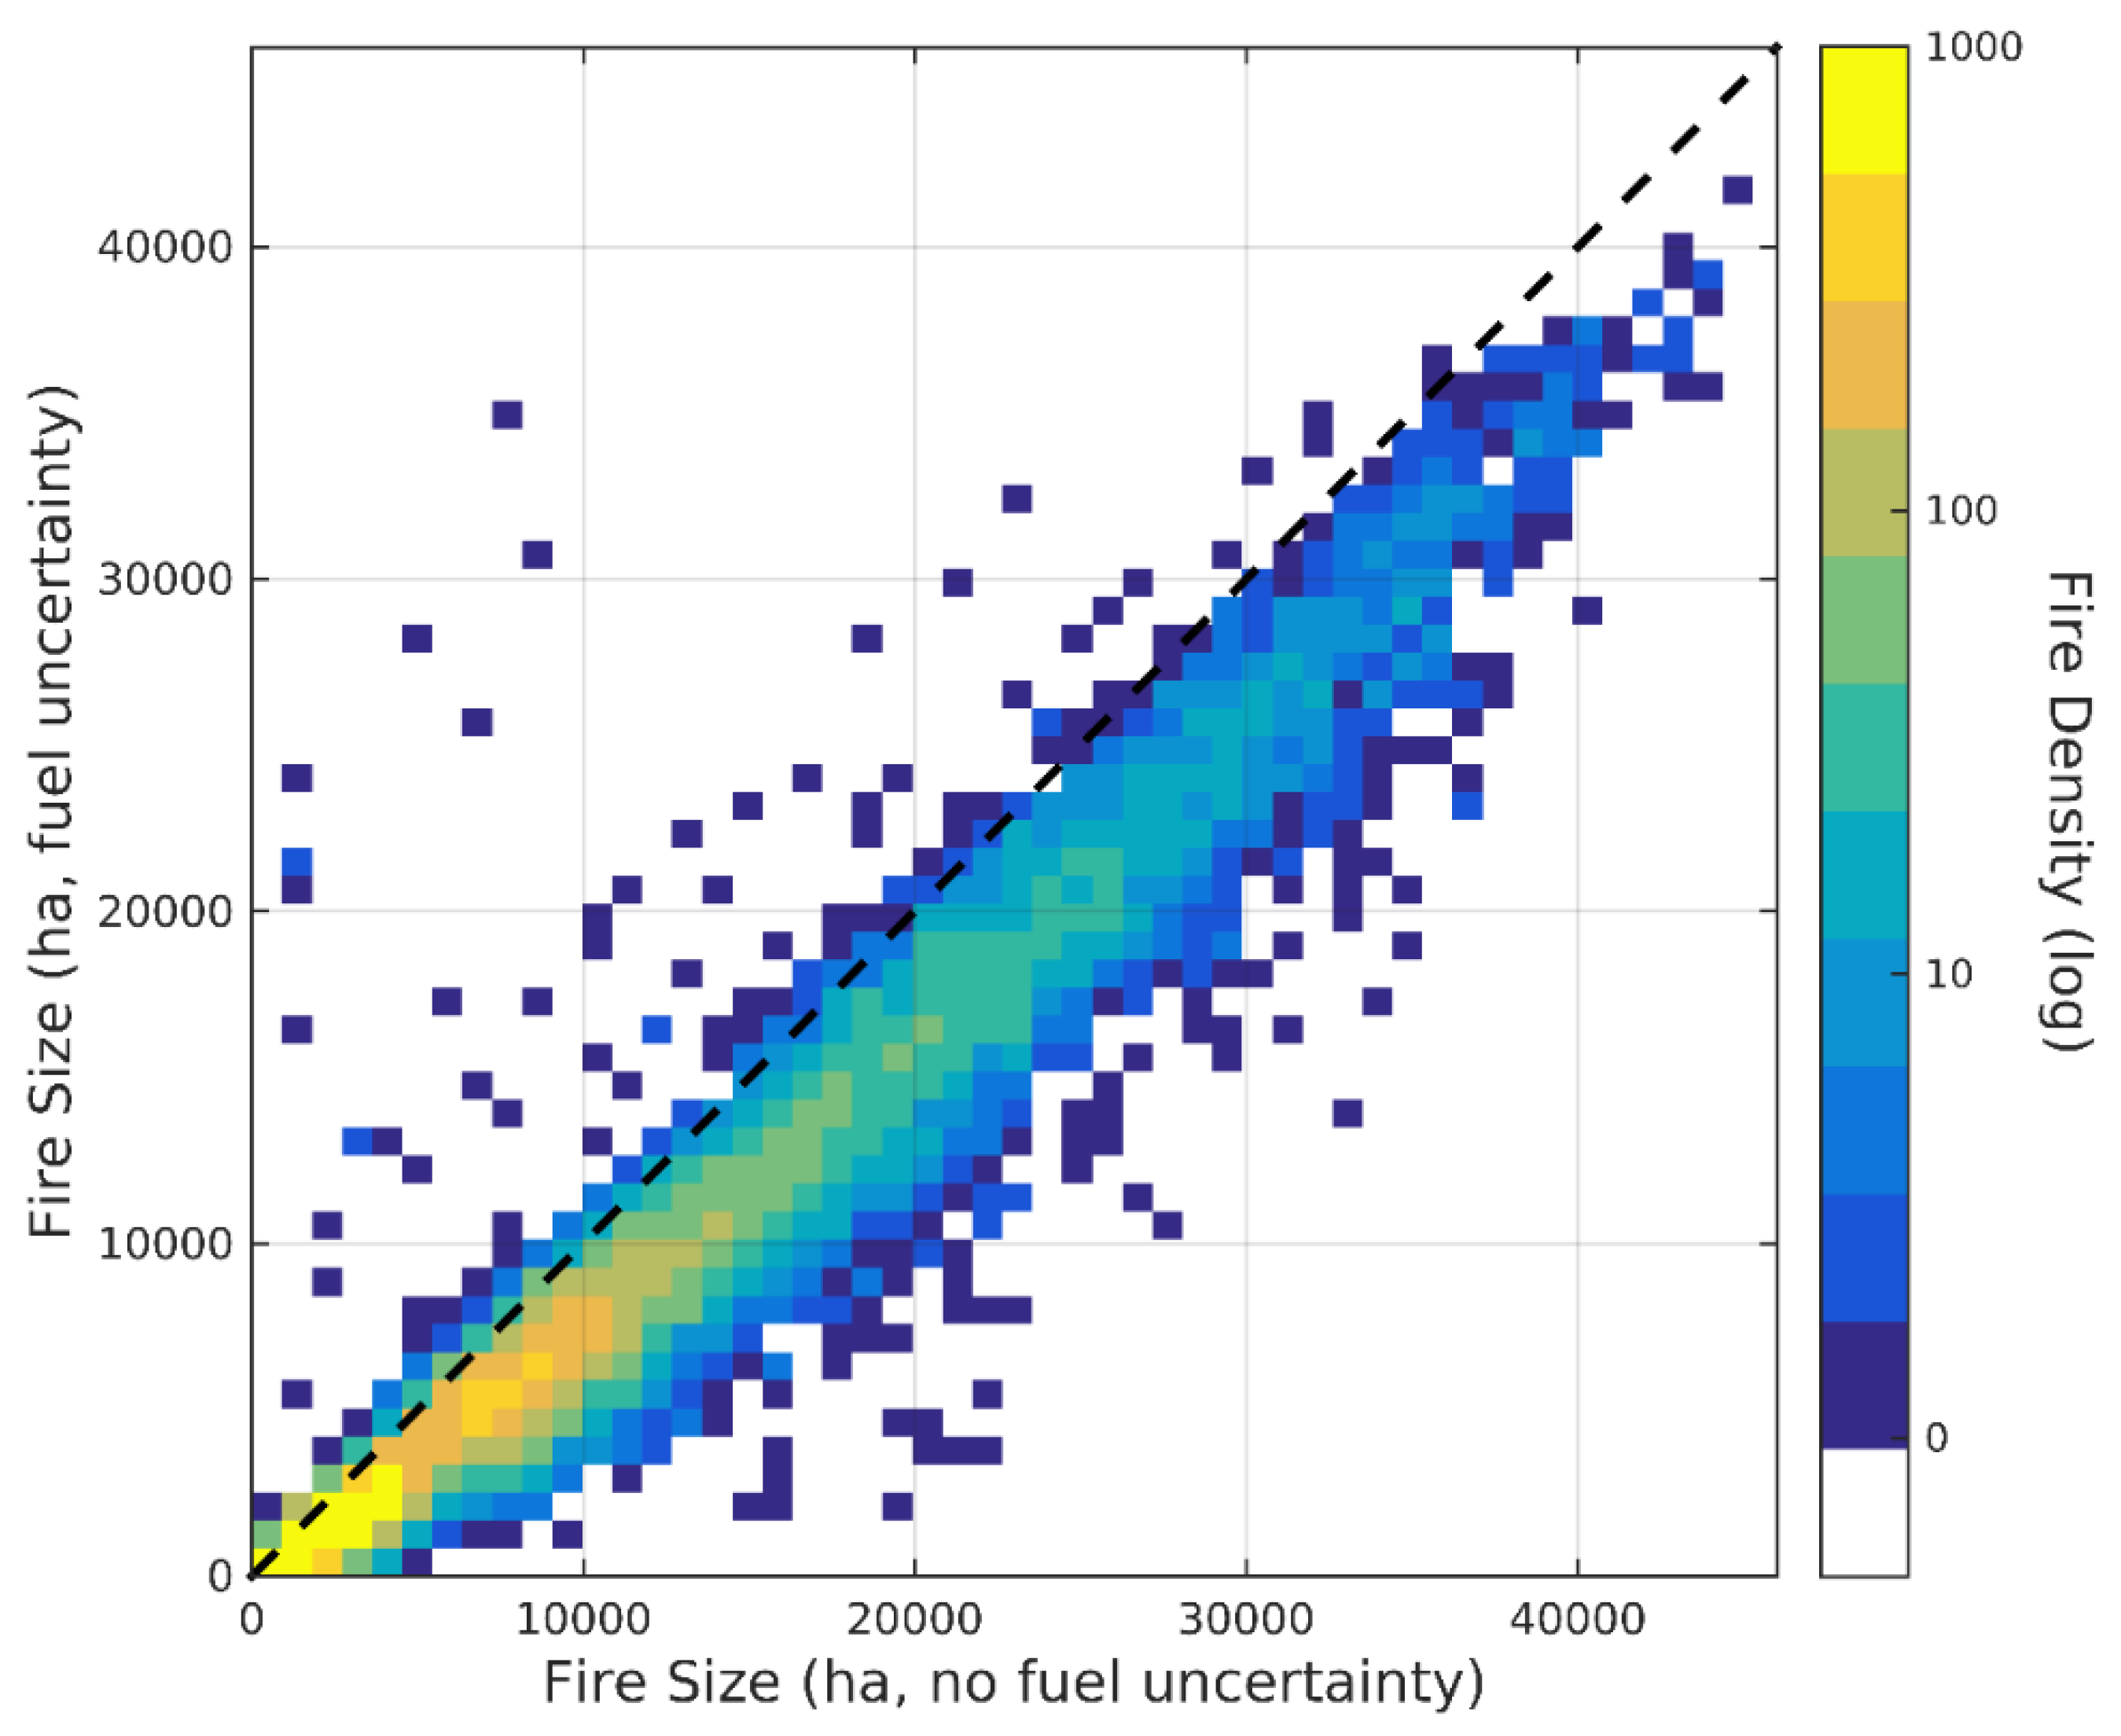
4.3. Impact of Uncertainty on the Estimation of Wildfire Hazard
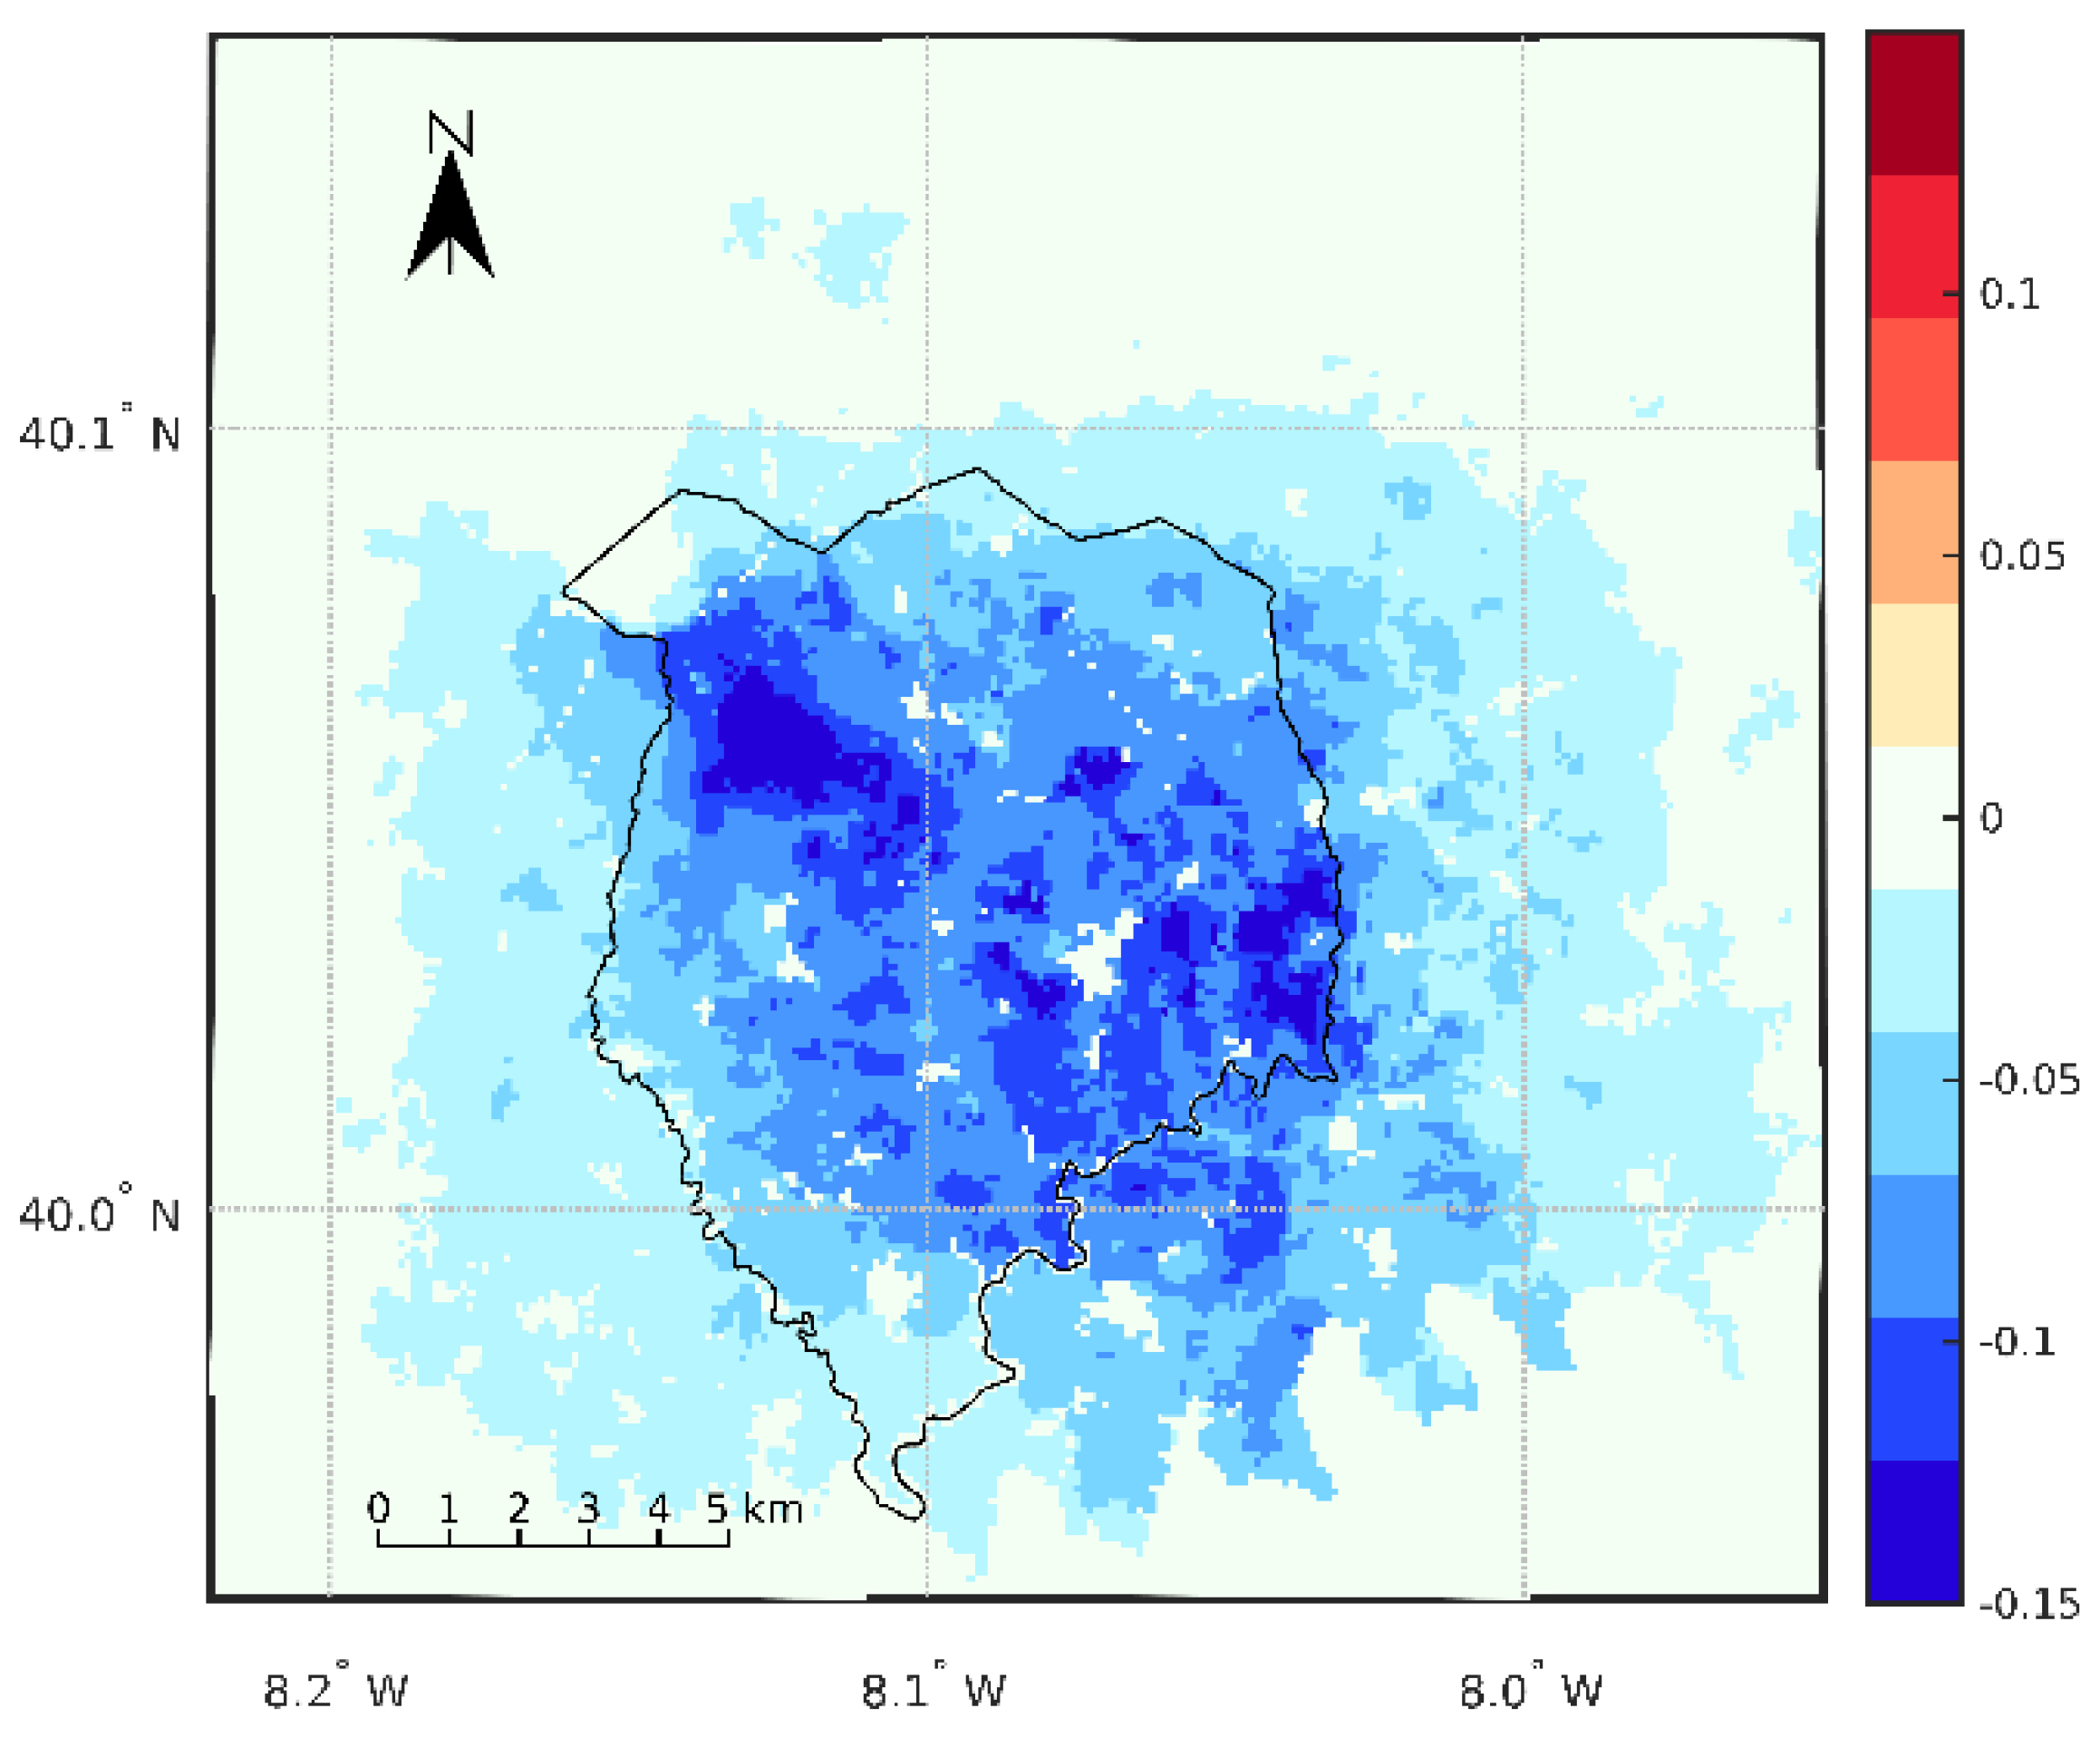
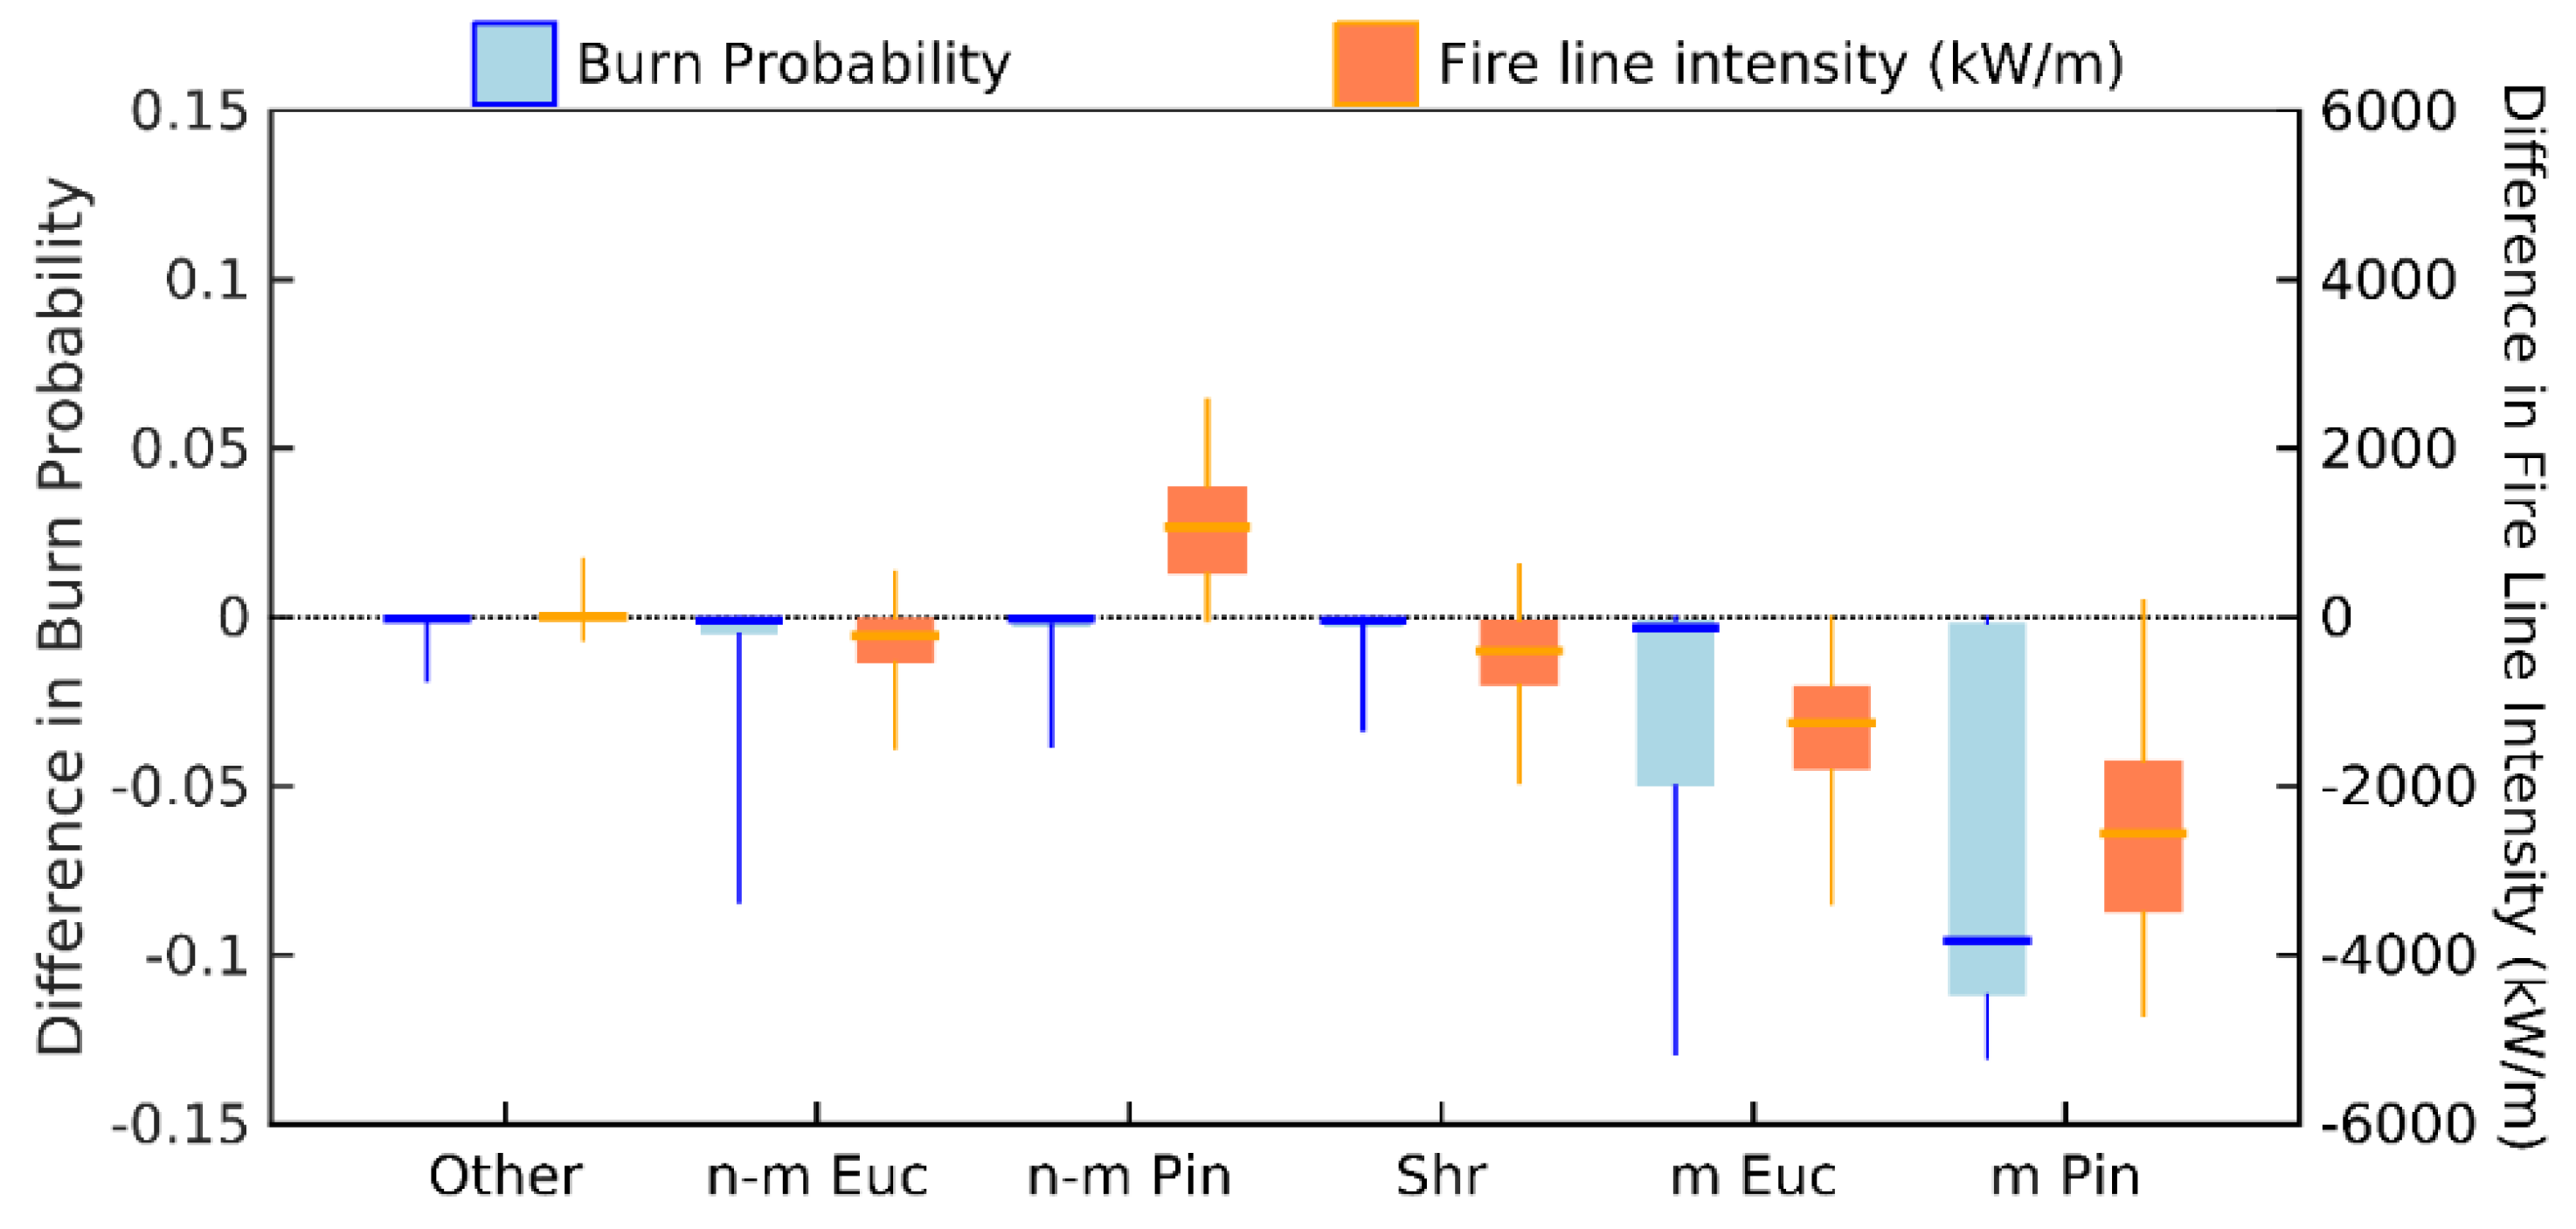
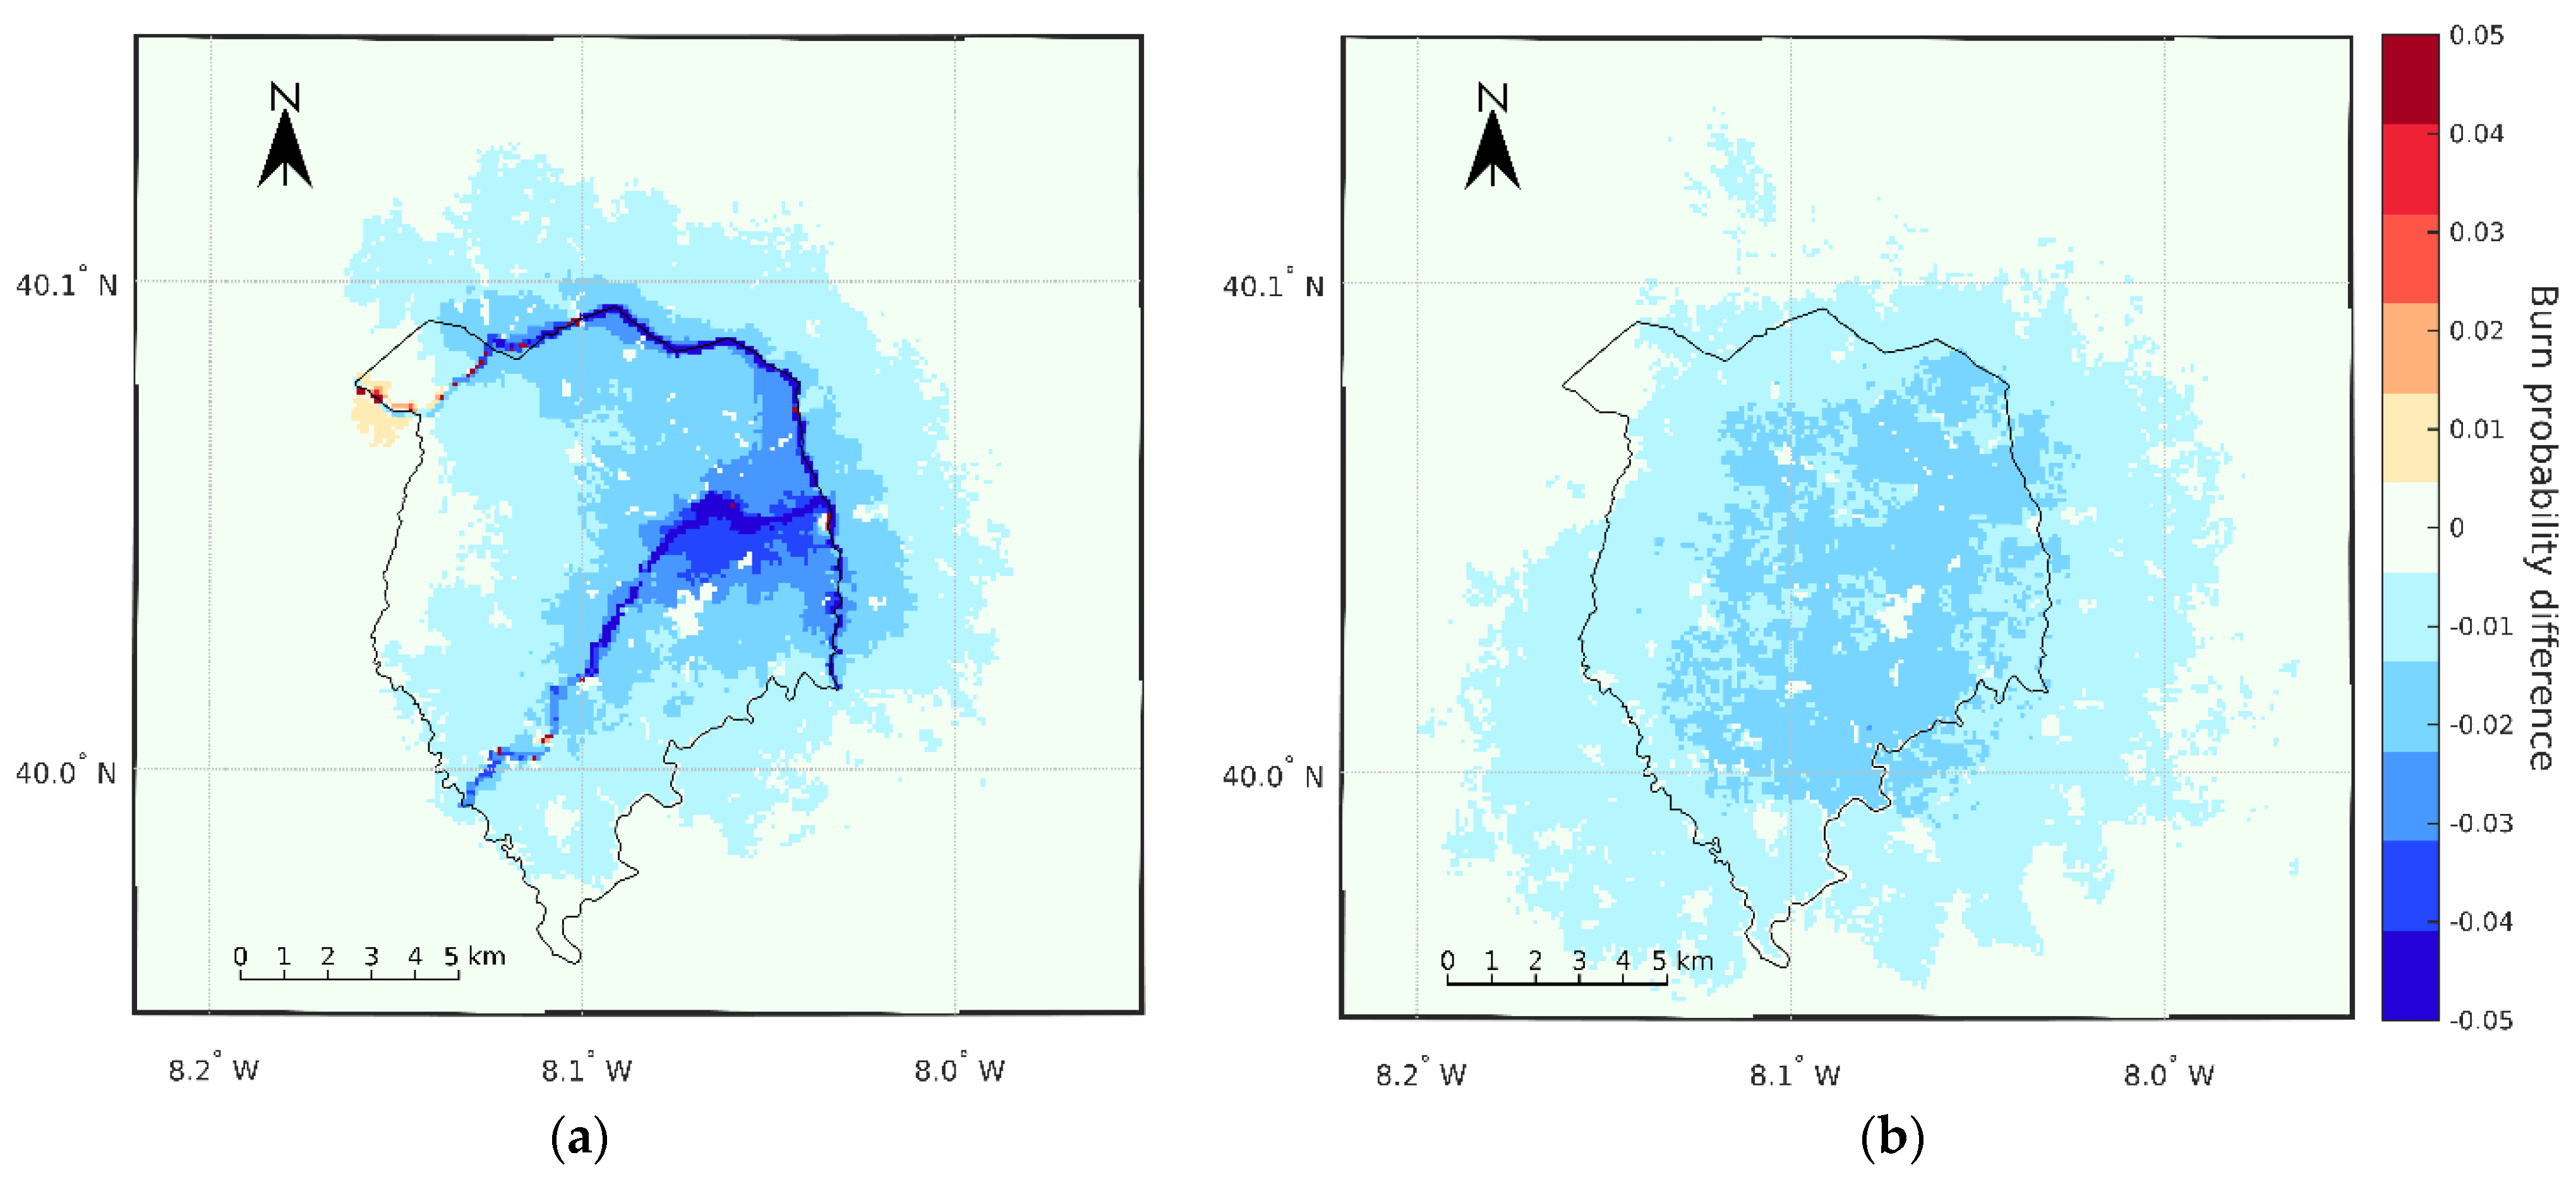
4.4. Impact of Fuel Management Scenarios on Wildfire Hazard
5. Discussion
6. Conclusions
Author Contributions
Funding
Institutional Review Board Statement
Informed Consent Statement
Data Availability Statement
Acknowledgments
Conflicts of Interest
Appendix A


| Industrial | Non-Industrial “Active” | Non-Industrial “Semi-Active” | |||||
|---|---|---|---|---|---|---|---|
| Rotation | Year | Fuel Model | Fuel Model | Fuel Model | |||
| 1 | 1 | NA | NA | NA | |||
| 2 | * | NA | * | NA | NA | ||
| 3 | NA | NA | NA | ||||
| 4 | * | M-EUCd | * | M-EUCd | * | M-EUCd | |
| 5 | M-EUCd | M-EUCd | M-EUCd | ||||
| 6 | F-EUC | * | M-EUCd | F-EUC | |||
| 7 | * | M-EUCd | F-EUC | F-EUC | |||
| 8 | F-EUC | F-EUC | F-EUC | ||||
| 9 | F-EUC | F-EUC | M-EUC | ||||
| 10 | F-EUC | M-EUC | M-EUC | ||||
| 11 | M-EUC | M-EUC | M-EUC | ||||
| 12 | M-EUC | M-EUC | M-EUC | ||||
| 2 | 1 | NFFL11 | NFFL11 | NFFL11 | |||
| 2 | NFFL11 | NFFL11 | NFFL11 | ||||
| 3 | NFFL11 | NFFL11 | NFFL11 | ||||
| 4 | M-EUC | * | M-EUCd | * | M-EUCd | ||
| 5 | * | M-EUCd | M-EUCd | M-EUCd | |||
| 6 | M-EUCd | F-EUC | F-EUC | ||||
| 7 | * | M-EUCd | F-EUC | F-EUC | |||
| 8 | F-EUC | F-EUC | F-EUC | ||||
| 9 | F-EUC | M-EUC | M-EUC | ||||
| 10 | F-EUC | M-EUC | M-EUC | ||||
| 11 | M-EUC | M-EUC | M-EUC | ||||
| 12 | M-EUC | M-EUC | M-EUC | ||||
| 3 | 1 | NFFL11 | NFFL11 | NFFL11 | |||
| 2 | NFFL11 | NFFL11 | NFFL11 | ||||
| 3 | NFFL11 | NFFL11 | NFFL11 | ||||
| 4 | M-EUC | * | M-EUCd | * | M-EUCd | ||
| 5 | * | M-EUCd | M-EUCd | M-EUCd | |||
| 6 | M-EUCd | F-EUC | F-EUC | ||||
| 7 | * | M-EUCd | F-EUC | F-EUC | |||
| 8 | F-EUC | F-EUC | F-EUC | ||||
| 9 | F-EUC | M-EUC | M-EUC | ||||
| 10 | F-EUC | M-EUC | M-EUC | ||||
| 11 | M-EUC | M-EUC | M-EUC | ||||
| 12 | M-EUC | M-EUC | M-EUC | ||||
| Non-Industrial “Quasi-Absent” | Non-Industrial “Absent” | ||||
|---|---|---|---|---|---|
| Rotation | Year | Fuel Model | Fuel Model | ||
| 1 | 1 | M-EUCd | M-EUC | ||
| 2 | * | M-EUCd | M-EUC | ||
| 3 | M-EUC | M-EUC | |||
| 4 | * | M-EUC | * | M-EUC | |
| 5 | M-EUC | M-EUC | |||
| 6 | * | M-EUC | M-EUC | ||
| 7 | M-EUC | M-EUC | |||
| 8 | M-EUC | M-EUC | |||
| 9 | M-EUC | M-EUC | |||
| 10 | M-EUC | M-EUC | |||
| 2 | 1 | NFFL11 | M-EUC | ||
| 2 | NFFL11 | M-EUC | |||
| 3 | NFFL11 | M-EUC | |||
| 4 | * | M-EUC | * | M-EUC | |
| 5 | M-EUC | M-EUC | |||
| 6 | M-EUC | M-EUC | |||
| 7 | M-EUC | M-EUC | |||
| 8 | M-EUC | M-EUC | |||
| 9 | M-EUC | M-EUC | |||
| 10 | M-EUC | M-EUC | |||
| 3 | 1 | 11 | M-EUC | ||
| 2 | 11 | M-EUC | |||
| 3 | 11 | M-EUC | |||
| 4 | * | M-EUC | * | M-EUC | |
| 5 | M-EUC | M-EUC | |||
| 6 | M-EUC | M-EUC | |||
| 7 | M-EUC | M-EUC | |||
| 8 | M-EUC | M-EUC | |||
| 9 | M-EUC | M-EUC | |||
| 10 | M-EUC | M-EUC | |||
Appendix B


References
- Instituto da Conservação da Natureza e das Florestas. Relatório Nacional Provisório de Incêndios Rurais (Relativo ao Período Compreendido Entre 1 de Janeiro e 31 de Dezembro de 2020); ICNF: Lisbon, Portugal, 2021. (In Portuguese) [Google Scholar]
- Castellnou, M.; Guiomar, N.; Rego, F.; Fernandes, P.M. Fire growth patterns in the 2017 mega fire episode of October 15, central Portugal. Adv. For. Fire Res. 2018 D. X. Viegas Chapter 3 Fire Manag. 2018. [Google Scholar] [CrossRef]
- Haynes, K.; Short, K.; Xanthopoulos, G.; Viegas, D.; Ribeiro, L.M.; Blanchi, R. Wildfires and WUI fire fatalities. In Encyclopedia of Wildfires and Wildland-Urban Interface (WUI) Fires; Manzello Samuel, L., Ed.; Springer: Cham, Switzerland, 2020; p. 16. [Google Scholar]
- Gómez-González, S.; Ojeda, F.; Fernandes, P.M. Portugal and Chile: Longing for sustainable forestry while rising from the ashes. Environ. Sci. Policy 2018, 81, 104–107. [Google Scholar] [CrossRef]
- Barlow, J.; Berenguer, E.; Carmenta, R.; França, F. Clarifying Amazonia’s burning crisis. Glob. Chang. Biol. 2020, 26, 319–321. [Google Scholar] [CrossRef]
- Boer, M.M.; Resco de Dios, V.; Bradstock, R.A. Unprecedented burn area of Australian mega forest fires. Nat. Clim. Chang. 2020, 10, 171–172. [Google Scholar] [CrossRef]
- Schulze, S.S.; Fischer, E.C.; Hamideh, S.; Mahmoud, H. Wildfire impacts on schools and hospitals following the 2018 California Camp Fire. Nat. Hazards 2020, 104, 901–925. [Google Scholar] [CrossRef]
- Instituto Português do Mar e da Atmosfera. Condições meteorológicas associadas ao incêndio de Pedrógão Grande de 17 Junho 2017. 2017. Available online: https://www.ipma.pt/export/sites/ipma/bin/docs/relatorios/meteorologia/20170630-relatorio-pedrogaogrande-ipma-completo.pdf (accessed on 21 April 2021). (In Portuguese)
- Turco, M.; Jerez, S.; Augusto, S.; Tarín-Carrasco, P.; Ratola, N.; Jiménez-Guerrero, P.; Trigo, R.M. Climate drivers of the 2017 devastating fires in Portugal. Sci. Rep. 2019, 9, 1–8. [Google Scholar] [CrossRef] [PubMed]
- Comissão Técnica Independente. Análise e apuramento dos factos relativos aos incêndios que ocorreram em Pedrogão Grande, Castanheira de Pera, Ansião, Alvaiázere, Figueiró dos Vinhos, Arganil, Góis, Penela, Pampilhosa da Serra, Oleiros e Sertã, entre 17 e 24 de Junho de 2017. Available online: www.parlamento.pt/Documents/2017/Outubro/Relat%C3%B3rioCTI_VF%20.pdf (accessed on 21 April 2021). (In Portuguese).
- Guerreiro, J.; Fonseca, C.; Salgueiro, A.; Fernandes, P.; Lopez Iglésias, E.; de Neufville, R.; Mateus, F.; Castellnou Ribau, M.; Sande Silva, J.; Moura, J.M.; et al. Avaliação dos incêndios ocorridos entre 14 e 16 de outubro de 2017 em Portugal Continental (Relatório Final). 2018. Comissão Técnica Independente. Assembleia da República. Lisboa. Available online: https://www.parlamento.pt/Documents/2018/Marco/RelatorioCTI190318N.pdf (accessed on 21 April 2021). (In Portuguese).
- Viegas, D.X.; Figueiredo Almeida, M.; Ribeiro, L.M.; Raposo, J.; Viegas, M.T.; Oliveira, R.; Alves, D.; Pinto, C.; Jorge, H.; Rodrigues, A.; et al. O Complexo de Incêndios de Pedrogão Grande E Concelhos Limítrofes, Iniciado a 17 de Junho de 2017. 2017. Available online: https://www.portugal.gov.pt/pt/gc21/comunicacao/documento?i=o-complexo-de-incendios-de-pedrogao-grande-e-concelhos-limitrofes-iniciado-a-17-de-junho-de-2017 (accessed on 21 April 2021). (In Portuguese)
- Fernandes, P.M.; Pacheco, A.P.; Almeida, R.; Claro, J. The role of fire-suppression force in limiting the spread of extremely large forest fires in Portugal. Eur. J. For. Res. 2016, 135, 253–262. [Google Scholar] [CrossRef]
- Dupuy, J.; Fargeon, H.; Martin-StPaul, N.; Pimont, F.; Ruffault, J.; Guijarro, M.; Hernando, C.; Madrigal, J.; Fernandes, P. Climate change impact on future wildfire danger and activity in southern Europe: A review. Ann. For. Sci. 2020, 77. [Google Scholar] [CrossRef]
- Loepfe, L.; Martinez-Vilalta, J.; Piñol, J. Management alternatives to offset climate change effects on Mediterranean fire regimes in NE Spain. Clim. Change 2012, 115, 693–707. [Google Scholar] [CrossRef]
- Moreira, F.; Ascoli, D.; Safford, H.; Adams, M.A.; Moreno, J.M.; Pereira, J.M.C.; Catry, F.X.; Armesto, J.; Bond, W.; González, M.E.; et al. Wildfire management in Mediterranean-type regions: Paradigm change needed. Environ. Res. Lett. 2020, 15. [Google Scholar] [CrossRef]
- Castellnou, M.; Prat-Guitart, N.; Arilla, E.; Larrañaga, A.; Nebot, E.; Castellarnau, X.; Vendrell, J.; Pallàs, J.; Herrera, J.; Monturiol, M.; et al. Empowering strategic decision-making for wildfire management: Avoiding the fear trap and creating a resilient landscape. Fire Ecol. 2019, 15. [Google Scholar] [CrossRef]
- Rego, F.; Rodríguez, J.M.M.; Valzada, V.R.V.; Xanthopoulos, G. Forest fires: Sparking firesmart policies in the EU. 2019. Available online: https://ec.europa.eu/info/publications/forest-fires-sparking-firesmart-policies-eu_en (accessed on 21 April 2021).
- Salis, M.; Ager, A.A.; Arca, B.; Finney, M.A.; Bacciu, V.; Duce, P.; Spano, D. Assessing exposure of human and ecological values to wildfire in Sardinia, Italy. Int. J. Wildl. Fire 2013, 22, 549–565. [Google Scholar] [CrossRef]
- Alcasena, F.J.; Salis, M.; Vega-García, C. A fire modeling approach to assess wildfire exposure of valued resources in central Navarra, Spain. Eur. J. For. Res. 2016, 135, 87–107. [Google Scholar] [CrossRef]
- Beverly, J.L.; McLoughlin, N. Burn probability simulation and subsequent wildland fire activity in Alberta, Canada Implications for risk assessment and strategic planning. For. Ecol. Manag. 2019, 451, 117490. [Google Scholar] [CrossRef]
- Cochrane, M.A.; Moran, C.J.; Wimberly, M.C.; Baer, A.D.; Finney, M.A.; Beckendorf, K.L.; Eidenshink, J.; Zhu, Z. Estimation of wildfire size and risk changes due to fuels treatments. Int. J. Wildl. Fire 2012, 21, 357–367. [Google Scholar] [CrossRef]
- Ager, A.A.; Preisler, H.K.; Arca, B.; Spano, D.; Salis, M. Wildfire risk estimation in the Mediterranean area. Environmetrics 2014, 25, 384–396. [Google Scholar] [CrossRef]
- Palaiologou, P.; Kalabokidis, K.; Ager, A.A.; Day, M.A. Development of comprehensive fuel management strategies for reducing wildfire risk in Greece. Forests 2020, 11, 789. [Google Scholar] [CrossRef]
- Oliveira, T.M.; Barros, A.M.G.; Ager, A.A.; Fernandes, P.M. Assessing the effect of a fuel break network to reduce burnt area and wildfire risk transmission. Int. J. Wildl. Fire 2016, 25, 619–632. [Google Scholar] [CrossRef]
- Palaiologou, P.; Ager, A.A.; Evers, C.R.; Nielsen-Pincus, M.; Day, M.A.; Preisler, H.K. Fine-scale assessment of cross-boundary wildfire events in the western United States. Nat. Hazards Earth Syst. Sci. 2019, 19, 1755–1777. [Google Scholar] [CrossRef]
- Alcasena, F.J.; Ager, A.A.; Salis, M.; Day, M.A.; Vega-Garcia, C. Optimizing prescribed fire allocation for managing fire risk in central Catalonia. Sci. Total Environ. 2018, 621, 872–885. [Google Scholar] [CrossRef] [PubMed]
- Salis, M.; Del Giudice, L.; Arca, B.; Ager, A.A.; Alcasena-Urdiroz, F.; Lozano, O.; Bacciu, V.; Spano, D.; Duce, P. Modeling the effects of different fuel treatment mosaics on wildfire spread and behavior in a Mediterranean agro-pastoral area. J. Environ. Manag. 2018, 212, 490–505. [Google Scholar] [CrossRef]
- Lozano, O.M.; Salis, M.; Ager, A.A.; Arca, B.; Alcasena, F.J.; Monteiro, A.T.; Finney, M.A.; Del Giudice, L.; Scoccimarro, E.; Spano, D. Assessing Climate Change Impacts on Wildfire Exposure in Mediterranean Areas. Risk Anal. 2017, 37, 1898–1916. [Google Scholar] [CrossRef]
- Salis, M.; Del Giudice, L.; Robichaud, P.R.; Ager, A.A.; Canu, A.; Duce, P.; Pellizzaro, G.; Ventura, A.; Alcasena-Urdiroz, F.; Spano, D.; et al. Coupling wildfire spread and erosion models to quantify post-fire erosion before and after fuel treatments. Int. J. Wildl. Fire 2019, 28, 687–703. [Google Scholar] [CrossRef]
- Gannon, B.M.; Wei, Y.; Thompson, M.P. Mitigating source water risks with improved wildfire containment. Fire 2020, 3, 45. [Google Scholar] [CrossRef]
- Mateus, P.; Fernandes, P.M. Forest fires in Portugal: Dynamics, causes and policies. In Forest Context and Policies in Portugal; Springer: Cham, Switzerland, 2014; pp. 97–115. [Google Scholar]
- Turco, M.; Rosa-Cánovas, J.J.; Bedia, J.; Jerez, S.; Montávez, J.P.; Llasat, M.C.; Provenzale, A. Exacerbated fires in Mediterranean Europe due to anthropogenic warming projected with non-stationary climate-fire models. Nat. Commun. 2018, 9, 1–9. [Google Scholar] [CrossRef] [PubMed]
- Santos, J.L.; Martins, A.; Novais, A.; Canadas, M.J. A Choice-Modeling Approach to Inform Policies Aimed at Reducing Wildfire Hazard through the Promotion of Fuel Management by Forest Owners. Forests 2021, 12, 403. [Google Scholar] [CrossRef]
- Pereira, J.M.; Benali, A.; Sá, A.; Le Page, Y.; Barreiro, S.; Rua, J.; Tomé, M.; Santos, J.L.; Canadas, M.J.; Martins, A.; et al. Alvares um Caso de Resiliência ao Fogo (Relatório Técnico); Instituto Superior de Agronomia: Lisbon, Portugal, 2019. (In Portuguese) [Google Scholar]
- Barreiro, S.; Benali, A.; Rua, J.C.P.; Tomé, M.; Pereira, J.M.C. Assisting landowners in building fire-resilient landscapes using forest management driven simulations. Unpublished Work. 2021; Manuscript in preparation. [Google Scholar]
- Oliveira, S.; Gonçalves, A.; Benali, A.; Sá, A.; Zêzere, J.L.; Pereira, J.M. Assessing risk and prioritizing safety interventions in human settlements affected by large wildfires. Forests 2020, 11, 859. [Google Scholar] [CrossRef]
- Mirra, I.M.; Oliveira, T.M.; Barros, A.M.G.; Fernandes, P.M. Fuel dynamics following fire hazard reduction treatments in blue gum (Eucalyptus globulus) plantations in Portugal. Forest Ecol. Manag. 2017, 398, 185–195. [Google Scholar] [CrossRef]
- Worldclim. Available online: https://www.worldclim.org/ (accessed on 26 February 2021).
- Instituto Nacional de Estatística. Censos de 2011 Resultados Definitivos-Portugal; Instituto Nacional de Estatística: Lisbon, Portugal, 2012. (In Portuguese)
- Instituto Nacional de Estatística. Recenseamento Geral da População. Tomo, I. Vol 1. Prédios e Fogos; População-Dados Retrospectivos (Distritos, Concelhos E Freguesias); Instituto Nacional de Estatística: Lisbon, Portugal, 2012. (In Portuguese)
- Finney, M.A. FARSITE: Fire Area Simulator—Model Development and Evaluation; No. 4; USDA, Forest Service, Rocky Mountain Research Station: Ogden, UT, USA, 2004. [Google Scholar]
- Sistema de Gestão de Informação de Incêndios Florestais (Versão1.1 2015) do Instituto Conservação Natureza e Floresta. Available online: https://fogos.icnf.pt/sgif2010/ (accessed on 26 February 2021). (In Portuguese).
- Skamarock, W.C.; Klemp, J.B.; Dudhia, J.; Gill, D.O.; Barker, D.M.; Duda, M.G.; Huang, X.-Y.; Wang, W.; Powers, J.G. A Description of the Advanced Research WRF Version 3; National Center for Atmospheric Research: Boulder, CO, USA, 2008. [Google Scholar]
- Wagenbrenner, N.S.; Forthofer, J.M.; Lamb, B.K.; Shannon, K.S.; Butler, B.W. Downscaling surface wind predictions from numerical weather prediction models in complex terrain with WindNinja. Atmos. Chem. Phys. 2016, 16, 5229–5241. [Google Scholar] [CrossRef]
- Pereira, M.G.; Malamud, B.D.; Trigo, R.M.; Alves, P.I. The history and characteristics of the 1980–2005 Portuguese rural fire database. Nat. Hazards Earth Syst. Sci. 2011, 11, 3343–3358. [Google Scholar] [CrossRef]
- Fernandes, P.; Gonçalves, H.; Loureiro, C.; Fernandes, M.; Costa, T.; Cruz, M.G.; Botelho, H. Modelos de combustível florestal para Portugal. In Actas do 6º Congresso Florestal Nacional. Sociedade Portuguesa de Ciências Florestais; SPCF: Lisboa, Portugal, 2009. [Google Scholar]
- Anderson, H.E. Aids to Determining Fuel Models for Estimating Fire Behavior; USDA General Technical Report INT-122; USDA Forest Service, Intermountain Forest and Range Experiment Station: Ogden, UT, USA, 1982. [Google Scholar]
- Benali, A.; Ervilha, A.R.; Sá, A.C.L.; Fernandes, P.M.; Pinto, R.M.S.; Trigo, R.M.; Pereira, J.M.C. Deciphering the impact of uncertainty on the accuracy of large wildfire spread simulations. Sci. Total Environ. 2016, 569–570. [Google Scholar] [CrossRef] [PubMed]
- Farr, T.G.; Rosen, P.A.; Caro, E.; Crippen, R.; Duren, R.; Hensley, K.M.; Paller, M.; Rodriguez, E.; Roth, L.; Seal, D.; et al. The shuttle radar topography mission. Rev. Geophys. 2007, 45. [Google Scholar] [CrossRef]
- Alexander, M.E.; Lanoville, R.A. Predicting fire behavior in the black spruce-lichen woodland fuel type of western and northern Canada. Northern Forestry Centre. 1989. Available online: https://d1ied5g1xfgpx8.cloudfront.net/pdfs/23093.pdf (accessed on 21 April 2021).
- Ager, A.A.; Barros, A.M.G.; Houtman, R.; Seli, R.; Day, M.A. Modelling the effect of accelerated forest management on long-term wildfire activity. Ecol. Modell. 2020, 421, 108962. [Google Scholar] [CrossRef]
- Fernandes, P.M. Empirical support for the use of prescribed burning as a fuel treatment. Curr. For. Reports 2015, 1, 118–127. [Google Scholar] [CrossRef]
- Finney, M.A. Landscape fire simulation and fuel treatment optimization. In Methods for Integrated Modeling of Landscape Change; Interior Northwest Landscape Analysis System; Hayes, J.L., Ager, A.A., Barbour, R.J., Eds.; US Department of Agriculture, Forest Service, Pacific Northwest Research Station: Portland, OR, USA, 2004; Volume 610, pp. 117–131. [Google Scholar]


| Land Use/Cover and FMA | Fuel Model | Acronym | Probability |
|---|---|---|---|
| Non-industrial eucalypt forest | Non-burnable | NA | 0.03 |
| Young or recently harrowed eucalypt stands | M-EUCd | 0.12 | |
| Eucalypt litter | F-EUC | 0.10 | |
| Eucalypt litter with understory vegetation | M-EUC | 0.60 | |
| Harvest residues 1 | NFFL11 | 0.14 | |
| Industrial eucalypt forest | Non-burnable | NA | 0.13 |
| Young or recently harrowed eucalypt stands | M-EUCd | 0.25 | |
| Eucalypt litter | F-EUC | 0.29 | |
| Eucalypt litter with understory vegetation | M-EUC | 0.21 | |
| Harvest residues 1 | NFFL11 | 0.13 | |
| Non-industrial pine forest | Pine litter with understory vegetation | M-PIN | 0.67 |
| Tall shrubs | V-Maa | 0.33 | |
| Industrial pine forest | Pine litter | F-PIN | 1.00 |
| Shrublands and open forest | Tall shrubs | V-Maa | 0.67 |
| Short shrubs | V-Mab | 0.33 |
| Same Management | Moderate Management | High Management | |
|---|---|---|---|
| FBN 0\3 | 0 ha 1 | 754 ha or 52 ha y−1 | 1370 ha or 95 ha y−1 |
| FBN 1\3 | 203 ha or 57 ha y−1 | 957 ha or 104 ha y−1 | 1573 ha or 147 ha y−1 |
| FBN 3\3 | 368 ha or 104 ha y−1 | 1120 ha or 146 ha y−1 | 1738 ha or 189 ha y−1 |
| FBN 3\3 | 576 ha or 163 ha y−1 | 1330 ha or 199 ha y−1 | 1946 ha or 242 ha y−1 |
| Land Use/Cover and Scenario | Fuel Model | Acronym | Probability |
|---|---|---|---|
| Non-industrial eucalypt forest: business as usual | Non-burnable | NA | 0.03 |
| Young or recently harrowed eucalypt stands | M-EUCd | 0.12 | |
| Eucalypt litter | F-EUC | 0.10 | |
| Eucalypt litter with understory vegetation | M-EUC | 0.60 | |
| Harvest residues 1 | NFFL11 | 0.14 | |
| Non-industrial eucalypt forest: moderate increase in managed forest stands | Non-burnable | NA | 0.05 |
| Young or recently harrowed eucalypt stands | M-EUCd | 0.13 | |
| Eucalypt litter | F-EUC | 0.15 | |
| Eucalypt litter with understory vegetation | M-EUC | 0.53 | |
| Harvest residues 1 | NFFL11 | 0.14 | |
| Non-industrial eucalypt forest: high increase in managed forest stands | Non-burnable | NA | 0.06 |
| Young or recently harrowed eucalypt stands | M-EUCd | 0.15 | |
| Eucalypt litter | F-EUC | 0.19 | |
| Eucalypt litter with understory vegetation | M-EUC | 0.47 | |
| Harvest residues 1 | NFFL11 | 0.14 | |
| Fuel breaks | Non-burnable | NA | 0.20 |
| Discontinuous shrubs and herbs | V-MH | 0.60 | |
| Short shrubs | V-Mab | 0.20 |
| Same Management | Moderate Management | High Management | |
|---|---|---|---|
| FBN 0\3 | - | −12.3 | −18.3 |
| FBN 1\3 | −15.9 | −20.8 | −24.8 |
| FBN 3\3 | −24.6 | −24.1 | −28.1 |
| FBN 3\3 | −28.6 | −28.3 | −32.1 |
Publisher’s Note: MDPI stays neutral with regard to jurisdictional claims in published maps and institutional affiliations. |
© 2021 by the authors. Licensee MDPI, Basel, Switzerland. This article is an open access article distributed under the terms and conditions of the Creative Commons Attribution (CC BY) license (https://creativecommons.org/licenses/by/4.0/).
Share and Cite
Benali, A.; Sá, A.C.L.; Pinho, J.; Fernandes, P.M.; Pereira, J.M.C. Understanding the Impact of Different Landscape-Level Fuel Management Strategies on Wildfire Hazard in Central Portugal. Forests 2021, 12, 522. https://doi.org/10.3390/f12050522
Benali A, Sá ACL, Pinho J, Fernandes PM, Pereira JMC. Understanding the Impact of Different Landscape-Level Fuel Management Strategies on Wildfire Hazard in Central Portugal. Forests. 2021; 12(5):522. https://doi.org/10.3390/f12050522
Chicago/Turabian StyleBenali, Akli, Ana C. L. Sá, João Pinho, Paulo M. Fernandes, and José M. C. Pereira. 2021. "Understanding the Impact of Different Landscape-Level Fuel Management Strategies on Wildfire Hazard in Central Portugal" Forests 12, no. 5: 522. https://doi.org/10.3390/f12050522
APA StyleBenali, A., Sá, A. C. L., Pinho, J., Fernandes, P. M., & Pereira, J. M. C. (2021). Understanding the Impact of Different Landscape-Level Fuel Management Strategies on Wildfire Hazard in Central Portugal. Forests, 12(5), 522. https://doi.org/10.3390/f12050522