Article

Mapping and Monitoring the Canopy Cover and Greenness of Southern Yellow Pines (Loblolly, Shortleaf, and Virginia Pines) in Central-Eastern Tennessee Using Multi-Temporal Landsat Satellite Data

Department of Agricultural and Environmental Sciences, College of Agriculture, Tennessee State University, Nashville, TN 37209, USA
*
Author to whom correspondence should be addressed.
Forests 2021, 12(4), 499; https://doi.org/10.3390/f12040499
Submission received: 24 February 2021 / Revised: 31 March 2021 / Accepted: 13 April 2021 / Published: 16 April 2021
(This article belongs to the Special Issue Applications of Satellite Data for Forest Monitoring and Management)

Abstract

:
Southern yellow pines such as loblolly, Virginia and shortleaf pines constitute forest products and contribute significantly to the economy of the United States (U.S.). However, little is understood about the temporal change in canopy cover and greenness of southern yellow pines, especially in Tennessee where they are used for timber and pulpwood. This study aims to map and monitor the canopy cover and greenness of southern yellow pines i.e., loblolly (Pinus taeda), shortleaf (Pinus echinata), and Virginia (Pinus Virginiana) pines in the years 1988, 1999 and 2016 in central-eastern Tennessee. Landsat time-series satellite data acquired in December 1988, November 1999 and February 2016 were used to map and monitor the canopy cover and greenness of loblolly, shortleaf and Virginia pines. The classification and mapping of the canopy cover of southern yellow pines were performed using a machine-learning random forest classification algorithm. Normalized Difference Vegetation Index (NDVI) was used to monitor the temporal variation in canopy greenness. In total, the canopy cover of southern yellow pines decreased by about 35% between December 1988 and February 2016. This information could be used by foresters and forest managers to support forest inventory and management.

1. Introduction

The forest sector contributes significantly to the economy of the United States (U.S.). For example, in southeastern U.S. such as in Tennessee, forests and forest products contribute more than $21 billion annually to the state’s economy [1,2]. Forestland occupies more than 14.4 million acres across Tennessee, of which around 1.2 million acres comprises softwood forest vegetation such as southern yellow pines [2]. Southern yellow pines contribute not only to the diversity of forest products but are commercially marketed in the U.S. Southern yellow pines commonly found in southeastern U.S. include loblolly pine (Pinus taeda), Virginia pine (Pinus Virginiana) and shortleaf pine (Pinus echinata). Loblolly pine is usually grown at short rotation for pulpwood and sawlogs. Similarly, shortleaf pine is primarily grown for sawlogs. Virginia pine is the most preferred Christmas tree species of the southern yellow pines. It is also used in the stabilization of mine spoils on strip-mined sites that helps to prevent soil erosion [3]. Southern yellow pines are more valuable for timber relative to hardwood such as red maple, low-grade oaks and sweetgum. This is because their seedlings are cheaper and easier to plant. Furthermore, they establish and grow at shorter rotations (20 to 35 years) relative to hardwood [3].
The mapping and monitoring of the canopy cover and greenness of loblolly, shortleaf and Virginia pines are essential to enhance forest inventory, management and planning. Satellite remote sensing can play a significant role in the mapping and monitoring of the canopy cover and greenness of southern yellow pines. This is because satellite data such as Landsat Thematic Mapper (TM), Enhanced Thematic Mapper Plus (ETM+) and Operational Land Imager (OLI) are readily available and are taken continuously over time which makes monitoring easier. Furthermore, it is easier, less time consuming and less expensive to detect southern yellow pines over large geographic areas using satellite data relative to traditional intensive field-based surveys. Moreover, the canopy greenness of southern yellow pines can be easily detected and monitored using satellite vegetation indices including the Normalized Difference Vegetation Index (NDVI). The NDVI is a commonly used vegetation quality index that is computed as the difference between near-infrared (NIR) and red reflectance divided by their sum [4,5]. The plant chlorophyll which is an important health indicator strongly absorbs the visible red light of the electromagnetic spectrum whereas; the cellular structure of the leaves strongly reflects the near-infrared light. When the plant becomes stressed by factors such as dehydration, lack of nutrients and diseases, the leaf structure deteriorates and the plant absorbs more of the near-infrared light rather than reflecting it. Therefore, examining how the near-infrared light changes relative to red light from plants using multispectral satellite data provides a better indication of the presence of chlorophyll which correlates to plant canopy greenness [5].
Some recent studies have used Landsat satellite series data to map and monitor softwood forest vegetation in the U.S. [6,7,8,9]. Vogelmann et al. [9] used Landsat time series data to monitor change in forest vegetation in Santa Fe National Forest Area, New Mexico, USA. They found decreasing trends in canopy greenness of conifer forests from 1988 to 2006 due to high levels of forest damage and mortality, likely caused by a combination of insects and drought. Furthermore, Hansen et al. [6] monitored land-cover change in the conterminous United States (CONUS) using Landsat satellite data. They found a decrease in conifer forests cover from 2006 to 2010 especially in southeastern U.S. Song et al. [10] used Landsat and Corona data to monitor forest cover change from mid-1960s to 2000s in the eastern United States. They found an annual forest loss on urban area doubled from 0.68% to 1.9% from 1960s to mid-1980s and then decreased during the following decade. Although softwood forest vegetation has been monitored in some parts of the U.S., the mapping and monitoring of canopy cover and greenness of loblolly, shortleaf and Virginia pines are limited especially in central-eastern Tennessee ecoregion. This study aims to map and monitor the canopy cover and greenness of southern yellow pines i.e., loblolly, shortleaf and Virginia pines in the years of 1988, 1999 and 2016 in central-eastern Tennessee.

2. Materials and Methods
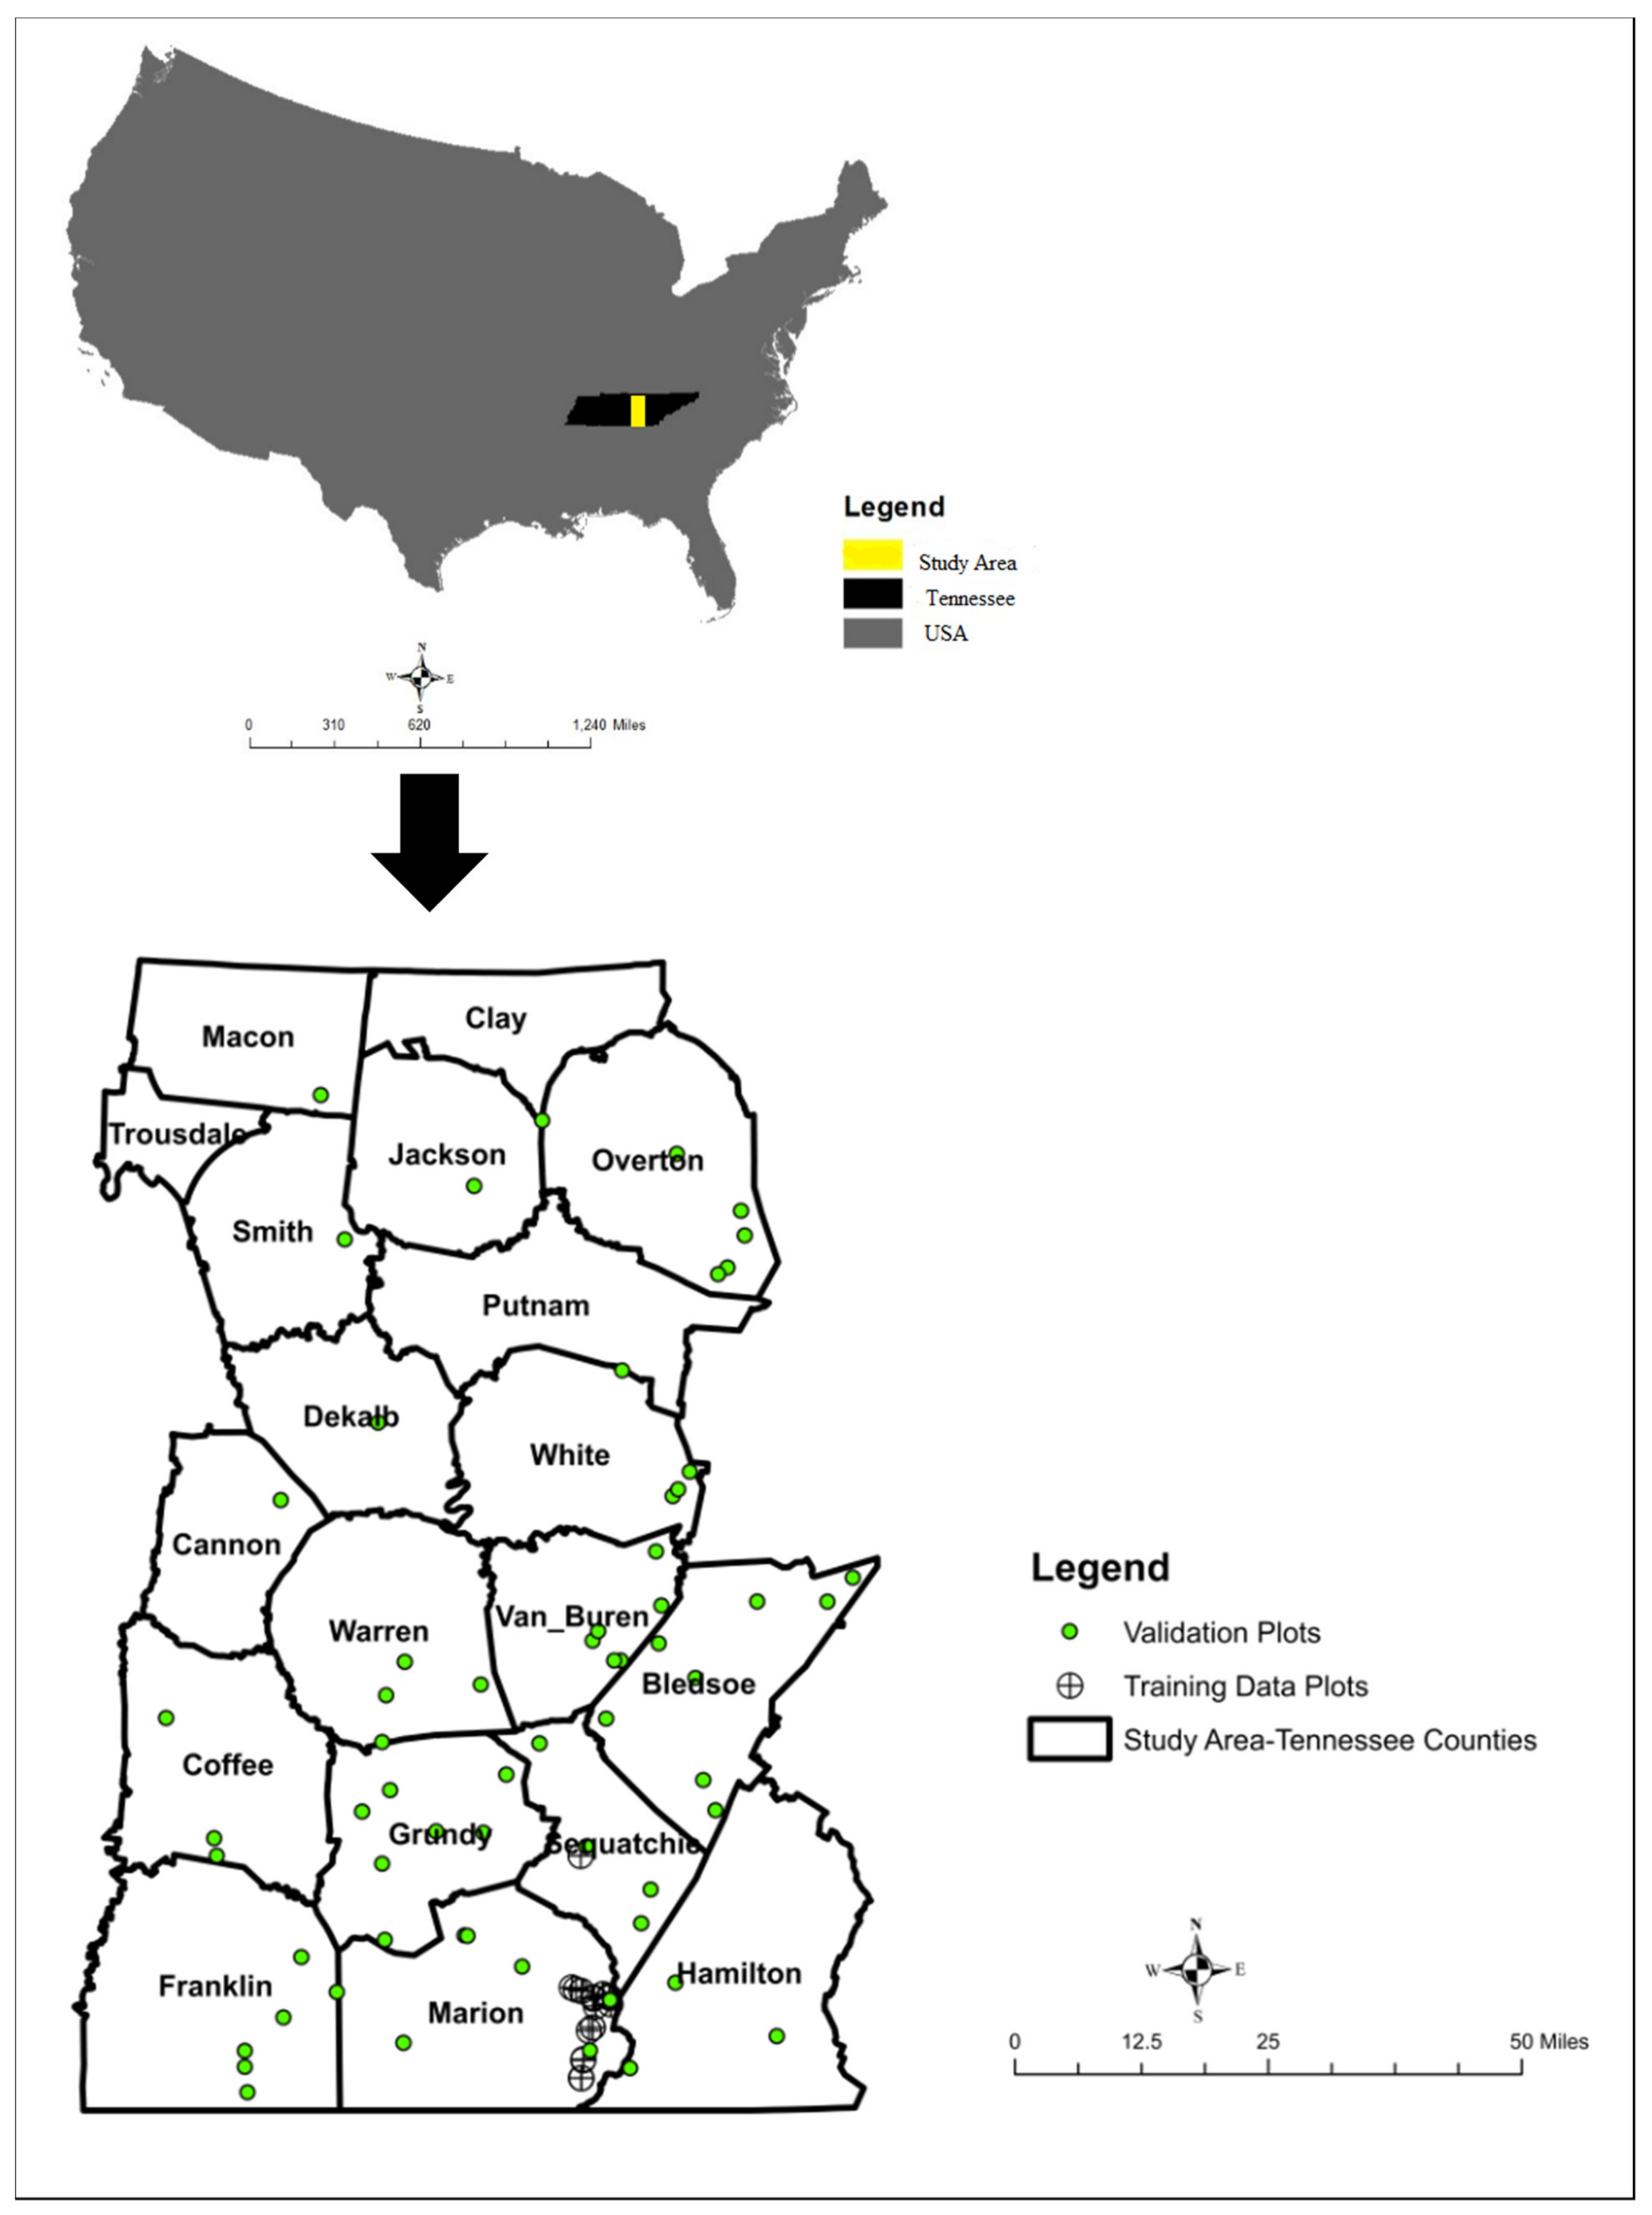
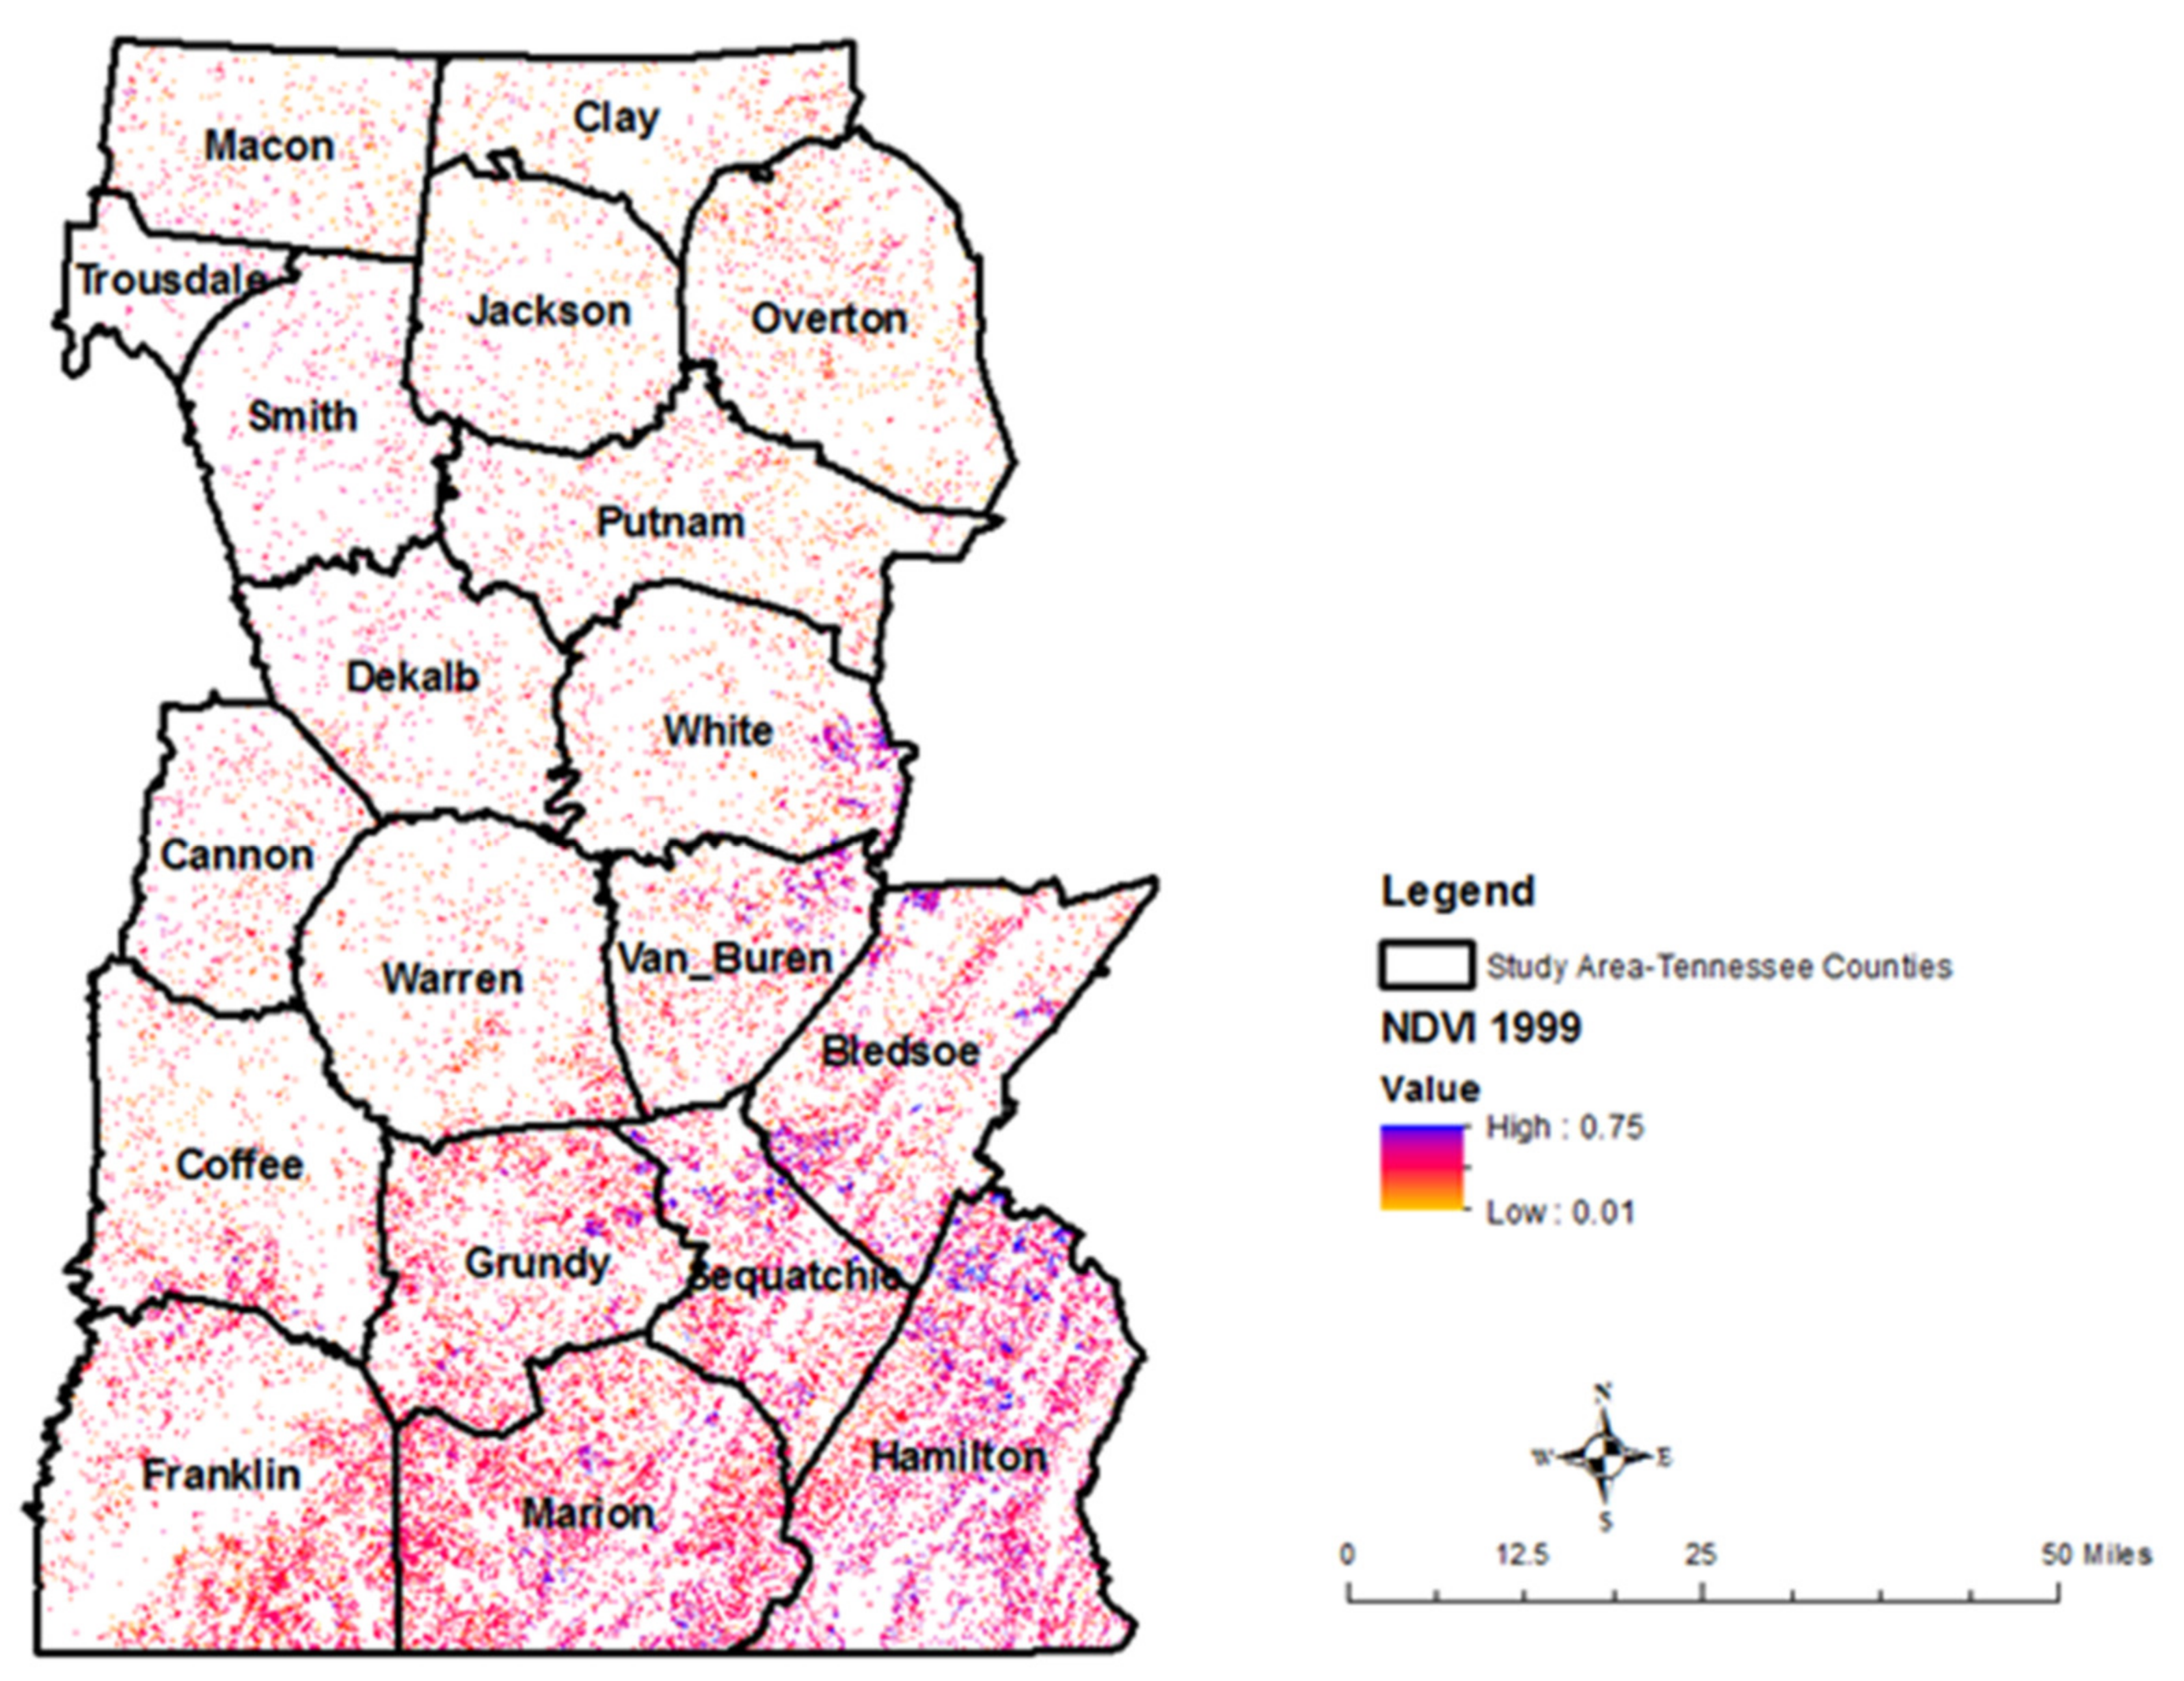
2.1. Study Area

The study area extends around central to east Tennessee and consists of 19 counties (Figure 1). The counties are made up of small unincorporated towns and were selected because of the availability cloud-free Landsat satellite data and field plots data of loblolly, shortleaf and Virginia pines.

2.2. Vegetation

The region is covered significantly by both softwood and hardwood plant species. The softwood forest vegetation types commonly found in the area include: loblolly pine (Pinus taeda), Virginia pine (Pinus Virginiana) and shortleaf pine (Pinus echinata). Hardwood forest vegetation types generally found in the region include: locust (Gleditsia spp.), poplar (Populus spp.), maple (Acer spp.), oak (Quercus spp.), elm (Ulmus spp.), beech (Fagus spp.), walnut (Juglans spp.), hickory (Carya spp.), and sycamore (Platanus spp.) [11].

2.3. Geology and Soil

The geological landforms of the region consist predominantly of the Highland Rim and Cumberland Plateau [12,13]. The Highland Rim is made up of flat and hilly terrain surrounding the Central Basin. The bedrock is predominantly limestone with karst topography such as caves, sinkholes and underground streams [13]. The Cumberland Plateau comprises of tableland, flat and rolling terrain. It consists of the Sequatchie Valley in the south and the Elk Valley in the north with erosional stream courses from faults. Sedimentary Pennsylvanian sandstone, conglomerates with siltstone, shale, and coal seams are common in the region with escarpment slopes and shallow cave-like openings on cliffs or bluffs [13].
There is a variety of soil types in the region including but not limited to the following soil series: Allen, Barger, Capshaw, Enders, Fullerton, Lily, Ramsey, Sequatchie and Whitwell series [14]. The Allen series is consisted of very deep and well drained soils that formed in loamy colluvium. The typical pedon is loam and the soils are strongly acidic. The soils are found on foot slopes and toe slopes at the base of the Cumberland Plateau. The Barger series is made up of very deep, moderately well drained soils that are formed in a loamy mantle and in underlying loamy paleosol. The typical pedon is silt loam and the soils are found on ridgetops in the Sequatchie Valley. The Capshaw series consists of deep, moderately well drained soils that are formed in a thin layer of alluvium and underlying clayey residuum. The typical pedon is silt loam and the soils are found on terraces and uplands. They are generally moderately acidic to strongly acidic in the upper horizon. The Enders series consists of deep, well drained soils that are formed in clayey residuum derived from shale. The typical pedon is silt loam and the soils are found on shale ridges at the base of the Cumberland Plateau Escarpment. The Fullerton series is made up of very deep and well drained soils that are formed in cherty, clayey residuum that weathered from limestone. The typical pedon is gravelly loam and the soils are found on side slopes and ridgetops of cherty limestone ridges. The Lily series consists of moderately deep and well drained soils that are formed in loamy residuum derived from sandstone. The typical pedon is loam and the soils are found on ridgetops and side of slopes on the Cumberland Plateau. The Ramsey series is made up of shallow and excessively drained soils that are formed in loamy residuum derived from sandstone. The typical pedon is sandy loam and the soils are found on ridges and side slopes of the Cumberland Plateau. The Sequatchie series consists of very deep and well drained soils that are formed in loamy alluvium. The typical pedon is loam and the soils are found on stream terraces and alluvial fans in the Sequatchie Valley. The Whitwell series is made up of very deep and moderately well drained soils that are formed in loamy alluvium. The typical pedon is loam and the soils are found on low terraces of the Sequatchie Valley [14].

2.4. Climate

The region’s climate is characterized by hot summers and moderately cold winters with some unpredictable cold spells and snowfall [11,12]. The mean annual temperature in the region ranges from 44 °F to 60 °F. The annual precipitation ranges from 40 inches to 76 inches and the length of growing season ranges from 158 days to 203 days.

2.5. Methodology

The methodological approach mainly includes the mapping and monitoring of the canopy cover and greenness of southern yellow pines within central-eastern Tennessee using Landsat TM, ETM+, and OLI satellite images (Figure 2).
An assessment of the temporal and spatial change in the canopy cover of southern yellow pines was performed using a post-classification comparison technique. The classification and delineation of the canopy cover of southern yellow pines involved the acquisition of satellite images, pre-processing, supervised classification and validation phases (Figure 2). The NDVI was generated from the reflectance images and the classified southern yellow pine maps were exported as raster files to the Geographic Information System (GIS) for further analyses.

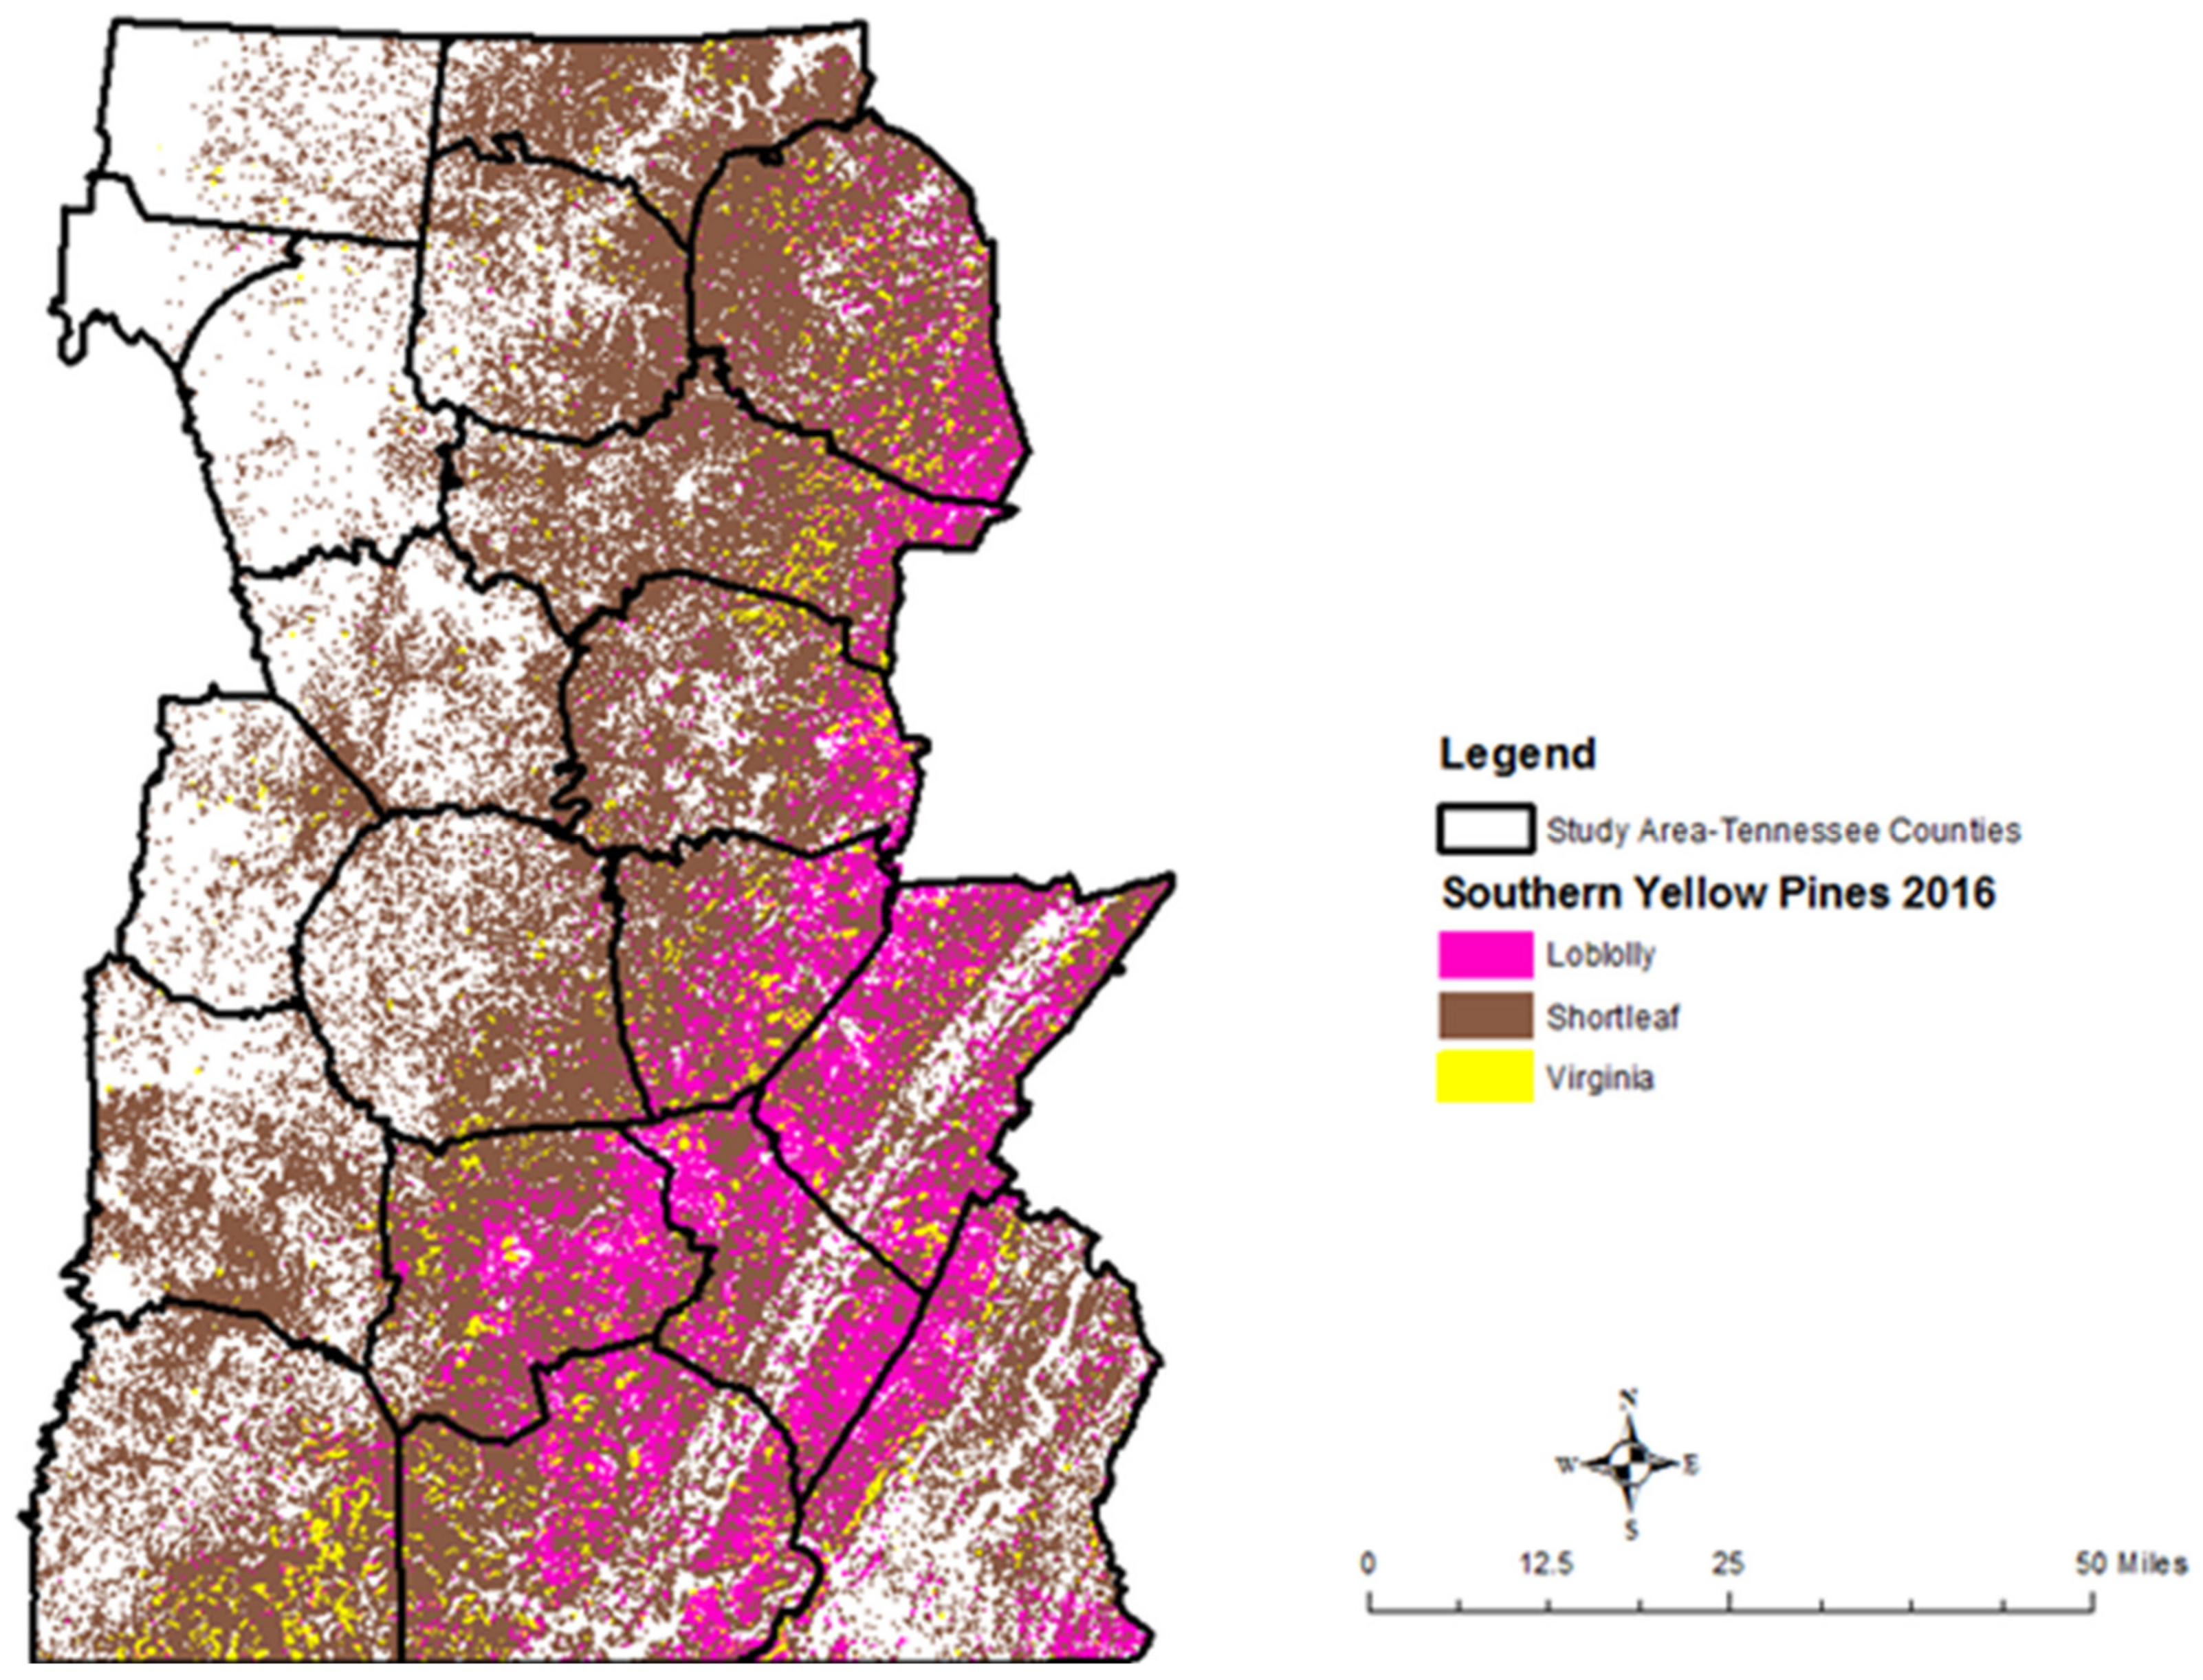
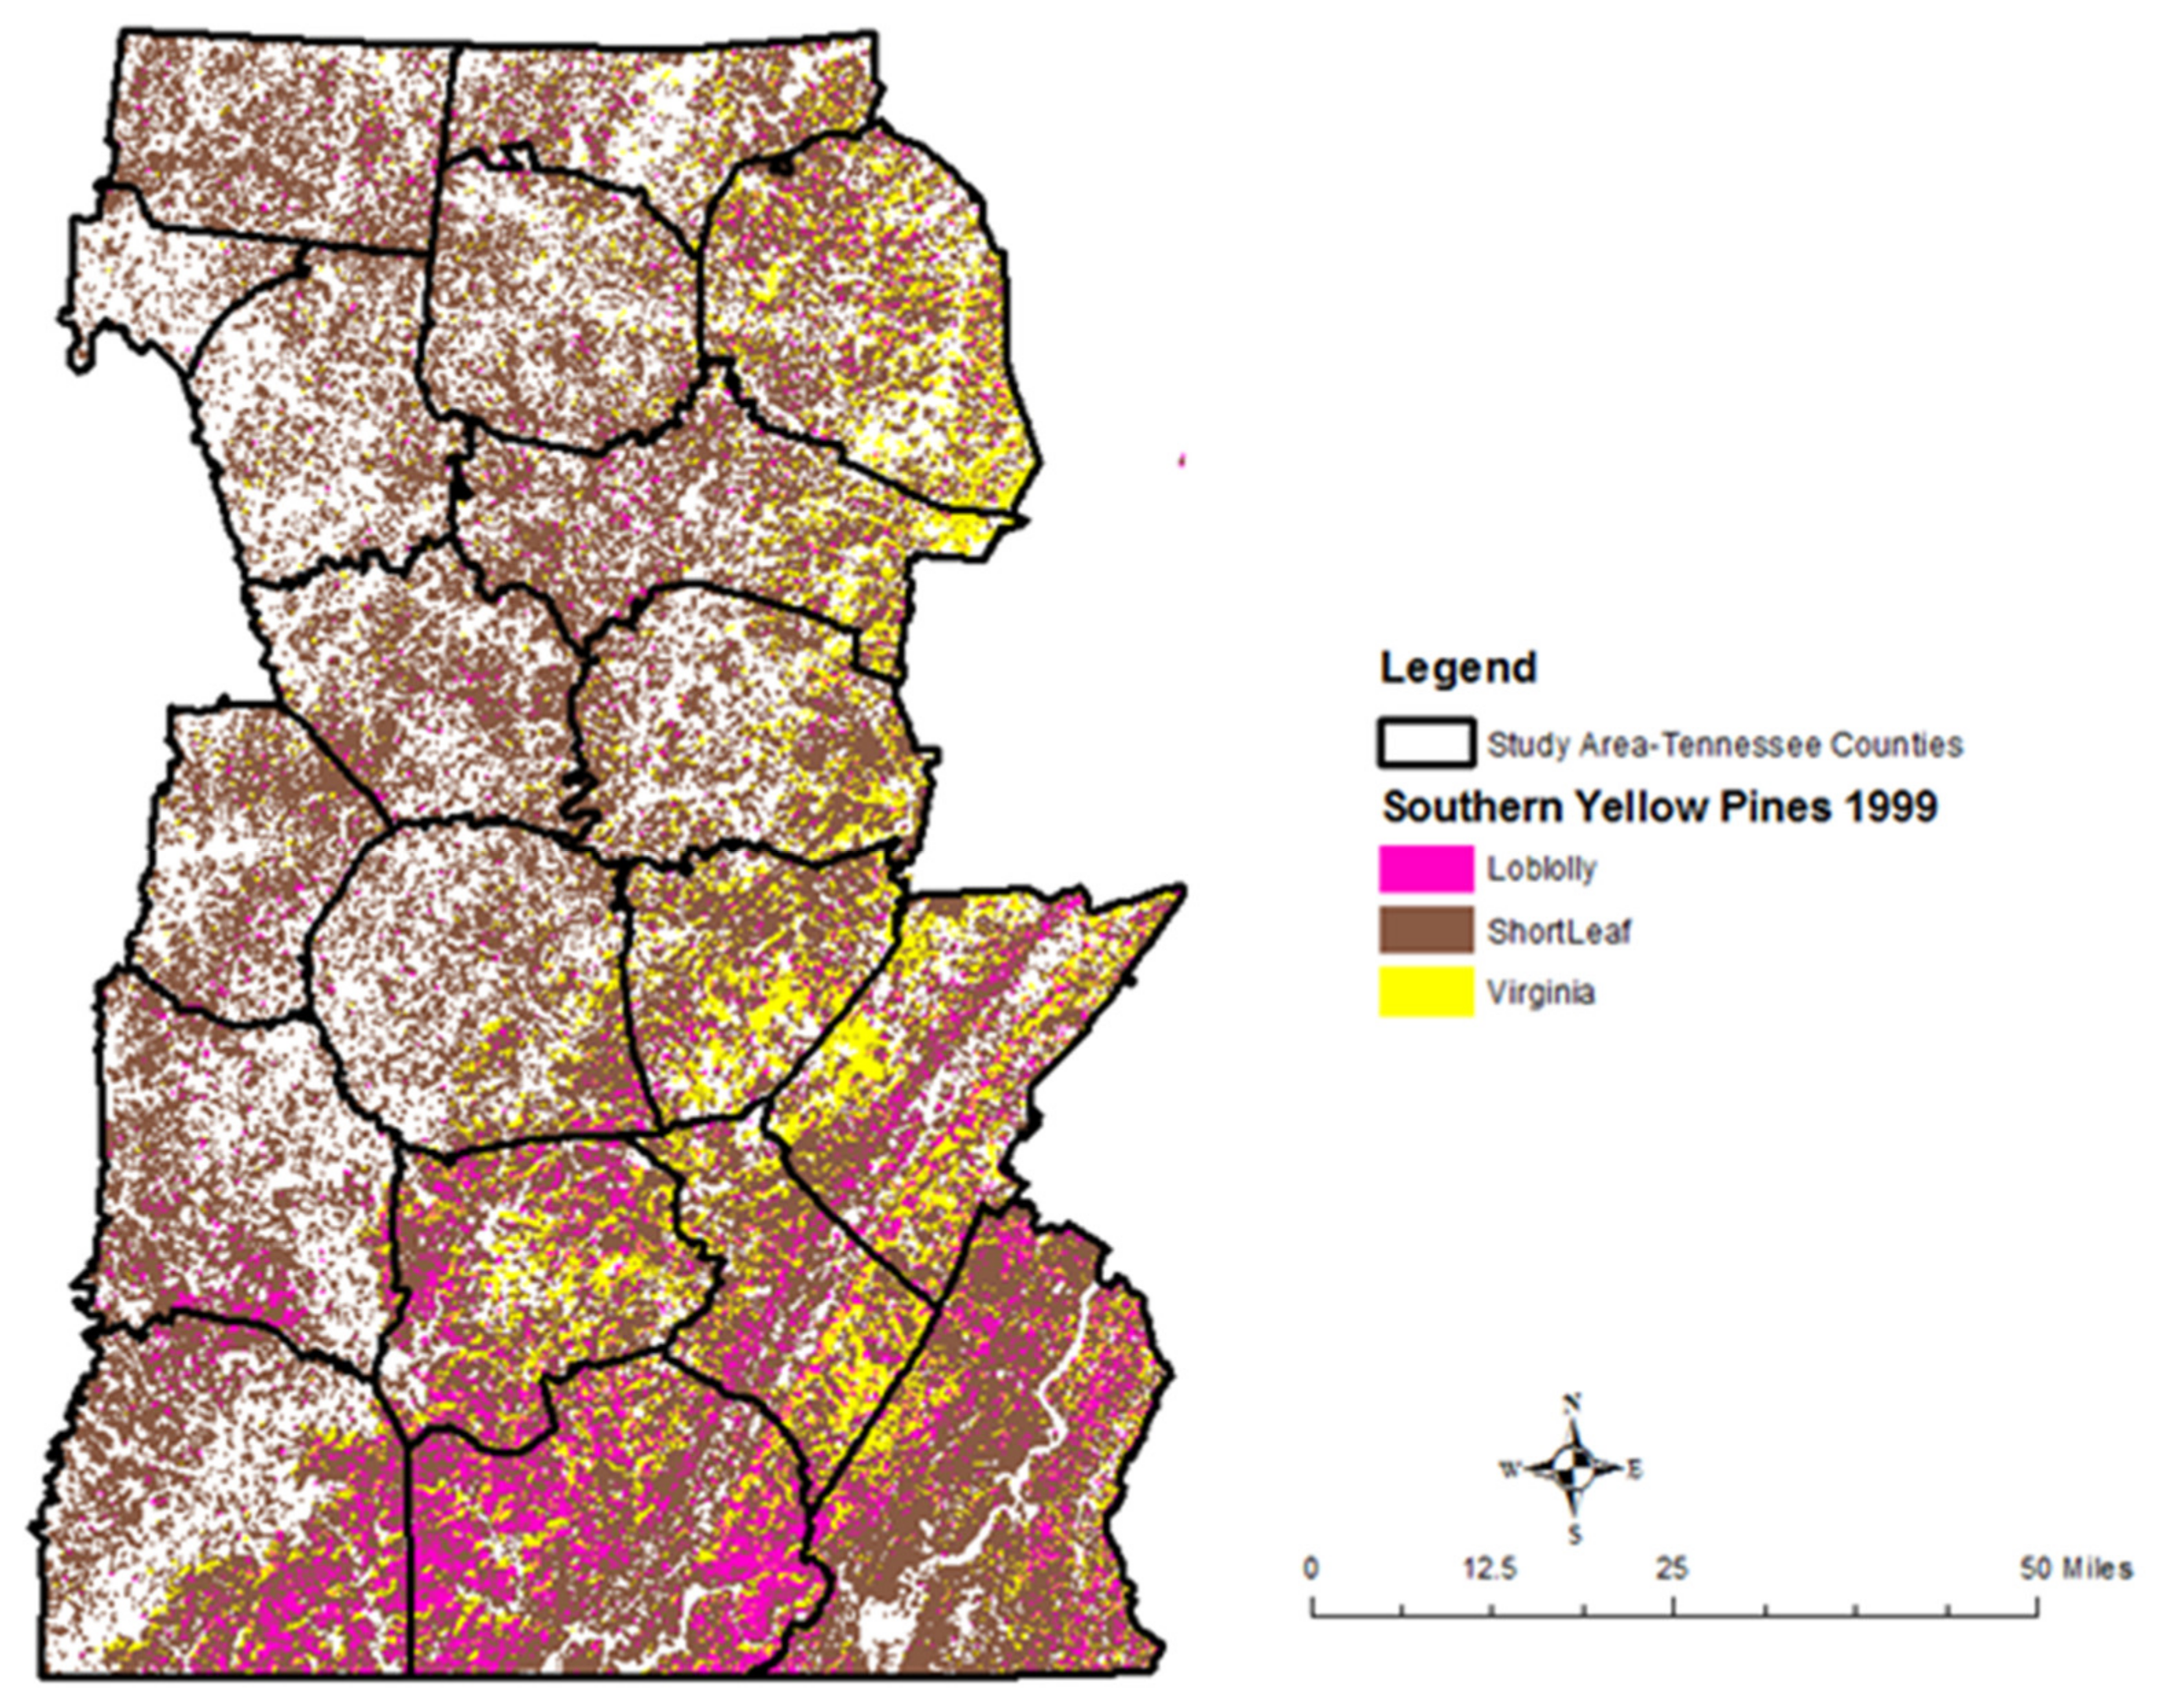
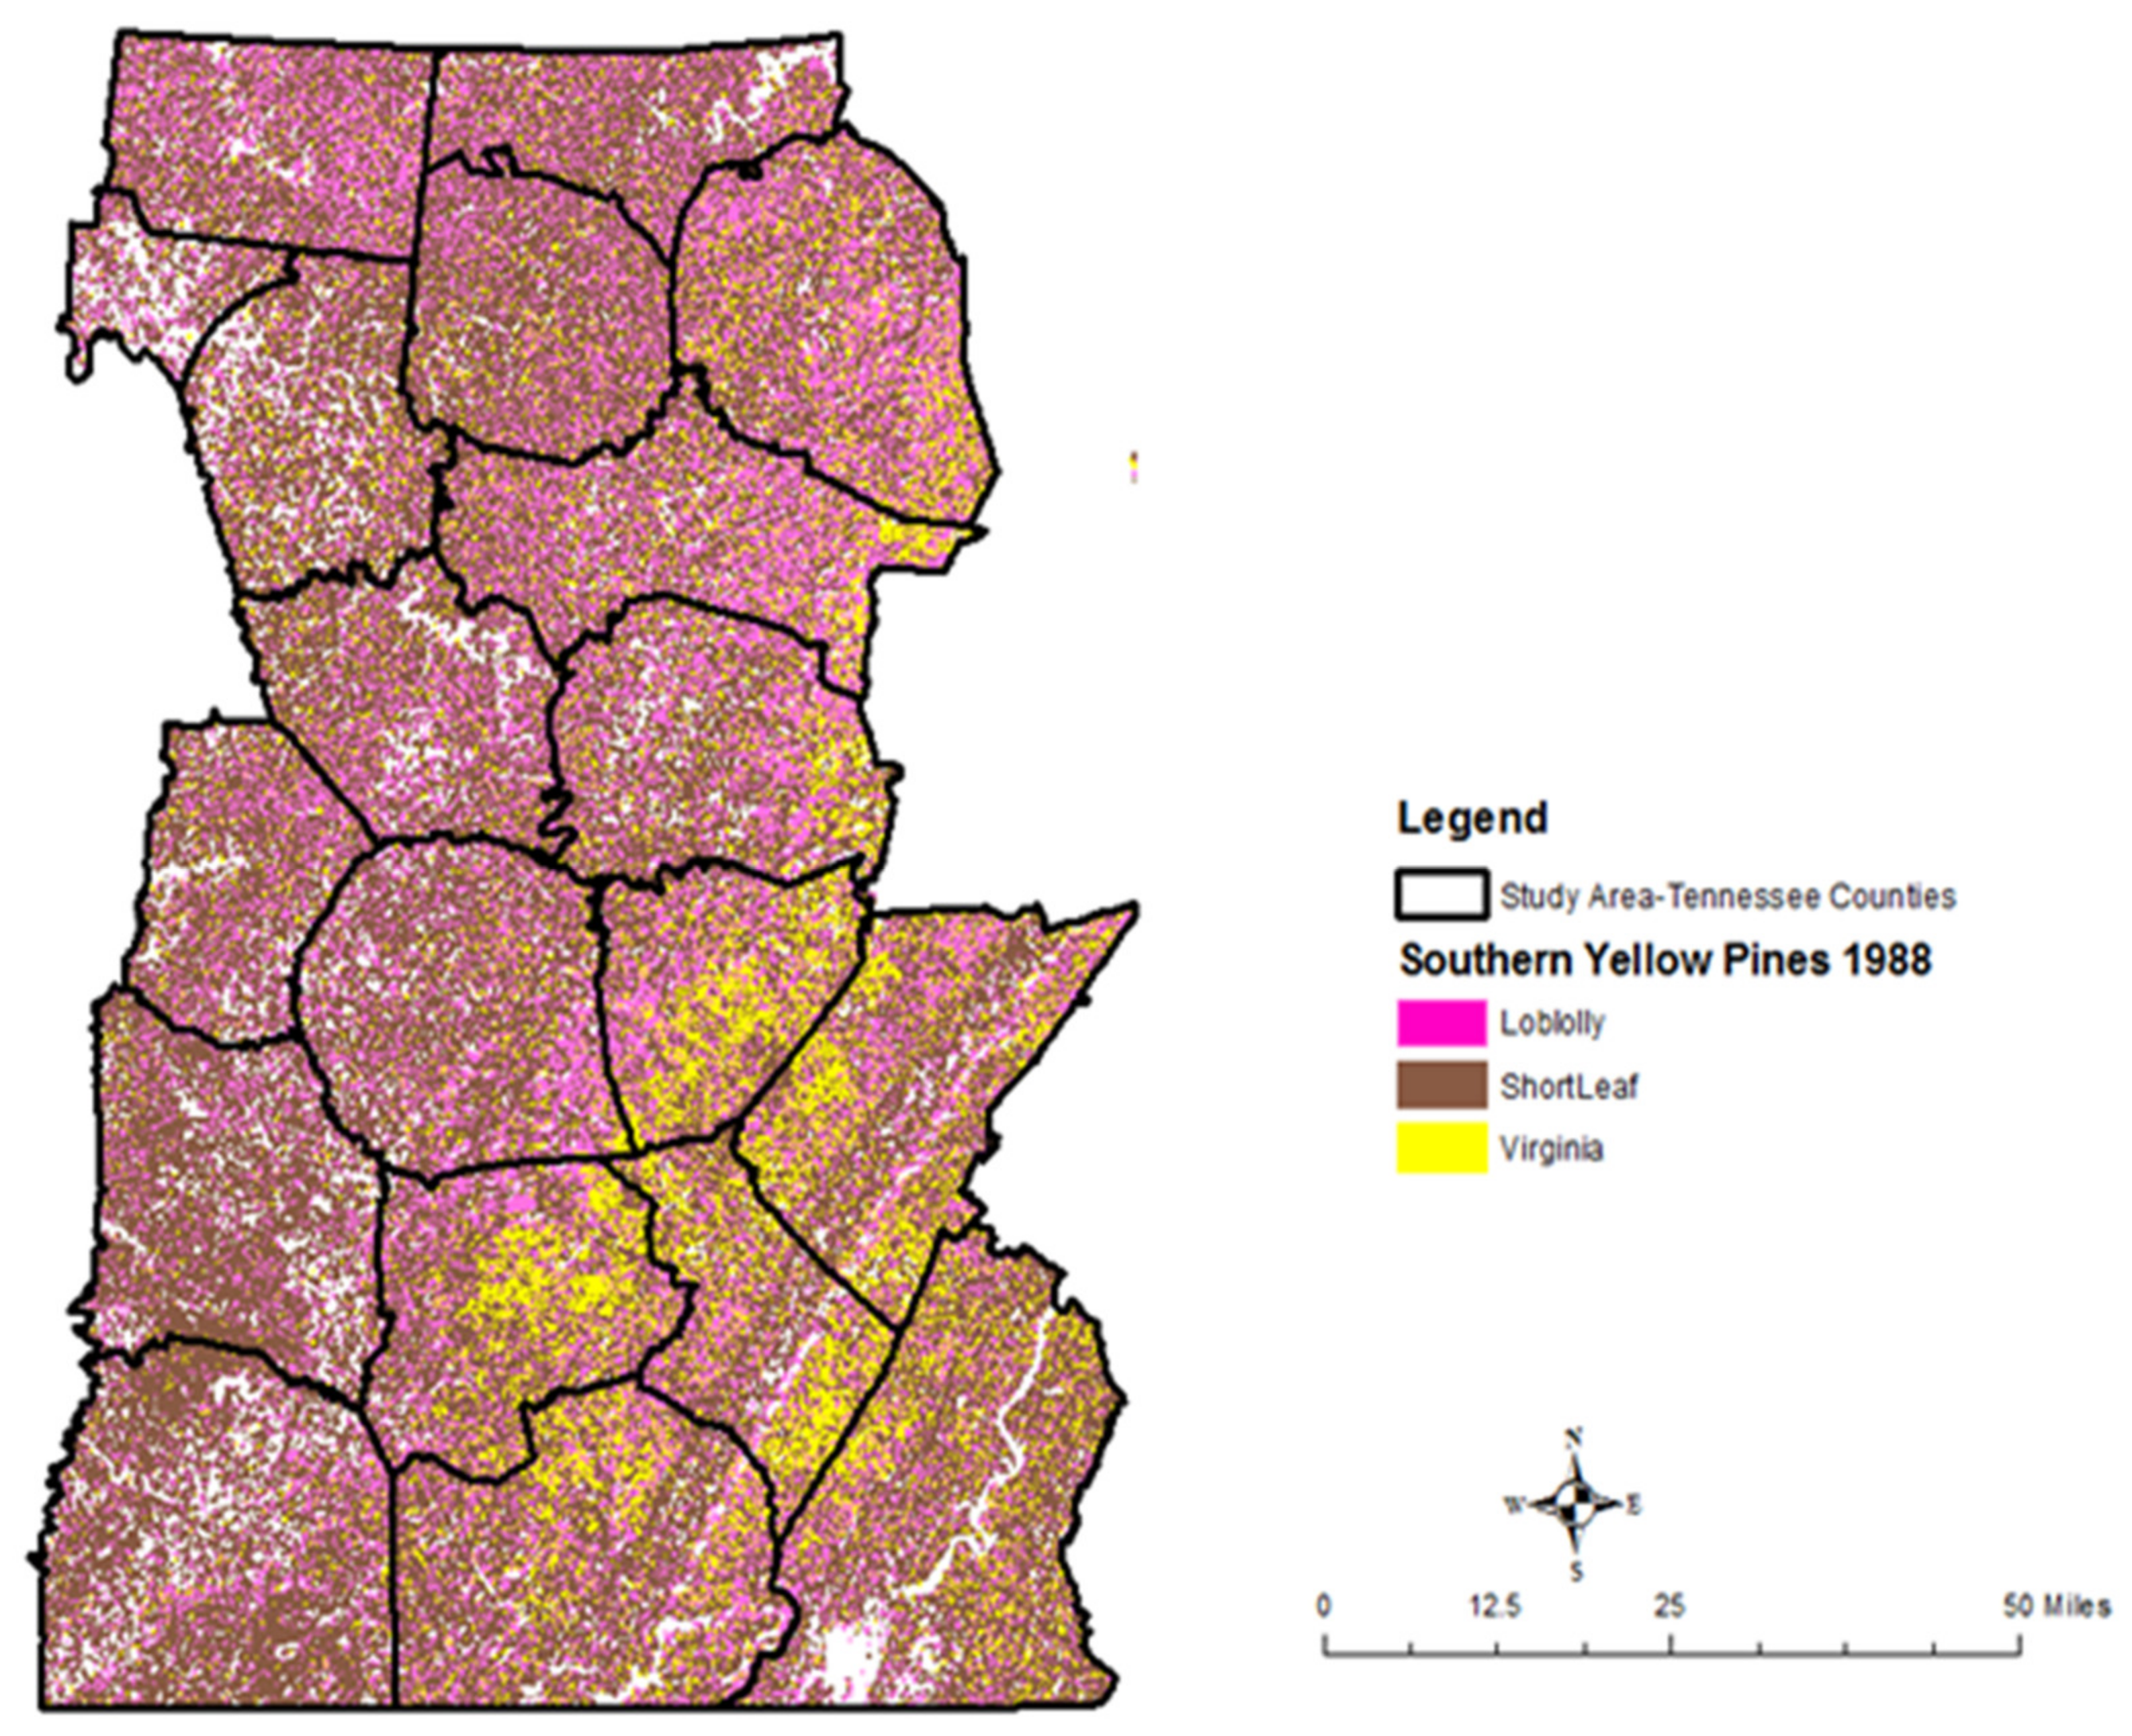
2.6. Mapping and Monitoring of the Canopy Cover and Greenness of Loblolly, Shortleaf and Virginia Pines

Landsat TM, ETM+, and OLI satellite images with acquisition dates of 6 December 1988; 4 November 1999; and 19 February 2016 respectively were used to classify and map the canopy cover and greenness of loblolly, shortleaf and Virginia Pines. The images were acquired in the late fall and winter seasons because southern yellow pines are more visible in these periods when deciduous trees shed their leaves. Two cloud-free satellite scenes acquired on each data acquisition date covering the study area were downloaded from the United States Geological Society (USGS) Science Data repository. They were downloaded as a Level-1 dataset and were pre-processed in Erdas ER Mapper version 2020. In the pre-processing phase, the Landsat TM, TM+ and OLI satellite scenes were mosaicked, subsetted, geocoded, co-registered and radiometric correction performed. The geometric correction was performed using more than 50 ground control points with a root mean square (RMS) value of less than 1 pixel. Ground control points of more than 50 were acceptable if the root mean square error value is less than one pixel and were unacceptable if the root mean square error value is more than one pixel. The radiometric correction was performed by conversion of digital numbers (DN) to at-surface reflectance. It entailed the correction of image pixel values for sun elevation angle variation and the calibration of images to account for degradation of the sensors over time. The changes in sensor calibration factors will obscure real changes on the ground [15].
The Landsat OLI mosaicked scene was converted from digital numbers to at-surface reflectance by using reflectance rescaling coefficients (Equation (1)) derived from the National Aeronautics and Space Administration [16].
ρλ’ = MpQcal + Ap
where:
  • ρλ’ = Top of atmosphere (TOA) planetary reflectance without correction for solar angle;
  • Mp = Band-specific multiplicative rescaling factor (Reflectance_Mult_Band_x, where x is the band number);
  • Ap = Band-specific additive rescaling factor (Reflectance_Add_Band_x where x is the band number);
  • Qcal = digital numbers.
The band-specific multiplicative rescaling factor (Reflectance_Mult_Band_x), and additive rescaling factor (Reflectance_Add_Band_x) were obtained in the header file of the imagery.
Furthermore, the correction of TOA planetary reflectance for sun angle was performed using Equation (2) [16].
ρλ = ρλ’/sin(θSE)
where:
  • ρλ = TOA planetary reflectance corrected for sun angle;
  • ρλ’ = TOA planetary reflectance without correction for solar angle;
  • θSE = Local sun elevation angle in degrees provided in the metadata (Sun_Elevation).
Landsat TM and ETM+ scenes were converted from digital numbers to radiance by using Equation (3) [11,17].
Lrad = Bias + (Gain × DN)
where:
  • Lrad = Spectral radiance, W/m2/sr/μm;
  • DN = Digital number.
The spectral values of gain and bias for Landsat TM and ETM+ images were obtained from the header files.
The conversion of spectral radiance to TOA planetary reflectance for Landsat TM and ETM+ was obtained using Equation (4) [11,17]:
RTOA = (π × Lrad × d2)/(ESUNi × cos (z))
where:
  • RTOA = the TOA planetary reflectance;
  • Lrad = is the spectral radiance at the sensor’s aperture;
  • π = ≈3.14159;
  • ESUNi = the mean solar exoatmospheric irradiance of each band;
  • d = the earth-sun distance, in astronomical units, which is calculated using the following EXCEL equation [18,19]:
d = (1 − 0.01672 × COS (RADIANS (0.9856 × (Julian_Day − 4))))
  • z = solar zenith angle (zenith angle = 90 − solar elevation angle), solar elevation angle is within the header file of the satellite images.
The top-of-atmosphere reflectance images of the Landsat satellite data were used to generate NDVI values of loblolly, shortleaf and Virginia pines as indicator of their canopy greenness. The NDVI was generated using Equation (5) [20]:
NDVI = (Near-Infrared−Red)/(Near-Infrared + Red)
The canopy cover of loblolly, shortleaf and Virginia pines was classified and mapped using twenty-two (22) field plots data of southern yellow pines i.e., seven (7)-loblolly, twelve (12)-shortleaf and three (3)-Virginia pines. The field plot data were obtained from Area Foresters at Tennessee Department of Agriculture and were polygon digitized to serve as training data in the classification and mapping of the canopy cover of loblolly, shortleaf and Virginia pines. The training data were used to extract spectral signatures of the southern yellow pines for supervised classification. Spectral bands in the visible and infrared sections of the electromagnetic spectrum on all datasets were used in the supervised classification of the canopy cover of southern yellow pines. The supervised classification was performed using a machine-learning random forest classification algorithm with digitized polygons (training data) of southern yellow pines. The default number of training samples was set at 5000 and the number of trees was set at 10. This algorithm was selected because the machine-learning random forest classification algorithm consists of a combination of tree classifiers where each classifier is generated using a random vector sampled independently from the input vector, and each tree casts a unit vote for the most popular class to classify an input vector [19]. Furthermore, the machine-learning random forest classification algorithm has been found to outperform other machine-learning classification algorithms such as support vector machines in mapping forest species [21]. This classification algorithm is commonly used in remote sensing image classification because of its ability to handle high data dimensionality and multicollinearity [22].
The canopy cover map of southern yellow pines generated from 2016 satellite imagery was validated to examine how well the classified canopy cover of loblolly, shortleaf and Virginia pines on the map represented southern yellow pines on the ground. This was performed by randomly selecting 62 polygons from the classified canopy cover map of southern yellow pines. Ground truthing by field visits and use of Google Earth Pro information was used to validate the classified loblolly, shortleaf and Virginia pines derived from the map with those on the ground. The overall accuracy was computed by dividing the total correct (i.e., the sum of the major diagonal in the error matrix table) by the total number of pixels in the error matrix table [20]. The kappa statistic was also measured as described by Mather [18]. Due to a lack of past data of southern yellow pines for the region, we did not carry out validation on the classified canopy cover maps of southern yellow pines generated for the years 1999 and 1988. The digitally classified canopy cover maps of southern yellow pines were later exported into the GIS environment for further analyses of canopy cover and greenness of southern yellow pines.

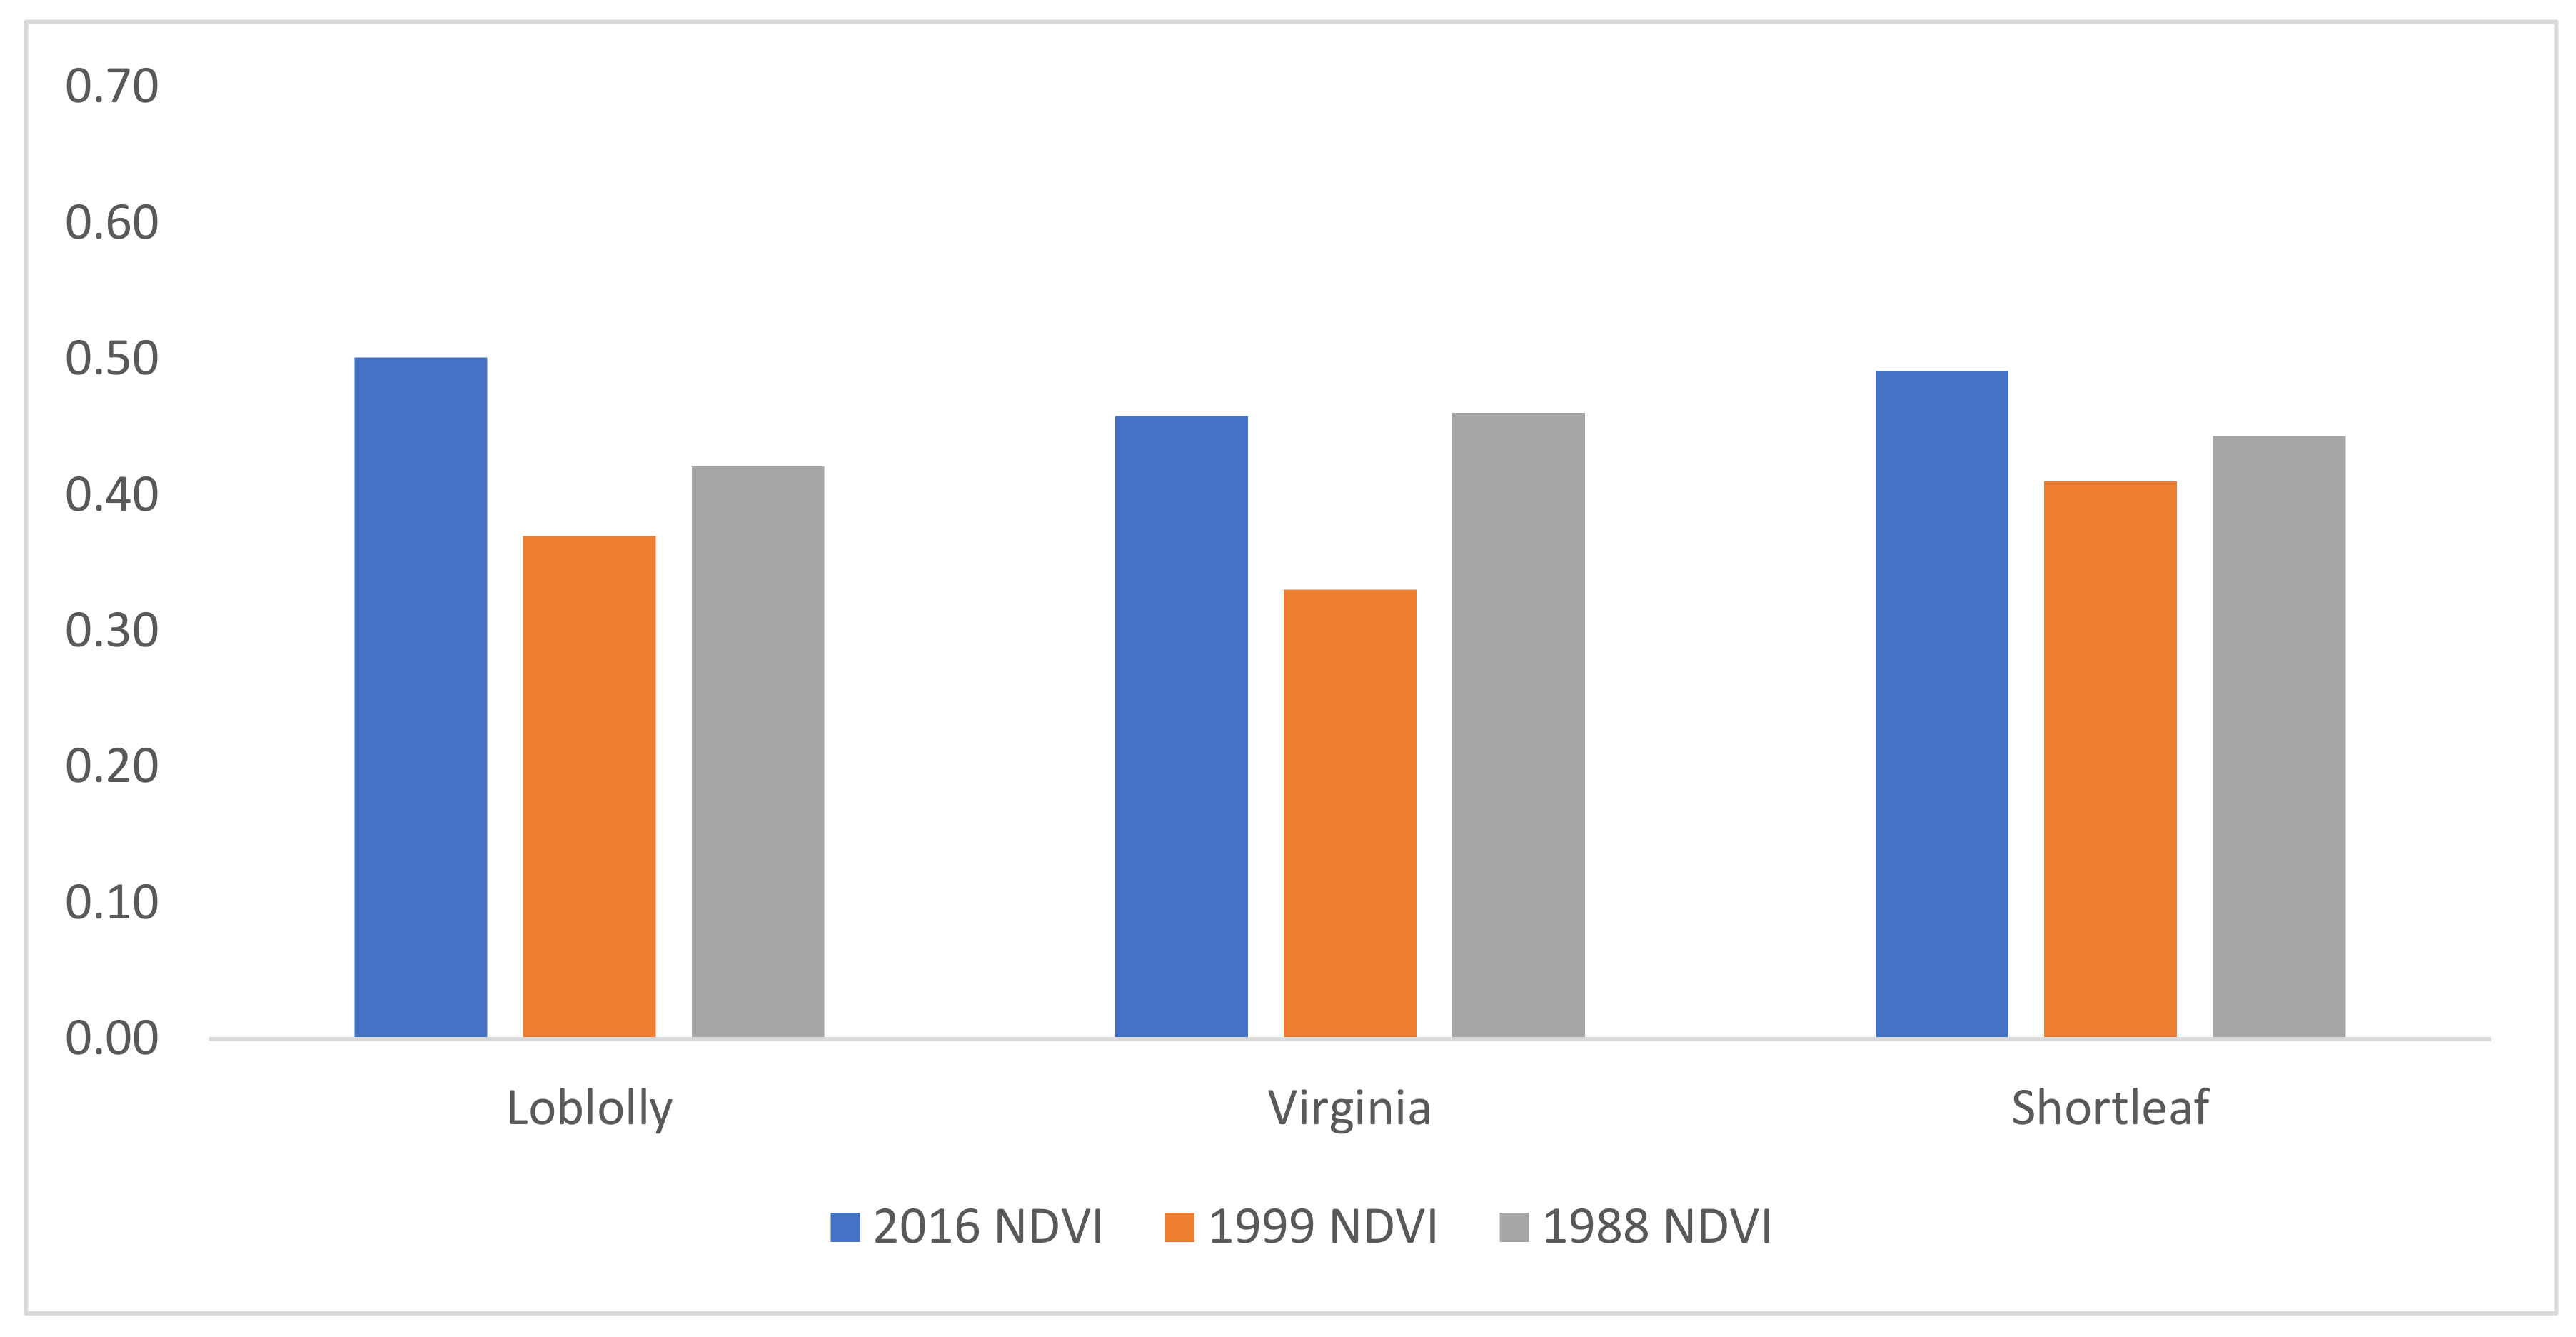
3. Results and Discussion

The study found southern yellow pines distributed in most parts of the study area with a similar pattern of distribution especially in the southern portion of the study (Figure 3, Figure 4 and Figure 5). In the December 1988 map, there was more southern yellow pines detected in the northwestern parts of the study area relative to the November 1999 and February 2016 maps (Figure 3, Figure 4 and Figure 5). Loblolly, Virginia and shortleaf pines’ canopy covered about 110,229 ha (37%), 83,578 ha (28%) and 104,116 ha (35%) respectively in December 1988. In November 1999, loblolly, Virginia and shortleaf pines’ canopy occupied about 44,749 ha (21%) 24,932 ha (12%) and 146,192 ha (67%) respectively. The area covered by loblolly pine canopy was around 39,507 ha (21%), Virginia pine was approximately 3942 ha (2%) and shortleaf pine was about 145,522 ha (77%) in February 2016 (Table 1).
Loblolly pine canopy cover decreased by about 59% between December 1988 and November 1999 and 12% between November 1999 and February 2016. Overall, loblolly pine’s canopy cover decreased by about 64% between December 1988 and February 2016. Similarly, Virginia pine’s canopy cover decreased by around 70% between December 1988 and November 1999 and 84% between November 1999 and February 2016. In general, Virginia pine’s canopy cover decreased by about 95% between December 1988 and February 2016. In contrast, shortleaf pine canopy cover increased by about 40% between December 1988 and November 1999 and there was no significant cover change between November 1999 and February 2016. Overall, shortleaf pine’s canopy cover increased by approximately 40% between December 1988 and February 2016. The dry, better-drained ridgetops associated with the Highland Rim and Cumberland Plateau commonly found in the region possibly provided a suitable condition for the growing of shortleaf pine. In total, the canopy cover of southern yellow pines decreased by about 37% between December 1988 and February 2016. The loss in canopy cover of the softwood forest vegetation species is likely due to intensive plantation forestry in the region. This is because southern yellow pines function more as commodity crops and are continually harvested for pulpwood and saw timber products [3,6]. Furthermore, other aspects such as the southern pine beetle outbreak that began in 1998 in east Tennessee and continued through 2001 in southwest Tennessee [23] likely contributed to the loss of southern yellow pines, especially loblolly pine. This is because loblolly pine has been found to be very susceptible to southern pine beetle infestation [3]. The loss in forest vegetation species canopy cover in this study is similar to other studies that have found a loss in forest canopy cover in the southeastern United States [10,24,25].
The loblolly, shortleaf and Virginia pines were classified and mapped with an overall accuracy of about 74% in February 2016 classification (Table 2). The producer accuracy which is the ability of the random forest classification algorithm to detect southern yellow pines was maximum for Virginia pine and minimum for loblolly pine. In contrast, the user accuracy that demonstrates how well the classified canopy cover of loblolly, shortleaf and Virginia pines on the map represented southern yellow pines on the ground was the highest (80%) for loblolly pine and the lowest (68%) for shortleaf pine. This implies about 32% of shortleaf pine on the map did not represent shortleaf pine on the ground. Furthermore, about 20% of loblolly pine on the map did not represent loblolly pine on the ground. There was some confusion in the detection of shortleaf pine with loblolly pine according to the classification. The kappa value was 0.6 and indicated a medium correlation between the remotely sensed classified data and reference data assuming the data are randomly sampled from a multinomial distribution with a large sample size [26].
There were some limitations in the classification and mapping of the canopy cover of loblolly, shortleaf and Virginia pines in this study. For example, the number of training data plots was limited especially for Virginia pine. There were three (3) Virginia pine training data plots relative to loblolly (7-plots) and shortleaf (12-plots). This likely contributed to the low detection of Virginia pine and the smallest canopy cover computed in the study periods. However, the training data plots of southern yellow pines used in this study were the only available datasets with planting date information. The planting dates were useful to allocate loblolly, shortleaf and Virginia plots that existed in December 1988, November 1999 and February 2016 when Landsat satellite data were acquired for this study. Furthermore, there was also a limitation in the validation of the canopy cover maps of southern yellow pines generated in December 1988 and November 1999. This is because there was a lack of past southern yellow pine maps for the study area that could have been used in the validation process. However, because similar training data plots were used in the temporal classification of southern yellow pines in this study, we assumed that the overall accuracies of the canopy cover maps of southern yellows of December 1988 and November 1999 will likely be similar to the overall accuracy (74%) of the February 2016 canopy cover map of southern yellow pines.
The NDVI values of loblolly, shortleaf ad Virginia pines that indicated the canopy greenness ranged from 0.03 to 0.81 in December 1988; 0.01 to 0.75 in November 1999; and 0.07 to 0.75 in February 2016 (Figure 6, Figure 7 and Figure 8).
The mean NDVI ± standard deviation (SD) of loblolly pine canopy was about 0.42 ± 0.05 in December 1988. The mean NDVI ± SD of loblolly pine canopy decreased to about 0.37 ± 0.03 in November 1999 and increased to around 0.50 ± 0.07 in February 2016. Similarly, the mean NDVI ± SD of the shortleaf pine canopy was approximately 0.44 ± 0.06 in December 1988. The mean NDVI ± SD of shortleaf pine canopy decreased to about 0.41 ± 0.05 in November 1999 and increased to around 0.49 ± 0.03 in February 2016. In contrast, the mean NDVI ± SD of Virginia pine canopy was about 0.46 ± 0.05 in December 1988, and 0.46 ± 0.04 in February 2016. The mean NDVI ± SD of Virginia pine canopy decreased to about 0.33 ± 0.05 in November 1999 (Figure 9).
In total, the mean NDVI ± SD of the canopy of southern yellow pines was around 0.44 ± 0.06 in December 1988. The mean NDVI ± SD of the canopy of southern yellow pines decreased to about 0.37 ± 0.04 in November 1999 and increased to approximately 0.48 ± 0.05. The southern pine beetle outbreak that occurred in 1998 and continued through 2001 in Tennessee likely contributed to the lowest NDVI values of the canopy of southern yellow pines in November 1999. In general, the canopy of shortleaf pine had the maximum NDVI ± SD of about 0.45 ± 0.05; while Virginia pine had the minimum NDVI ± SD of around 0.42 ± 0.05. This implies shortleaf pine canopy cover was greenest during the periods of study relative to loblolly and Virginia pines. The geological landscape of the region that consisted of dry and better-drained ridgetops possibly provided a suitable condition for shortleaf pine to flourish. However, it should be noted that the canopy NDVI values of the southern yellow pines in this study were captured in the late fall and winter seasons when plant vigor and photosynthetic activities are low and did not represent the yearly seasonal range of canopy NDVI values of loblolly, shortleaf and Virginia pines. Further research will explore the seasonal variation of canopy NDVI values of southern yellow pines. Nonetheless, the range in canopy NDVI values of loblolly, shortleaf and Virginia pines in this study provided new information on the condition of southern yellow pines’ canopy greenness in the periods of December 1988, November 1999 and February 2016.

4. Conclusions

This study has mapped and monitored the canopy cover and greenness of loblolly, shortleaf and Virginia pines in central-eastern Tennessee using satellite data acquired in December of 1988, November of 1999 and February of 2016. The canopy cover of southern yellow pines was mapped with overall classification accuracy of about 74% according to the February 2016 classification map. In total loblolly pine canopy cover decreased by about 64% between December 1988 and February 2016 while shortleaf pine canopy cover increased by about 40% in the same period. In general, the mean NDVI ± SD of loblolly, shortleaf and Virginia pines was around 0.44 ± 0.06 in December 1988. The mean NDVI ± SD of the canopy of southern yellow pines decreased to about 0.37 ± 0.04 in November 1999 and increased to approximately 0.48 ± 0.05. The geological condition, plantation forestry and southern pine beetle outbreak that occurred in the region likely contributed to the change in canopy cover and greenness of loblolly, shortleaf and Virginia pines.
The small number of training data plots of Virginia pine used in the canopy cover classification and mapping was a limitation in this study. This likely contributed to the low detection of Virginia pine in the study periods. Nonetheless, the training data plots of southern yellow pines had planting dates relevant for their monitoring in December 1988, November 1999 and February 2016. Further studies looking at seasonal variation in canopy greenness and wetness of loblolly, shortleaf and Virginia pines in other ecoregions would be beneficial to understand the seasonal condition of these softwood forest vegetation species and their susceptibility to external factors such as drought, diseases and fire. Furthermore, the mapping and monitoring of canopy cover of these softwood forest vegetation species in other ecoregions would also be relevant to support forest management and planning. However, these are areas of further research.

Author Contributions

Conceptualization, C.A.; methodology, C.A. and R.S.; validation, R.S. and C.A.; formal analysis, C.A. and R.S.; writing—original draft preparation, C.A.; writing—review and editing, C.A. and S.H.; visualization, C.A. and S.H.; supervision, C.A.; project administration, C.A.; All authors have read and agreed to the published version of the manuscript.

Funding

This research received no external funding.

Institutional Review Board Statement

Not applicable.

Informed Consent Statement

Not applicable.

Acknowledgments

Many thanks to Jim D. Lane at Prentice Cooper State Forest and Brian Hughett at Tennessee Department of Agriculture, Forestry Section for providing field plot dataset used to carry out this project. Our appreciation to United States Department of Agriculture (USDA) for providing support through Mcintire Stennis funding program.

Conflicts of Interest

The authors declare no conflict of interest.

References

  1. English, B.; Menard, J.; Jensen, K. Tennessee’s Forest and Forest Products Industry and Associated Economic Impacts for 2000; Research Series 01–04; The University of Tennessee, Institute of Agriculture, Agricultural Experiment Station, Department of Agricultural Economics: Knoxville, TN, USA, 2004; Available online: https://www.forestryimpacts.net/reports/tennessee/ForestMainDoc.pdf (accessed on 20 November 2020).
  2. Young, T.M.; Hodges, D.G.; Rials, T.G. The forest products economy of Tennessee. For. Prod. J. 2007, 57, 12–19. [Google Scholar]
  3. Clabo, D.C.; Clatterbuck, W. A Tennessee Landowner and Practitioner Guide for Establishment and Management of Shortleaf and Other Pines. University of Tennessee Extension, Institute of Agriculture. The University of Tennessee PB1751. 2005. Available online: http://shortleafpine.net/admin/panel-documents/PB1751FinalPrint.pdf (accessed on 15 October 2020).
  4. Arabameri, A.; Pourghasemi, H.R. Spatial Modeling of Gully Erosion Using Linear and Quadratic Discriminant Analyses in GIS and R. In Spatial Modeling in GIS and R for Earth and Environmental Sciences; Pourghasemi, H.R., Gokceoglu, C., Eds.; Elsevier Inc: Amsterdam, The Netherlands, 2019; pp. 299–321. [Google Scholar]
  5. Gessesse, A.A.; Melesse, A.M. Temporal relationships between time series CHIRPS-rainfall estimation and eMODIS-NDVI satellite images in Amhara Region, Ethiopia. In Extreme Hydrology and Climate Variability: Monitoring, Modelling, Adaptation and Mitigation; Melesse, A.M., Abtew, W., Senay, G., Eds.; Elsevier Inc: Amsterdam, The Netherlands, 2019; pp. 81–92. [Google Scholar]
  6. Hansen, M.C.; Egorov, A.; Potapov, P.V.; Stehman, S.V.; Tyukavina, A.; Turubanova, S.A.; Roy, D.P.; Goetz, S.J.; Loveland, T.R.; Ju, J.; et al. Monitoring conterminous United States (CONUS) land cover change with Web-Enabled Landsat Data (WELD). Remote Sens. Environ. 2014, 140, 466–484. [Google Scholar] [CrossRef] [Green Version]
  7. Hogland, J.; Anderson, N.; Affleck, D.L.R.; Peter, J.S. Using Forest Inventory Data with Landsat 8 Imagery to Map Longleaf Pine Forest Characteristics in Georgia, USA. Remote Sens. 2019, 11, 1803. [Google Scholar] [CrossRef] [Green Version]
  8. Landenburger, L.; Lawrence, R.L.; Podruzny, S.; Schwartz, C.C. Mapping Regional Distribution of a Single Tree Species: Whitebark Pine in the Greater Yellowstone Ecosystem. Sensors 2008, 8, 4983–4994. [Google Scholar] [CrossRef] [PubMed] [Green Version]
  9. Vogelmann, J.E.; Tolk, B.; Zhu, Z. Monitoring forest changes in the southwestern United States using multitemporal Landsat data. Remote Sens. Environ. 2009, 113, 1739–1748. [Google Scholar] [CrossRef]
  10. Song, D.; Huang, C.; Sexton, J.O.; Channan, S.; Feng, M.; Townshend, J.R. Use of Landsat and Corona data for mapping forest cover change from the mid-1960s to 2000s: Case studies from the Eastern United States and Central Brazil. ISPRS J. Photogramm. Remote Sens. 2015, 103, 81–92. [Google Scholar] [CrossRef] [Green Version]
  11. Akumu, C.E.; Henry, J.; Gala, T.; Dennis, S.; Reddy, C.; Tegegne, F.; Haile, S.; Archer, R.S. Inland Wetlands Mapping and Vulnerability Assessment Using an Integrated Geographic Information System and Remote Sensing Techniques. Glob. J. Environ. Sci. Manag. 2018, 4, 387–400. [Google Scholar]
  12. Hodges, J.A.; Norrell, R.J.; Sarah, M.H. Tennessee; Encyclopedia Britannica, Inc.: Chicago, IL, USA, 2018; Available online: https://www.britannica.com/place/Tennessee (accessed on 25 December 2020).
  13. Tennessee Naturalist. Geology and Ecology Foundation and Context Enhanced Study Guide. Tennessee Naturalist Program. 2018. Available online: www.tnnaturalist.org (accessed on 20 January 2021).
  14. USDA. Published Soil Surveys for Tennessee. United States Department of Agriculture, Natural Resources Conservation Service. 2021. Available online: https://www.nrcs.usda.gov/wps/portal/nrcs/surveylist/soils/survey/state/?stateId=TN (accessed on 23 March 2021).
  15. Mather, P.M. Computer Processing of Remotely-Sensed Images; John Wiley and Sons: Chichester, UK, 1999. [Google Scholar]
  16. National Aeronautics and Space Administration. Landsat 8 Science Data Users Handbook. National Aeronautics and Space Administration, United States Geological Society. 2018. Available online: https://www.usgs.gov/core-science-systems/nli/landsat/landsat-8-data-users-handbook (accessed on 25 December 2020).
  17. National Aeronautics and Space Administration. Landsat User Guide. National Aeronautics and Space Administration, United States Geological Society. 2017. Available online: https://www.usgs.gov/core-science-systems/nli/landsat/landsat-7-data-users-handbook (accessed on 25 December 2020).
  18. Archard, F.; D’Souza, G. Collection and Pre-Processing of NOAA-AVHRR 1 km Resolution Data for Tropical Forest Resource Assessment. Report EUR 16055, European Commission: Luxembourg. 1994. Available online: https://op.europa.eu/en/publication-detail/-/publication/15b97b3e-cd63-4370-9fbd-bab1305a9eb1 (accessed on 13 December 2020).
  19. Eva, H.; Lambin, E.F. Burnt area mapping in Central Africa using ATSR data. Int. J. Remote Sens. 1998, 19, 3473–3497. [Google Scholar] [CrossRef]
  20. Mather, P.M.; Koch, M. Computer Processing of Remotely-Sensed Images: An Introduction; John Wiley and Sons: Chichester, UK, 2011. [Google Scholar]
  21. Shang, X.; Chisholm, L.A. Classification of Australian native forest species using hyperspectral remote sensing and machine-learning classification algorithms. IEEE J. Sel. Top. Appl. Earth Obs. Remote Sens. 2014, 7, 2481–2489. [Google Scholar] [CrossRef]
  22. Breiman, L. Random Forests—Random Features; Vol. Technical Report 567; Statistics Department, University of California: Berkeley, CA, USA, 1999; Available online: https://www.stat.berkeley.edu/~breiman/random-forests.pdf (accessed on 13 October 2020).
  23. Tennessee Department of Agriculture. Southern Pine Beetle Cost Share for Landowners. 2021. Available online: https://www.tn.gov/agriculture/forests/landowners/financial/southern-pine-beetle-cost-share-for-landowners.html (accessed on 12 February 2021).
  24. Potapov, P.; Hansen, M.; Stehman, S.V.; Pittman, K.; Turubanova, S. Gross forest cover loss in temperate forests: Biome-wide monitoring results using MODIS and Landsat data. J. Appl. Remote Sens. 2009, 3, 033569. [Google Scholar] [CrossRef]
  25. Kim, D.; Sexton, J.O.; Noojipady, P.; Huang, C.; Anand, A.; Channan, S.; Feng, M.; Townshend, J.R. Global, Landsat-based forest-cover change from 1990 to 2000. Remote Sens. Environ. 2014, 155, 178–193. [Google Scholar] [CrossRef] [Green Version]
  26. Montserud, R.A.; Leamans, R. Comparing global vegetation maps with kappa statistics. Ecol. Model. 1992, 62, 275–293. [Google Scholar] [CrossRef]
Figure 1. Study area consisting of 19 counties in Tennessee, USA.
Forests 12 00499 g001
Figure 2. A graphical display of the methodological approach.
Forests 12 00499 g002
Figure 3. Classified southern yellow pines in February 2016.
Forests 12 00499 g003
Figure 4. Classified southern yellow pines in November 1999.
Forests 12 00499 g004
Figure 5. Classified southern yellow pines in December 1988.
Forests 12 00499 g005
Figure 6. December 1988 Normalized Difference Vegetation Index (NDVI) of southern yellow pines.
Forests 12 00499 g006
Figure 7. November 1999 NDVI of southern yellow pines.
Forests 12 00499 g007
Figure 8. February 2016 NDVI of southern yellow pines.
Forests 12 00499 g008
Figure 9. Mean NDVI ± standard deviation (SD) of southern yellow pines (loblolly, Virginia and shortleaf pines) for December 1988, November 1999 and February 2016. Error bars represent SD of the mean.
Forests 12 00499 g009
Table 1. Area covered by southern yellow pines in December 1988, November 1999 and February 2016.
Dec. 1988 (Hectares)%CoverNov. 1999 (Hectares)%CoverFeb. 2016 (Hectares)%Cover%Change Dec. 1988 and Nov. 1999%Change Dec. 1988 and Feb. 2016%Change Nov. 1999 and Feb. 2016
Loblolly110,2293744,7492139,50721−59−64−12
Virginia83,5782824,9321239422−70−95−84
Shortleaf104,11635146,19267145,5227740400
Table 2. Error matrix table for southern yellow pines’ classification of February 2016.
ClassesLoblollyShortleafVirginiaTotal
Reference
Loblolly163120
Shortleaf615122
Virginia501520
Total27181762
User accuracy (%)Producer accuracy (%)Overall accuracy (%)Kappa
Loblolly8059
Shortleaf6883
Virginia7588
Overall and kappa 740.6
Publisher’s Note: MDPI stays neutral with regard to jurisdictional claims in published maps and institutional affiliations.

