Article

Soundscape Perceptions and Preferences for Different Groups of Users in Urban Recreational Forest Parks

1
College of Landscape Architecture and Arts, Northwest A&F University, Xianyang 712100, China
2
Department of Urban and Rural Development, Swedish University of Agricultural Sciences, P.O. Box 7012, SE-75007 Uppsala, Sweden
*
Author to whom correspondence should be addressed.
These two authors contribute equally to this work.
Forests 2021, 12(4), 468; https://doi.org/10.3390/f12040468
Submission received: 12 March 2021 / Revised: 5 April 2021 / Accepted: 9 April 2021 / Published: 12 April 2021
(This article belongs to the Special Issue Urban and Urbanizing Forest Management)

Abstract

:
Although the soundscape in cities is receiving increased attention in urban planning, there is still a lack of knowledge of how personal factors influence the perception of and preference for soundscapes. Most present studies are linked to one or a few specific soundscapes and do not have a holistic approach exploring the pros and cons of all soundscapes in a place. This study surveyed individuals to assess how soundscape perceptions and preferences may differ among various attendees of typical urban forest recreational parks in Xi’an, China, using an on-site questionnaire. The respondents (N = 2034) revealed that rare natural sounds were perceived more positively than the dominating artificial sounds. Five main dimensions of social, demographic, and behavioral attributes were found to be linked to the soundscape perceptions and preferences: (1) familiarity of the park and attendees’ age made people more tolerant towards sounds that others find annoying; (2) higher education and higher socio-economic status showed lower tolerance towards sounds; (3) having companions and specific types of recreational use increased the frequent perception of artificial sounds; (4) females generally showed higher sensitivity and lower tolerance than males towards several sounds; and (5) the longer attendees remained in the park, the more positive the overall soundscape preference was. The results indicate that numerous sounds are affecting people’s overall experience in the parks. These findings could help decision-makers and urban forest recreational park designers to formulate relevant strategies for park design that are in tune with varying public needs and expectations towards soundscape. The implementation of human-oriented soundscape design can therefore enhance people’s well-being.

1. Introduction

Urban recreational forest parks, ensuring people’s relaxation and recreation, are important urban public spaces that provide environmental and social benefits [1,2,3] and improve people’s health [4]. At present, many countries have actively developed a variety of programs for sustainable urban planning concerning urban recreational forest parks; however, the conventional approaches in park design and management processes are mostly based on landscape visual characteristics, whereas the aural (sound) aspect is often neglected [5,6]. Yet the soundscape (acoustic environment as perceived or experienced and/or understood by a person or people, in context; International Organization for Standardization, 2014) is highly linked to people’s health. Noise pollution has been identified as one of the most significant factors of environmental stressors [7]. The dominant focus has been on mechanical ways of reducing negative sound in cities by lowering noise and specific decibel levels [8,9].
However, recent studies revealed that the perception of soundscapes is not specifically linked to levels of decibels but to the type of soundscape and people’s personal preferences and sensitivity, as well as demography linked to soundscape [10,11,12,13,14,15,16]. For example, natural sounds such as birds, water, and rustling leaves have been highlighted as positive sounds [17,18], while road traffic has been proved to be perceived as negative [19,20,21]. However, there is an intricate interplay between positive natural sounds and noise in soundscape perceptions and preferences; for example, people can perceive a noisy environment more positively if a bird’s song is added, which would thereby mask the noise [11]. Additionally, there is interdependence between sound and visual stimuli. For example, Viollon et al. (2002) found that the more urban a visual setting is, the more negative sounds will be perceived. This finding did, however, depend on the type of sound heard, as well [22]. Thus, the quality and type of sound is—according to Liu and Kang (2015), Liu et al. (2014; 2013), Nilsson and Berglund (2006), and Zhang and Kang (2007)—a critical factor in creating sustainable urban recreational forest parks [15,23,24,25,26]. Furthermore, the impacts of demographic factors and behavioral aspects on outdoor soundscape perception have been increasingly discussed [21,27,28]. Age and gender have shown to affect perception of soundscape [12,29,30,31,32,33,34,35], as well as cultural backgrounds, which affect perceptions and assessments of environments [36,37,38].
Specifically, previous studies mainly focused on residential areas, commercial pedestrian streets, waiting halls in railway stations, and urban forests, and the effects of several personal factors (gender, age, education, occupation, social status, income, local resident status, visit frequency, length of stay, grouping, purpose of visiting, duration of stay, etc.) were separately examined on noise annoyance, subjective loudness, acoustic comfort, sound preference, or other soundscape experiences [15,18,21,28,35,39,40,41,42]. As for the urban recreational forest park, it is still unclear whether there is a need to evaluate the effects of personal factors on soundscape perception, and which personal attributes should be included in the soundscape perception research. Different studies choose not to consider or only consider the influence of a few personal factors on the perception results [43,44,45,46]. In addition, in the research focused on exploring the impact of personal attributes on the perception of soundscape in urban parks, the results of influences of certain factors are not consistent. Some studies found that social demographic information was not a significant factor in the preference of overall soundscape in urban recreational forest parks whatsoever [15,21], while others showed significant influences [18,47]. One possible reason for these inconsistent results could be the vague definitions of specific soundscapes in combination with correlations to people’s demographics in the statistical analyses [18,21,28,39]. Moreover, most conducted research aims to clarify the existence of significant factors per se, while fewer aim to explore any further mechanisms of how different people perceive the soundscapes in urban recreational forest parks. Therefore, opinions of individuals towards soundscape under these influencing factors could be the core element of meeting public demands with the actual design of urban recreational forest parks [14,19,48,49,50]. In other words, the influence of various social, demographical, and behavioral factors in combination with comprehensive soundscape perception parameters in urban recreational forest parks should be examined.
The aim of this study is mainly divided into two parts: the first part explores the current status of soundscape perceptions and preferences in urban recreational forest parks, and then identifies soundscape characteristics (existing positive and negative sounds) of urban recreational forest parks; the second part explores the influence of dominant personal (social, demographic, and behavioral) attributes on the perception of and preference for the soundscape, and then identifies differences in the perception of and preference for the soundscape among different groups of Chinese park users. In this research, we focus on if the individual soundscapes are perceived to be common or not, their perceived loudness, if the sound source can be visually detected and if the respondents have a positive or negative perception (all based on people’s subjective experiences and similar definitions used in other studies [16,18,20,21,28,33,35,42,51,52,53,54]). The specific questions of this study are:
  • What kind of soundscape features do urban recreational forest parks have?
  • What are the dominant personal factors influencing soundscape perceptions and preferences?
  • What are different users’ soundscape perceptions and preferences in urban recreational forest parks?

2. Materials and Methods
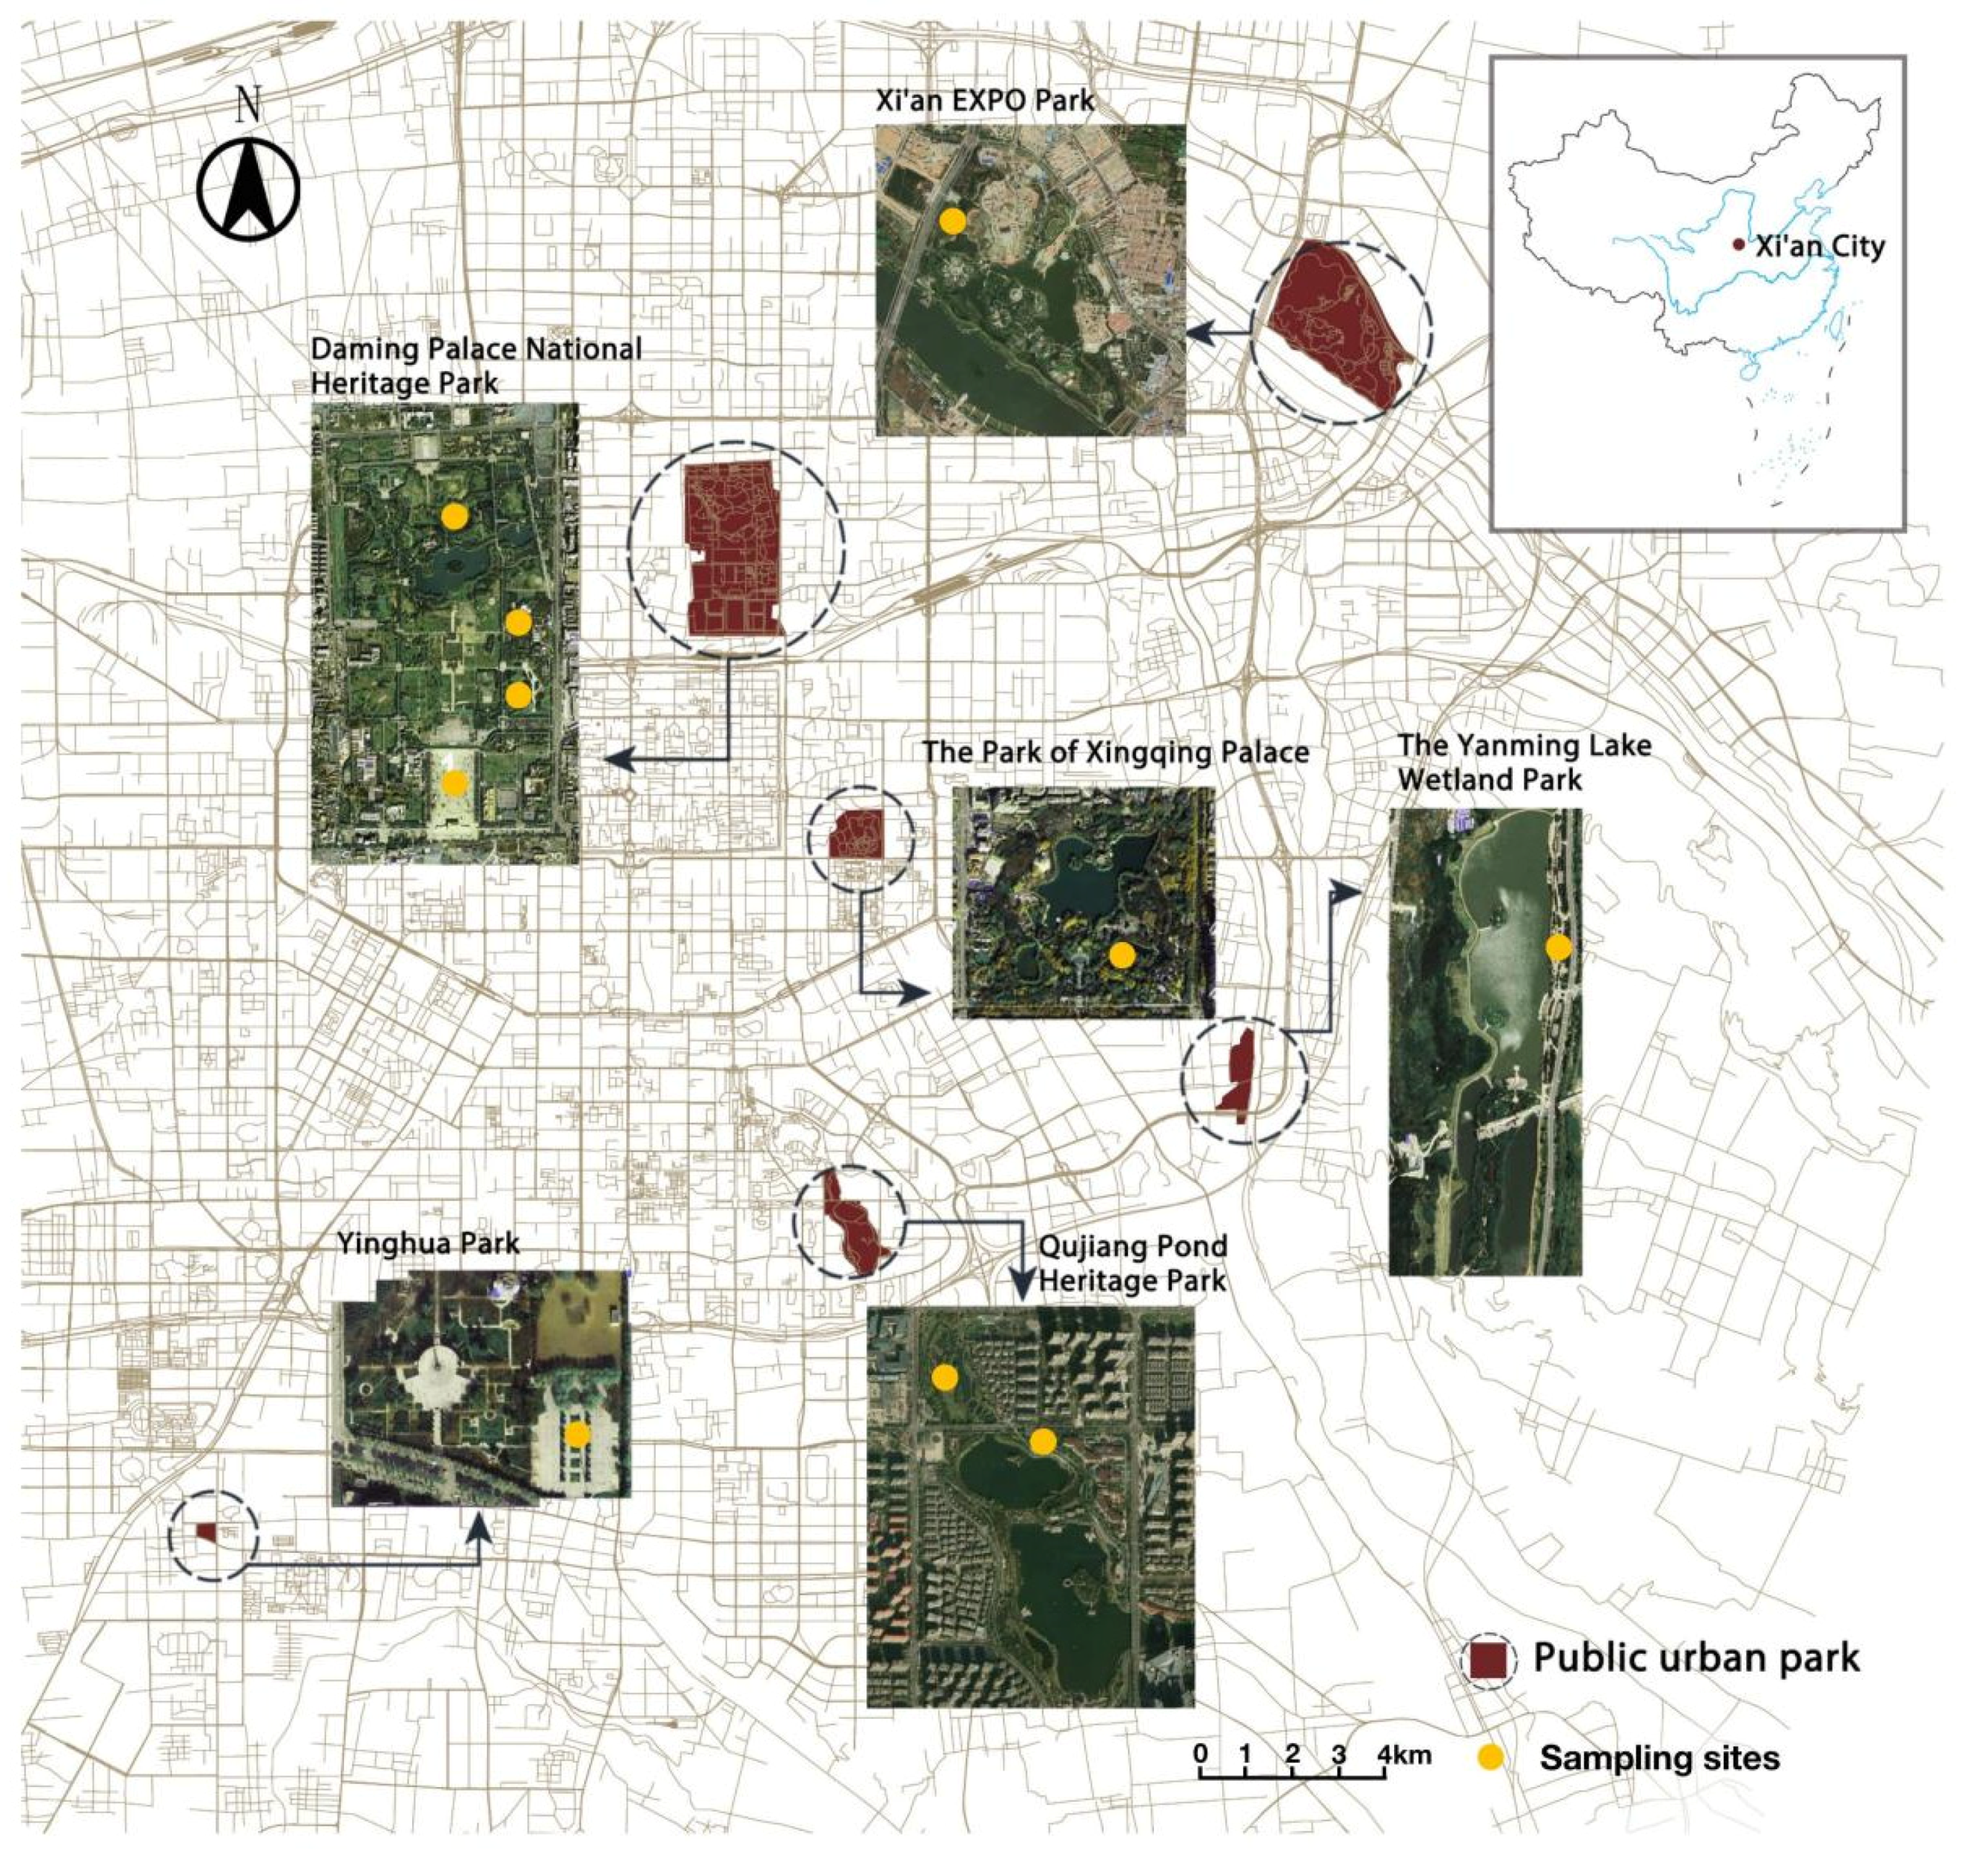
2.1. Study Area

Similar to other Chinese cities, Xi’an, which has more than 10 million urban inhabitants, has been going through a drastic urban expansion. This change could have a significant impact on the experience in urban recreational forest parks for the local people. Based on the electronic map of Xi’an in 2019, there are 16 existing urban recreational forest parks in Xi’an city. The six urban recreational forests parks distributed throughout Xi’an were finally selected according to location, freedom of access, landscape characteristics, number of visitors, and the shape of the site (Table 1 and Figure 1). Each of these parks is popular and freely accessible, having many visitors, and thus provides a vast heterogeneity of sounds. All parks are rather new, and all but one were built within the last 12 years. As each park is of different size, the different number of sampling sites in each park was selected for the investigation according to the size and the characteristics of landscape, and all the sampling sites have similar size within 2 hectares (Figure 1).
Through pilot investigations prior to the completion of the main survey, 22 different sounds were found to be regularly heard in all of the parks. These were natural sounds (birds, insects, dogs, ducks, leaves rustling, wind, and water), artificial sounds (lawn mowing, construction sounds, engine sounds, bicycle riding, surrounding speech, playing children, footsteps, diabolo, trains, automobiles, and motorbikes) and musical sounds (square dancing, broadcast music, singing, and instruments). It is worth mentioning that diablo is a game in which an hourglass-shaped top is balanced and spun on a string stretched between the tips of two sticks, and square dancing is a popular music-related group physical exercise for health benefits in China, generally held at the urban parks. All respondents were asked to provide their perceptions of these sounds in the digital app questionnaire.

2.2. Questionnaire Structure

The questionnaire survey was conducted on site, as participants were asked to use a tablet provided to them to fill the online questionnaire generated in advance through the “Wen Juan Xing” application—a professional online questionnaire survey platform. The questionnaire consisted of three sections (Supplementary Materials, Figure S1). The first section of the questionnaire was designed to collect the respondents’ demography such as age, gender, companion, educational background, occupation, monthly income, dwelling place, residential status, distance to the park, visit frequency, length of stay, and potential recreational activities.
The second section focused on individual soundscape perception, and included the rating of 22 individual sounds on a five-point scale, linking them to perceived occurrences (PO) of each sound (from never heard (1) to heard all the time (5)), the perceived loudness (PL; from very quiet (1) to very loud (5)), and the preference (PR) for each sound (from very negative (1) to very positive (5)). In addition, the respondents were asked to evaluate if they could visually perceive the source (VS) of each individual sound (except wind) (from see (1) to not see it (2)). It is worth noting that if the occurrence (PO) of an individual sound cannot be perceived, its PL, PR, and VS will no longer be assessed.
In the third section, respondents were asked to indicate their overall preference (OPR) for the soundscape using a five-point rating scale (from very unsatisfied (1) to very satisfied (5)), perceived loudness (OPL; from very low (1) to very loud (5)), and annoyance (OPA; from not annoyed at all (1) to extremely annoyed (5)).

2.3. Field Survey

The field survey was conducted from September to October in 2019. All respondents were randomly selected among visitors in each sampling site of the park. The approached park visitors were first informed about the survey’s objectives and answering procedures without any mention of positive or negative sounds, noise pollution, etc. They then were informed that their answers would be anonymous. Those willing to participate were given a tablet containing the questionnaire and invited to fill it in individually in order to avoid interference from other participants during their stay in the site. In order to reduce any deviation caused by the selection of respondents within a particular time, each sampling site was surveyed twice over different days, all with sunny and windless weather. Each survey lasted eight hours (approximately from 9:00 a.m. to 5:00 p.m.). Since the duration of the questionnaire survey was short and only limited sounds might have appeared during a particular period, the participants were asked to respond based on their long-term experiences in the parks within the length of time selected in the questionnaire.
Prior to conducting the survey, the average sound level of each sampling site was sampled for 15 min using a class 1 sound level meter (Bruel and Kjaer 2250, Skodsborgvej, Nærum, Denmark, 1-s logging period). At the same time, the temperature, relative humidity, and wind speed of the parks were measured using weather stations (Kestrel 5500, Boothwyn, PA, USA). The measurements were carried out at the approximate center of each sampling site in order to avoid frequent visits by pedestrian. Taken together, these measurements revealed a similar average sound level (59 dBA), temperature (19 °C), humidity (60%), and wind speed (0.62 m/s) in all parks. Thus, given the similar acoustical and ecological environmental prerequisites, the six selected parks (10 sampling sites in total) were therefore considered as a comprehensive and single study area for soundscape perception studies.

2.4. Statistical Analysis

The normal distributions of all dependent variables in this study were examined by the one-sample Kolmogorov–Smirnov test. The generalized models (GLMs) were then conducted to analyze the differences in perception of and preference for individual sounds in the total of the selected urban recreational forest parks due to non-normal distributions of the dependent variables, in which all the personal social, demographic and behavioral variables were considered as co-variables. Frequency analyses on the ratings of OPR, OPL, and OPA were conducted in terms of overall soundscape perception.
Spearman’s rho correlation analysis and collinearity diagnostics were performed to identify the relationships between respondents’ social, demographic, and behavioral variables. Then, factor analysis was used to extract prominent factors for those respondents’ variables [55,56].
GLMs were also applied for individual sound perception and overall soundscape perception to examine the impact of integrated social, demographic, and behavioral factors of the respondents on soundscape perception.
The goodness-of-fit of all GLMs was assessed by the Deviance test and Akaike’s information criterion (AIC) to examine whether the models explain the data adequately. As for goodness of fit, a (1/df) deviance greater than 0.05 indicates the model fits well, and the smaller the value of AIC is, the more accurate and concise the model. All statistical analyses were carried out using IBM SPSS Statistics 25.0 and STATA 14.0 software.

3. Results

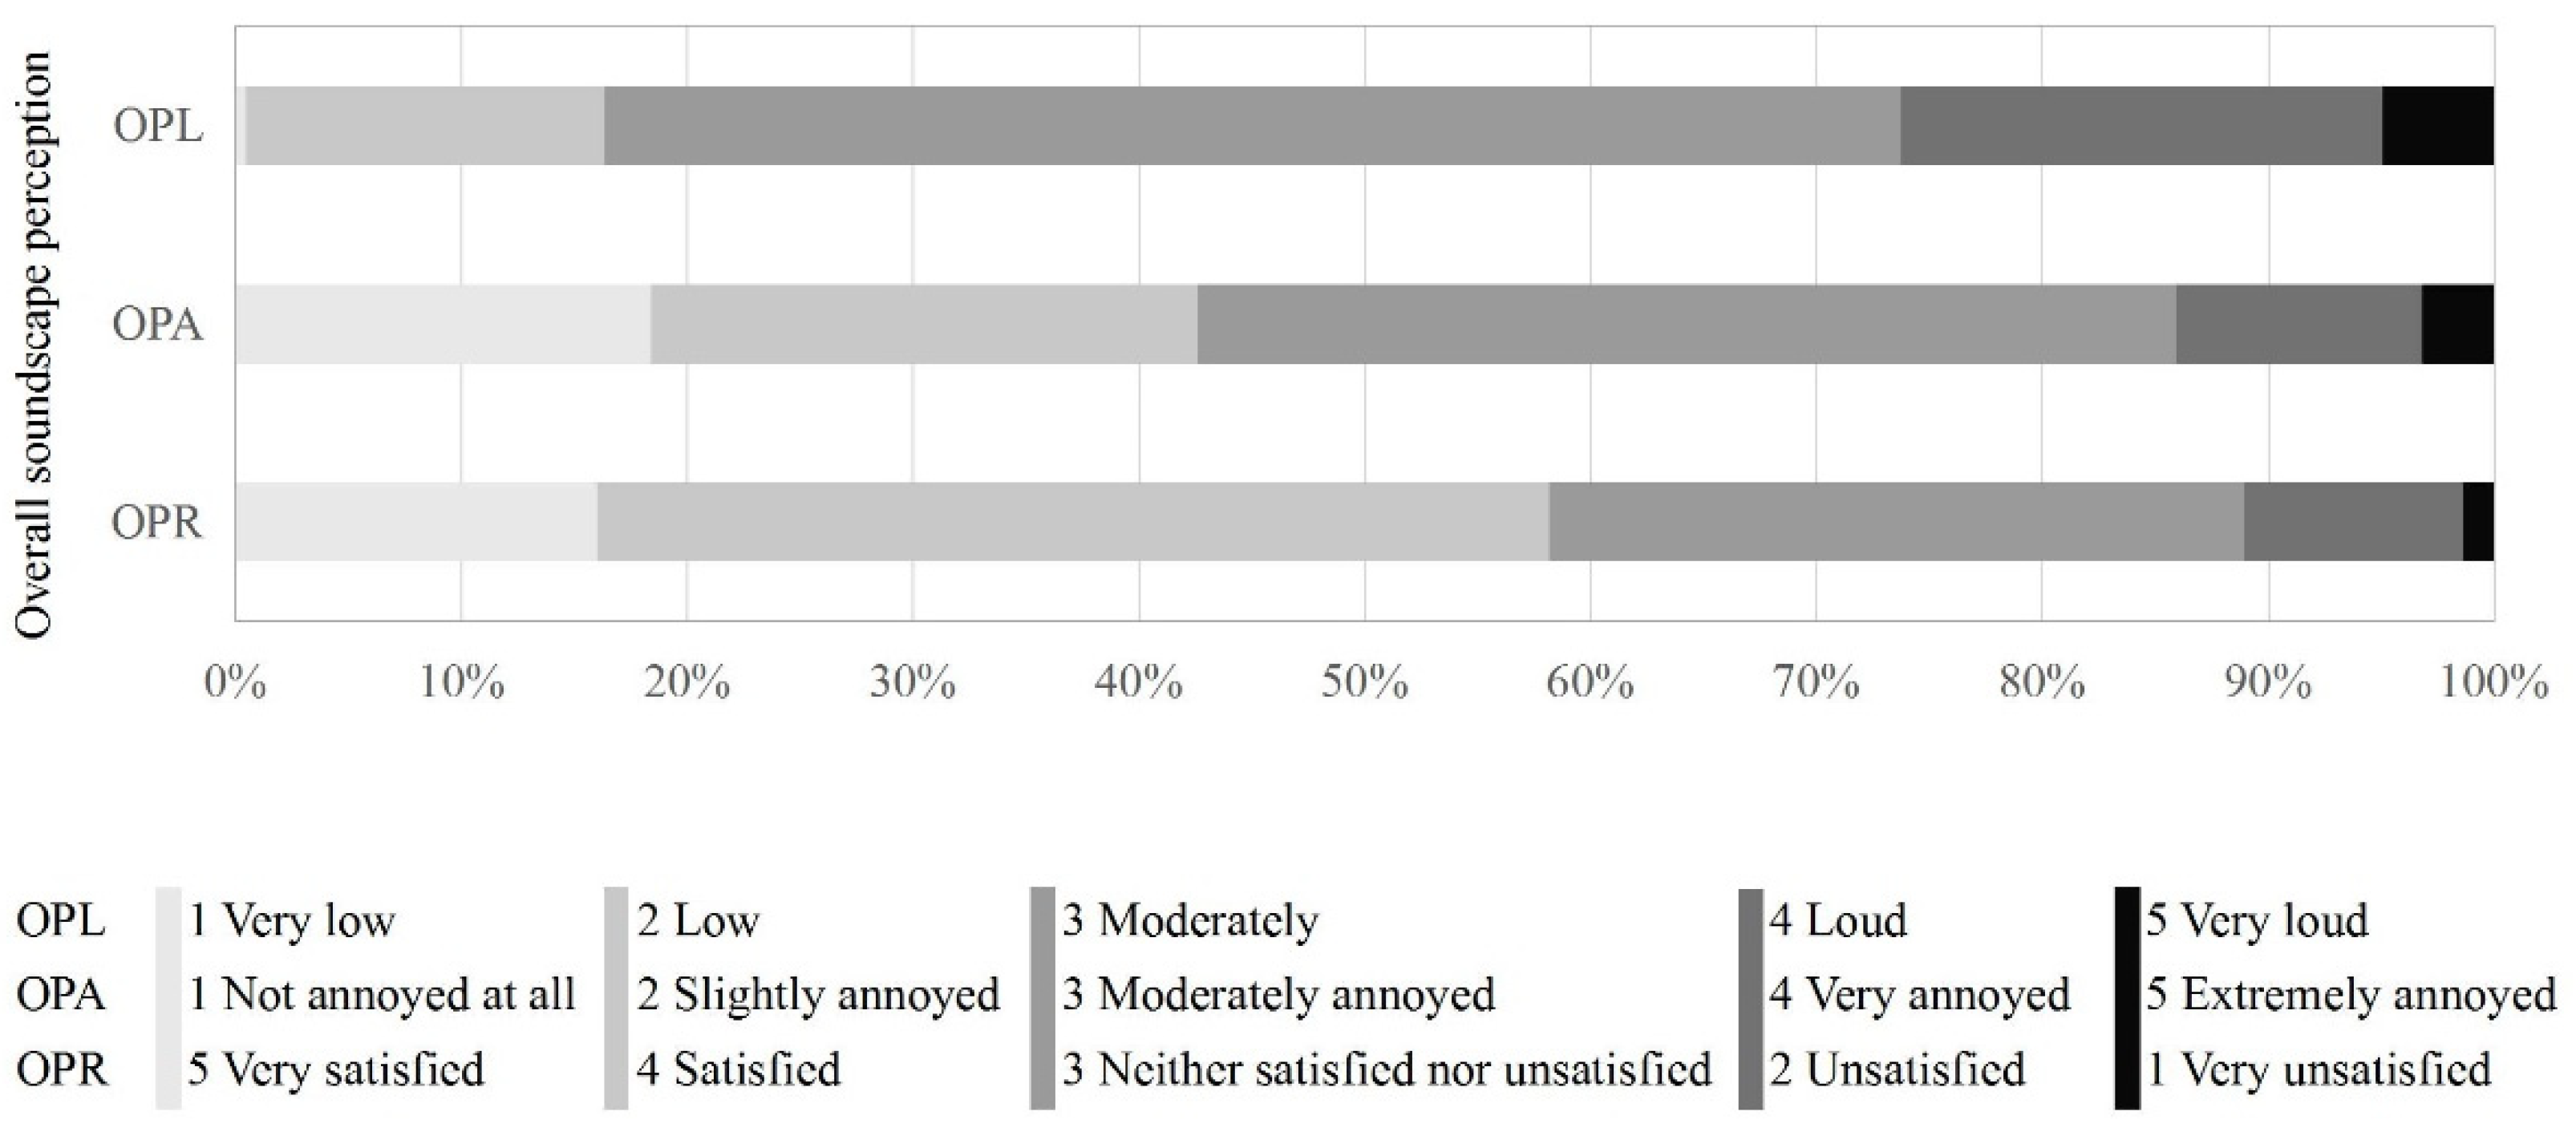
3.1. Soundscape Features of the Urban Recreational Forest Parks

In total, N = 2068 respondents answered the survey and N = 2034 (around 200 in each sampling site) were finally included in the study (Table 2). Significant differences were found for the perceptions of different sounds in terms of PO, PL, PR, and VS (p = 0.000, respectively) based on each average valuation from the GLMs, and all personal factors were controlled in models (Figure 2). Commonly occurring sounds with a high degree of loudness were musical sounds (broadcast music, square dancing, singing) and artificial sounds (surrounding speech, playing children, automobiles; Figure 2a,b). Perceived lower levels of commonly occurring sounds were natural sounds (birds, wind, leaves rustling, insects) and the sound of footsteps. Sounds that rarely occurred but had a high degree of loudness were instruments, ducks, lawn mowing, engines, diabolo, and motorbikes. There was a significantly higher positive PR for natural sounds (except dogs) than for artificial sounds. However, to visually detect the sound source (VS), there was no difference found between natural and artificial sounds (Figure 2c,d). Birds (PR = 4.08 ± 0.02) and broadcasted music (PR = 3.78 ± 0.02) received the highest positive ratings but were difficult to recognize visually (VS) by respondents. Preferred sounds that were easy to visually detect (VS) were sounds of ducks (PR = 3.47 ± 0.06), instruments (PR = 3.70 ± 0.12), leaves rustling (PR = 3.76 ± 0.02), and water (PR = 3.87 ± 0.05), while automobiles (PR = 2.20 ± 0.03), square dancing (PR = 2.55 ± 0.03), bicycle riding (PR = 2.70 ± 0.04), surrounding speech (PR = 2.81 ± 0.02), and footsteps (PR = 2.88 ± 0.02) were also easily visually detected but not preferred. Unpopular sounds included construction sounds (PR = 1.65 ± 0.04), engines (PR = 1.93 ± 0.06), motorbikes (PR = 2.00 ± 0.03), lawn mowing (PR = 2.17 ± 0.08), and dogs (PR = 2.62 ± 0.04) whose VS were difficult to detect.
Over half of the respondents (57.4%) rated OPL as “moderate loudness” 43.3% of participants chose OPA as “moderate annoyance”, and 18.3% and 24.1% selected “not annoyed at all” and “slightly annoyed”, respectively. Nearly 60% of the respondents rated their OPR as “satisfied” (42.1%) and “very satisfied” (15.9%) (Figure 3).

3.2. Factor Analysis of Social, Demographic and Behavioral Attributes

There were strong correlations (Spearman’s rho) between different social, demographic, and behavioral attributes (Table 3). The collinearity diagnostics also showed that multiple dimensions’ eigenvalue was around zero and the condition index was above ten. This indicated that multicollinearity existed in the respondents’ attributes. In order to eliminate variable collinearity and uncover any latent variables, all of the respondents’ attributes were subjected to factor analysis (Table 4).
The Kaiser-Meyer-Olkin (KMO) measure of sampling adequacy was 0.664, and Bartlett’s test of sphericity produced a clear result (p < 0.01), indicating that the data were suitable for factor analysis. After conducting the Varimax rotation with Kaiser normalized loadings, the personal attributes were classified into five components. Component 1 exhibited 20.80% explanatory power and high loading, with negative “visit frequency” and “age” and positive “distance to the park” and “residential status”, and was therefore labeled C1 (Age and Familiarity of site). It was found that groups with lower C1 scores represented the elderly who were generally familiar with the venue. Component 2 exhibited 15.90% explanatory power and contained positive “monthly income”, negative “occupation”, and positive “educational background”, and was therefore labeled C2 (Educational and Economic condition). It indicated that people with high C2 had a higher level of income and employment and an educational background. Component 3 explained 9.45% of variances, which included positive “potential recreational activities” and negative “companion”, and was labeled C3 (Companion and Type of recreational use). It indicated that participants who scored a high value of C3 were those who had fewer companions and participated in certain activities, such as specialized activities and quiet activities. Component 4 (8.98%) and Component 5 (8.82%) were principally related to C4 (Gender) and C5 (Length of stay), respectively. It indicated that females had a high value of C4, and people who experienced the soundscape for a long time had a high value of C5.
As a result, standardized subjective evaluation data were obtained for five dimensions of the personal attributes, indicating that individual fixed effects have been controlled for further analyses.

3.3. Different Soundscape Perceptions and Preferences among Different Park Users

The result of the goodness of fit showed that all (1/df) deviances were greater than 0.05, and relatively smaller values of AIC in each model were obtained, indicating that the models fit the data adequately (Supplementary Materials—Table S1 and Table 5).
The results showed that each of the five dimensions of factors influenced the perception of and preference for individual sounds significantly, and almost every sound (except for that of an instrument) in the urban recreational forest parks was affected (Supplementary Materials—Table S1). Specifically, 21 (out of 22) types of sounds in terms of the PO and 17 (out of 22) types of sounds in terms of the PR were significantly influenced by the five dimensions of factors. The PL changed remarkably within 13 (out of 22) types of sounds. As for the VS, 11 (out of 21) types of sounds showed significant differences in the five dimensions of factors.
The most significant perceptions and preferences (p < 0.001) are highlighted in Table 4 to explore the influence by the five dimensions of factors (Table 6).
The results showed that Age and Familiarity of site significantly affected soundscape perception parameters of individual sound (Table 6). Specifically, this dimension positively influenced the PO of natural sounds (insects, leaves rustling, wind, and water) as well as artificial sounds (surrounding speech, playing children, footsteps, bicycle riding, construction sounds, and trains), the PL of artificial sounds (surrounding speech and playing children), and the VS of natural sounds (birds, leaves rustling) as well as musical sounds (square dancing, singing, and broadcast music). However, the dimension negatively influenced the PR of natural sounds (birds, insects), artificial sounds (surrounding speech, playing children, footsteps, automobiles), and musical sounds (specifically square dancing), as well as the PO of musical sounds (square dancing and singing).
Educational and Economic condition significantly affected 8 types of sounds perception—musical sounds (2 out of 4), artificial sounds (5 out of 11), and natural sounds (1 out of 7)—a total of 10 perception parameters (Table 5). Specifically, participants with a greater income and higher education experienced the PL of motorbikes negatively and held lower PR for dogs, square dancing, and some artificial sounds (surrounding speech, footsteps, and automobiles). As for the PO, Educational and Economic condition had a negative influence on singing and motorbike sounds, whilst a positive influence was on train and automobile sounds. In contrast, the VS was not influenced by Educational and Economic condition at all.
Companion and Type of recreational use significantly affected 8 perception parameters only evidenced with artificial sounds (5 out of 11) (Table 6). Specifically, a negative influence can be seen on the PO of surrounding speech, playing children, trains, and automobile sounds (except diabolo), the PL of surrounding speech and playing children, as well as the PR of playing children. However, Companion and Type of recreational use seems to not have any considerable effect on the VS of sounds.
The impact of Gender was relatively small, with only 4 perception parameters significantly corresponding to three sounds (insects, playing children, engines) (Table 6). The PO of insects had a positive effect while the PR of children and engines were negative.
Length of stay was linked positively to the PO of birds and broadcast music while automobile and motorbike sounds had a negative influence (Table 6).
As for overall soundscape perception, all factors except Age and Familiarity of site significantly influenced perception parameters of the overall soundscape (Table 5). Specifically, Educational and Economic condition showed a negative impact on overall soundscape preferences (OPR) and a high annoyance effect (OPA). Companion and Type of recreational use had negative influences on loudness (OPL) and annoyance (OPA), respectively. In addition, the overall perception of loudness (OPL) was significantly different for Gender, with females showing more sensitivity than males. Length of stay positively influenced OPR significantly.

4. Discussion

4.1. Soundscape Features of the Urban Recreational Forest Parks

People’s perceptions of dominant sounds and non-dominant sounds in city parks were easily detected and showed a large uniformity among participants, confirming the study by Liu et al. (2018) [39]. Dominant sounds in city parks included music, surrounding speech, children playing, and cars. In contrast, submissive sounds included a train and dogs. Although some individual sounds such as instruments, lawn mowing, ducks, diabolo, engines, and motorbikes were not frequently perceived, they were perceived as loud sounds when they were detected. The most preferred sound was that of a bird’s song, but it did not belong to the group of dominant sounds. Instead, the dominating sounds of square dancing, surrounding speech, and automobiles in the city parks were easily detected and were perceived as being very annoying by the majority of the respondents. The finding that participants exhibited higher preferences for natural sounds and lesser preferences for artificial sounds is in line with previous research [17,18,46].
If the purpose is to increase the positive perception within parks for the majority of visitors, these findings should be taken into consideration. One suggested way to increase the positive experiences of park attendees is to increase the occurrence of bird songs either by adding a variety of habitats for birds or by adding artificial bird songs to the environment [10,46,57]. However, simply improving habitats or adding bird songs does not reduce other sounds negatively perceived as noise. Studies showed that masking noise by adding bird songs might improve the soundscape perception [11]. Still, however, the negatively perceived noise cannot be too loud if bird songs are to be masking it [58]. Furthermore, there is an interlinkage between vision and sound wherein a dissatisfaction of visual features such as cars affects soundscape perceptions negatively [22,43,59]. One potential advancement could be to improve visual features or build visual barriers towards these sounds.
Perceived loudness (OPL), annoyance (OPA), and preference for sound (OPR) were not perfectly matched with each other. Nearly 86% of respondents were not averse to the soundscape (from the point of overall soundscape annoyance). Yet, only 58% of them were satisfied with the soundscape (OPR). Thus, not being annoyed or averse to a soundscape does not equate to satisfaction. More attention should thus be paid to enhancing sounds that people prefer, while at the same time exploring different people’s specific preferences for the soundscape in urban recreational forest parks.

4.2. Soundscape Perceptions and Preferences among Different Social, Demographic and Behavioral Park Users

This study recognized that almost every sound, as well as the overall soundscape, were perceived differently in five different dimensions.
Age and Familiarity of site was the most influential dimension on perception of and preference for individual sounds (with 28 perception parameters of certain sounds). Elderly individuals who were familiar with the environment tended to perceive most natural, musical, and artificial sounds infrequently, while at the same time, more fully enjoyed these sounds when they were heard. This is consistent with the result that long-term experiences in particular locations could reduce the sensitivity of the acoustic environment [15]. As the elderly tend to visually perceive parks as a natural habitat and enjoy the parks more than the younger population [60,61], this finding could also be related to the notion that the elderly have stronger connections to the area, which is linked to the theory of place identity or place attachment, which are in turn linked to greenery [62]. For example, in the study conducted by Hedblom et al. (2017), older people reported having a stronger experience of the site related to the sounds of nature and felt calmer as a result of the sound of rustling trees and bird songs than middle-aged and younger people [63].
However, it is interesting to find that elderly individuals who were familiar with the environment tend to perceive musical sounds more frequently. It may be because square dancing and singing were the most dominant sounds, so the people who were familiar with the soundscape would tend to perceive them easily. Another reason might be the elderly who were familiar with the environment tend to be the ones participating in square dancing and singing. Notably, Age and Familiarity of site was the only dimension of the attributes that influenced the perceived visual sources (VS). Thus, the elderly who were familiar with the environment more easily discovered the visual sources of natural and musical sounds [64]. It is worth mentioning that although a variety of individual sound perceptions were affected by Age and Familiarity of site, overall soundscape perceptions were not influenced at all. We interpret these data as supportive of the idea that the Chinese elderly who were familiar with the environment had a high preference and low sensitivity towards individual sounds, while square dancing and singing were two special sounds which largely aroused their attention.
Respondents with a higher level of education and a greater level of income perceived the overall soundscape to be more annoying and showed less satisfaction than those who were less educated and had lower incomes. Specifically, they had lower preferences for people singing. This finding is consistent with previous studies that showed that the higher the social status is, the less tolerance there is for the soundscape [19]. Notably, age and familiarity affected preferences for natural sounds while education and economic status did not, except for low preferences for dogs. This is perhaps because individuals with higher education and higher income also had high expectations for natural sounds, while the sounds of dogs, to some extent, were out of their realm of expectation [48]. This might also be linked to the finding that they perceived a train and cars more frequently. Overall, we interpret these data as supportive of the notion that although people with a different Educational and Economic condition had varying opinions towards sound sensitivity, it is clear that people with a high Educational and Economic condition generally showed a lower tolerance for soundscape.
As for the Companion and Type of recreational use dimension, previous research showed that companions seldom influenced soundscape perceptions and preferences [47,54]. However, in this study, it was surprising to find that Companion and Type of recreational use had influences not only on the perceived occurrences (PO) but also the loudness (PL) of artificial sounds, particularly surrounding speech and playing children. Namely, the respondents with more companions also preferred certain activities (such as parent-child activities, fitness and health activities, sports and leisure activities, or social activities) and perceived sounds both loudly and frequently. One possible reason could be that sounds might originate from participants’ companions or their engagement in activities, making them easier to experience or recognize. In addition, respondents with more companions perceived the train and automobile sounds more frequently. This may be because these sounds would interrupt their conversations or any interactions with other people [19]. Perhaps it is also why these participants also perceived overall soundscapes to be much more annoying and louder. Interestingly, the perceived occurrences (PO) of diabolo showed an adverse trend compared to other artificial sounds. Perhaps this is because diabolo, as a specialized activity, was usually played by no more than two people (regarded as fewer companions), and people who participated in this activity could detect the sounds of diabolo more easily than others. Overall, we interpret these data as supportive of the idea that the Companion and Type of recreational use factor is highly correlated with the perception of artificial sounds, while its influence was rarely reflected on sound preference.
As for the Gender dimension, this study found that the perceived loudness of overall soundscape (OPL), perceived occurrences (PO), and preference (PR) of several sounds can be influenced by the Gender factor. This finding is in line with Hedblom et al. (2017), whose study found differences between gender wherein sounds of nature were linked to bird species experiences [63], but not in line with previous studies which argue that Gender had no influence on soundscape perception [15]. Furthermore, in this study, females tended to perceive the overall soundscape as being louder, while at the same time, were more sensitive to the sounds of insects and showed less tolerance of the sounds of playing children and that of engines. It is perhaps because females are more sensitive to sound than males [65], and easily recognized certain sounds that men did not discern. Another reason is that women, who usually take children to urban recreational forest parks, were closer to this sound source, causing them to experience a greater degree of annoyance [19]. Overall, we interpret these data as supportive of the idea that females tend to show high sensitivity and low tolerance towards certain sounds.
Finally, this study showed that Length of stay was more correlated with the overall soundscape preference (OPR) and the perceived occurrences (PO) of individual sounds, which is consistent with previous studies [15,18]. The longer the respondents spent in the parks, the more satisfaction they had about the overall soundscape [66]. Alternatively, it can also be considered as the better the soundscape is, the more (time) respondents wish to stay in the park. The results indicate that longer stays correlate with greater sensitivity towards birds and broadcast music and less sensitivity towards cars and motorbikes. Overall, we interpret these data as supportive of the idea that Length of stay is a special attribute, which not only positively contributed to overall soundscape preference but also had an adverse impact on perceptions between the favored sounds and disliked sounds.
Above all, the five dimensions of factors showed different degrees of importance on various perspectives indicating the importance of the impact of personal attributes on soundscape perception in urban recreational forest parks. Designing a satisfying soundscape thus needs to meet various expectations of people in the five dimensions.
The urbanization is continuously rapid in China and to highlight some findings might increase the overall well-being for urban citizens with different backgrounds. In terms of individual sound perceptions and preferences, this study found that Age and Familiarity of site showed the greatest influence compared to other dimensions. We have not measured the frequency of different age groups in the park, but nevertheless, urban forest recreational parks in China are important for the elderly population. Due to rapid urban development, many forest parks are rather new in China, and so are those that this study surveyed in Xi’an (all except for one were less than 12 years of age). Thus, as people are becoming more settled and become more familiar with these parks, one could suppose that familiarity, such as sense of place and place attachment, will increase in the future, further showcasing the importance of highlighting the findings in this study. It is also worth noting is that older forest parks in China traditionally have walls around them, reducing the noise from nearby car traffic, while newer parks, in general, do not. Thus, the newly established parks do not have walls. Perhaps there will be a need to return to the older, traditional ways of building parks with walls due to the need for artificial noise barriers, which could be designed to be green walls [67]. Furthermore, Age and Familiarity of site was the only dimension highlighting a positive preference for bird and insect soundscape. One advancement would be to provide more space and habitats to allow for a greater number of bird and insect species. Increasing positive natural sounds might not only increase positive sound perceptions but could also be linked to increased health or stress reduction [58].
With a rapidly increasing middle class in China and increasing levels of higher education [68], future demands for parks might change. Our findings showed that people with higher education levels and greater income had a lower tolerance towards traffic noise and songs. Thus, to satisfy a growing urban middle class in need of restoration who are to a higher degree more annoyed with certain sounds than other demographics, there is a need for a new take in responsive and thoughtful park planning of soundscape.
The results further showed gender differences. It is a relatively new field of knowledge of how different sexes use and perceive urban forest parks [29]. It might be due to men and women using different parts of the forest parks, and thus they are exposed to different sound sources [69]. This might be taken into consideration when planning for soundscapes.
Although all respondents had high tolerances towards sounds, most were not satisfied with what they heard. The results indicated that depending on age, familiarity, gender, and other factors, people had different expectations and preferences for sound. One possible solution could be to dedicate specific areas for relative activities for certain user groups to attenuate aural dissatisfaction in highly visited Chinese forest parks.

5. Limitations and Future Work

This study explored the impacts of social, demographical, and behavioral attributes on soundscape perceptions and preferences in urban recreational forest parks. The overall sound level and environmental conditions in each park were generally similar; however, the specific acoustical features such as characteristics of sound and exact time of duration were not fully controlled in this study, although the main study question related to perceived sound rather than existing sound. In addition, the certain sounds appearing in a special way might impact people’s immediate perceptions, and therefore the visiting time and distance to the sound source should be taken into account in soundscape study in future. Moreover, here we focused on soundscape and to some extent the linkages to visual features, yet new studies found that smell might the biggest stress reducer and worthwhile to combine in future surveys [58].

6. Conclusions

This study focused on different soundscape perceptions among users in urban recreational forest parks, based on field surveys conducted in six different urban forest parks in Xi’an, China. In this study, the dominating sounds of square dancing, surrounding speech, and automobiles were most not preferred, while some of the least dominating sounds of birds and insects were the most preferred. Five dimensions of factors linked to social factors, demography, and behavior of park users were identified. These included Age and Familiarity of site, Educational and Economic condition, Companion and Type of recreational use, Gender, and Length of stay. The results revealed that personal differences within those five dimensions significantly influenced soundscape perceptions and preferences and specifically influenced the perspective of individual sounds or the overall soundscape perspective. Generally, (1) Age and Familiarity of site influenced the perception of and preference for individual sounds the most—the Chinese elderly who were familiar with the environment had a high preference and low sensitivity towards most individual sounds, whilst the sounds of square dancing and singing were exceptions, as these two sounds can greatly draw their attention; (2) visitors with higher levels of education and greater income had lower tolerances for many soundscapes; (3) Companion and Type of recreational use could largely show a significant influence on the perception of artificial sounds, whilst preference for soundscape hardly changed under its influence; (4) compared to males, females were more sensitive to and less tolerant of insects, playing children, and engines; and (5) increased Length of stay was positively correlated with overall soundscape preference. Furthermore, perceptions of birds and broadcast music versus automobile and motorbike sounds showed completely opposite trends the longer the stay. Overall, this research demonstrated the importance of personal differences and their effects on soundscape perception and explored a general mechanism of how different people perceived the soundscapes in urban recreational forest parks. These results could be applied in forest park planning and management to help decision-makers and designers formulate relevant strategies in tune with different public needs and expectations towards soundscape. At the same time, people’s well-being can be enhanced through the implementation of human-oriented soundscape design.

Supplementary Materials

The following are available online at https://www.mdpi.com/article/10.3390/f12040468/s1, Figure S1: The questionnaire and each questions’ scale, Table S1: Generalized linear model between each of the perception parameters of individual sounds and five dimensions of factors.

Author Contributions

Conceptualization, T.G. and L.Q.; methodology, X.F., M.H. (Marcus Hedblom), T.G., and L.Q.; validation, X.F., M.H. (Marcus Hedblom), T.G., and L.Q.; formal analysis, X.F., L.Q., N.X., Y.X., M.H. (Mengyao Hu) and Y.C.; investigation, X.F., N.X., Y.X., M.H. (Mengyao Hu), and Y.C.; resources, T.G. and L.Q.; writing—original draft preparation, X.F.; writing—review and editing, T.G., M.H. (Marcus Hedblom), and L.Q.; visualization, X.F.; supervision, T.G. and L.Q.; project administration, T.G. and L.Q.; funding acquisition, T.G. and L.Q. All authors have read and agreed to the published version of the manuscript.

Funding

This research was funded by the National Natural Science Foundation of China [grant numbers: 31971720], the Research Fund for Advanced Talents of Northwest A&F University [grant numbers: Z111021501], and Talent Support of Shaanxi Province [grant numbers: A279021715 and A279021830].

Institutional Review Board Statement

The study was conducted according to the guidelines of the Declaration of Helsinki, and approved by the Institutional Review Board of College of Landscape Architecture and Arts, Northwest A&F University.

Informed Consent Statement

Informed consent was obtained from all subjects involved in the study.

Data Availability Statement

The data presented in this study are available on request from the corresponding author. The data are not publicly available due to policy of the institute.

Acknowledgments

We would especially like to thank Katie Oswalt for assisting with language editing and the 2034 park visitors who participated in our survey.

Conflicts of Interest

The authors declare no conflict of interest.

References

  1. Scopelliti, M.; Carrus, G.; Adinolfi, C.; Suarez, G.; Colangelo, G.; Lafortezza, R.; Panno, A.; Sanesi, G. Staying in touch with nature and well-being in different income groups: The experience of urban parks in Bogotá. Landsc. Urban. Plan. 2016, 148, 139–148. [Google Scholar] [CrossRef]
  2. Peters, K.; Elands, B.; Buijs, A. Social interactions in urban parks: Stimulating social cohesion? Urban. For. Urban. Green. 2010, 9, 93–100. [Google Scholar] [CrossRef] [Green Version]
  3. Chiesura, A. The role of urban parks for the sustainable city. Landsc. Urban. Plan. 2004, 68, 129–138. [Google Scholar] [CrossRef]
  4. van den Bosch, M.; Sang, A.O. Urban natural environments as nature-based solutions for improved public health—A systematic review of reviews. Environ. Res. 2017, 158, 373–384. [Google Scholar] [CrossRef]
  5. Zhou, X.; Wang, Y.-C. Spatial–temporal dynamics of urban green space in response to rapid urbanization and greening policies. Landsc. Urban. Plan. 2011, 100, 268–277. [Google Scholar] [CrossRef]
  6. Niemelä, J.; Saarela, S.-R.; Söderman, T.; Kopperoinen, L.; Yli-Pelkonen, V.; Väre, S.; Kotze, D.J. Using the ecosystem services approach for better planning and conservation of urban green spaces: A Finland case study. Biodivers. Conserv. 2010, 19, 3225–3243. [Google Scholar] [CrossRef]
  7. Andersson, E.M.; Ögren, M.; Molnár, P.; Segersson, D.; Rosengren, A.; Stockfelt, L. Road traffic noise, air pollution and cardiovascular events in a Swedish cohort. Environ. Res. 2020, 185, 109446. [Google Scholar] [CrossRef]
  8. Sanchez, G.M.E.; Van Renterghem, T.; Thomas, P.; Botteldooren, D. The effect of street canyon design on traffic noise exposure along roads. Build. Environ. 2016, 97, 96–110. [Google Scholar] [CrossRef] [Green Version]
  9. Van Renterghem, T.; Forssén, J.; Attenborough, K.; Jean, P.; Defrance, J.; Hornikx, M.; Kang, J. Using natural means to reduce surface transport noise during propagation outdoors. Appl. Acoust. 2015, 92, 86–101. [Google Scholar] [CrossRef] [Green Version]
  10. Van Renterghem, T.; Vanhecke, K.; Filipan, K.; Sun, K.; De Pessemier, T.; De Coensel, B.; Joseph, W.; Botteldooren, D. Interactive soundscape augmentation by natural sounds in a noise polluted urban park. Landsc. Urban. Plan. 2020, 194, 103705. [Google Scholar] [CrossRef]
  11. Hong, J.Y.; Ong, Z.-T.; Lam, B.; Ooi, K.; Gan, W.-S.; Kang, J.; Feng, J.; Tan, S.-T. Effects of adding natural sounds to urban noises on the perceived loudness of noise and soundscape quality. Sci. Total Environ. 2020, 711, 134571. [Google Scholar] [CrossRef]
  12. Kang, J. From dBA to soundscape indices: Managing our sound environment. Front. Eng. Manag. 2017, 4, 184–192. [Google Scholar] [CrossRef] [Green Version]
  13. Kang, J.; Aletta, F.; Gjestland, T.T.; Brown, L.A.; Botteldooren, D.; Schulte-Fortkamp, B.; Lercher, P.; van Kamp, I.; Genuit, K.; Fiebig, A.; et al. Ten questions on the soundscapes of the built environment. Build. Environ. 2016, 108, 284–294. [Google Scholar] [CrossRef] [Green Version]
  14. Liu, F.; Kang, J. A grounded theory approach to the subjective understanding of urban soundscape in Sheffield. Cities 2016, 50, 28–39. [Google Scholar] [CrossRef] [Green Version]
  15. Liu, J.; Kang, J.; Luo, T.; Behm, H. Landscape effects on soundscape experience in city parks. Sci. Total Environ. 2013, 454–455, 474–481. [Google Scholar] [CrossRef] [PubMed]
  16. Szeremeta, B.; Zannin, P.H.T. Analysis and evaluation of soundscapes in public parks through interviews and measure-ment of noise. Sci. Total Environ. 2009, 407, 6143–6149. [Google Scholar] [CrossRef] [PubMed]
  17. Jeon, J.Y.; Jo, H.I. Effects of audio-visual interactions on soundscape and landscape perception and their influence on satisfaction with the urban environment. Build. Environ. 2020, 169, 106544. [Google Scholar] [CrossRef]
  18. Liu, J.; Wang, Y.; Zimmer, C.; Kang, J.; Yu, T. Factors associated with soundscape experiences in urban green spaces: A case study in Rostock, Germany. Urban. For. Urban. Green. 2019, 37, 135–146. [Google Scholar] [CrossRef]
  19. Gozalo, G.R.; Morillas, J.M.B.; González, D.M.; Moraga, P.A. Relationships among satisfaction, noise perception, and use of urban green spaces. Sci. Total Environ. 2018, 624, 438–450. [Google Scholar] [CrossRef]
  20. Gozalo, G.R.; Morillas, J.M.B. Perceptions and effects of the acoustic environment in quiet residential areas. J. Acoust. Soc. Am. 2017, 141, 2418–2429. [Google Scholar] [CrossRef] [PubMed]
  21. Yu, L.; Kang, J. Factors influencing the sound preference in urban open spaces. Appl. Acoust. 2010, 71, 622–633. [Google Scholar] [CrossRef] [Green Version]
  22. Viollon, S.; Lavandier, C.; Drake, C. Influence of visual setting on sound ratings in an urban environment. Appl. Acoust. 2002, 63, 493–511. [Google Scholar] [CrossRef]
  23. Liu, J.; Kang, J. Soundscape Design In City Parks: Exploring The Relationships Between Soundscape Composition Pa-rameters And Physical And Psychoacoustic Parameters. J. Environ. Eng. Landsc. Manag. 2015, 23, 102–112. [Google Scholar] [CrossRef] [Green Version]
  24. Liu, J.; Kang, J.; Behm, H.; Luo, T. Effects of landscape on soundscape perception: Soundwalks in city parks. Landsc. Urban. Plan. 2014, 123, 30–40. [Google Scholar] [CrossRef] [Green Version]
  25. Nilsson, M.; Berglund, B. Soundscape Quality in Suburban Green Areas and City Parks. Acta Acust. United Acust. 2006, 92, 903–911. [Google Scholar]
  26. Zhang, M.; Kang, J. Towards the evaluation, description, and creation of soundscapes in urban open spaces. Environ. Plan. B Plan. Des. 2007, 34, 68–86. [Google Scholar] [CrossRef]
  27. Kang, J.; Zhang, M. Semantic differential analysis of the soundscape in urban open public spaces. Build. Environ. 2010, 45, 150–157. [Google Scholar] [CrossRef]
  28. Yu, L.; Kang, J. Effects of social, demographical and behavioral factors on the sound level evaluation in urban open spaces. J. Acoust. Soc. Am. 2008, 123, 772–783. [Google Scholar] [CrossRef]
  29. Sang, Å.O.; Knez, I.; Gunnarsson, B.; Hedblom, M. The effects of naturalness, gender, and age on how urban green space is perceived and used. Urban. For. Urban. Green. 2016, 18, 268–276. [Google Scholar] [CrossRef]
  30. Alves, S.; Estévez-Mauriz, L.; Aletta, F.; Echevarria-Sanchez, G.M.; Romero, V.P. Towards the integration of urban sound planning in urban development processes: The study of four test sites within the SONORUS project. Noise Mapp. 2015, 2. [Google Scholar] [CrossRef]
  31. van Kempen, E.; Devilee, J.; Swart, W.; van Kamp, I. Characterizing urban areas with good sound quality: Development of a research protocol. Noise Health 2014, 16, 380–387. [Google Scholar] [CrossRef] [PubMed]
  32. Asdrubali, F. New frontiers in environmental noise research. Noise Mapp. 2014, 1, 1. [Google Scholar] [CrossRef]
  33. Yang, W.; Kang, J. Acoustic comfort evaluation in urban open public spaces. Appl. Acoust. 2005, 66, 211–229. [Google Scholar] [CrossRef]
  34. Guski, R. Psychological Methods for Evaluating Sound Quality and Assessing Acoustic Information. Acta Acust. United Acust. 1997, 83, 765–774. [Google Scholar]
  35. Fields, J.M. Effect of personal and situational variables on noise annoyance in residential areas. J. Acoust. Soc. Am. 1993, 93, 2753–2763. [Google Scholar] [CrossRef]
  36. Muratet, A.; Pellegrini, P.; Dufour, A.-B.; Arrif, T.; Chiron, F. Perception and knowledge of plant diversity among urban park users. Landsc. Urban. Plan. 2015, 137, 95–106. [Google Scholar] [CrossRef]
  37. Hunter, I. What do people want from urban forestry?—The European experience. Urban. Ecosyst. 2001, 5, 277–284. [Google Scholar] [CrossRef]
  38. Coles, R.; Bussey, S. Urban forest landscapes in the UK—Progressing the social agenda. Landsc. Urban. Plan. 2000, 52, 181–188. [Google Scholar] [CrossRef]
  39. Liu, J.; Xiong, Y.; Wang, Y.; Luo, T. Soundscape effects on visiting experience in city park: A case study in Fuzhou, China. Urban. For. Urban. Green. 2018, 31, 38–47. [Google Scholar] [CrossRef]
  40. Meng, Q.; Kang, J. The influence of crowd density on the sound environment of commercial pedestrian streets. Sci. Total Environ. 2015, 511, 249–258. [Google Scholar] [CrossRef] [Green Version]
  41. Meng, Q.; Ren, P.W.; Liao, W.Q. Effect of Users’ Social Characteristics on Soundscape in the Waiting Halls of Railway Stations. Adv. Mater. Res. 2012, 518–523, 3805–3808. [Google Scholar] [CrossRef]
  42. Tse, M.S.; Chau, C.K.; Choy, Y.S.; Tsui, W.K.; Chan, C.N.; Tang, S.K. Perception of urban park soundscape. J. Acoust. Soc. Am. 2012, 131, 2762–2771. [Google Scholar] [CrossRef] [Green Version]
  43. Xu, X.; Wu, H. Audio-visual Interactions Enhance Soundscape Perception in China’s National Parks. Urban. For. Urban. Green. 2021, 61, 127090. [Google Scholar] [CrossRef]
  44. Ma, K.W.; Mak, C.M.; Wong, H.M. Effects of environmental sound quality on soundscape preference in a public urban space. Appl. Acoust. 2021, 171, 107570. [Google Scholar] [CrossRef]
  45. Shu, S.; Ma, H. Restorative effects of urban park soundscapes on children’s psychophysiological stress. Appl. Acoust. 2020, 164, 107293. [Google Scholar] [CrossRef]
  46. Jahani, A.; Kalantary, S.; Alitavoli, A. An Application of Artificial Intelligence Techniques in Prediction of Birds Sound-scape Impact on Tourists’ Mental Restoration in Natural Urban Areas. Urban. For. Urban. Green. 2021, 61, 127088. [Google Scholar] [CrossRef]
  47. Jo, H.I.; Jeon, J.Y. The influence of human behavioral characteristics on soundscape perception in urban parks: Subjective and observational approaches. Landsc. Urban. Plan. 2020, 203, 103890. [Google Scholar] [CrossRef]
  48. Bruce, N.S.; Davies, W.J. The effects of expectation on the perception of soundscapes. Appl. Acoust. 2014, 85, 1–11. [Google Scholar] [CrossRef] [Green Version]
  49. Steiner, F. Landscape ecological urbanism: Origins and trajectories. Landsc. Urban. Plan. 2011, 100, 333–337. [Google Scholar] [CrossRef]
  50. Jim, C.Y.; Chen, W.Y. Perception and Attitude of Residents toward Urban Green Spaces in Guangzhou (China). Environ. Manag. 2006, 38, 338–349. [Google Scholar] [CrossRef]
  51. Aletta, F.; Van Renterghem, T.; Botteldooren, D. Influence of Personal Factors on Sound Perception and Overall Experi-ence in Urban Green Areas. A Case Study of a Cycling Path Highly Exposed to Road Traffic Noise. Int. J. Environ. Res. Public Health 2018, 15, 1118. [Google Scholar] [CrossRef] [Green Version]
  52. Sun, K.; De Coensel, B.; Sanchez, G.M.E.; Van Renterghem, T.; Botteldooren, D. Effect of interaction between attention focusing capability and visual factors on road traffic noise annoyance. Appl. Acoust. 2018, 134, 16–24. [Google Scholar] [CrossRef] [Green Version]
  53. Jeon, J.Y.; Hwang, I.H.; Hong, J.Y. Soundscape evaluation in a Catholic cathedral and Buddhist temple precincts through social surveys and soundwalks. J. Acoust. Soc. Am. 2014, 135, 1863–1874. [Google Scholar] [CrossRef]
  54. Meng, Q.; Kang, J. Influence of Social and Behavioural Characteristics of Users on Their Evaluation of Subjective Loudness and Acoustic Comfort in Shopping Malls. PLoS ONE 2013, 8, e54497. [Google Scholar] [CrossRef] [PubMed]
  55. Aguilera, A.M.; Escabias, M.; Valderrama, M.J. Using principal components for estimating logistic regression with high-dimensional multicollinear data. Comput. Stat. Data Anal. 2006, 50, 1905–1924. [Google Scholar] [CrossRef]
  56. Pasternak, H.; Edan, Y.; Schmilovitch, Z. Overcoming multicollinearity by deducting errors from the dependent varia-ble. J. Quant. Spectrosc. Radiat. Transf. 2001, 69, 761–768. [Google Scholar] [CrossRef]
  57. Hedblom, M.; Heyman, E.; Antonsson, H.; Gunnarsson, B. Bird song diversity influences young people’s appreciation of urban landscapes. Urban For. Urban Green. 2014, 13, 469–474. [Google Scholar] [CrossRef]
  58. Hedblom, M.; Gunnarsson, B.; Schaefer, M.; Knez, I.; Thorsson, P.; Lundstrom, J.N. Sounds of nature in the city: No evi-dence of bird song improving stress recovery. Int. J. Environ. Res. Public Health 2019, 16, 1390. [Google Scholar] [CrossRef] [PubMed] [Green Version]
  59. Preis, A.; Kociński, J.; Hafke-Dys, H.; Wrzosek, M. Audio-visual interactions in environment assessment. Sci. Total Environ. 2015, 523, 191–200. [Google Scholar] [CrossRef] [PubMed]
  60. Paneerchelvam, P.T.; Maruthaveeran, S.; Maulan, S.; Shukor, S.F.A. The use and associated constraints of urban greenway from a socioecological perspective: A systematic review. Urban. For. Urban. Green. 2020, 47, 126508. [Google Scholar] [CrossRef]
  61. Chen, H.; Qiu, L.; Gao, T. Application of the eight perceived sensory dimensions as a tool for urban green space assess-ment and planning in China. Urban. For. Urban. Green. 2019, 40, 224–235. [Google Scholar] [CrossRef]
  62. Knez, I.; Sang, Å.O.; Gunnarsson, B.; Hedblom, M. Wellbeing in Urban Greenery: The Role of Naturalness and Place Identity. Front. Psychol. 2018, 9, 491. [Google Scholar] [CrossRef] [Green Version]
  63. Hedblom, M.; Knez, I.; Sang, Å.O.; Gunnarsson, B. Evaluation of natural sounds in urban greenery: Potential impact for urban nature preservation. R. Soc. Open Sci. 2017, 4, 170037. [Google Scholar] [CrossRef] [Green Version]
  64. Navarrete-Hernandez, P.; Laffan, K. A greener urban environment: Designing green infrastructure interventions to promote citizens’ subjective wellbeing. Landsc. Urban. Plan. 2019, 191, 103618. [Google Scholar] [CrossRef]
  65. O’Brien, E. Publics* and woodlands in England: Well-being, local identity, social learning, conflict and management. Forestry 2005, 78, 321–336. [Google Scholar] [CrossRef]
  66. Beyer, M.M.K.; Kaltenbach, A.; Szabo, A.; Bogar, S.; Nieto, J.F.; Malecki, M.K. Exposure to Neighborhood Green Space and Mental Health: Evidence from the Survey of the Health of Wisconsin. Int. J. Environ. Res. Public Health 2014, 11, 3453–3472. [Google Scholar] [CrossRef] [PubMed] [Green Version]
  67. Collins, R.; Schaafsma, M.; Hudson, M.D. The value of green walls to urban biodiversity. Land Use Policy 2017, 64, 114–123. [Google Scholar] [CrossRef]
  68. Chen, C.; Qin, B. The emergence of China’s middle class: Social mobility in a rapidly urbanizing economy. Habitat Int. 2014, 44, 528–535. [Google Scholar] [CrossRef]
  69. Sang, A.O.; Sang, N.; Hedblom, M.; Sevelin, G.; Knez, I.; Gunnarsson, B. Are path choices of people moving through ur-ban green spaces explained by gender and age? Implications for planning and management. Urban. For. Urban. Green. 2020, 49, 126628. [Google Scholar] [CrossRef]
Figure 1. Location of the six urban recreational forest parks in Xi’an, China (Source: elaborated by authors by Google earth 2020).
Forests 12 00468 g001
Figure 2. Perception of and preference for individual sounds (±standard error) in urban recreational forest parks. Note: All personal factors and landscape type were considered as covariables. (a) represent perceived occurrences of each sound; (b) represent perceived loudness of each sound; (c) represent preference for each sound; (d) represent perceived visual source of each sound.
Forests 12 00468 g002
Figure 3. Overall soundscape perception in urban recreational forest parks. OPL = Perceived loudness; OPA = Perceived annoyance; OPR = Soundscape preference.
Forests 12 00468 g003
Table 1. Information of the six urban recreational forest parks in Xi’an, China.
Surveyed ParksLocationFree of ChargeCharacteristicsNumber of Daily Visits (per Year)Shape of SiteDevelopmentArea (Hectares)
Xi’an exposition (EXPO) parkNorthern suburbYesTheme of ornamental horticulture1.8 millionRegular trapezoidOpened for free in 2012Around 418
Daming palace national heritage parkCity centreYesTheme of historical and cultural heritage5.5 millionRegular rectangleOpened in 2010Around 320
The park of Xingqing palaceCity centreYesTheme of historical and cultural heritage9.0 millionRegular squareOpened in 2006 Around 52
The yanming lake wetland parkEastern suburbYesTheme of the wetland1.5 millionApproximate triangleOpened in 2016Around 44
Qujiang pond heritage parkCity centreYesTheme of waterscape1.5 millionApproximate triangleOpened in 2008Around 31
Yinghua parkSouthern suburbYesTheme of cherry blossoms1.0 millionRegular trapezoidReopened in 2019Around 5
Table 2. Numbers of study participants per personal attributes’ grouping.
AttributesNumbers of Each Categorization
AgeFilled out by participants, ranging from 9 to 87 years old (average age = 34.57 ± 15.59, overall 2034)
Gender1. male (989), 2. female (1045)
Companion1. alone (530), 2. two people (832), 3. three to five people (422), 4. small family (219), 5. big family (32)
Educational background1. primary school (54), 2. secondary school (179), 3. secondary school graduate (283), 4. trade/technical/vocational college (91), 5. trade/technical/vocational college graduate (344), 6. some college (292), 7. college graduate (593), 8. some postgraduate work (98), 9. post graduate degree (100)
Occupation1. employed (928), 2. unemployed (153), 3. retired (298), 4. student (519), 5. other (136)
Monthly income (RMB)1. <1000 (600), 2. 1000 to 4000 (501), 3. 4000 to 7000 (521), 4. 7000 to 10,000 (239), 5. >10,000 (173)
Dwelling place1. village (219), 2. city (1815)
Residential status1. local resident (1179), 2. tourist (473), 3. other (382)
Distance to the park (m)1. 0 to 500 m (123), 2. 500 to 1500 m (331), 3. 1500 to 3000 m (361), 4. 3000 to 4500 m (187), 5. >4500 m (1032)
Visit frequency1. rarely (520), 2. several times in a year (582), 3. once in a month (261), 4. once in a week (216), 5. twice or thrice in a week (215), 6. everyday (240)
Length of stay1. <30 min (542), 2. 30 min to 1 h (737), 3. 1 to 3 h (604), 4. >3 h (151)
Potential recreational activities1. parent-child activities (316), 2. fitness and health activities (114), 3. sports and leisure activities (821), 4. social activities (192), 5. specialized activities (53), 6. quiet activities (432), 7. public participation activities (51), 8. other (55)
Table 3. Spearman’s rho correlation coefficients for the relationship between twelve respondents’ attributes.
GenderAgeCompanionEducational BackgroundOccupationMonthly IncomeDwelling PlaceResidential StatusDistance to the ParkVisit FrequencyLength of StayPotential Recreational Activities
Age−0.0311
Companion0.081 **−0.258 **1
Educational background−0.027−0.139 **0.069 **1
Occupation0.081 **−0.288 **0.081 **−0.201 **1
Monthly income−0.188 **0.332 **−0.066 **0.334 **−0.583 **1
Dwelling place0.0180.149 **−0.049 *0.175 **−0.138 **0.224 **1
Residential status−0.037−0.429 **0.132 **0.0340.163 **−0.181 **−0.226 **1
Distance to the park−0.014−0.272 **0.149 **0.150 **0.055 *−0.082 **−0.082 **0.325 **1
Visit frequency−0.0050.472 **−0.211 **−0.216 **−0.060 **0.094 **0.110 **−0.410 **−0.556 **1
Length of stay−0.0150.080 **0.042−0.077 **0.059 **−0.0250.063 **−0.084 **−0.0180.145 **1
Potential recreational activities−0.015−0.233 **−0.084 **0.055 *0.061 **−0.069 **−0.052 *0.208 **0.160 **−0.201 **−0.0391
Notes: * significance at the 0.05 level (2-tailed), ** significance at the 0.01 level (2-tailed).
Table 4. Component scores of respondents’ attributes. Extraction method: factor analysis; rotation method: Varimax rotation with Kaiser normalized loadings.
AttributesComponent (Explained Variance, %)
1(20.80)2(15.90)3(9.45)4(8.98)5(8.82)
Gender−0.018−0.227−0.0860.819−0.135
Age−0.7300.0710.073−0.1250.101
Companion0.341−0.025−0.7300.1110.130
Educational background0.4130.5900.0150.2360.016
Occupation0.129−0.7270.0320.1210.144
Monthly income (RMB)−0.1020.838−0.030−0.1690.006
Dwelling place−0.1530.4310.1330.4610.401
Residential status0.601−0.2480.096−0.222−0.141
Distance to the park (m)0.6840.0170.040−0.0780.123
Visit frequency−0.829−0.0570.019−0.0140.075
Length of stay−0.063−0.134−0.074−0.0990.892
Potential recreational activities0.325−0.0610.7430.0410.055
Notes: Bold values represent parameters belonging to one of the components.
Table 5. Generalized linear models for the impact of respondents’ factors on overall soundscape perception, with “-” indicating no effect was shown.
Age and Familiarity of SiteEducational and Economic ConditionCompanion and Type of Recreational UseGenderLength of Stay
OPRNo. of obs = 2034 (1/df) Deviance = 0.828 AIC = 2.652
Coefficient-−0.051--0.053
Sig. (2-tailed)0.011 *0.009 **
OPLNo. of obs = 2034 (1/df) Deviance = 0.563 AIC = 2.266
Coefficient--−0.0330.035-
Sig. (2-tailed)0.045 *0.033 *
OPANo. of obs = 2034 (1/df) Deviance = 1.014 AIC = 2.854
Coefficient-0.047−0.074--
Sig. (2-tailed)0.037 *0.001 **
Notes: significant differences are marked with * (p < 0.05) and ** (p < 0.01).
Table 6. Perception parameters of individual sounds that were significantly influenced (p < 0.001) by respondents’ factors.
Age and Familiarity of SiteEducational and Economic ConditionCompanion and Type of Recreational UseGenderLength of Stay
POInsects (0.248)Singing (−0.112)Surrounding speech (−0.151)Insects (0.096)Birds (0.132)
Leaves rustling (0.193)Train (0.073)Playing children (−0.255) Broadcast music (0.156)
Wind (0.135)Automobile (0.142)Diabolo (0.042) Automobile (−0.149)
Water (0.094)Motorbike (−0.056)Train (−0.055) Motorbike (−0.068)
Square dancing (−0.162) Automobile (−0.146)
Singing (−0.155)
Surrounding speech (0.210)
Playing children (0.273)
Footsteps (0.232)
Diabolo (−0.053)
Bicycle riding (0.070)
Construction sound (0.090)
Train (0.073)
Motorbike (−0.071)
PLSurrounding speech (0.089)Motorbike (−0.254)Surrounding speech (−0.096)
Playing children (0.099) Playing children (−0.095)
PRBirds (−0.124)Dogs (−0.208)Playing children (−0.102)Playing children (−0.090)
Insects (−0.159)Square dancing (−0.167) Engine (−0.270)
Square dancing (−0.264)Surrounding speech (−0.087)
Surrounding speech (−0.150)Footsteps (−0.071)
Playing children (−0.214)Automobile (−0.174)
Footsteps (−0.149)
Automobile (−0.139)
VSBirds (0.097)
Leaves rustling (0.053)
Square dancing (0.067)
Singing (0.069)
Broadcast music (0.059)
Notes: The coefficient of each respondents’ factor is located in parentheses.
Publisher’s Note: MDPI stays neutral with regard to jurisdictional claims in published maps and institutional affiliations.

