Article

Improved Hough Transform and Total Variation Algorithms for Features Extraction of Wood

1
Information and Human Science, Kyoto Institute of Technology, Hachigami-cho, Kyoto 6068585, Japan
2
Computer and Information Technology, Shanxi University, Taiyuan 030006, China
3
Life and Environmental Sciences, Kyoto Prefectural University, Kyoto 6069522, Japan
*
Author to whom correspondence should be addressed.
Forests 2021, 12(4), 466; https://doi.org/10.3390/f12040466
Submission received: 23 March 2021 / Revised: 6 April 2021 / Accepted: 7 April 2021 / Published: 11 April 2021
(This article belongs to the Section Wood Science and Forest Products)

Abstract

:
Research shows that the intensity impact factors of wood, such as late timber ratio, volume density and the intensity of itself, correlate with the width of wood annual rings. Therefore, extracting wood annual ring information from wood images is helpful for evaluating wood quality. During the past few years, many researchers have conducted defect detection by studying the information of wood images. However, there are few in-depth studies on the statistics and calculation of wood annual ring information. This study proposes a new model combining the Total Variation (TV) algorithm and the improved Hough transform to accurately measure the wood annual ring information. The TV algorithm is used to suppress image noise, and the Hough transform is for detecting the center of the wood image. Moreover, the edges of wood annual rings are extracted, and the statistical ring information is calculated. The experimental results show that the new model has good denoising capability, clearly extract the edges of wood annual rings and calculate the related parameters from the indoor wood images of the processed logs and the unprocessed low-noise logs.

1. Introduction

In 2017, the forest coverage rate in Japan was 66.7%, and the forest stock reached 5.24 billion cubic meters [1]. Abundant forest resources provide strong green support for the sustainable development of Japanese economy and society. Due to the inefficiency of the wood supply system, operating costs and economic benefits in the timber market do not match, which results in the depression of Japanese forestry. The reason for the inefficiency of the wood supply system is the difference in the evaluation criteria for wood. Suppliers include forester and timber market who use the appearance of the log as an evaluation. Foresters grow trees and harvest them and the timber market gathers trees from different areas and auctions the logs. However, the consumers include lumber companies, plywood companies and house makers/builders who seek logs with high strength. Lumber companies and plywood companies process lumber into easy-to-use forms, and house makers/builders provide consumers with processed timber. Because of this difference in evaluation criteria, the consumers have to purchase three times more wood than they need in order to produce strong enough lumbers [2]. Therefore, it is essential to establish an efficient wood supply system with the same evaluation between suppliers and consumers.
Wood strength is one of the criteria for the same evaluation between suppliers and consumers. Some wood features can be used to conjecture wood strength such as the wood annual ring and width between annual rings. From the experimental results of the algorithm proposed in this article, if the ratio of Root Mean Squared Error (RMSE) of the indoor wood image of the unprocessed low-noise logs is less than 10%, it can be considered as an effective measure of wood features extraction. Traditionally, forestry expert professionals measure the wood features manually, which is accurate and reliable but time-consuming, laborious, and inefficient. Recently, image processing is used to extract the relevant parameters of wood annual rings in order to reduce cost. In 2003, Funck et al. proposed the image segmentation algorithms applied to wood defect detection; they used a region-based similarity algorithm that was a combination of clustering and region-growing [3]. In 2010, Mu proposed the wood defect detection algorithm based on Back Propagation and Radial Basis Function neural networks [4], and Gu et al. proposed wood defect classification based on image analysis and Support Vector Machines [5]. Then, Sioma focused on the assessment of wood surface defects based on 3D image analysis in 2015 [6]. In the same year, Bai et al. proposed the Gradient Vector Flow Snake model in wood surface defects segmentation [7], and Niu et al. proposed wood texture image processing based on FitzHugh-Nagumo reaction-diffusion equations [8]. In 2016, Fahrurozi et al. proposed wood texture features extraction by using Gray Level Co-occurrence Matrics combined with various edge detection methods [9]. In 2017, Xu studied wood defect recognition by analyzing tomography with the fractal method [10], and Xu studied image segmentation algorithm of wood surface defects [11]. In the same year, Zhang proposed wood surface defect recognition based on Wavelet transform and LBP [12]. In 2018, Chen et al. proposed identification of CT image defects in wood based on Convolution Neural Network algorithm [13], and Cheng et al. researched a detection algorithm of wood rings image based on texture feature [14]. In 2019, Ning et al. used the U-Net convolution network to segment the wood image [15]. However, many of these algorithms are aimed at a certain defects of wood or local image processing of wood. Other algorithms only extract features of the wood annual rings, but the relevant parameters of wood annual rings are not calculated and analyzed.
This paper proposes a new model combining the improved Hough transform and the Total Variation (TV) algorithm for features extraction automatically from wood images, such as the number of rings, the width of annual rings, and the average width of the 15th ring from the center and outside. The TV algorithm is used to remove the image noises, and the second-order gradient Hough transform is used to get the center of annual rings from wood images. The model presented in this paper can further improve the accuracy of judging the wood quality based on features of wood annual rings.
This paper is organized as follows. A new model is introduced in Section 2. The improved Hough transform and TV algorithm as the proposal of this paper are explained in Section 3. Section 4 shows the experimental results. Finally, some conclusions are given.

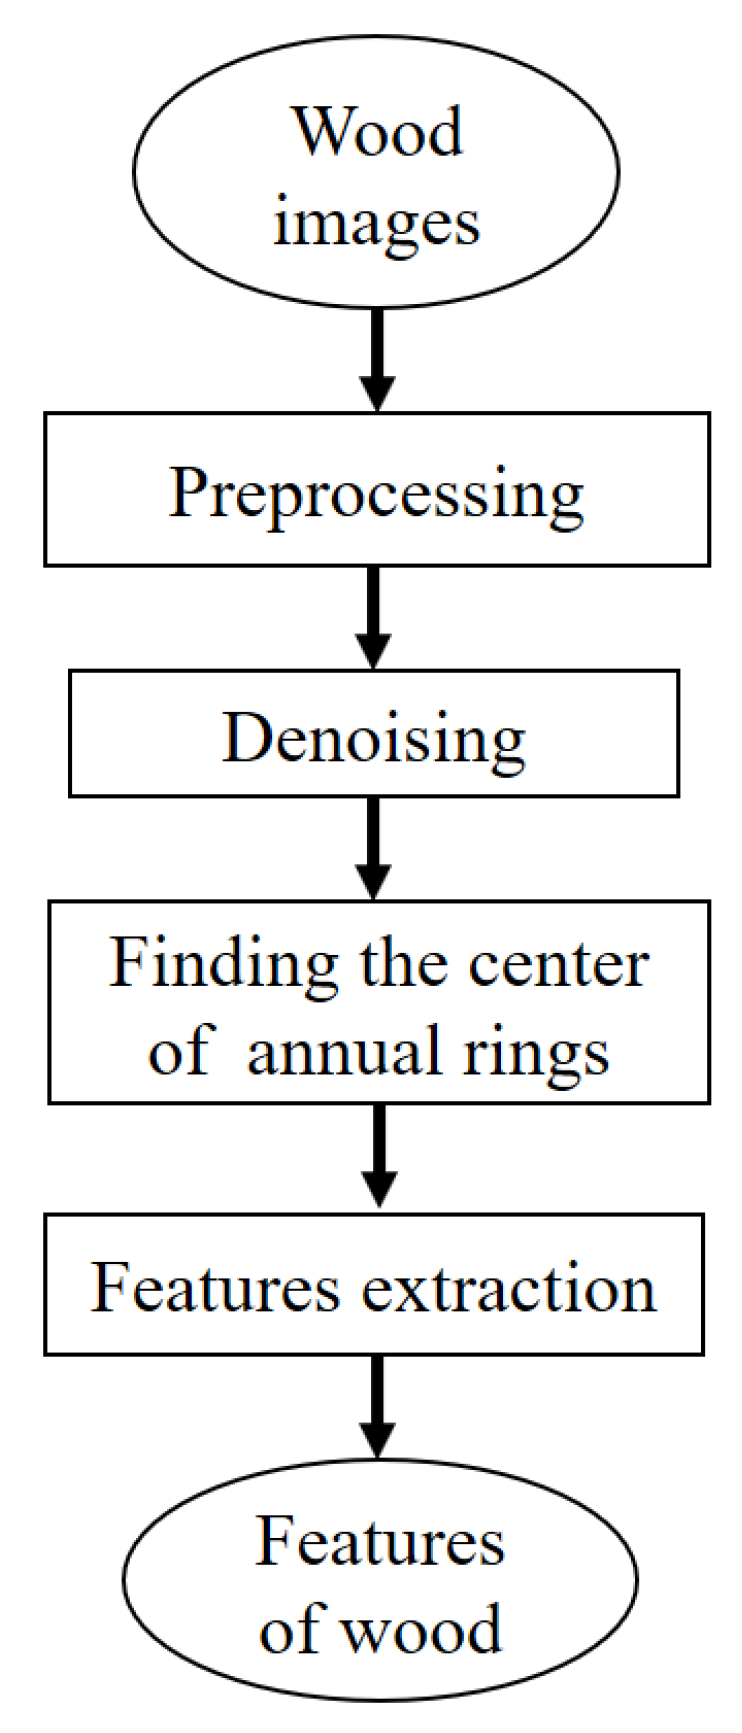
2. The Process on Features Extraction of Wood

This paper proposes a new model to extract the wood annual rings information from wood images with the improved Hough transform and the TV algorithm. The process is shown in Figure 1.

2.1. Preprocessing

A grayscale image needs be converted from an original wood image in order to obtain edges information of annual rings. V channel of Hue, Saturation and Value (HSV) space can extract edges information of annual rings from an orignal wood image based on the distribution of HSV space.

2.2. Denoising

Annual rings information cannot be obtained precisely as noises of the boundary. This paper proposes the TV algorithm, which not only effectively removes some noises but also keeps the wood annual rings information compared with other methods of removing noise such as Gaussian filter [16,17,18].

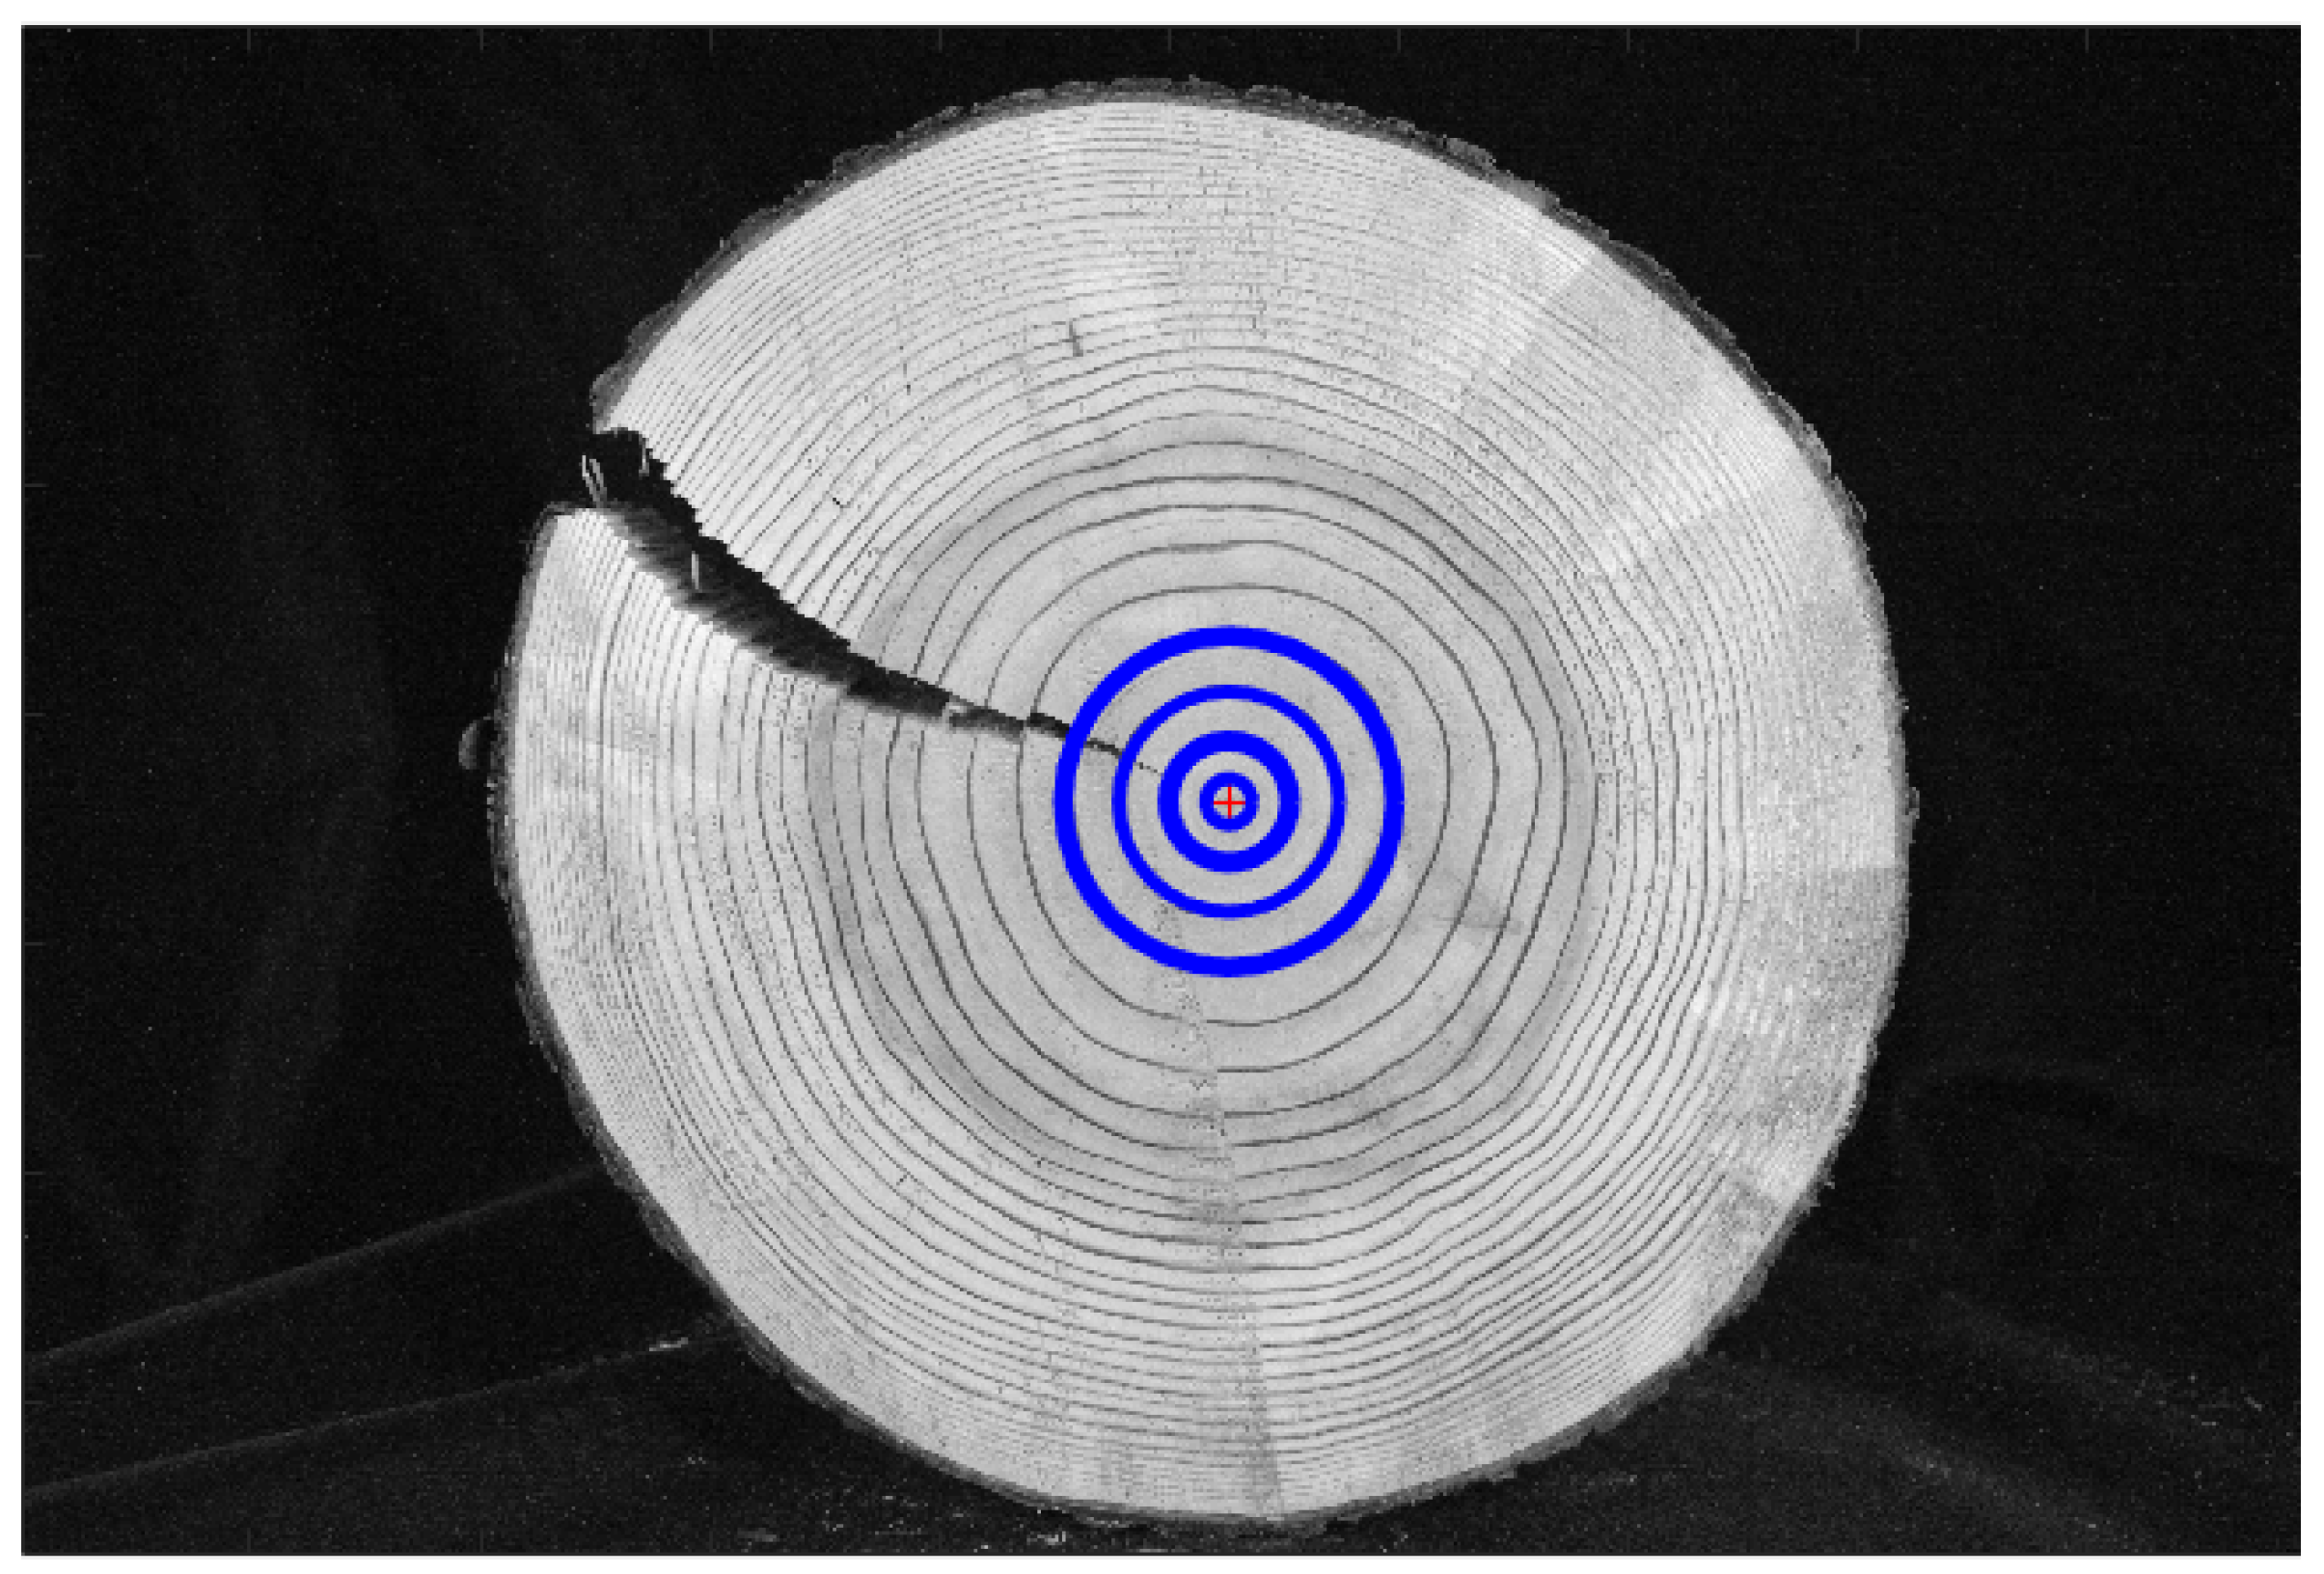
2.3. Finding the Center of the Annual Rings

This paper proposes the second-order Hough transform to find the center coordinates by using the accumulated local peaks. The center coordinates found are consistent with those found by the human eyes. Moreover, the range of the radius on the log has been defined in order to improve the speed of calculation. The center of annual rings from the wood image are found, which is shown in Figure 2.

2.4. Features Extraction

Features of wood include the number of annual rings, the width of the annual rings, the average width of the 15th ring from the center and outside. The features of wood can be obtained through edges of the annual rings that are extracted from a grayscale wood image. The method is shown as below.
  • The edges of annual rings are extracted by using Canny operation to find the outermost edge of the wood image shown in Figure 3. The red circle of Figure 3 is the outermost edge of the wood image with coordinate ( x n , y n ) . The red center point of annual rings is ( x 0 , y 0 ) .
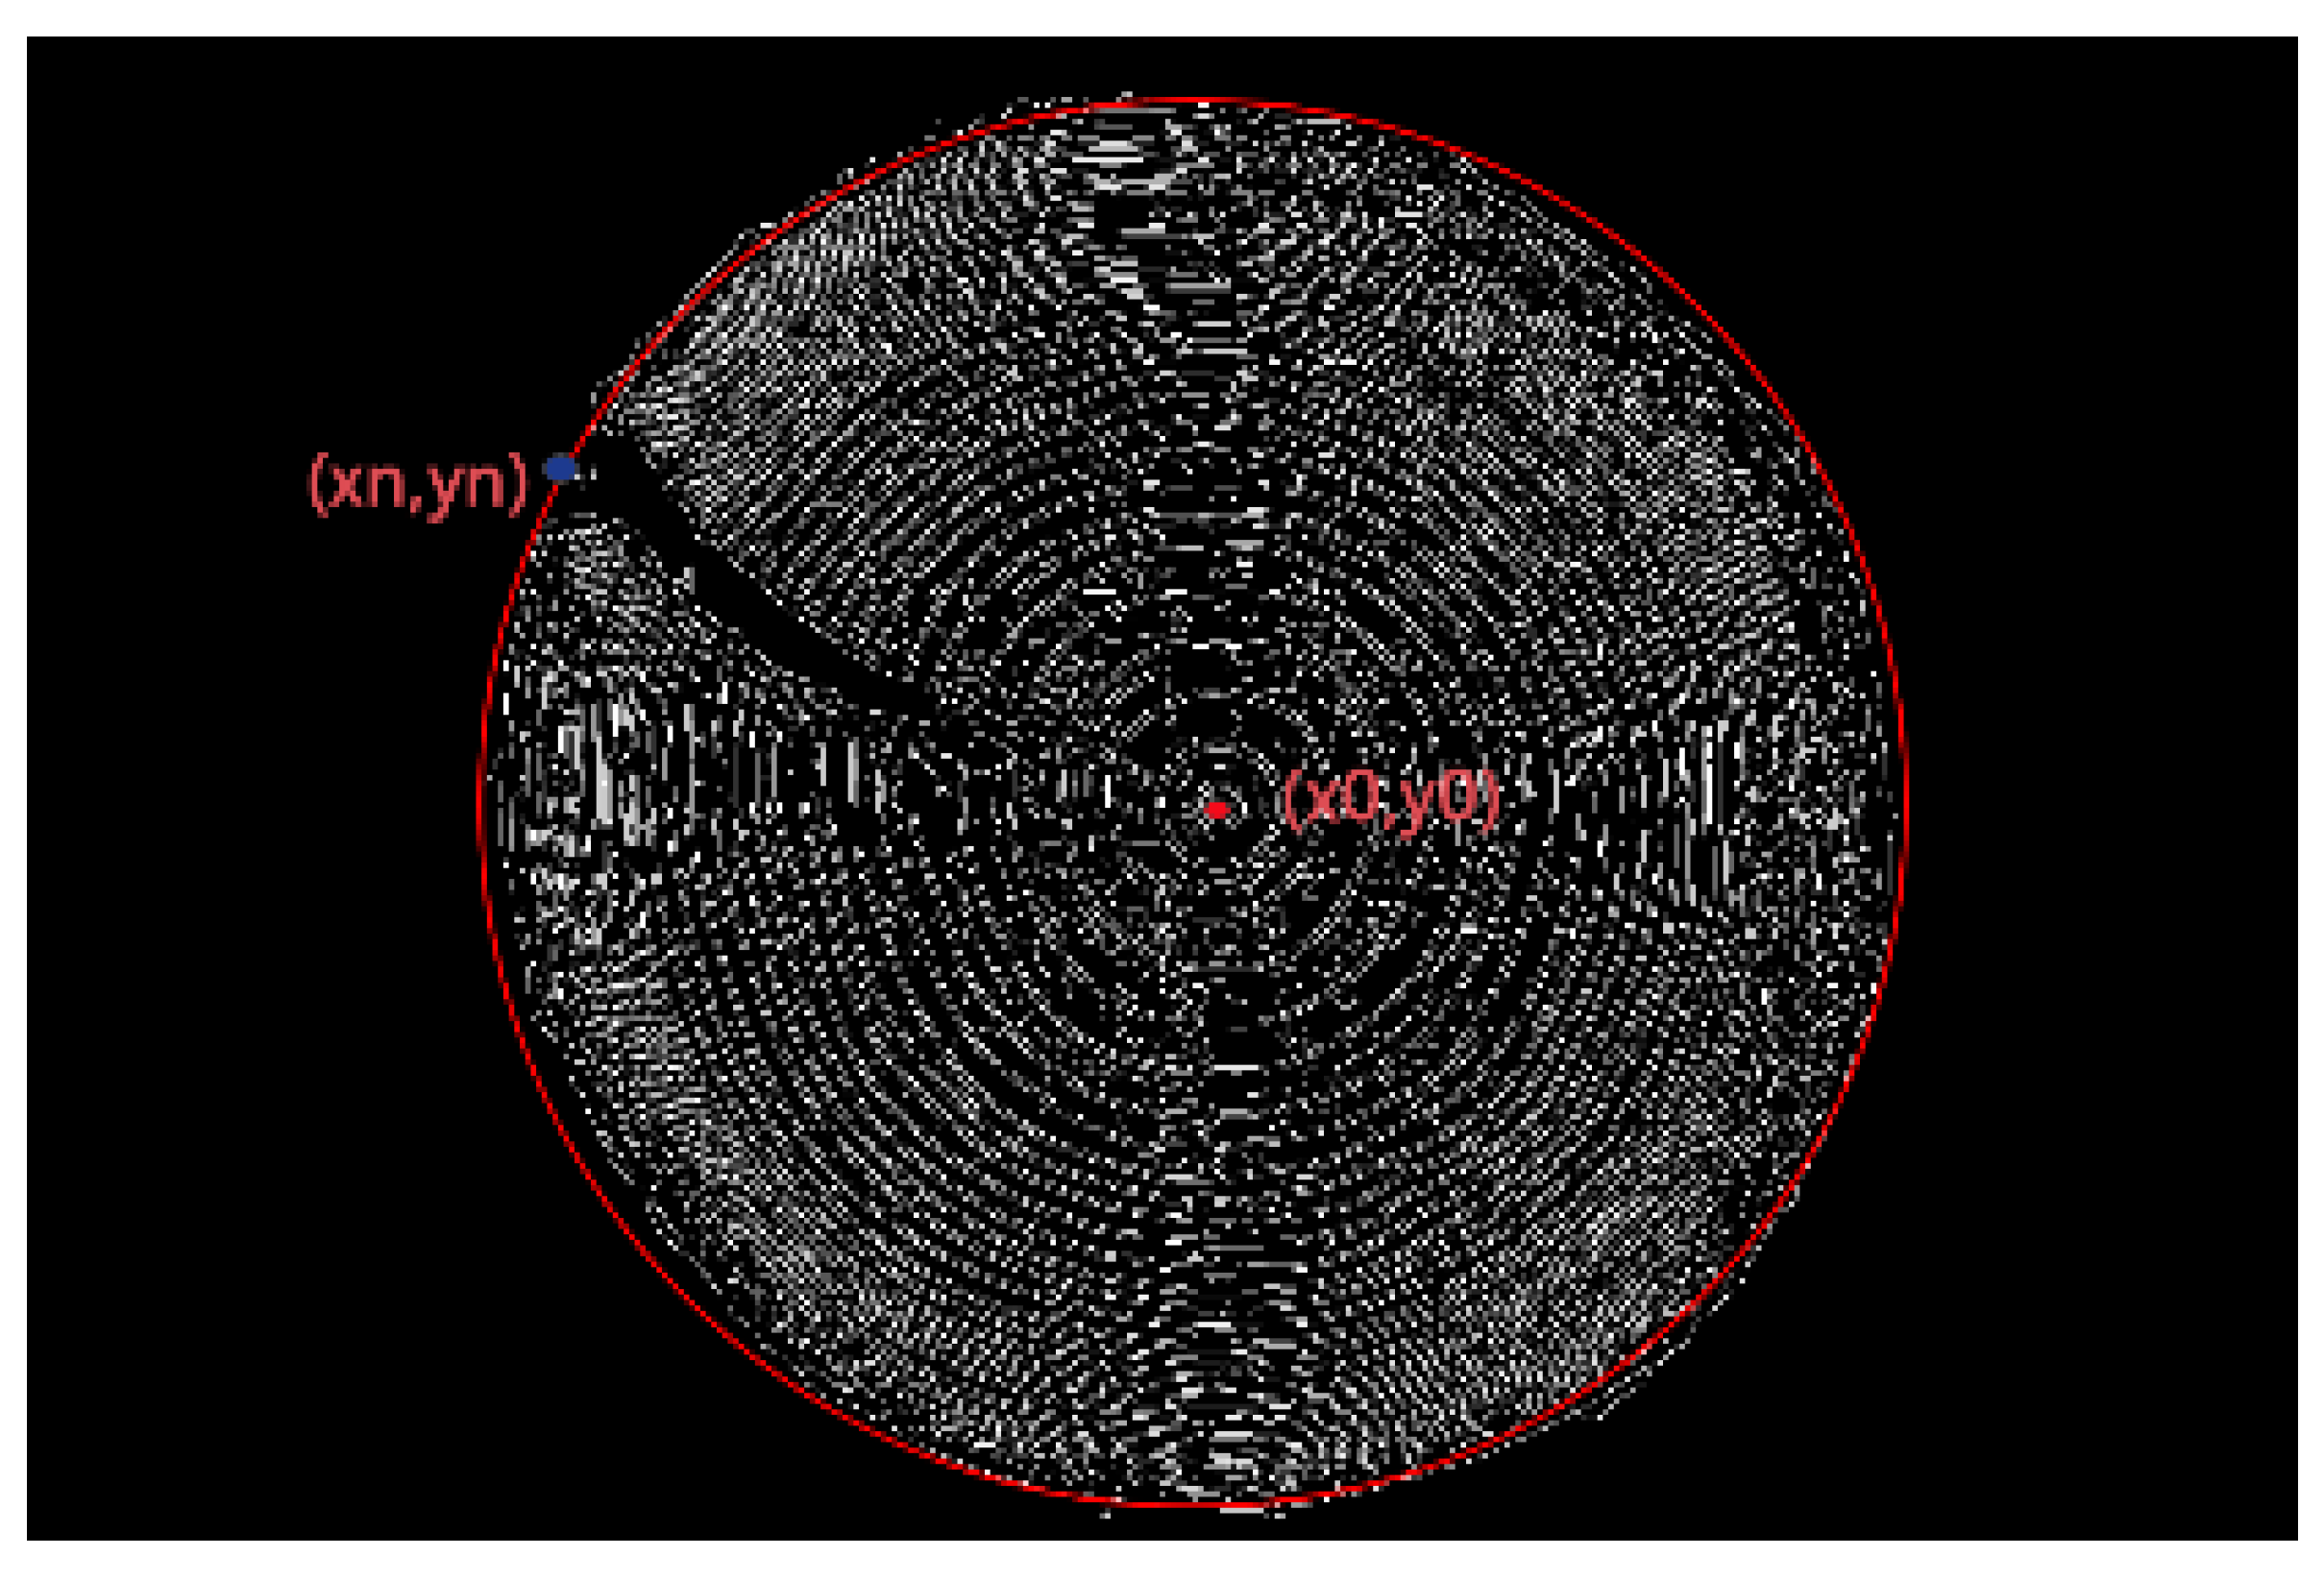
  • The line equation can be generated with ( x n , y n ) and ( x 0 , y 0 ) as below to find intersection coordinates of each track and the wood image.
    x x 0 x n x 0 = y y 0 y n x 0
  • A datum ( x n + 10 , y n + 10 ) of the outermost edge in a wood image is taken at every 10 data to save time and ensure accuracy because the outermost edge of the wood image has a huge number of data. Therefore, to image edge coordinates, every ten coordinates are extracted. The extracted coordinates and wood center coordinates can generate an equation of the line and then find the intersection coordinates of each track and the wood image.
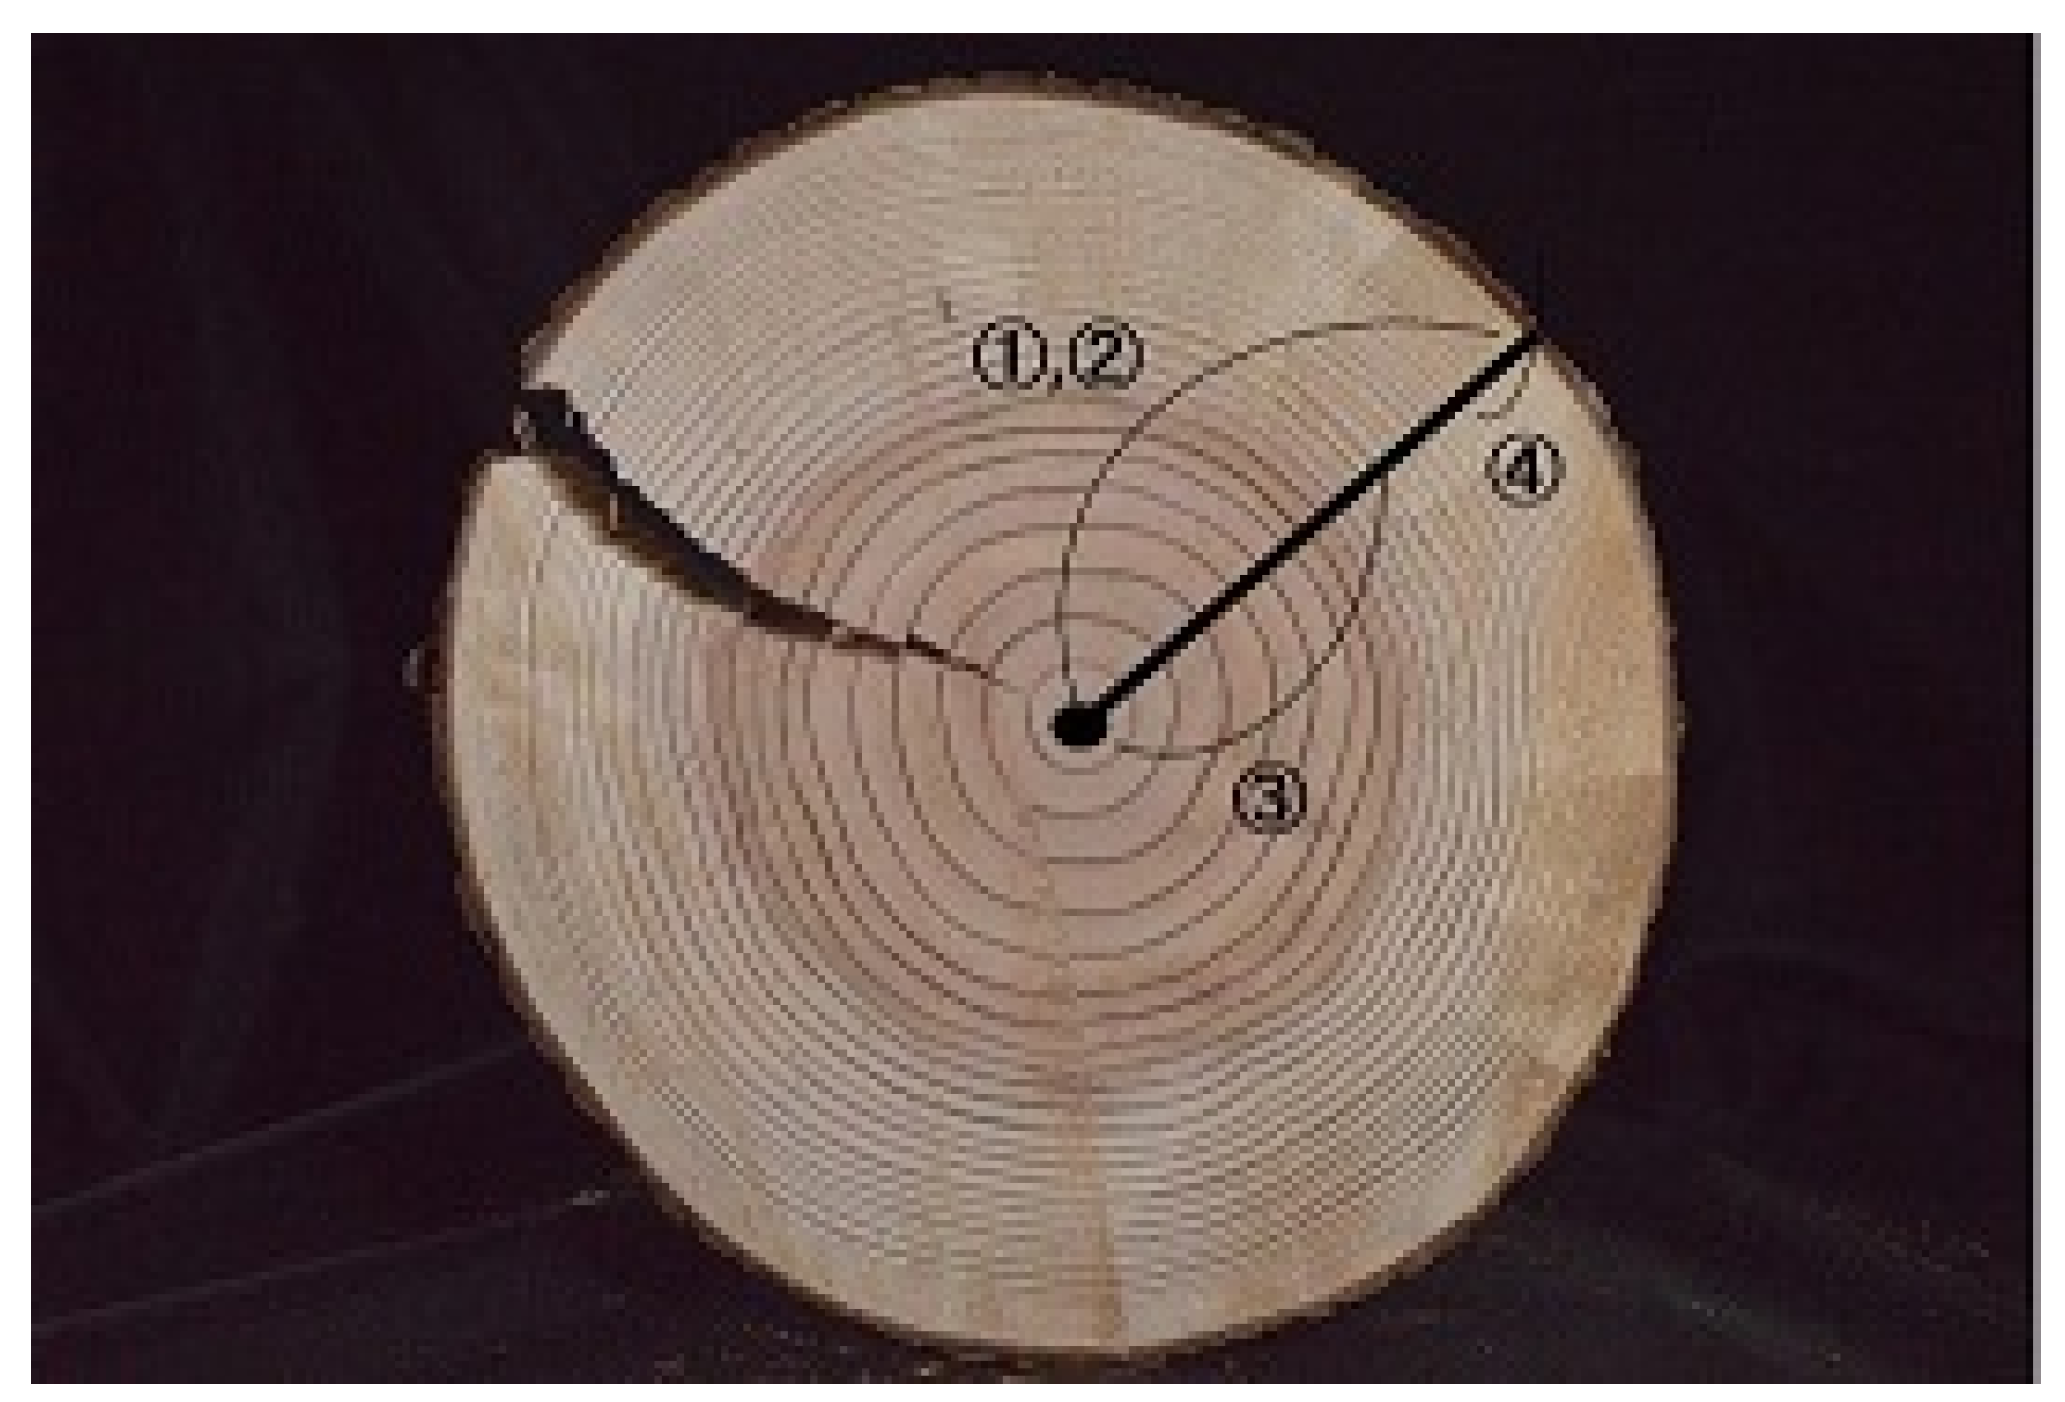
  • The average number of these points at which the equations of each line intersect wood image is the number of the annual rings. The average width of an annual ring can be obtained through the distance from center point to the outermost edge divided by the number of annual rings. The other features can be obtained based on the intersection coordinates such as the average width of 15th ring from the center and outside from the wood image. The calculation of annual rings information is shown in Figure 4. ①, ② represent the number and average width of annual rings, and ③, ④ represent the average width of 15 rings from the center and outside.

3. Improved Hough Transform and Total Variation Algorithms

This section explains the improved Hough transform to find the center of annual rings and the TV algorithm to remove noises from a grayscale image.

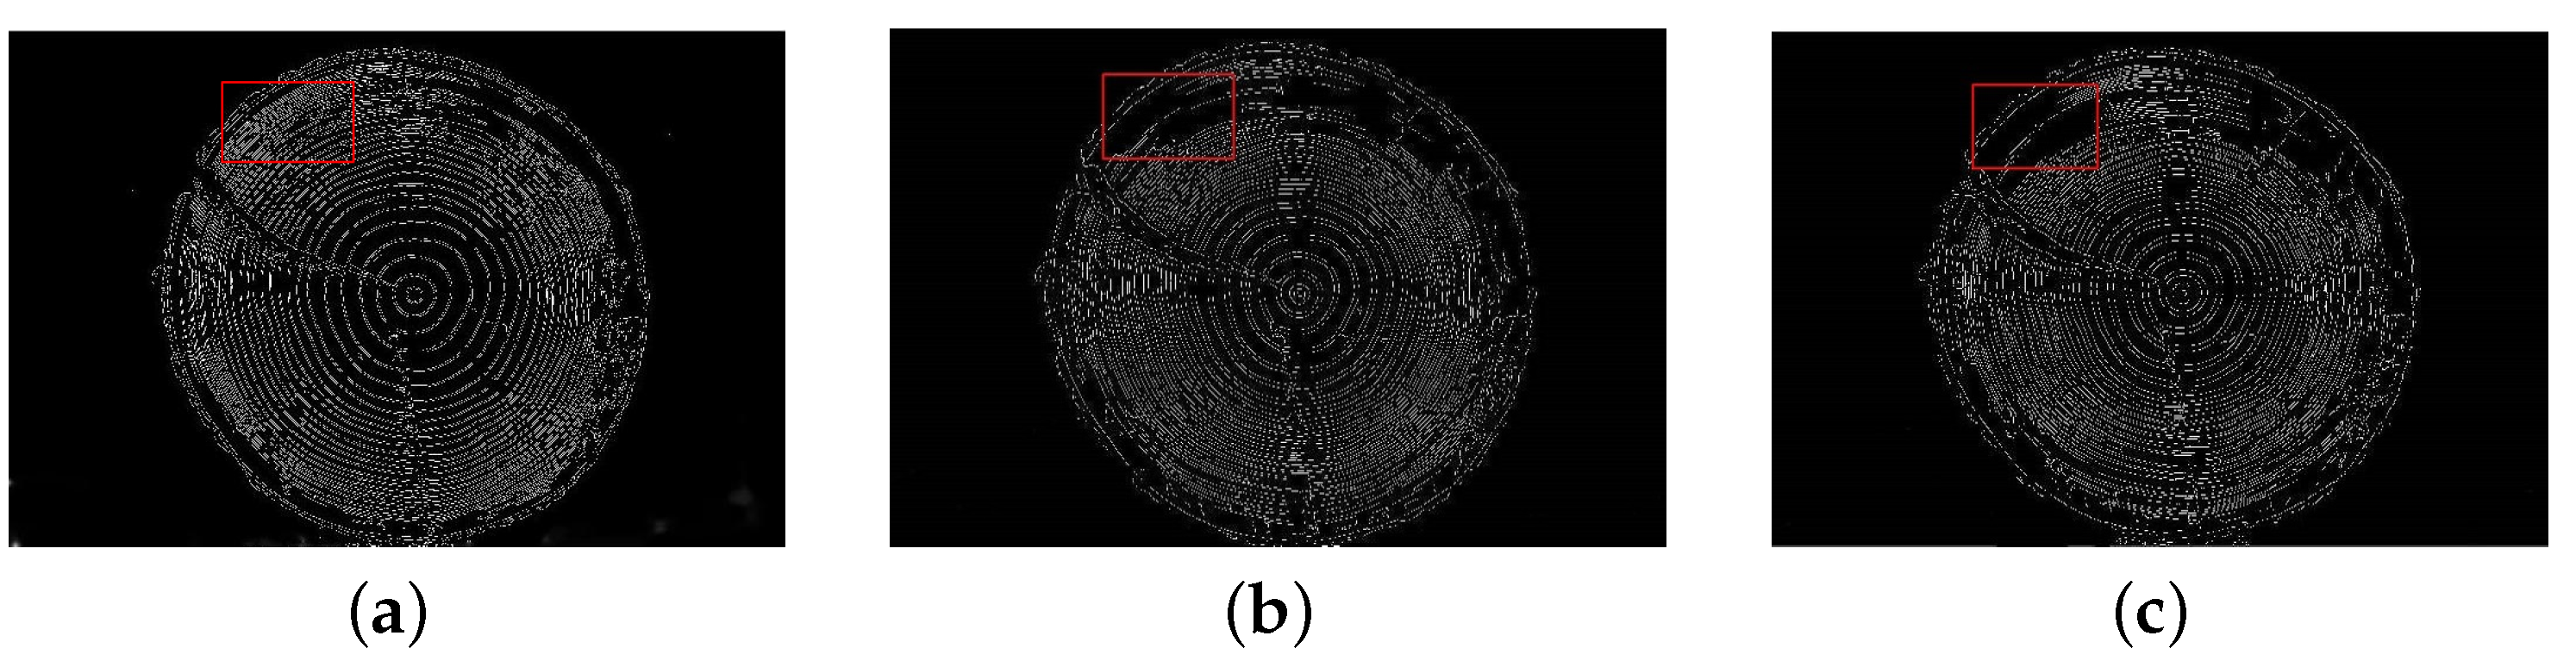
3.1. Improved Hough Transform

Hough transform is a mapping relationship from image space to parameter space shown by the center and radius of the circle. The expression is shown with the parameters ( a , b , r ) as below.
( a x ) 2 + ( b y ) 2 = r 2
In the traditional Hough transform, every pixel in the image is regarded as the center of a circle, and the length from each pixel to the edge of the image is regarded as the radius. The disadvantages of traditional Hough transform to detect the circle are a large amount of computation, large memory footprint, and the quantization interval of parameter space easily restricts it. The improved Hough transform determines the center of a circle according to the fact that the center of a circle always exists in the gradient direction of the edge of the circle. Therefore, this paper designs an improved Hough transform model by using second-order gradient information. The direction information of gradient is used to reduce the invalid accumulation of detection process and reduce the memory footprint.
The second-order gradient of an image whose size is s × t can be expressed as:
u s , t x x = ( u s , t u s 1 , t ) ( u s 1 , t u s 2 , t ) = u s , t 2 u s 1 , t + u s 2 , t
u s , t x y = ( u s , t u s 1 , t ) ( u s , t 1 u s 1 , t 1 ) = u s , t u s 1 , t u s , t 1 + u s 1 , t 1
u s , t y x = ( u s , t u s , t 1 ) ( u s 1 , t u s 1 , t 1 ) = u s , t u s , t 1 u s 1 , t + u s 1 , t 1
u s , t y y = ( u s , t u s , t 1 ) ( u s , t 1 u s , t 2 ) = u s , t 2 u s , t 1 + u s , t 2
u s , t x x , u s , t x y , u s , t y x , u s , t y y present four different second-order differences of the image and represent four second-order gradients. This paper defines the second-order gradient in the x-direction to be G x x 2 and the second-order gradient in the y-direction to be G y y 2 . The G x x 2 and the G y y 2 are:
G x x 2 = ( u s , t u s 1 , t ) ( u s 1 , t u s 2 , t ) = u s , t 2 u s 1 , t + u s 2 , t
G y y 2 = ( u s , t u s , t 1 ) ( u s , t 1 u s , t 2 ) = u s , t 2 u s , t 1 + u s , t 2
The gradient vector points in the direction of the maximum rate of change of u in coordinates ( x , y ) . Moreover, a circle is presented by a polar coordinate:
a = x r c o s θ b = y r s i n θ
Hence, the non-zero gradient vector in the gradient field points to the center of the quasi-circle, and the transformation is defined by using this feature to transform the gradient field into an accumulation array. The gradient intensity value of each pixel in the image edge determines the probability of the center of the circle. In the improved Hough transform, the ( a , b , r ) three-dimensional accumulator of traditional Hough transform is divided into the two-dimensional of ( a , r ) and ( b , r ) . Then, we traverse and determine the gradient information of each pixel ( a , b ) . For a wood image with 2000 × 1330 size, the traditional Hough transform almost cannot calculate the center position of annual rings on a computer with 4 GB memory. The improved Hough transform can reduce invalid calculations and reduce the memory consumption by using second-order gradient information. The improved Hough transform takes only 138 seconds to locate the center of annual rings.

3.2. Total Variation Algorithms

The images of wood always have image noise due to wormholes or coarse surface. So the wood image need to remove the noise to find the center of the wood. In 1992, Rudin et al. proposed the TV algorithm to remove the image noise, which is widely used in image denoising and image restoration [19]. After that, the TV algorithm is also widely used in the field of CT images reconstruction. In 2018, Wu et al. proposed using an 0 image gradient and tensor dictionary in low-dose spectral CT reconstruction [20]. This algorithm is substantially anisotropic diffusion, which can make it possible to retain image edges with the same effect of denoising. The TV denoising model can be expressed as:
u 0 = u + n
u 0 ( s , t ) = u ( s , t ) + n ( s , t )
where the u 0 is the image with noise, the n is the image without noise, and the σ 2 is variance. Therefore, the discrete form can be shown as (10),with the size ( s × t ) of image. The characteristic of random noise is:
E n ( s , t ) = 0 E n 2 ( s , t ) = σ 2
Hence, the image denoising based on the TV algorithm can be expressed as a minimization problem:
| | u | | T V = Σ s , t | u s , t | = Σ s , t ( u s , t u s 1 , t ) 2 + ( u s , t u s , t 1 ) 2
To reduce the range of feasible solutions, the characteristic of noise is constrained to the feasible solution of the objective function:
Σ s , t u s , t = Σ s , t u 0 s , t 1 s × t Σ s , t ( u s , t u 0 s , t ) 2 = σ 2
where the u 0 s , t is the discrete form of an image with noise. To minimize (10),
m i n { λ 2 Σ s , t ( u s , t u 0 s , t ) 2 + Σ s , t ( u s , t u s 1 , t ) 2 + ( u s , t u s , t 1 ) 2 }
In this equation, the first item λ 2 Σ s , t ( u s , t u 0 s , t ) 2 is the data fidelity; it is used to maintain the original image characteristic and reduce the image distortion. The second item Σ s , t ( u s , t u s 1 , t ) 2 + ( u s , t u s , t 1 ) 2 is a regularization item. The λ has to do with noise levels, and it plays a vital role in balancing denoising and maintaining characteristic of the original image. Hence the Euler–Lagrange equation can be expressed as:
( u | u | ) + λ ( u u 0 ) = 0
From (16), the 1 | u | is the diffusion coefficient. At the edge of annual rings from the wood image, if the u is bigger, the diffusion along the edge is weaker, so the edge can be kept. In this paper, the TV algorithm is used to remove noise. Equation (16) can be solved by gradient descent and finite difference method. The discrete iterative scheme for solving (17) is as shown below.
u s , t n + 1 = u s , t n Δ t λ ( u s , t n u 0 s , t ) + Δ t ( ( u s , t n | u s , t n | ) )
In this equation, n is the number of iterations, Δ t is the step of each iteration, λ is the parameter to balance the regularization and data fidelity. As the number of iterations increases, u 0 s , t gradually converges to the solution of the Equation (16).
The effect of denoising by TV algorithm, Gaussian filtering and mean filtering are shown in Figure 5. From the red areas of Figure 5, it can be known that the TV algorithm can keep more annual rings information while removing noise.

4. Results

Wood images were set to two groups through indoor and outdoor photography conditions to confirm effectiveness of the proposal. The wood images were taken by a Nikon D3200 camera with uncompressed form. Figure 6 shows indoor (Figure 6a) and outdoor (Figure 6b) photography conditions. For wood images of the indoor condition, the features of wood can be obtained according to the real wood measured by an expert (Figure 7a). For wood images of the outdoor condition, the features of wood can be obtained according to the images measured by an expert (Figure 7b). The wood images of indoor condition are divided into three classes, which are the image of processed logs (Figure 8a), the images of unprocessed low-noise logs (Figure 8b) and the images of unprocessed high-noise logs (Figure 8c). Wood images of outdoor condition are divided into two classes which are the image of the images of unprocessed low-noise logs (Figure 9a) and the images of unprocessed high-noise logs (Figure 9b). In this paper, low noise is defined such that the edges of annual rings in the wood images can be observed by human eyes, although there are some small wormholes and so on; high noise is defined that some edges of annual rings in the wood images have been lost due to mud and other reasons, which make it difficult to extract edges of annual rings.
The expert marked features of wood, which are considered as the ground truth. Features of wood that are extracted from the proposal of this paper can be evaluated by comparing with the ground truth. The similarity between the proposal and the ground truth is computed by using RMSE (18) and RMSE’s ratio (19)
R M S E = 1 n Σ i = 1 n ( y i y i ) 2
r a t i o = R M S E / D
where n is the number of the images, y i is the ground truth and y i is the features of wood from the proposal of this paper. D is the ground truth of the average width of 15th annual rings from the center or the outside. In log survey or market of Japan, the error range cannot exceed 2 [cm]. That is, the ratio of RMSE should be less than 10%. Suppose that the annual ring is 50; the RMSE should be less than 0.04. In this case, the ratio of RMSE is less than 10%.

4.1. Time Comparison between the Ground Truth and the Proposal

Whether indoor or outdoor condition, it takes 2 h for the ground truth to be obtained by an expert. However, the features of wood that are extracted from the proposal of this paper only need 4 min. Therefore, the proposal not only saves time but also reduces human errors.

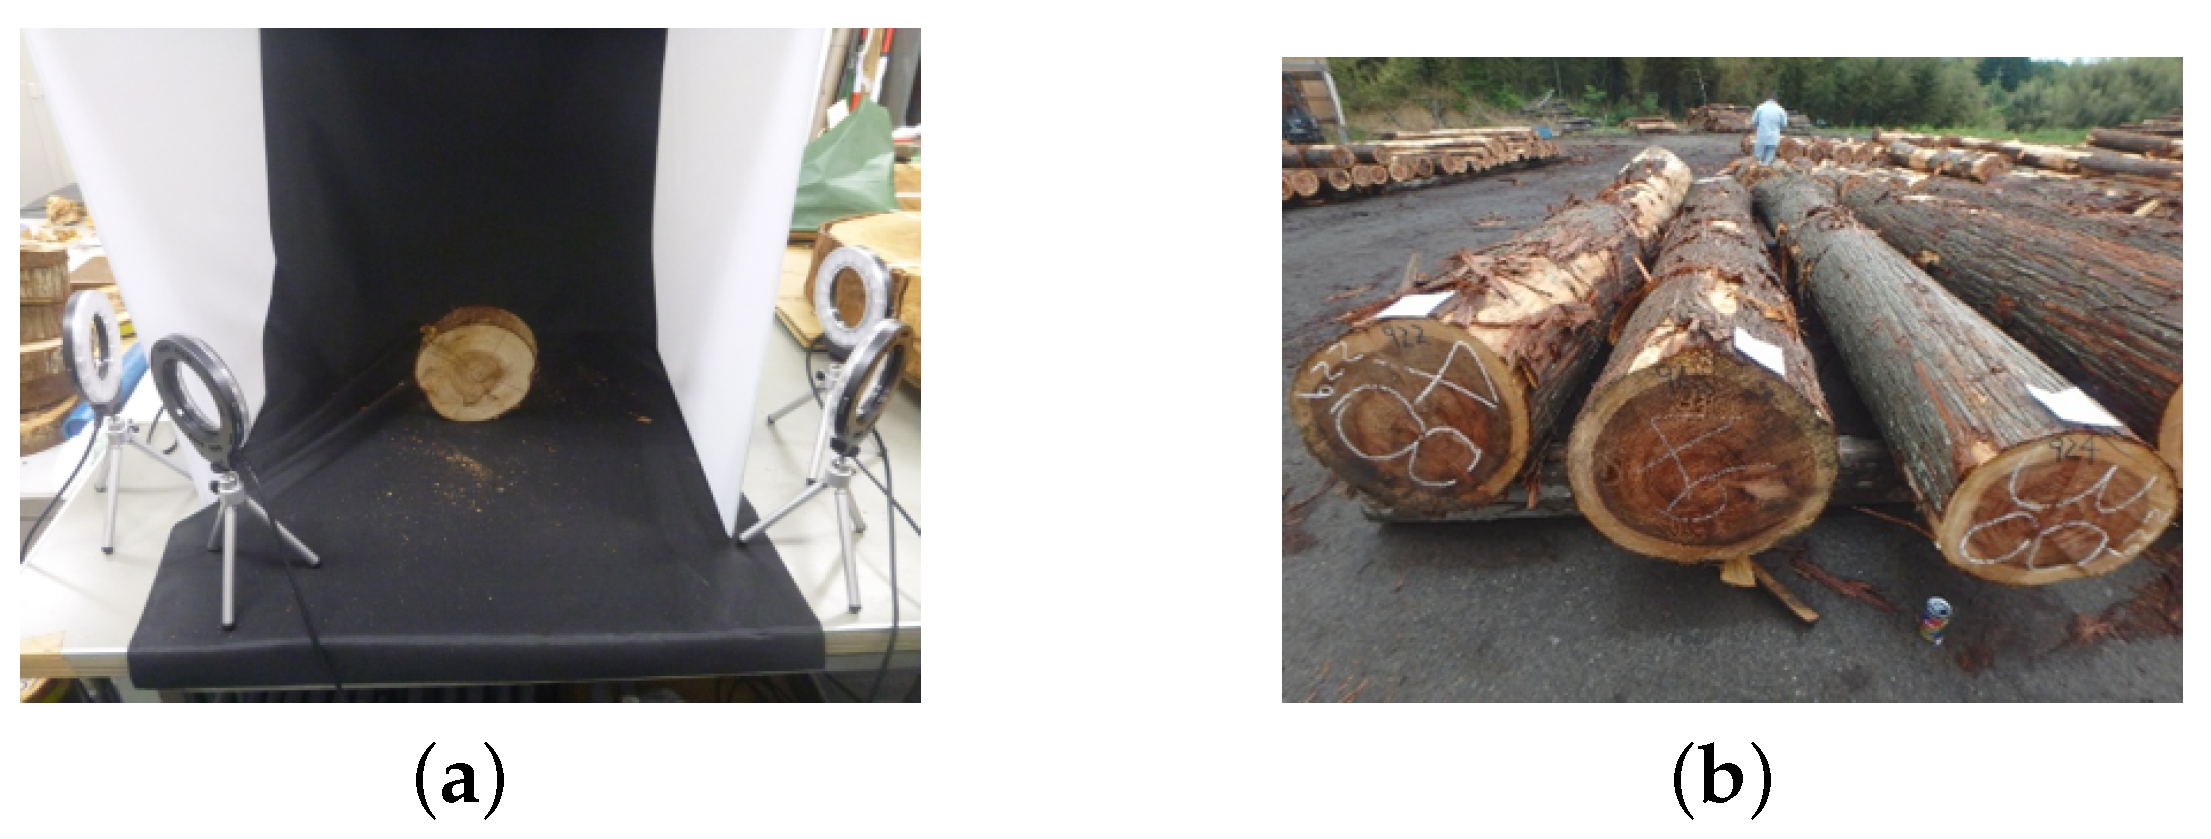
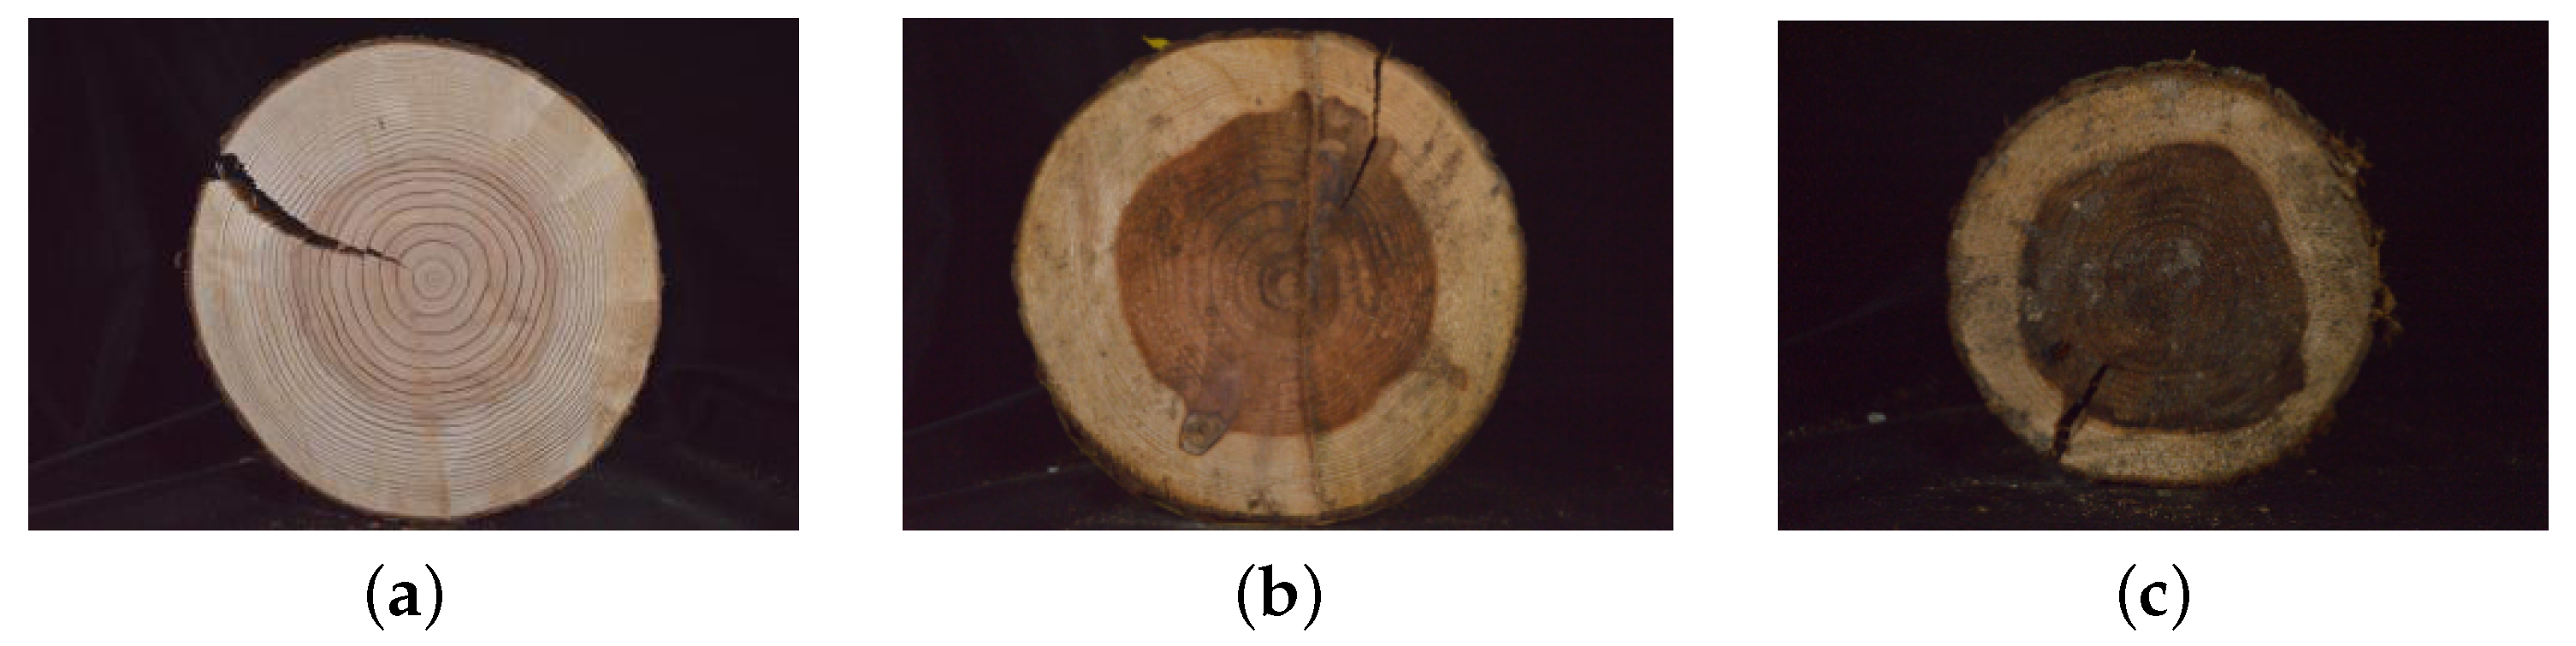
4.2. Features of Indoor Wood Images

Table 1 is the results of features extraction from the indoor wood images shown as Figure 8. Some abbreviations in Table 1 need be explained. “pro”means the processed log. “GT” means ground truth. “PNTV” means the proposal without the TV algorithm. “NR” means the number of annual rings. “AR” means the average width of rings. “AC15” means the average width of 15th from the center. “AO15” means the average width of 15th from the outside. “unpro.Low” means the unprocessed low-noise log. “unpro.High” means the unprocessed high-noise log. “N” means the number of the wood images.
In Table 1a, suppose that n is 1 in Equation (19). “NR” of the proposal is the same as the ground truth. RMSEs of “AR”, “AC15” and “AO15” in the proposal are 0.0154, 0.0288 and 0.0153. These are all less than 0.04. However, RMSEs of “AR” and “AC15” in the “PNTV” are 0.0722 and 0.0762, which are greater than 0.04. Only RMSE of “AO15” in the “PNTV” is 0.0164, which is less than 0.04 but more than 0.0153. Therefore, it can be considered that the proposal extracts the features, and the TV algorithm removes noises from the indoor wood image of the processed log effectively. In Table 1b, “NR” of the proposal is almost the same as the ground truth. RMSEs of “AR”, and “AO15” in the proposal are 0.0057 and 0.0373, which are less than 0.04. However, RMSE of “AC15” in the proposal is 0.0556 and greater than 0.04. RMSE of “AC15” in the “PNTV” is 0.0177 and less than 0.04. RMSE of “AR” and “AO15” in the “PNTV” are 0.0749 and 0.0468, which are greater than 0.04. In Table 1c, “NR” of the proposal and the “PNTV” have a big difference with the ground truth. Only RMSE of “AO15” in the “PNTV” is 0.0183 and less than 0.04. Whether the proposal or the “PNTV”, their RMSEs of “AR” and “AC15” are greater than 0.04. Therefore, it is difficult to say that the proposal is effective and that the TV algorithm can remove the noise from the indoor wood images on the unprocessed low-noise and high-noise logs.
The indoor wood images of the unprocessed low-noise and high-noise logs have been increased to 37 for finding variation by using the Equations (18) and (19). This makes it easy to confirm the effectiveness of the proposal. In Table 2, RMSEs of “AC15” and “AO15” in the proposal on “upro.Low” are less than 0.04. Their ratios are less than 10%. However, RMSEs of “AC15” and “AO15” in the “PNTV’ on “upro.Low” are greater than 0.04. Their radios are greater than 10%. Therefore, for most of the indoor wood images of the unprocessed low-noise logs, the proposal can extract the features and the TV algorithm can remove noises effectively. The proposal cannot extract the features, and the TV algorithm also cannot remove noises from the indoor wood image of the unprocessed high-noise logs very well, because whether the proposal or the “PNTV”, their RMSEs are greater than 0.04 and radios are greater than 10%.

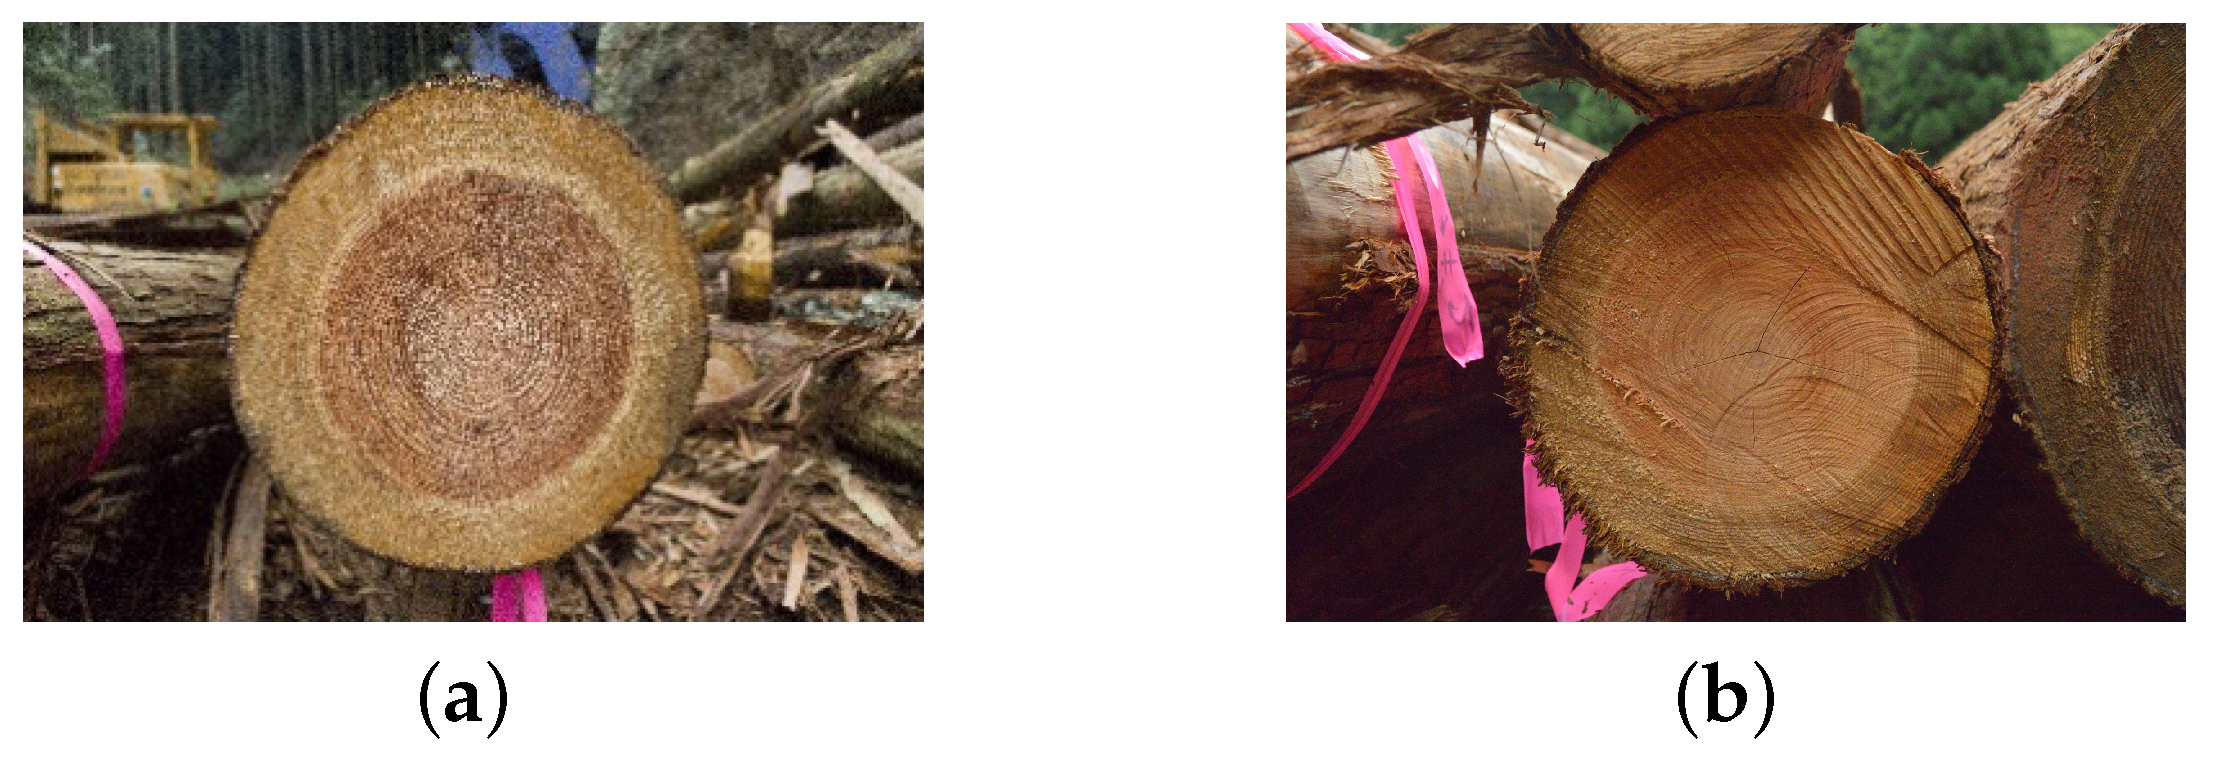
4.3. The Result of Outdoor Images

Table 3 is the results of features extraction from the outdoor wood image shown on Figure 9. In Table 3a, suppose that n is 1 in Equation (18). “NR” of the proposal is almost the same as the ground truth. RMSEs of “AR”, “AC15” and “AO15” in the proposal are 0.0164, 0.0343, and 0.0178. They are less than 0.04. However, RMSEs of “AR” and “AC15” in the “PNTV” are 0.1373 and 0.082, which are greater than 0.04. Only RMSE of “AO15” in the “PNTV” is 0.02 and less than 0.04. Therefore, the proposal might extract the features, and the TV algorithm might remove noises from the outdoor wood image of the processed log effectively. In Table 3b, “NR” of the proposal and the “PNTV” have a big difference with the ground truth. Only RMSE of “AR” in the proposal is 0.0377 and less than 0.04. Whether the proposal or the “PNTV”, their RMSEs of “AC15” and “AO15” are greater than 0.04. Therefore, the proposal cannot extract the features, and the TV algorithm also cannot remove noise from the outdoor wood image of the unprocessed high-noise logs very well.
The outdoor images of the unprocessed low-noise and high-noise logs have been increased to 19 to confirm the practicality of the proposal by using Equations (18) and (19). In Table 4, whether the proposal or the “PNTV”, their RMSEs are greater than 0.04 and ratios are greater than 10%, even if RMSE of the proposal is very close to 0.04 in the “unpro.Low”. Notice that the ratio of the proposal is less than the ratio of the “PNTV”, although RMSEs of “AO15” is greater than RMSE of “AC15” in the proposal. This is because the average width of the 15th annual ring from the center is larger than the average width of 15th annual ring from the outside. Therefore, the proposal cannot extract the features, and the TV algorithm also cannot remove noises from the outdoor wood image of the unprocessed low-noise and high-noise logs very well.

5. Discussion

Some outdoor wood images of the unprocessed low-noise logs cannot extract features of wood images by using the proposal very well because the outdoor wood images have some background. The background might affect TV algorithm for removing the noise. Whether indoor or outdoor wood images of the unprocessed low-noise and high-noise logs, the low-noise and high-noise images are classified by human eyes. Therefore, some human errors cause that some outdoor wood images of the unprocessed low-noise logs cannot extract features of wood images by using the proposal very well. The performance might be improved on the wood image of the unprocessed low-noise log if the low-noise and high-noise wood images can be correctly classified.
To the indoor or outdoor wood images of the unprocessed high-noise logs, some features of the wood images have been lost because of high noise, which includes big wormholes, broken cuts and so on. Therefore, this is a key to make up for missing features of the wood images by using some methods such as deep learning, computer vision or image processing. Furthermore, when calculating AR, AC15 and AO15, the each of ring widths is not calculated, but the total width of annual rings is divided by number of annual rings, so the thickness of each annual rings is not deliberately considered. Future studies will explore whether the consideration of thickness of annual ring can bring better results.

6. Conclusions

This paper has designed a new model that combines the improved Hough transform and the TV algorithm to extract features of the wood images automatically. The TV algorithm of the proposal can remove noise from the indoor wood images of the unprocessed low-noise logs. Compared with the transitional Hough transform, the improved Hough transform can reduce the calculation to find the center of annual rings in the wood images. The new model can use only 4 min to extract the features of the wood images. Therefore, the new model can save time effectively.
The new model can save time and extract features of wood by using the improved Hough transform and the TV algorithm effectively on the indoor wood images of processed logs and the unprocessed low-noise logs. Therefore, it will facilitate the development of automation of the wood supply system.

Author Contributions

Conceptualization, W.D. and Y.X.; methodology, W.D. and Y.X.; software, Y.X. and Y.Z.; validation, K.H., W.D., K.N. and Z.Q.; formal analysis, W.D. and K.N.; investigation, Y.X.; resources, K.H. and K.N.; data curation, Y.X.; writing—original draft preparation, Y.X.; writing—review and editing, W.D. and Y.Z.; visualization, Y.X. and Y.Z.; supervision, W.D.; project administration, W.D. and K.N. All authors have read and agreed to the published version of the manuscript.

Funding

This study is funded by JAPAN SOCIETY FOR THE PROMOTION OF SCIENCE KAKENHI of grant number 19K06321.

Institutional Review Board Statement

Not applicable.

Informed Consent Statement

Not applicable.

Data Availability Statement

The data used in the reserach are avaliable at https://github.com/hellzym/Feature-extraction-of-annual-rings.git (accessed on 10 April 2021).

Acknowledgments

W.D. gratefully acknowledge the support of Kyoto Institute of Technology.

Conflicts of Interest

The authors declare no conflict of interest.

Abbreviations

The following abbreviations are used in this manuscript:
TVTotal Variation
RMSERoot Mean Squared Error

References

  1. Forestry Agency of Japan. Annual Report on Forest and Forestry in Japan; Japan Forestry Association: Tokyo, Japen, 2018. [Google Scholar]
  2. Kishi, K.; Kojiro, K.; Akashi, H.; Adachi, W.; Fuchigami, Y.; Tabuchi, A.; Furuta, Y. Prediction of strength grades of lumbers by evaluating those of logs: Development of the simple and convenient prediction method as a case study of logs from areas in Kyoto prefecture. Wood Ind. 2019, 74, 140–145. [Google Scholar]
  3. Funck, J.W.; Zhong, Y.; Butler, D.A.; Brunner, C.C.; Forrer, J.B. Image segmentation algorithms applied to wood defect detection. Comput. Electron. Agric. 2003, 41, 157–179. [Google Scholar] [CrossRef]
  4. Mu, H.B.; Northeast Forestry University, Harbin, China. Personal communication, 2010.
  5. Gu, Y.H.; Andersson, H.; Vicen, R. Wood defect classification based on image analysis and support vector machines. Wood Sci. Technol. 2010, 44, 693–704. [Google Scholar] [CrossRef]
  6. Sioma, A. Assessment of wood surface defects based on 3D image analysis. Wood Res. 2015, 60, 339–350. [Google Scholar]
  7. Bai, X.B.; Guo, J.Q.; Chen, K.; Li, H.; Xu, J.T. Application study of GVF snake model in wood surface defects segmentation. J. Cent. Univ. For. Technol. 2015, 2, 90–95. [Google Scholar]
  8. Niu, L.; Sui, Z.z.; Zhang, C. Wood texture image processing based on FitzHugh-Nagumo reaction-diffusion equations. Nat. Sci. J. Harbin Norm. Univ. 2015, 31, 45–49. [Google Scholar]
  9. Fahrurozi, A.; Madenda, S.; Ernastuti, E.; Kerami, D. Wood texture features extraction by using GLCM combined with various edge detection methods. J. Phys. Conf. Ser. 2016, 725, 012005. [Google Scholar] [CrossRef] [Green Version]
  10. Xu, C.; Zhejiang Agricultur and Forestry University, Hangzhou, China. Personal communication, 2017.
  11. Xu, J.; Northeast Forestry University, Harbin, China. Personal communication, 2017.
  12. Zhang, Y.; Nanjing Forestry University, Nanjing, China. Personal communication, 2017.
  13. Chen, L.; Ge, Z.; Luo, R.; Liu, C.; Liu, X.; Zhou, Y. Identification of CT image defects in wood based on convolution neural network. Sci. Silvae Sin. 2018, 54, 127–133. [Google Scholar]
  14. Cheng, Y.; Li, Z.; Sun, Y. Detection algorithm of wood rings image baesd on texture feature. For. Eng. 2018, 34, 46–49. [Google Scholar]
  15. Ning, X.; Zhao, P. Segmentation algorithm of annual ring image based on U-Net convolution network. Chin. J. Ecol. 2019, 38, 1580–1588. [Google Scholar]
  16. Beck, A.; Teboulle, M. Fast gradient-based algorithms for constrained total variation image denoising and deblurring problems. IEEE Trans. Image Process. 2009, 18, 2419–2434. [Google Scholar] [CrossRef] [PubMed] [Green Version]
  17. Chan, T.; Marquina, A.; Mulet, P. High-order total variation-based image restoration. Siam J. Sci. Comput. 2001, 22, 503–516. [Google Scholar] [CrossRef]
  18. Ghofrani, S.; Markarian, H. Using high order total variation for denoising speckle, Gaussian, salt & pepper. Int. Conf. Micro-Electron. Telecommun. Eng. 2016, 282–286. [Google Scholar] [CrossRef]
  19. Rudin, L.I.; Osher, S.; Fatemi, E. Nonlinear total variation based noise removal algorithms. Phys. D Nonlinear Phenom. 1992, 60, 259–268. [Google Scholar] [CrossRef]
  20. Wu, W.; Zhang, Y.; Wang, Q.; Liu, F.; Chen, P.; Yu, H. Low-dose spectral CT reconstruction using 0 image gradient and tensor dictionary. Math. Model. 2018, 63, 538–557. [Google Scholar] [CrossRef] [PubMed]
Figure 1. The process of features extraction of wood.
Forests 12 00466 g001
Figure 2. Finding the center of annual rings.
Forests 12 00466 g002
Figure 3. Edges information of a wood image with the center points ( x 0 , y 0 ) and the points of the largest circle ( x n , y n ) .
Forests 12 00466 g003
Figure 4. Annual rings features.
Forests 12 00466 g004
Figure 5. The effect of denoising by different methods. (a) Denoising by TV algorithm. (b) Denoising by Gaussian filtering. (c) Denoisng by mean filtering.
Forests 12 00466 g005
Figure 6. The environment for acquiring images. (a) The indoor environment for acquiring images. (b) The outdoor environment for acquiring images.
Forests 12 00466 g006
Figure 7. The features of wood were obtained by an expert. (a) The features of wood were obtained by an expert in indoor environment. (b) The features of wood were obtained by an expert in outdoor environment.
Forests 12 00466 g007
Figure 8. The indoor wood images. (a) An image of a processed log. (b) An image of an unprocessed low-noise log. (c) An image of an unprocessed high-noise log.
Forests 12 00466 g008
Figure 9. The outdoor wood images. (a) An image of an unprocessed low-noise log. (b) An image of an unprocessed high-noise log.
Forests 12 00466 g009
Table 1. Features of indoor wood images.
(a) Features of the indoor wood image on a processed log (Figure 8a)
pro.NRAR [cm]AC15 [cm]AO15 [cm]
GT330.31440.48420.1367
Proposal330.32980.51300.1520
PNTV420.24220.40800.1203
(b) Features of the indoor wood image on an unprocessed low-noise log (Figure 8b)
pro.NRAR [cm]AC15 [cm]AO15 [cm]
GT330.32980.51300.1520
Proposal420.24220.40800.1203
PNTV420.24220.40800.1203
(c) Features of the indoor wood image on an unprocessed high-noise log (Figure 8c)
pro.NRAR [cm]AC15 [cm]AO15 [cm]
GT350.26190.40780.1500
Proposal340.25620.46340.1873
PNTV510.18700.39010.1032
Table 2. The results of indoor wood images.
Indoorunpro.Lowunpro.High
N2116
AC15AO15AC15AO15
ProposalRMSE0.03500.03920.06270.0667
Ratio8.04%9.83%16.08%45.83%
PNTVRMSE0.04930.07300.13150.847
Ratio13.81%51.29%37.19%71.92%
Table 3. Features of outdoor wood images.
(a) Features of the outdoor wood image on the unprocessed low-noise log of Figure 9a
pro.NRAR [cm]AC15 [cm]AO15 [cm]
GT560.26730.43300.1330
Proposal540.28370.39870.1508
PNTV750.13000.35100.1130
(b) Features of the outdoor wood image on the unprocessed high-noise log of Figure 9b
pro.NRAR [cm]AC15 [cm]AO15 [cm]
GT540.23700.42000.1870
Proposal400.27470.30140.1082
PNTV660.11800.30100.1063
Table 4. The results of outdoor wood images.
Outdoorunpro.Lowunpro.High
N910
AC15AO15AC15AO15
ProposalRMSE0.05150.04240.13680.0432
Ratio15.95%22.28%44.46%20.25%
PNTVRMSE0.12300.08760.17630.0658
Ratio28.37%59.02%55.62%75.23%
Publisher’s Note: MDPI stays neutral with regard to jurisdictional claims in published maps and institutional affiliations.

