Abstract
This study aimed to evaluate and compare the relationship between chemical properties, energy efficiency, and emissions of wood and pellets from madroño Arbutus xalapensis Kunth, tázcate Juniperus deppeana Steud, and encino colorado Quercus sideroxyla Humb. & Bonpl. in two gasifiers (top-lit-up-draft (T-LUD) and electricity generation wood camp stove (EGWCS)) in order to determine the reduction of footprint carbon. In accordance with conventional methodologies, we determined the extracts and chemical components (lignin, cellulose, holocellulose), and the immediate analyses were carried out (volatile materials, fixed carbon, ash content and microanalysis of said ash), as well as the evaluation of emission factors (total suspended particulate matter (PM2.5), CO, CO2, CH4, black carbon (BC), elemental carbon (EC), and organic carbon (OC)). The results were statistically analyzed to compare each variable among species and gasifiers. The raw material analyzed showed how the pH ranged from 5.01 to 5.57, and the ash content ranged between 0.39 and 0.53%. The content values of Cu, Zn, Fe, Mg, and Ca ranged from 0.08 to 0.22, 0.18 to 0.19, 0.38 to 0.84, 1.75 to 1.90, and 3.62 to 3.74 mg kg−1, respectively. The extractive ranges from cyclohexane were 2.48–4.79%, acetone 2.42–4.08%, methanol 3.17–7.99%, and hot water 2.12–4.83%. The range of lignin was 18.08–28.60%. The cellulose content ranged from 43.30 to 53.90%, and holocellulose from 53.50 to 64.02%. The volatile material range was 81.2–87.42%, while fixed carbon was 11.30–17.48%; the higher heating value (HHV) of raw material and pellets presented the ranges 17.68–20.21 and 19.72–21.81 MJ kg−1, respectively. Thermal efficiency showed statistically significant differences (p < 0.05) between pellets and gasifiers, with an average of 31% Tier 3 in ISO (International Organization for Standardization) for the T-LUD and 14% (ISO Tier 1) for EGWCS, with Arbutus xalapensis being the species with the highest energy yield. The use of improved combustion devices, as well as that of selected raw material species, can reduce the impact of global warming by up to 33% on a cooking task compared to the three-stone burner.
1. Introduction
Fossil fuels are the main source of primary energy worldwide. The strong global dependence on this energy source generates high greenhouse gas (GHG) emissions and, accordingly, has adverse effects on the environment and humans [1]. The excessive use of fossil fuels has been related to environmental problems such as climate change, high levels of suspended particles, and environmental pollution [2,3].
Nowadays, renewable energy sources provide about 10% of the final energy demand worldwide, of which bioenergy is the main source with an offer of 55.6 exajoules (EJ) per year, or 47% of total renewable energy [4]. Moreover, the scarcity of fossil fuels, the concern for their depletion, and the energy dependence of countries with scarce conventional energy resources make the development of renewable energies sources such as biomass necessary [5]. The energy produced from wood biomass is as important as all other renewable energy sources together (hydroelectric, geothermal, waste, biogas, solar and liquid biofuels) [6]. In addition to this, the production of wood pellets was driven by European policies starting in 2013, growing to 23.6 million tons, and it is expected that by 2025 the world demand for pellets will increase to 54 million tons [7,8]. Therefore, biomass is considered a viable option in the short, medium, and long term [9]. On another side, in most of the forest areas of Mexico and particularly in the state of Durango, containing forests with a cold temperate climate, there are little-used species such as Arbutus xalapensis, Juniperus deppeana, and Quercus sideroxyla that due to their growth behavior, harvesting methods favoring conifers species, or low level of knowledge regarding their characteristics are not used properly, and thus increasing the research to determine their properties would potentially expand the solid biofuels production, increasing the economic gains and reducing the pressure on the pine forests exploitation.
On the other hand, biofuels are considered an ecological alternative, and through looking between species and through advanced forest management, one finds that the carbon sequestration rate could potentially be six times better due to its low GHG emissions, with it also promoting the development of rural communities and contributing to the bioeconomy through income generation [10,11,12]. Forest residues are an important source of biomass that are currently underused in many countries. It is estimated that of each tree harvested for timber production, only 20% is used commercially, 40% is left in the forest as waste, and the remaining 40% becomes by-products of the process of splintering, bark, and sawdust [13]. These wastes can be used in energy production. However, given their low density, high moisture content, and heterogeneity, they require pre-treatments to improve energy parameters. In the same way, the impact of climate change, the need to reduce GHG emissions, and the energy generation required to satisfy elementary tasks have increased the demand and use of clean energy [5].
The instability of the market, coupled with new environmental energy policies, are making biomass an essential element of energy policies in both developed and developing countries [14,15].
According to the World Health Organization [16], around 3 billion people cook and heat their homes with solid biofuels [17]. In Mexico, approximately 22.5 million people (80% of the rural population) depend on wood for cooking, heating, and other domestic tasks [18]. However, the biomass combustion produces particulate matter (PM), the main source of air pollution [19], as well as short-lived climate pollutants such as black carbon (BC) and methane (CH4) [20]. To reduce the GHG into the environment during biomass combustion, micro-gasifiers modify the primary and the secondary airflow so that the combustion is cleaner [21]. Some alternatives to reducing emissions of conventional solid biofuels as such as fuelwood is to use wood-based pellets and briquettes on more efficient end-use devices [1]. They maximize energy performance and allow for the use of biomass waste as fuels.
The demand for wood pellets has markedly increased in the last 10 years; such estimates indicate that the maximum demand for technically available wood pellets could reach up to 150 million tons in 2020 [22]. Worldwide, there is very little information on the combustion and emissions associated with the burning of pellets, and thus it is extremely important to know their use in technologies that minimize the release of pollutants into the environment.
The energy use of wood pellets is neutral in emissions, and therefore it can be guaranteed that they are kept to a minimum, since they are the only form of energy that guarantees a sustainable supply because they produce CO2 equivalent to the amount retained in the fabric of the plants. Thus, they are considered less polluting compared to fossil fuels [23].
Rojas [24] mentions that burning pellets is one of the best options to reduce CO2 emissions by up to 50% compared to other energy sources such as firewood and chips. Therefore, the use of pellets might be an option to reduce the concentrations of CO2, Sulfur oxides (SOx), and Nitrogen oxides (NOx) that cause the “greenhouse effect” and climate change [25]. It should be noted that the use of pellets could help to meet the goals of reducing greenhouse gas emissions that Mexico has committed to reducing by 22% by 2030 according to the Paris agreement signed in 2015 [26].
The main objective of this research was to evaluate and compare the relationship between chemical properties, energy efficiency, and emissions of wood and pellets from three forest species in two types of gasifiers.
2. Materials and Methods
2.1. Selection and Collection of the Woody Species
Arbutus xalapensis Kunth, Juniperus deppeana Steud, and Quercus sideroxyla were selected because of their low industrial use on the approximately 1,567,440 ha of temperate forest in Durango, Mexico [27]; in addition, although they are species adapted to the climatic and edaphic conditions of the region, there is little knowledge of their chemical and energetic properties. From each species, five 1.20 m long logs were collected from the main stem. The species were identified and selected during forest harvesting activities in the Chavarría Nuevo forest community located between Universal Transverse Mercator (UTM) coordinates 443657 and 2625546, within the municipality of Pueblo Nuevo, Durango, Mexico.
Sawdust and Pellets Production
One Section 5 cm thick of the upper part of each log was cut and chipped with a circular saw, chisel, and hammer. The chips were dried on laboratory conditions and ground in a micron mill MK-20, according to the standard T 257 om-85 [28]; finally, sawdust was sieved with Mont inox sieves and was kept in hermetic bag to avoid moisture absorption. The remaining section of each log was cut into 2 pieces, 1 of them was debarked, and both were chipped and milled; then, 10 kg of sawdust pellets of each species with bark (WB) and without bark (D) were produced through an industrial flat disk machine Small Hammer Mill (TFS) 420 hammer mill manufactured in China with a 3.15-mm screen, with a capacity of 350 kg h−1.
2.2. Chemical and Energetic Properties of Pellets and the Raw Material Used for Their Production
2.2.1. Chemical Characterization of the Raw Material
The pH was taken using an immersion electrode potentiometer from Thermo Fisher Scientific, manufactured in Waltham, MA, USA in 2 g of flour sample of each of the species with and without rind; adding 20 mL of distilled water, the readings were taken at the beginning then at 5 minutes; at 4, 24, and 48 h; and then an average—this was done using the methodology of Sandermann and Rothkamm [29]. Six grams of 40 mesh-sieved sawdust was used to determine the percentage of extracts with the Soxhlet equipment using solvents of increasing polarity, that is, cyclohexane, acetone, methanol, and hot water at reflux for 6 h for each solvent. The solvents were distilled under vacuum on a rotary evaporator and the aqueous extracts were weighed [30]. One gram of extract-free sawdust was used for the analysis of lignin, holocellulose, and cellulose. The lignin content (%) was determined with the Runkel and Wike technique [31]. Holocellulose (%) was measured with the Wise method [32], adding sodium chlorite and acetic acid to the extracts of free wood dust. The cellulose content (%) was obtained following ASTM D 1103-60 [33], treating the dry base holocellulose powder with sodium hydroxide (17.5%) and then with acetic acid (10%). Three repetitions on all the analyzes were carried out.
2.2.2. Proximate Analysis and Sawdust Ash Microanalysis
The ash content (%) analysis was carried out using the gravimetric method by the UNE-EN 14775 standard [34]. The volatile material content was determined following the standard UNE-EN 15148 [35]. The percentage of fixed carbon was calculated according to ASTM D-1762-84 [36]. The microanalysis of the ash obtained was carried out with the help of an Atomic Absorption Spectrometer PinAAcle 900F manufactured by Perkin Elmer in Waltham, MA, USA. For all analyses, 1 g of 40 mesh sieved sawdust was used.
2.2.3. Higher Heating Value Analysis from Raw Material and Pellets
The higher heating value (HHV) of each type of pellet and the raw material (with and without bark) was calculated according to EN-14918 in a LECO AC600 isoperbolic calorimeter manufactured by LECCO Corporation in St. Joseph, USA. The calorific value of the calorimeter was calibrated using benzoic acid as a reference [23].
2.2.4. Pellet Energy Performance
The energy performance of the pellets obtained from the 3 forest species under study was tested in the gasifiers electricity generation wood camp stove (EGWCS) manufactured in New York, USA and top-lit-up-draft (T-LUD) manufactured in Painesville, OH, USA, while the WBT test (water boiling test) [37] was performed using 325 g of pellets per each species, plus 75 g submerged in isopropyl alcohol to serve as the initiator, with the total fuel used being in accordance with the load capacity of the gasifiers. Five replicate tests were performed for each gasifier/fuel combination. The parameters measured were the boiling time of the water, the power, and the thermal efficiency in a high power phase, according to ISO 19867-1 [38].
2.3. Evaluation of Emissions Generated by Pellet Combustion
Simultaneously to energy performance assessment, emissions concentrations were measured. The carbon monoxide (CO), carbon dioxide (CO2), and total suspended particulate matter (PM2.5) were continuously monitored using a Laboratory Emission Monitoring System (LEMS) modified from the Aprovecho Research Center (ARC). The concentration was measured in real time by an electrochemical cell for CO, a sensor that uses non-dispersive infrared (NDIR) for CO2, and a scattering photometer for PM2.5. The CO and CO2 sensors were calibrated using gas standard at 500 and 5000 ppm, respectively. Pure nitrogen was used to establish the zero point [39,40].
The PM2.5 mass was gravimetrically measured using filter-based sampling, which consists of a vacuum pump that draws a sample through a sample line and a critical orifice at a steady flow of 16.7 L/min [41]. The PM2.5 was collected on hydrophilic, binderless glass fiber filter paper (FPAE-102) positioned downstream of a cyclone particle separator (URG, 2.5 µm). Filters were equilibrated at 35 ± 5% relative humidity and 23 ± 2 °C before measuring pre- and post-weights on a microbalance (model EX225D, OHAUS, Parsippany, NJ, USA) [39,40].
A second gravimetric system was used for measuring elemental carbon (EC) and organic carbon (OC). Samples were collected on quartz fiber filters with a sample flow of 3 L/min. The particles collected during the test were analyzed for EC and OC concentration with a thermal-optical carbon analyzer (Total Inorganic Carbon analysis, CM150, UIC Inc., Joliet, IL, USA). The sample was oxidized in a furnace (CM5300) at a constant temperature (700 °C to quantify total carbon and 500 °C for OC). The CO2 produced in the furnace was carried to a coulometric titration unit (CM5017, UIC Inc., Joliet, IL, USA) to measure the concentration of EC and OC [42]. Black carbon (BC) was analyzed with an Optical Transmissometer (by the SootScan, model OT21, Ljubljana, Slovenia), which is a nondestructive method [39,43,44]. Organic matter (OM) was estimated by multiplying the organic carbon by a factor that accounts for oxygen, hydrogen, and some other atoms present in the organic material (OM = 1.9 × OC) [45,46].
The methane (CH4) and nonmethane hydrocarbons (NMHC) were analyzed using a Young Ling gas chromatograph model 6500 (GC YL6500, Anyangcheondong-ro, Korea) with a flame ionization detector (FID from YL6500 chromatograph, Anyangcheondong-ro, Korea) that works with dry air and nitrogen. An injection valve was used to sample 2 mL, using a split mode 1:20. Calibrations curves were built to determine the concentration of every gas using 3 different gases patterns: 15, 100, and 200 ppm for methane [39].
Total Global Warming Impact
To determine the total warming impact from the gasifier emissions, we applied the GWP for each pollutant to all the emissions, including particulate matters onto the same scale as carbon dioxide equivalent (CO2e) per kilogram of firewood. The GWP factors (Table 1) were obtained from Intergovernmental Panel on Climate Change (IPCC) over a 100-year time horizon [47,48]. A three-stone stove fed with Q. sideroxyla pellets was used as a control to compare it with the T-LUD and EGWCS gasifiers.

Table 1.
Global warming potential values for a 100-year time horizon.
2.4. Statistical Analysis
To analyze differences in the variables evaluated, we carried out an analysis of variance considering the species and the presence and absence of bark as factors. When significant statistical differences were found (p ≤ 0.05), multiple means comparison tests were performed using the Tukey method (p ≤ 0.05). Likewise, a multiple correlation analysis was performed by the “Pearson relationship” between the analytical methods, which was established using the coefficient of determination (R2) to compare regression lines from 2 types of aerosols using the method. Both analyses were carried out using the InfoStat statistical package. The relationship between the analytical methods was established using the coefficient of determination (R2) to compare regression lines from 2 types of aerosols [51].
3. Results
3.1. Characteriztics of Biomass Raw Material
3.1.1. pH
The pH values ranged between 5.01 and 5.57 (Table 2). The species with lower pH value was Q. sideroxyla without bark, and the higher value was J. deppeana without bark.
Table 2.
Average percentage of extracts and wood components of the species evaluated.
3.1.2. Ash Content and Microanalysis
The percentage of the ashes obtained from the analysis did not present significant statistical differences (p ≥ 0.05) among the three wood species (Table 2). Q. sideroxyla with bark presented the highest percentage of ash (0.53%), while the species that presented the lowest percentage was J. deppeana without bark (0.39%), which met the standards for making pellets. The Cu content was higher (p ≤ 0.05) in J. deppeana with bark (0.22 mg kg−1), whereas A. xalapensis showed the lowest value (0.08 mg kg−1). Range values of ash content varied from 0.39 to 0.53%. In this study, the content of zinc (Zn) was not significantly different (p > 0.05) among species. Q. sideroxyla with bark showed the highest Fe value (0.84 mg kg−1), while J. deppeana and Q. sideroxyla with bark were the species that showed the lowest Fe value (0.38 mg kg−1) without statistically significant differences (p > 0.05). The content of magnesium and calcium were the elements that were shown in the highest proportion (1.75–1.90 and 3.62–3.74 mg kg−1, respectively), showing no statistically significant differences in calcium content (Table 2).
3.1.3. Extractives Substances of the Raw Material
The highest solubility (7.99%) was shown with methanol. A. xalapensis (with bark and without bark) presented 7.99% and 10.64%, respectively, followed by J. deppeana without bark with 6.45% showing significant statistical differences (p ≤ 0.05) (Table 3). The hot water extracts of A. xalapensis (with bark) was 5.5%, while for cyclohexane the values for Q. sideroxyla with bark and J. deppeana without bark were 4.49% and 2.48%, respectively. Acetone presented values from 2.42 to 4.08% for J. deppeana with bark and A. xalapensis without bark, respectively.
Table 3.
Contents (%) of extracts and chemical components of three forest species from the State of Durango, Mexico.
3.1.4. Structural Composition of the Raw Material
The range of lignin content was 18.80–28.60%, where J. deppeana with bark presented the highest value (28.60%) and A. xalapensis without bark, the lowest value (18.80%) (Table 3). Q. sideroxyla with bark registered the highest percentage of cellulose (53.90%), while J. deppeana without bark presented the lowest value (43.30%). Regarding holocellulose, a percentage from 53.50% to 64.02% was registered, with Q. sideroxyla with bark presenting the highest percentage (64.02%), followed by A. xalapensis with bark (58.20%), whereas J. deppeana without bark showed the lowest value (53.50%).
3.1.5. Volatile Material
The volatile material values ranged from 82.12 to 87.42% for J. deppeana with bark and without bark, and from 87.32 and 87.34% for A. xalapensis. Q. sideroxyla presented values from 81.20 and 87.42% (Table 4). Statistical differences were observed (p < 0.05) between A. xalapensis, J. deppeana, and Q. sideroxyla without bark.
Table 4.
Higher heating value and immediate analysis of the three species studied.
3.1.6. Fixed Carbon
The raw material of Q. sideroxyla without bark and J. deppeana with bark had the highest values (18.28% and 17.48%, respectively), followed by Q. sideroxyla with bark (12.39%) and A. xalapensis without bark (12.28%) (Table 4). The lowest percentage of fixed carbon was obtained for A. xalapensis with bark and J. deppeana without bark, with 12.20% and 11.30%, respectively.
3.1.7. Higher Heating Values (HHV) of Raw Material and Pellets
The raw material of Juniperus deppeana without bark presented a high calorific value (20.21 MJ kg−1), exceeding the values of the other species studied and with significant statistical differences (p ≤ 0.05) (Table 4). The bark component was associated to the lowest HHV in all cases. The pellets of J. deppeana with bark and without bark had the highest HHV values (20.51 and 21.81 MJ kg−1, respectively); this could be the result of differences in the chemical compounds present in both the bark and wood. According to the results, bark component reduced HHV in the pellets of all species.
3.2. Pellets Energy Performance
Table 5 shows the results of the energy performance obtained in the evaluation of the three species of pellets from the water boiling tests in gasifiers. The performed Tukey test indicated that the values obtained for burning time, burning rate, power, and thermal efficiency between samples with bark and without bark and among species were statistically similar, except for Q. sideroxyla, with significantly different powers between samples without bark and with bark of 2.7 and 2.4 kW, respectively. It can be seen that for the energy performance tests that there were statistically significant differences (p ≤ 0.05) between the gasifiers except for the boiling time.
Table 5.
Average energy performance of different types of pellets according to the standard ISO test.
In the device–fuel combinations evaluated, we found that pellets from A. xalapensis, both with and without bark in the T-LUD gasifier, showed the highest thermal efficiency (31% and ISO Tier 3). The species that presented higher values was A. xalapensis with and without bark, with a burning rate of 11 g min−1, which was reflected in a greater amount of energy delivered to the task per unit time, and less time of boiling water (10 min).
3.3. Emissions Generated by the Combustion of Pellets
The mass of pollutant emitted from the energy released by the dry fuel quantity consumed in the gasification is shown in Table 6. The lowest CO2 values were obtained for J. deppeana with bark and without bark (63 g CO2 MJ−1) in the T-LUD gasifier, which shows a statistically significant difference (p < 0.05) concerning the EGWCS gasifier (Table 6). Emissions of CO for A. xalapensis with bark using EGWCS were significantly influenced by the bark, registering values of 1 973 mg CO MJ−1, while debarked A. xalapensis presented values lower than 1274 mg CO MJ−1. Only in the EC content did we find that there were no significant differences between species; however, there were between gasifiers (p ≤ 0.05).
Table 6.
Average emission factors per energy source.
Table 7 shows the emission factors per mass of fuel (kg) consumed in the combustion of gasifiers. On average, using A. xalapensis pellets with bark in the T-LUD gasifier produced a higher emission rate of 1290 g CO2 kg−1 released to the environment, followed by Q. sideroxyla without bark with 1262 g CO2 kg−1, while J. deppeana obtained the lowest emission rate, with and without bark, with values ranging from 1104 to 1140 g CO2 Kg−1. T-LUD gasifier showed a statistically significant difference (p ≤ 0.05) compared with the EGWCS gasifier. On the other hand, in comparison with the T-LUD gasifier, the EGWCS gasifier presented the highest values in terms of the emission rate. Arbutus xalapensis with and without bark presented the highest emission factor with values ranging from 1606 to 1629 g CO2 kg−1, followed by J. deppeana with bark (1588 g CO2 kg−1) and Q. sideroxyla without bark (1573 g CO2 kg−1), without showing significant differences (p > 0.05).
Table 7.
Average emission factors per mass of fuel consumed.
The organic carbon (OC) and particulate material (PM2.5) emitted were compared. The aim was to assess the performance of this lower cost method [43]. Organic carbon (OC) of dry fuel consumed showed a positive correlation with the amount of emitted particulate material (PM2.5) in both gasifiers (Figure 1). The best correlation (R2 = 0.93 and p < 0.05) was observed when using the T-LUD gasifier, while the use of the EGWCS gasifier presented a weaker positive relationship (R2 = 0.81 and p < 0.05). Regarding to total OC and PM2.5 emissions, we observed that the lower the formation of organic matter (organic carbon), the lower the emissions of PM2.5. The results in Figure 1 show a clearly low dispersion of the data points, indicating a high accuracy in the estimation of OC using PM2.5. Similar to previous studies, de la Sota et al. [43] showed a correlation between black carbon and elemental carbon (R2 = 0.84). On other hand, Thompson et al. [52] showed a significant correlation between composition (OM + EC) and PM2.5 (R2 = 0.94), and no correlation between composition EC/total carbon (TC) and PM2.5 emission factors (R2 = 0.07).
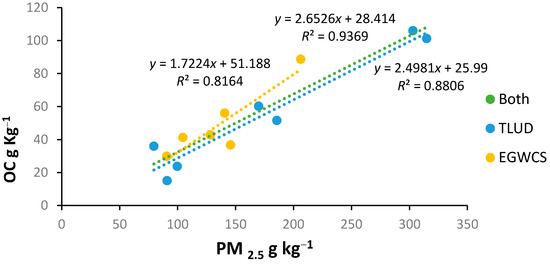
Figure 1.
Relationships between total suspended particulate matter (PM2.5) and organic carbon (OC) of each gasifier.
Impact on Global Warming
Figure 2 shows the impact on average global warming or radioactive forcing of pollutants from incomplete combustion. The emission of CO2e was higher for pellets produced from A. xalapensis (with bark and without bark) burned in the gasifier T-LUD, while J. deppeana with bark showed the lowest production of grams of CO2e. On the other hand, the EGWCS gasifier had the highest contribution of CO2e. Concerning the T-LUD gasifier, A. xalapensis with bark and without bark presented the highest emission, followed by Q. sideroxyla. J. deppeana with bark emitted 412.56 g CO2e kg−1, which showed the lowest contribution for this gasifier.
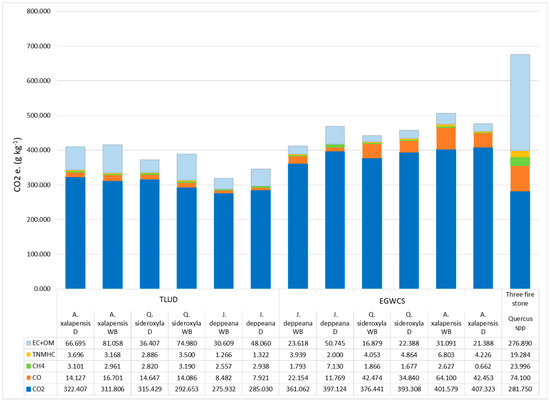
Figure 2.
Carbon dioxide equivalent (CO2e) (g kg−1) of dry pellets consumed (considering elemental carbon and organic matter).
4. Discussion
4.1. Chemical and Energetic Properties of Pellets and the Raw Material Used for Their Production
The pH is influenced by the amount and type of extractable substances from the wood, mainly by the presence of resinous acids; in this study, the material was considered slightly acidic, coinciding with that reported for species from temperate or Nordic climates [53,54]. According to López-Albarrán and Martínez-Sotres [55], the pH values are an indicator of water content in fibrils of lignocellulosic tissue; acid values indicate little water content, while slightly basic values (between 7 and 7.9) indicate high water content. According to this, it is feasible to relate the calorific power of the wood with its pH values, as shown by the results of this study, with J. deppeana without bark, being the species that presented the most acidic pH and the highest calorific value. In another way, during increasing combustion temperature, the pH increases, since some carboxyl group and the water molecules divide forming other chemical bonds changing the acidity of the wood up to incineration [56].
The results of this study show a low ash content, which makes this type of biomass a better raw material, since an optimal ash content is one that does not exceed 0.7%, and high ash values require constant cleaning of combustion equipment [57,58]. The results in this research show a higher ash content in wood with bark that can be attributed to the method of extraction from the raw material because trunks are dragged through the ground during harvest and some sand can be added, which is undesirable during pelletizing since it decreases compaction of the particles affecting the bonding among particles, constituting impurities on pellets that also increase the ash percentage during burning [59].
Saito et al. [60] mentioned that iron (Fe) acts as a smelting agent in contact with molten chlorides (responsible for corrosion in incinerators), which causes attrition on the equipment. The accumulation of Zn and Cu in biomass incineration might cause problems when recycling ashes for fertilization purposes, due to the formation of aerosols and particles, as well as corrosion due to the formation of chloride deposits in combustion equipment [61,62].
Juniperus deppeana (with bark) presented the highest value of calcium (Ca) content (3.74 mg kg−1), while for magnesium (Mg), Q. sideroxyla (with bark) showed the highest content (1.90 mg kg−1). The content of Ca, Mg, and Zn varies among species and parts of the tree; this explains the variation of the total content of the elements [63]. Some elements such as Ca and Mg in biofuels influence combustion residues since high Ca content increases the melting point of the ash, and in addition minimizes the amount of ash accumulated in the combustion equipment [57]. In this study, the contents of Ca and Mg were the highest proportion, which indicates that the wood of A. xalapensis, Q. sideroxyla, and J. deppeana is suitable for the production of pellets [64,65,66].
The content of extracts for A. xalapensis with bark and without bark is slightly higher than the values reported by Andrade et al. [67], who found values from 10.04 to 20.57% for Arbutus unedo L. In this study, slightly low values were obtained for J. deppeana, with bark and without bark, ranging from 12.15 to 17.37%, compared to those obtained by Orhan [68], who used Juniperus oxycedrus subsp. oxycedru, Juniperus communis subsp. nana, Juniperus sabina, Juniperus foetidissima, and Juniperus excels, with values from 16.3 to 22.2% using water as solvent. In the same study, methanol was used as solvent obtaining values ranging from 27.6 to 35.2%, slightly higher values compared with this study. As regards the extractions of Q. sideroxyla with bark and without bark, extraction values ranging from 13.9 to 15.74% were found using solvents of increasing polarity, being slightly higher than the reported by Bárcenas-Pazos et al. [69], who studied the species Quercus tinkhami and Quercus sebifera from Sierra de Álvarez in Mexico, obtaining extract contents with the mixture of ethanol-benzene and hot water, resulting in values ranging from 7.67 to 9.16% when using hot water, and from 4.50 to 6.13% when using the ethanol-benzene mixture. On the basis of the high variability of the results, we believe it is important to consider the report by Fonseca [70], who mentions that the amount and composition of the extractive depends on species, tree section, growth conditions, and method of extraction, since the metabolism of plants can vary to contain various compounds such as fats, waxes, phenols, and sugars. On the other hand, the content of extractables affects the physical and technological properties. In some species, they can increase dimensional stability and mechanical strength; moreover, they can reduce the saturation point of fiber and the equilibrium moisture content and affect other technological properties [71].
Honorato [72] reported percentages values from 51.94 to 56.43% for cellulose, and from 19.84 to 22.57% for lignin for Mexican Quercus woods. These results are comparable with the present study, in which values from 51.81 to 53.90% of cellulose and from 20.63 to 21.11% of lignin were obtained for Q. sideroxyla with and without bark, respectively.
The obtained cellulose and lignin values are similar to the reported by Bland [73,74] and Fernández [75]. The lignin contents of the species under study are within the Klason lignin interval published for Mexican pine woods (23.6%–31.2%) [76,77]. The lignin content of pine is similar to those of the species in this study, even if pine wood is more remunerated in other uses [78]. The biomass with bark showed the highest amount of cellulose. This could be due to the fact that tree bark shows a higher percentage of extracts that may contain higher amounts of phenolic compounds, which provide support and protection against microorganism attacks [79]. Pereira et al. [80] report that energy efficiency is related to the chemical composition of the wood, since this influences its performance and quality. On the other hand, Jara [81] points out that the chemical composition of wood is mainly influenced by lignin and extractables. This is in line with Cunha et al. [82], who state that the calorific value is higher the higher the percentage of lignin and extractables.
Villalvazo and Faix [83] carried out a study for Quercus candicans, Quercus laurina, Quercus obtusata, and Quercus resinosa, finding a variation in the main components of these woods that ranged from 53.9% to 56.3% for cellulose, from 18 to 21% for pentose, and from 15% to 22% for lignin. These results are similar to those obtained in this study for Q. sideroxyla, which obtained values for cellulose between 51.81% and 53.90%. The results regarding the holocellulose content (53.50–64.02%) were higher than the values reported for the Fagus species (34.40%) [84].
The thermal properties are directly influenced by the amount of volatile material, since a high content of this increases reactivity but in turn helps to convert to dust more quickly [85,86]. The volatile content determined in this study for pellets is consistent with the range mentioned by Ragland et al. [87], who indicated that, depending on the species, volatile materials can vary between 70 and 90%. Likewise, it is in line with the range reported by Koppejan and Van Loo [88] for fuels obtained from biomass (76–86%).
The results for fixed carbon obtained in this study are similar to those reported by Forero-Núñez et al. [89], who reported a value of 11.71% for sawdust and 16.8% for the cocoa husk; in addition, they mention that fixed carbon is one of the most important parameters in terms of energy potential. A low fixed carbon content increases friability and fragility and decreases resistance to compression and cohesion [90].
The HHV of raw material is similar to that presented by Lima-Rojas [78], who reported values between 17.83 and 18.81 MJ kg−1 in four species of conifers. FAO [91] mentions that HHV strongly depends on the part of the tree and on the species, and thus it can conclude that for the species analyzed in this study and in the Lima-Rojas study, the characteristics of the biomass are similar.
The HHV of a material is influenced by its chemical composition, with lignin and extractables content (gums, resins, waxes, fats, and oils) having the most influence [92,93]. This is because both lignin and extractives contain less oxygen than polysaccharides present in holocellulose (cellulose and hemicellulose). The HHV value obtained for pellets of J. deppeana (21.81 MJ kg−1) shows the relationship between lignin and calorific power, since this species showed the highest value of this compound and also the highest calorific value, which is in line with different reports showing that HHV of biomass is proportional to the lignin content [94,95].
4.2. Pellet Energy Performance
The burning time, the burning rate, the power, and the thermal efficiency between wood with bark and without bark, as well as between species, have a directly proportional relationship with the calorific value of this type of pellet, where the HHV in the biofuel can represent more power in a given device.
The cooking energy supplied is determined by the sensible heat that increases the temperature of the water in the pot and the latent heat that produces steam. The amount of lost energy is depreciated, but the average thermal efficiency is measured accurately [41]. According to the statistical analysis, the energy performance is significantly influenced by the device (gasifier)/biofuels (pellet) ratio (Table 6). The T-LUD gasifier has lower boiling time and an increase of the useful energy delivered per unit of time since it increases the thermal efficiency with respect to the EGWCS gasifier. The use of the T-LUD gasifier in normal conditions could benefit to the user by reducing fuel consumption and the time in which the cooking tasks are carried out.
Diez-Martínez [96] have focused on the operation of several types of gasifier, but their results could not be understood without understanding the type of fuel that is being used. The choice of fuel will basically depend on the ease of being acquired in the environment in which the user is within. Therefore, the handling of this, as well as the moisture content, will have a positive or negative influence on the energy performance of the gasifiers.
In this same context, the results of this research suggest that the chemical properties of the biomass and pellets with bark and without bark of the three species studied are suitable to produce pellets. Furthermore, the difference in emission values between pellets from different sources may be due to the chemical composition of the material, such as the content of extracts, as this can increase the amount of emissions due to resinous acids in wood. The chemical composition is very important within the energy performance since the disposition of the extractables implies an energy difference between the woods. For instance, the use of raw materials with bark to produce pellets generates greater HHV; however, this does not guarantee the best thermal efficiencies in its final use, as was observed with the pellets of J. deppeana, which presented the highest HHV, but low thermal efficiencies. Therefore, the joint evaluation of technologies and fuels is essential to know the real energy savings. For example, in the case of pellets of Q. sideroxyla without bark, a difference of 0.4 kW in operating power was obtained, resulting in a threefold difference in thermal efficiency (2.7 kW to obtain a thermal efficiency of 11%, and 3.1 kW to obtain a thermal efficiency of 34%).
Understanding energy needs will help achieve technological innovation and energy transition, and thus it should be noted that local production of pellets and innovation in green technology would accelerate the energy transition.
4.3. Emissions Generated by the Combustion of Pellets
The total mass associated with carbonaceous aerosols, defined as organic matter plus EC, is estimated from OM and organic carbon plus associated elements, which are usually estimated from OC measurements [50]. These results are directly related to combustion efficiency, which suggests that the use of species without bark allows more complete combustion. Juniperus deppeana with bark and without bark presented a significant difference (p ≤ 0.05) in CH4 emissions, obtaining values of 3.6 ± 1 and 8.2 ± 6.9 mg CH4 MJ−1, respectively. This could have been due to an increase in the temperature in the combustion because wood without bark has a higher calorific value, promoting in consequence the formation of methane in a greater proportion. Juniperus deppeana with bark and without bark presented the lowest averages of pollutant mass emitted (CO2, CO, CH4, PM2.5, OC, and EC) by energy delivered in the T-LUD gasifier. This was because the pellets of this species have a higher calorific value, lignin and extractable, and a lower pH value (see Table 3 and Table 5), to which an independent thermal degradation can be attributed, and can vary according to the heating rate and temperature type of the biomass under study [97].
Emissions produced during combustion are influenced by the gasifier/biofuel ratio. The T-LUD gasifier versus the EGWCS gasifier had significantly lower emissions of CO2, CO, and EC per energy unit (MJ). For the emissions of CH4 and OC, no statistically significant differences (p > 0.05) between gasifiers were observed. On the other hand, the evaluation of particulate material is very important because it is directly related to damage to health [96,98]. The emissions of particulate matter (PM2.5) for the case of T-LUD were significantly higher and can be directly related to the energy performance of the gasifier, i.e., having a higher power and an increase in the burning rate (Table 7), the air/fuel ratio decreases, resulting in lower oxygenation and higher soot production during combustion. The same effect was observed when comparing A. xalapensis and J. deppeana, which showed the highest and lowest emission factors for PM2.5 material with values of 17 and 6 mg PM2.5 MJ−1, respectively. Authors such as MacCarty et al. [50] considered that PM2.5 emissions depend on different factors, such as size, physical characteristics of the fuel, and design of the gasifier. The values obtained for emissions of PM2.5 per kilogram of fuel ranged from 91 to 315 mg PM2.5 kg−1, which were lower than the average presented by efficient stoves (1 to 2.8 g PM2.5 kg−1) [46,50].
The difference of CO2, CO, and PM2.5 emissions by energy released among species in the pellets may have been due to the chemical composition of the material. The content of extracts in the pellets can be an element that increases the emissions, as observed for A. xalapensis, for which a greater amount of extractable and a higher content of EC and OC emissions was obtained.
Elemental carbon (EC), or black particles, comprise the soot generated during combustion. The organic carbon (OC) are white particles produced during slow combustion, with a cooling effect in the atmosphere. These elements come from incomplete combustion, and their formation is closely related to the chemical composition of the fuel, the temperature of combustion, and the amount of oxygen [99]. The type of device, user habits, chemical characteristics, type of biofuel, and moisture content also have a significant effect on the type of particles produced during combustion. The T-LUD gasifier produced fewer emissions for each fuel load, unlike the EGWCS gasifier, which had slightly higher emission values (p < 0.05); only OC emissions were statistically equal between gasifiers.
The difference in gaseous emissions between pellets can be related to the formation of agglomerated ash on the stove’s grills, creating an irregular combustion airflow through the fuel bed, which affect the oxidation of gaseous compounds [100]. The three-stone fire chamber has a net contribution of 676.02 g CO2e kg−1 (Figure 2), with high emissions of CO, CH4, and EC. On this device, the increment of temperature and primary air decreases CO2 but increases CO, CH4, and EC values present in volatile compounds and aerosols [101].
To compare GHG, we determined the global warming potential (GWP) using CO2 as a reference gas [96]. The GWP was applied to each of the pollutants emitted, including the particulate material contribution in the same scale to grams CO2e kg−1 of fuel. The use of improved combustion devices such as gasifiers can reduce the impact of global warming up to 33% on a cooking task with respect to the three-stone fire. The heating potential of black carbon particles has a significantly stronger effect (680/50 = 14 times stronger) than organic carbon particles (cooling). Due to the large difference, it is almost impossible for the cooling particles to dominate the heating particles, even in devices considered to be clean combustion [50]. According to Smith et al. [102], most of the products of incomplete combustion are oxidized to CO2, but in the meantime, they have greater global warming potential (GWP) than CO2. Indeed, if one is going to put carbon gases into the atmosphere, the least damaging form from a global warming standpoint is CO2. Carbon dioxide equivalent (CO2e) is a term for describing different greenhouse gases in a common unit. For any quantity and type of GHG, CO2e indicates the amount of CO2 that would have the equivalent global warming impact. A quantity of GHG is expressed as CO2e by multiplying the amount of the GHG by its GWP.
A CO2 non-renewable factor (fNRB) of 25% (estimated percentage in subnational units as a result of direct collection of firewood) was considered for Mexico [103]. The difference in gaseous emissions between pellets and three-stone fire can be related to the formation of agglomerated ash in the grills, producing an irregular combustion air flow through the fuel bed, which has a negative effect on the oxidation of the gaseous compounds. There was a strong linear correlation between PM2.5 and OC emitted by fuel (kg). The construction of reliable correlation curves by fuel device will allow for more comprehensive evaluations regarding the measurement of organic carbon. On the other hand, the use of gasifiers and types of pellets evaluated showed a reduction of CO2e compared to open fire. Therefore, technological innovation showed an important role in the reduction of elemental carbon and methane that are short-lived pollutants (SLCP) of interest worldwide to face climate change. In this investigation, reductions between 70 and 97% of methane were obtained and 70–94% of organic matter (containing black carbon) for an open fire. Even in devices considered as clean combustion, the difference in gaseous emissions between pellets and wood can be related to the formation of agglomerated ashes in the grills.
5. Conclusions
The evaluation of pellets from raw material of three forest species to end use helps to better understand the relationship of energy and emissions performance of the different types of pellets. Technical implications can be derived from this study:
- (a)
- The chemical properties of the biomass of Arbutus xalapensis, Juniperus deppeana, and Quercus sideroxyla influence the efficiency of energy and emissions, as well as the concentration values of cellulose and lignin, and favored the pellet production and quality. Pellets made from forest residues can be an important source for energy production.
- (b)
- The CO2e emissions were mitigated using the gasifier efficient technologies; the same was the case when using sawdust pellets, both allowing for reaching the optimal performance, which can lead to reducing the use of low-quality biofuels and cooking time.
- (c)
- The use of innovative of end-use technologies, as well as high quality fuels such as pellets, contributes to the mitigation of greenhouse gases and improves energy efficiency. Gasification processes are an alternative to reduce particulate matter (specialty values of elemental carbon) in the combustion of solid biofuels. It is important to mention that this research only included the water boiling test, but it is also necessary to evaluate if gasifiers allow for cooking typical dishes of Mexico and Latin America.
The results provided information with direct applications in the use of biomass to make pellets as well as the relationship of chemical properties that are directly related to the total emissions to the environment, highlighting that the use of gasifiers improves performance and reduces emissions.
Author Contributions
Conceptualization, M.A.Q.-R., B.V.-L. and A.C.-P.; formal analysis, M.A.Q.-R. and V.M.R.-G.; funding acquisition, O.M.-C., V.M.R.-G. and A.C.-P.; methodology, M.A.Q.-R., A.C.-P. and V.M.R.-G.; writing—original draft, M.A.Q.-R., A.C.-P. and V.M.R.-G.; writing—review and editing, M.A.Q.-R., V.M.R.-G., S.R.-V., B.V.-L., M.N.-H., A.C.-P. and O.M.-C. All authors have read and agreed to the published version of the manuscript.
Funding
This research was funded by the Fondo de Sustentabilidad Energética SENER-CONACYT grant number 2014 246911.
Data Availability Statement
Not Applicable.
Acknowledgments
This research was supported by UNAM, SENER CONACYT 2014 246911 Clúster de biocombustibles sólidos para generación de energía térmica y eléctrica.
Conflicts of Interest
The authors declare no conflict of interest.
References
- García, C.; Riegelhaupt, E.; Masera, O. Escenarios de bioenergía en México: Potencial de sustitución de combustibles fósiles y mitigación de GEI. Rev. Mex. Física 2013, 59, 93–103. [Google Scholar]
- Omer, A.M. Energy, environment and sustainable development. Renew. Sustain. Energy Rev. 2008, 12, 2265–2300. [Google Scholar] [CrossRef]
- Stocker, T.F.; Qin, D.; Plattner, G.-K.; Tignor, M.M.; Allen, S.K.; Boschung, J.; Nauels, A.; Xia, Y.; Bex, V.; Midgley, P.M. Climate Change 2013: The Physical Science Basis. Contribution of Working Group I to the Fifth Assessment Report of IPCC the Intergovernmental Panel on Climate Change; Cambridge University Press: Cambridge, UK, 2014. [Google Scholar]
- Ren21, R. Global Status Report, 2014. In Agence Internationale de L’énergie, Renewables Information; Éditions OCDE; REN21 Secretariat: Paris, France, 2014; p. 21. [Google Scholar]
- Alakoski, E.; Jämsén, M.; Agar, D.; Tampio, E.; Wihersaari, M. From wood pellets to wood chips, risks of degradation and emissions from the storage of woody biomass–A short review. Renew. Sustain. Energy Rev. 2016, 54, 376–383. [Google Scholar] [CrossRef]
- FAO. Minimum Dietary Diversity for Women: A Guide for Measurement; FAO: Rome, Italy, 2016; Volume 82. [Google Scholar]
- Mergner, S. The dynamics of global pellet markets growth prospects and price scenarios. In Proceedings of the 4th Central European Biomass Conference, Graz, Austria, 15 January 2014. [Google Scholar]
- Adib, R.; Murdock, H.; Appavou, F.; Brown, A.; Epp, B.; Leidreiter, A.; Lins, C.; Musolino, E.; Petrichenko, K. Renewables 2015 Global Status Report; REN21 Secretariat: Paris, France, 2015; 251p. [Google Scholar]
- Caballero, A.I.M. Estudio del Briquetado y la Combustión de Residuos de la Industria del Mueble de Madera y de Residuos de Muebles; Universitat d’Alacant-Universidad de Alicante: Alicante, Spain, 2016. [Google Scholar]
- Baldwin, R.F. Forest products utilization within a circular bioeconomy. For. Prod. J. 2020, 70, 4–9. [Google Scholar]
- Pant, H.; Tewari, A. Green Sequestration Potential of Chir Pine Forests Located in Kumaun Himalaya. For. Prod. J. 2020, 70, 64–71. [Google Scholar]
- Suárez, J.; Martín, G. Producción de agroenergía a partir de biomasa en sistemas agroforestales integrados: Una alternativa para lograr la seguridad alimentaria y la protección ambiental. Pastos Y Forrajes 2010, 33, 1–19. [Google Scholar]
- Boada, L.E.A.; Vargas, F.E.S. Caracterización físico-química de pellets producidos a partir de mezclas 50/50 carbón bituminoso/madera residual. Inf. Técnico 2015, 79, 18–25. [Google Scholar] [CrossRef][Green Version]
- Ferro, D.T.; Soler, P.B.; Zanzi, R. Torrefacción de biomasa densificada. Tecnol. Química 2009, 29, 180–186. [Google Scholar]
- International-Energy-Agency-(IEA). World Energy Outlook—2011: Executive Summary; International Energy Agency: Paris, France, 2011. [Google Scholar]
- (OMS), O.M.d.l.S. Who air quality guidelines global update 2005. Copenhague, Dinamarca, Oficina Regional de la OMS para Europa. Available online: www.euro.who.int/Document/E87950.pdf (accessed on 2 September 2020).
- WHO. Deaths from Household Air Pollution, 2012. World Health Organization, Geneva. Available online: http://apps.who.int/gho/data/node.main.140?lang=en (accessed on 1 September 2020).
- Serrano Medrano, M. Escenarios Espaciales Explícitos de uso Múltiple de Combustibles Para Cocción en el Sector Energético Residencial Mexicano y su Potencial de Mitigación de Gases de Efecto Invernadero. Ph.D. Thesis, Universidad Nacional Autónoma de México, México, México, 2016. [Google Scholar]
- Aguayo, M. Carolina Buen Uso de la Leña. Santiago, Chile. Available online: http://www.mma.gob.cl/1004/articles-54981-buenusolena082013.pdf (accessed on 1 August 2020).
- Chow, J.C.; Watson, J.G.; Louie, P.K.; Chen, L.-W.A.; Sin, D. Comparison of PM2. 5 carbon measurement methods in Hong Kong, China. Environ. Pollut. 2005, 137, 334–344. [Google Scholar] [CrossRef]
- Támara, S.; Fernando, E. Fabricación y Evaluación de Estufa Mejorada de Plancha 16” x 24”, Con Cámara de Combustión Microgasificadora (T-LUD), Para Comparación Con Codo Rocket; Escuela Agrícola Panamericana: Licenciatura, Zamorano, 2012. [Google Scholar]
- Cocchi, M.; Marchal, D.; Nikolaisen, L.; Junginger, H.; Goh, C.; Heinimö, J.; Bradley, D.; Hess, R.; Jacobson, J.; Ovard, L. Global wood pellet industry market and trade study (IEA bioenergy task 40 sustainable international bioenergy trade). Ieaparis 2011, 40, 190. [Google Scholar]
- Statistics, I. CO2 Emissions from Fuel Combustion-Highlights. Ieaparis. Available online: Http://Www.Iea.Org/Co2highlights/Co2highlights.Pdf (accessed on 4 April 2021).
- Rojas, N.Y. Revisión de las emisiones de material particulado por la cumbustión de diesel y biodiesel. Rev. De Ing. 2004, 20, 58–68. [Google Scholar] [CrossRef]
- Ortíz, L.; Tejada, A.; Vázquez, A.; Veiras, G.P. Aprovechamiento de la biomasa forestal producida por la cadena monte-industria. Rev. Cis-Madera. Parte Iii Prod. De Elem. Densificados 2004, 5, 17–32. Available online: http://www.unionsagrarias.org/archivos/docs/Aprovechameinto_Biomasa_I.pdf (accessed on 4 April 2021).
- Semarnat-Inecc. Mexico’s Climate Change Mid-Century Strategy. Available online: https://unfccc.int/files/focus/long-term_strategies/application/pdf/mexico_mcs_final_cop22nov16_red.pdf (accessed on 7 May 2020).
- Secretaría de Recursos Naturales y Medio Ambiente-Comisión Nacional Forestal (SRNyMA-Conafor). Plan Estratégico Forestal 2030; Gobierno del Estado de Durango: Durango, México, 2007; p. 198. [Google Scholar]
- TAPPI. Tappi Test Methods; TAPPI Press: Atlanta, GA, USA, 2000. [Google Scholar]
- Sandermann, W.; Rothkamm, M. Über die Bestimmung der p H-Werte von Handelshölzern und deren Bedeutung für die Praxis. Holz Als Roh-Und Werkst. 1959, 17, 433–440. [Google Scholar]
- Holmbom, B. Extractives. In Analytical Methods in Wood Chemistry, Pulping and Papermaking; Sjöström, E.A.R., Ed.; Springer: Berlin/Heidelberg, Germany, 1999; pp. 125–148. [Google Scholar]
- Runkel, R.O.; Witt, H. Zur Kenntnis des thermoplastischen Verhaltens von Holz. Holz Als Roh-Und Werkst. 1953, 11, 457–461. [Google Scholar] [CrossRef]
- Wise, L.E. Chlorite holocellulose, its fractionation and bearing on summative wood analysis and on studies on the hemicelluloses. Pap. Trade 1946, 122, 35–43. [Google Scholar]
- ASTM. D1103-60 Method of Test for Alpha-Cellulose in Wood; ASTM International West Conshohocken: Philadelphia, PA, USA, 1977. [Google Scholar]
- UNE-EN. 14775-Biocombustibles Sólidos. Método para la Determinación del Contenido en Cenizas.AEN/CTN 164; Biocombustibles sólidos CONFEMADERA, AENOR, Grupo 9: Madrid, Spain, 2010; p. 10. [Google Scholar]
- UNE-EN 15148. Biocombustibles Sólidos. Determinación del Contenido en Materias Volátiles; Asociación Española de Normalización y Certificación (AENOR): Madrid, Spain, 2010. [Google Scholar]
- ASTM-D-1762-84. American Society for Testing and Materials Standard Methods for Chemical Analysis of Wood Charcoal; ASTM D1762-84 Reaprobada: Philadelphia, PA, USA, 2001; pp. 1–2. [Google Scholar]
- Bailis, P.R.; Ogle, D.; MacCarty, N.; From, D.S.I.; Smith, K.R.; Edwards, R. The water boiling test (WBT), 2007. Available online: http://citeseerx.ist.psu.edu/viewdoc/summary?doi=10.1.1.406.1467 (accessed on 1 April 2021).
- ISO-TC-285/WG-2. Clean Cookstoves and Clean Cooking Solutions-Harmonized Laboratory Test Protocols-Committee Final Draft Part 1: Standard Test Sequence for Emissions and Performance, Safety, and Durability. Available online: https://www.iso.org/committee/4857971/x/catalogue/ (accessed on 3 August 2020).
- Ruiz, V.; Masera, O. Estimating Kitchen PM2. 5 and CO Concentrations out of Stove Emissions: The Case of Mexican Plancha-Type Stoves; Universidad Nacional Autónoma de México: Morelia, México, 2018. [Google Scholar]
- Ruiz-García, V.M.; Edwards, R.D.; Ghasemian, M.; Berrueta, V.M.; Princevac, M.; Vázquez, J.C.; Johnson, M.; Masera, O.R. Fugitive emissions and health implications of plancha-type stoves. Environ. Sci. Technol. 2018, 52, 10848–10855. [Google Scholar] [CrossRef] [PubMed]
- Jetter, J.; Zhao, Y.; Smith, K.R.; Khan, B.; Yelverton, T.; DeCarlo, P.; Hays, M.D. Pollutant emissions and energy efficiency under controlled conditions for household biomass cookstoves and implications for metrics useful in setting international test standards. Environ. Sci. Technol. 2012, 46, 10827–10834. [Google Scholar] [CrossRef] [PubMed]
- Ortínez-Alvarez, A.; Peralta, O.; Alvarez-Ospina, H.; Martínez-Arroyo, A.; Castro, T.; Páramo, V.H.; Ruiz-Suárez, L.G.; Garza, J.; Saavedra, I.; De la Luz Espinosa, M. Concentration profile of elemental and organic carbon and personal exposure to other pollutants from brick kilns in Durango, Mexico. Air Qual. Atmos. Health 2018, 11, 285–300. [Google Scholar] [CrossRef]
- De La Sota, C.; Kane, M.; Mazorra, J.; Lumbreras, J.; Youm, I.; Viana, M. Intercomparison of methods to estimate black carbon emissions from cookstoves. Sci. Total Environ. 2017, 595, 886–893. [Google Scholar] [CrossRef]
- Grieshop, A.; Logue, J.; Donahue, N.; Robinson, A. Laboratory investigation of photochemical oxidation of organic aerosol from wood fires 1: Measurement and simulation of organic aerosol evolution. Atmos. Chem. Phys. 2009, 9, 1263–1277. [Google Scholar] [CrossRef]
- Vicente, E.; Duarte, M.; Tarelho, L.; Nunes, T.; Amato, F.; Querol, X.; Colombi, C.; Gianelle, V.; Alves, C. Particulate and gaseous emissions from the combustion of different biofuels in a pellet stove. Atmos. Environ. 2015, 120, 15–27. [Google Scholar] [CrossRef]
- Bond, T.C.; Bhardwaj, E.; Dong, R.; Jogani, R.; Jung, S.; Roden, C.; Streets, D.G.; Trautmann, N.M. Historical emissions of black and organic carbon aerosol from energy–related combustion. Glob. Biogeochem. Cycles 2007, 21, 1850–2000. [Google Scholar]
- IPCC. Impactos, Adaptación y Vulnerabilidad; Quinto Informe de Evaluación (GTII IE5) del IPCC: Ginebra, Switzerland, 2014. [Google Scholar]
- IPCC. Informe de Síntesis de Expertos Sobre el Cambio Climático; IPCC: Ginebra, Switzerland, 2007. [Google Scholar]
- Edwards, R.D.; Smith, K.R. Carbon Balances, Global Warming Commitments, and Health Implications of Avoidable Emissions from Residential Energy Use in China: Evidence from an Emissions Database”. Available online: http://www.giss.nasa.gov/meetings/pollution2002/d3_edwards.html (accessed on 2 May 2020).
- MacCarty, N.; Ogle, D.; Still, D.; Bond, T.; Roden, C. A laboratory comparison of the global warming impact of five major types of biomass cooking stoves. Energy Sustain. Dev. 2008, 12, 56–65. [Google Scholar] [CrossRef]
- Di Rienzo, J.A.; Casanoves, F.; Balzarini, M.G.; González, L.; Tablada, M.; Robledo, Y.C. InfoStat Versión 2011. Available online: http://www.infostat.com.ar (accessed on 5 August 2017).
- Thompson, R.J.; Li, J.; Weyant, C.L.; Edwards, R.; Lan, Q.; Rothman, N.; Hu, W.; Dang, J.; Dang, A.; Smith, K.R. Field emission measurements of solid fuel stoves in Yunnan, China demonstrate dominant causes of uncertainty in household emission inventories. Environ. Sci. Technol. 2019, 53, 3323–3330. [Google Scholar] [CrossRef] [PubMed]
- Fengel, D.; Wegener, G. Wood: Chemistry, Ultrastructure, Reactions; Walter de Gruyter: Berlín, Germany, 2011; p. 415. [Google Scholar]
- Choon, K.K.; Roffael, E. The acidity of five hardwood species. Holzforschung 1990, 44, 53–58. [Google Scholar] [CrossRef]
- López-Albarrán, P.; Martínez-Sotres, C. Efecto del pH en el poder calorífico de materiales lignocelulosicos. In Química de Los Materiales Lignocelulosicos y su Potencial Bioenergético; Quiñones, J.G.R., Carrillo-Parra, A., Eds.; Sierke: Gottingen, Alemania, 2012; pp. 30–42. [Google Scholar]
- Lin, S.-H.; Hsu, L.-Y.; Chou, C.-S.; Jhang, J.-W.; Wu, P. Carbonization process of Moso bamboo (Phyllostachys pubescens) charcoal and its governing thermodynamics. J. Anal. Appl. Pyrolysis 2014, 107, 9–16. [Google Scholar] [CrossRef]
- Obernberger, I.; Thek, G. The Pellet Handbook: The Production and Thermal Utilisation of Pellets; Routledge: London, UK; Washington, DC, USA, 2010; p. 546. [Google Scholar]
- Kumar, R.; Chandrashekar, N. Study on fuelwood and carbonization characteristics of Prosopis juliflora. J. Indian Acad. Wood Sci. 2016, 13, 101–107. [Google Scholar] [CrossRef]
- Vassilev, S.V.; Baxter, D.; Andersen, L.K.; Vassileva, C.G.; Morgan, T.J. An overview of the organic and inorganic phase composition of biomass. Fuel 2012, 94, 1–33. [Google Scholar] [CrossRef]
- Saito, Y.; Önay, B.; Maruyama, T. High Temperature Corrosion of Advanced Materials and Protective Coatings; Elsevier: Amsterdam, The Netherlands, 2012. [Google Scholar]
- Caillat, S.; Vakkilainen, E. Large-scale biomass combustion plants: An overview. In Biomass Combustion Science, Technology and Engineering; Elsevier: Amsterdam, The Netherlands, 2013; pp. 189–224. [Google Scholar]
- Núñez, C.A.F.; Fajardo, C.A.G.; Vargas, F.E.S. Producción y uso de pellets de biomasa para la generación de energía térmica: Una revisión a los modelos del proceso de gasificación. Iteckne 2012, 9, 21–30. [Google Scholar]
- Young, H.; Guinn, V. Chemical elements in complete mature trees of seven species in Maine. Tappi 1966, 49, 190–197. [Google Scholar]
- EN-15297. Biocombustibles sólidos. Determinación de elementos minoritarios. As, Cd, Co, Cr, Cu, Hg, Mn, Mo, Ni, Pb, Sb, V y Zn. 2011. Available online: https://www.en.aenor.com/normas-y-libros/buscador-de-normas/une?c=N0048507 (accessed on 2 April 2021).
- Fengel, D.; Wegener, G. Wood: Chemistry, Ultrastucture, Reactions Berlin; Walter de Gruyter: Berlin, Germany, 1984. [Google Scholar]
- Bernabé-Santiago, R.; Ávila-Calderón, L.E.A.; Rutiaga-Quiñones, J.G. Componentes químicos de la madera de cinco especies de pino del municipio de Morelia, Michoacán. Madera Y Bosques 2013, 19, 21–35. [Google Scholar] [CrossRef][Green Version]
- Andrade, D.; Gil, C.; Breitenfeld, L.; Domingues, F.; Duarte, A.P. Bioactive extracts from Cistus ladanifer and Arbutus unedo L. Ind. Crop. Prod. 2009, 30, 165–167. [Google Scholar] [CrossRef]
- Orhan, N.; Orhan, I.E.; Ergun, F. Insights into cholinesterase inhibitory and antioxidant activities of five Juniperus species. Food Chem. Toxicol. 2011, 49, 2305–2312. [Google Scholar] [CrossRef]
- Bárcenas-Pazos, G.M.; Ríos-Villa, R.; Aguirre-Rivera, J.R.; Juárez-Flores, B.I.; Honorato-Salazar, J.A. Composición química y densidad básica relativa de la madera de dos especies arbustivas de encino blanco de la Sierra de Álvarez, SLP, México. Madera Y Bosques 2008, 14, 81–94. [Google Scholar] [CrossRef][Green Version]
- Fonseca, M. Determinación de la Composición Química de la Madera de Pino Candelillo (Pinus Maximinoi HE Moore) Procedente de la finca Río Frío, Tactic, Alta Verapaz; Tesis Profesional; Universidad San Carlos de Guatemala: Ciudad de Guatemala, Guatemala, 2006. [Google Scholar]
- Ávila, L.E.; Herrera, M.A. Efecto de los extraíbles en tres propiedades físicas de la madera de Enterolobium cyclocarpum procedente de Michoacán, México. Bosque 2012, 33, 227–232. [Google Scholar] [CrossRef]
- Honorato, S.J.A. Química de la madera de encinos. In Características, Propiedades y Procesos de Transformación de la Madera de los Encinos de Mexico; Quintanar, O.J., Ed.; INIFAP-CIRCE. Capo experimental SN. Martinito. Tlahuapan: Puebla, Mexico, 2002; pp. 86–106. [Google Scholar]
- Bland, D. The composition and analysis of eucalypt woods. Appita 1985, 38, 291–294. [Google Scholar]
- Ruiz-Aquino, F.; Ruiz-Ángel, S.; Feria-Reyes, R.; Santiago-García, W.; Suárez-Mota, M.E.; Rutiaga-Quiñones, J.G. Wood chemical Composition of Five Tree Species from Oaxaca, Mexico. BioResources 2019, 14, 9826–9839. [Google Scholar]
- Fernández, J. Materias Primas Para Producción de Biocombustibles Sólidos. 5as Jornadas Abulenses de Energías Renovables-Ávila, España. 18–19 de Mayo, 2006. Available online: https://www.apea.com.es/docus/jornadas-abulenses/v-jornadas/m1p3.pdf. (accessed on 2 April 2021).
- Calderón, L.E.A.Á. Evaluación de los componentes químicos básicos de la madera de Pinus pringlei infectada por el muérdago Psittacanthus acrantherus. Cienc. Nicolaita 2011, 54, 7–16. [Google Scholar]
- Revilla, G. Química de la Madera de Cuatro Pinos Mexicanos de la Subsección Cembroides; Tesis; Universidad Autónoma Chapingo: Chapingo, Texcoco, México, 2011. [Google Scholar]
- Lima Rojas, L. Evaluación de la Composición Química y Propiedades Físicas de Madera y Corteza de Cuatro Coníferas para la Producción de Bioenergía. Master’s Thesis, Universidad Autónoma de Nuevo León, Linares, México, 2013. [Google Scholar]
- Vanholme, R.; Demedts, B.; Morreel, K.; Ralph, J.; Boerjan, W. Lignin biosynthesis and structure. Plant Physiol. 2010, 153, 895–905. [Google Scholar] [CrossRef] [PubMed]
- Pereira, B.L.C.; Oliveira, A.C.; Carvalho, A.M.M.L.; Carneiro, A.D.C.O.; Santos, L.C.; Vital, B.R. Quality of wood and charcoal from Eucalyptus clones for ironmaster use. Int. J. For. Res. 2012, 2012, 523025. [Google Scholar] [CrossRef]
- Jara, E.R. O Poder Calorífico de Algumas Madeiras Que Ocorrem no Brasil; Tecnológicas–Ipt, (Comunicação Técnica, 1797); São Paulo Instituto De Pesqui: São Paulo, Brazil, 1989. [Google Scholar]
- Cunha, M.D.P.S.C.D.; Pontes, C.L.F.; Cruz, I.D.A.; Cabral, M.T.D.; Da Cunha Neto, Z.B.; Barbosa, A.P. Estudo químico de 55 espécies lenhosas para geração de energia em caldeiras. An. Do Iii Encontro Bras. Em Madeiras E Em Estrut. De Madeira-Ebramemvolume Iipg. 1989, II, 95–121. [Google Scholar]
- Villalvazo Naranjo, J.; Faix, Q. Caracterización Analítica de las Ligninas de Cuatro Especies del Género Quercus y Sus Posibilidades De aprovechamiento Técnico; Serie: Cuadernos de Divulgación; Universidad Autónoma Chapingo: Guadalajara, México, 1982. [Google Scholar]
- Bustamante García, V.; Carrillo Parra, A.; Prieto Ruíz, J.Á.; Corral-Rivas, J.J.; Hernández Díaz, J.C. Química de la biomasa vegetal y su efecto en el rendimiento durante la torrefacción: Revisión. Rev. Mex. De Cienc. For. 2016, 7, 5–23. [Google Scholar] [CrossRef][Green Version]
- Garcia-Maraver, A.; Rodriguez, M.; Serrano-Bernardo, F.; Diaz, L.; Zamorano, M. Factors affecting the quality of pellets made from residual biomass of olive trees. Fuel Process. Technol. 2015, 129, 1–7. [Google Scholar] [CrossRef]
- Ramos, R.T.; Alpírez, G.M.; Stillianova, M.S.; Cabarcas, M.T.B.; Palomar, L.T.; Pelayo, L.J.P. Lignina obtenida de residuos agrícolas como biocombutible de tercera generación. Cienc. Y Tecnol. 2015, 15, 151–164. [Google Scholar]
- Ragland, K.; Aerts, D.; Baker, A. Properties of wood for combustion analysis. Bioresour. Technol. 1991, 37, 161–168. [Google Scholar] [CrossRef]
- Koppejan, J.; Van Loo, S. The Handbook of Biomass Combustion and Co-Firing; Routledge: Oxfordshire, UK, 2012. [Google Scholar]
- Forero-Nuñez, C.A.; Jochum, J.; Sierra, F. Effect of particle size and addition of cocoa pod husk on the properties of sawdust and coal pellets. Ing. E Investig. 2015, 35, 17–23. [Google Scholar] [CrossRef]
- Demirbaş, A. Sustainable cofiring of biomass with coal. Energy Convers. Manag. 2003, 44, 1465–1479. [Google Scholar] [CrossRef]
- Organización-de-las-Naciones-Unidas-Para-la-Alimentación-y-la-Agricultura-(FAO). Conservación de la Energía en Las Industrias Mecánicas Forestales. Available online: http://www.fao.org/3/T0269S/0269S00.htm (accessed on 4 April 2020).
- Padilla, A.; Petit, J.; Padilla, D.; Quintero, L. Especies usadas como comburente en la comunidad de Villanueva, Estado Lara-Venezuela. Rev. For. De Venez. 2000, 44, 11–15. [Google Scholar]
- Günther, B.; Gebauer, K.; Barkowski, R.; Rosenthal, M.; Bues, C.-T. Calorific value of selected wood species and wood products. Eur. J. Wood Wood Prod. 2012, 70, 755–757. [Google Scholar] [CrossRef]
- Demirbaş, A. Relationships between lignin contents and heating values of biomass. Energy Convers. Manag. 2001, 42, 183–188. [Google Scholar] [CrossRef]
- Miranda, R.; Bustos-Martinez, D.; Blanco, C.S.; Villarreal, M.G.; Cantu, M.R. Pyrolysis of sweet orange (Citrus sinensis) dry peel. J. Anal. Appl. Pyrolysis 2009, 86, 245–251. [Google Scholar] [CrossRef]
- Díez-Martínez, A. Estudio Comparativo de la Eficiencia Térmica de las Emisiones de Cocinas de Biomasa en Senegal. Bachelor6a Thesis, Universidad Politécnica De Madrid, Madrid, Spain, 2017. [Google Scholar]
- Karaosmanoglu, F.; Cift, B.D.; Isigigur-Ergudenler, A. Determination of reaction kinetics of straw and stalk of rapeseed using thermogravimetric analysis. Energy Sources 2001, 23, 767–774. [Google Scholar]
- Brander, M.; Davis, G. Greenhouse Gases, CO2, CO2e, and Carbon: What do All These Terms Mean; Econom. White Pap. Press: London, UK, 2012; Available online: https://ecometrica.com/greenhouse-gases-co2-co2e-and-carbon-what-do-all-these-terms-mean/ (accessed on 4 April 2021).
- Bernal Castro, C.A.; Tinjacá Gutiérrez, J.C. Establecimiento de la Composición de Carbono Orgánico (CO) y Carbono Elemental (CE) en Material Particulado de Tres Localidades de Bogotá. Bachelor Thesis, Universidad de la Salle, Bogotá, Colombia, 2009. [Google Scholar]
- Butt, E.; Van Zyl, P.; Beukes, J.; Josipovic, M.; Rap, A.; Schmidt, A.; Scott, C. The impact of residential combustion emissions on atmospheric aerosol, human health, and climate. Atmos. Chem. Phys. Discuss. 2015, 16, 873–905. [Google Scholar] [CrossRef]
- Valverde, A.; Sarria, B.; Monteagudo, J.P. Análisis comparativo de las características fisicoquímicas de la cascarilla de arroz. Sci. Et Tech. 2007, 13, 255–260. [Google Scholar]
- Smith, K.R.; Uma, R.; Kishore, V.; Zhang, J.; Joshi, V.; Khalil, M. Greenhouse implications of household stoves: An analysis for India. Annu. Rev. Energy Environ. 2000, 25, 741–763. [Google Scholar] [CrossRef]
- Bailis, R.; Drigo, R.; Ghilardi, A.; Masera, O. The carbon footprint of traditional woodfuels. Nat. Clim. Chang. 2015, 5, 266–272. [Google Scholar] [CrossRef]
Publisher’s Note: MDPI stays neutral with regard to jurisdictional claims in published maps and institutional affiliations. |
© 2021 by the authors. Licensee MDPI, Basel, Switzerland. This article is an open access article distributed under the terms and conditions of the Creative Commons Attribution (CC BY) license (https://creativecommons.org/licenses/by/4.0/).