Article

Complete Chloroplast Genome of Clethra fargesii Franch., an Original Sympetalous Plant from Central China: Comparative Analysis, Adaptive Evolution, and Phylogenetic Relationships

1
Jiangxi Provincial Key Laboratory for Bamboo Germplasm Resources and Utilization, Forestry College, Jiangxi Agricultural University, Nanchang 330045, China
2
CAS Key Laboratory of Plant Germplasm Enhancement and Specialty Agriculture, Wuhan Botanical Garden, Chinese Academy of Sciences, Wuhan 430074, China
3
Sino–Africa Joint Research Center, Chinese Academy of Sciences, Wuhan 430074, China
4
University of Chinese Academy of Sciences, Beijing 100049, China
*
Author to whom correspondence should be addressed.
Forests 2021, 12(4), 441; https://doi.org/10.3390/f12040441
Submission received: 16 March 2021 / Revised: 1 April 2021 / Accepted: 3 April 2021 / Published: 6 April 2021
(This article belongs to the Section Genetics and Molecular Biology)

Abstract

:
Clethra fargesii, an essential ecological and endemic woody plant of the genus Clethra in Clethraceae, is widely distributed in Central China. So far, there have been a paucity of studies on its chloroplast genome. In the present study, we sequenced and assembled the complete chloroplast genome of C. fargesii. We also analyzed the chloroplast genome features and compared them to Clethra delavayi and other closely related species in Ericales. The complete chloroplast genome is 157,486 bp in length, including a large single-copy (LSC) region of 87,034 bp and a small single-copy (SSC) region of 18,492 bp, separated by a pair of inverted repeat (IR) regions of 25,980 bp. The GC content of the whole genome is 37.3%, while those in LSC, SSC, and IR regions are 35.4%, 30.7%, and 43.0%, respectively. The chloroplast genome of C. fargesii encodes 132 genes in total, including 87 protein-coding genes (PCGs), 37 tRNA genes, and eight rRNA genes. A total of 26,407 codons and 73 SSRs were identified in C. fargesii chloroplast genome. Additionally, we postulated and demonstrated that the structure of the chloroplast genome in Clethra species may present evolutionary conservation based on the comparative analysis of genome features and genome alignment among eight Ericales species. The low Pi values revealed evolutionary conservation based on the nucleotide diversity analysis of chloroplast genome in two Clethra species. The low selection pressure was shown by a few positively selected genes by adaptive evolution analysis using 80 coding sequences (CDSs) of the chloroplast genomes of two Clethra species. The phylogenetic tree showed that Clethraceae and Ericaceae are sister clades, which reconfirm the previous hypothesis that Clethra is highly conserved in the chloroplast genome using 75 CDSs of chloroplast genome among 40 species. The genome information and analysis results presented in this study are valuable for further study on the intraspecies identification, biogeographic analysis, and phylogenetic relationship in Clethraceae.

1. Introduction

Clethra Gronov. ex L. is an important genus in the family Clethraceae composed of deciduous or evergreen shrubs or trees [1]. The genus comprises more than 70 species worldwide and naturally distributes in the mountainous and hilly areas ranging from tropical to subtropical areas in Eastern and Southeast Asia, Southeastern of North America, Central America, Eastern Brazil, and Madeira Islands [1,2]. The fragrant flowers, beautiful tree crowns, and white inflorescences make it a good ornamental prospect in gardens [3]. It can be also used as ecological and environmental protection plants to restore the destroyed mountains with the good ability of tolerance to barren soil, absorbing and enriching heavy metal ions, and taking toxic gases according to previous studies [4,5,6,7].
This genus is a group of original sympetalous plants and closely related to the Ericaceae species. Since 1851, German botanist Klotzsch promoted this genus from Ericaceae to be an independent family (Clethraceae) [1]. However, 17 species and 18 varieties of this genus from China were merged into 7 species based on the revision of morphological taxonomy in Flora of China in 2005 [8]. Additionally, in recent years, molecular systematics has been applied in the phylogenetic classification of this genus. Here, the genus Purdiaea (initially classified under Cyrillaceae) was transferred into Clethraceae according to Anderberg and Zhang using the chloroplast genes atpB, ndhF, and rbcL [9] and Clethra arborea Aiton in subsection Pseudocuellaria (only distributed in Madeira Islands in Northwest Africa) was merged to section Cuellaria by Fior et al. [10].
The chloroplast is an essential organelle in green plant cells with an independent circular genome and plays a critical role in the processes of photosynthesis and carbon fixation [11,12]. The chloroplast genome has a more conserved genome structure, gene composition, and variation ratio than mitochondrial and nuclear genomes due to its maternal heredity, less recombination, and slow evolutionary rate [13,14,15]. The stable and conserved chloroplast genome is highly suitable for the study of phylogenetic analysis, species identification, and biogeography for most angiosperms [16,17,18]. In molecular marker studies, some markers have been developed from chloroplast genes. For example, rbcL and matK, and the intergenic spacer trnH–psbA and trnL–trnF have been used widely as DNA barcodes to identify species [19].
In recent years, there have been an increasing number of complete chloroplast genomes sequenced and applied in the study of phylogeny, taxonomy, and biogeography for several taxa [20]. It has become more convenient to obtain the chloroplast genome data with the rapid development of sequencing technology and a great reduction in cost [21]. However, in the family Clethraceae, Clethra delavayi Franch. (NC_041129.1) is the only complete chloroplast genomes that have been sequenced with paucity in the available DNA fragments of Clethra. Therefore, there is a need to sequence more chloroplast genomes of Clethra species for further study for the family.
In the present study, the complete chloroplast genome of Clethra fargesii Franch. is reported, which is an important ecological and endemic plant that is widely distributed in mountainous areas of Central China. In addition, we compared the genome features of C. fargesii with closely related species in Ericales for the first time. Our study will provide a reference for the resolution of Clethra species classification, biogeographic analysis, and phylogenetic relationship in Clethraceae.

2. Materials and Methods

2.1. Sampling, Extraction, and Genome Sequencing

The materials of C. fargesii were collected from Hubei Nanhe National Nature Reserve, China (31°53′45″ N, 111°30′30″ E, Alt. 1130 m). The fresh leaves were kept in silica gels for preservation [22] and the voucher specimens (Voucher Number: HGW-2041) were later deposited at the Herbarium of Wuhan Botanical Garden, CAS (HIB) (China). The complete genomic DNA of C. fargesii chloroplast was extracted from dry leaf materials using a modified procedure of CTAB (cetyltrimethylammonium bromide) [23] and then sequenced based on the Illumina paired-end technology platform at the Novo gene Company (Beijing, China).

2.2. Assembly and Annotation of Chloroplast Genome

Genome assembly was performed using GetOrganelle v1.7.2 with default parameters [24]. The GetOrganelle first filtered the low–quality data and adaptors, conducted the de novo assembly, purified the assembly, generated the complete chloroplast genomes, and finally, manually corrected. The Bandage was used to visualize the assembly graphs to authenticate the automatically generated chloroplast genome [25]. PGA software was used to find inverted repeats (IR) regions and annotate the whole chloroplast genomes using Amborella trichopoda, C. delavayi, and some other related species as the reference [26]. The software Geneious-v10.2.3 [27] was used to check the annotated genes and detected errors corrected manually. Additionally, the annotated chloroplast genome sequence was submitted to GenBank (GenBank No.: MT742578) on the NCBI website. The circular chloroplast genomic map of C. fargesii was drawn and visualized using Chloroplot online software (https://irscope.shinyapps.io/Chloroplot/ (accessed on 1 April 2021)) [28].

2.3. Comparative Analysis of the Chloroplast Genome

The chloroplast genome features of C. fargesii were analyzed using the Geneious-v10.2.3 software by comparing seven other available chloroplast genomes in Ericales downloaded from the NCBI website (Table S1). The seven Ericale species were selected to verify the conservation of C. fargesii chloroplast genome based on the related gradient close to C. fargesii in phylogeny. Further, multiple genome alignment analysis was done using the Mauve program [29]. Excluding two Ericaceae species, six Ericales species chloroplast genomes were used to analyze junction characteristics and codon usage bias considering the cases of great gene losses and extreme expansion or contraction of IR region in the chloroplast genomes of Ericales species. The figure of junction characteristics was drawn by AI software and MEGA7.0 was used to analyze the codon usage bias with the RSCU (relative synonymous codon usage) values based on the CDS region [30].

2.4. SSRs and Nucleotide Diversity Analysis

The simple sequence repeats (SSRs) of the chloroplast genomes of C. fargesii and C. delavayi were analyzed using the software MISA [31,32] with the basic repeat setting: 10 for mononucleotides, 4 for dinucleotides, 4 for trinucleotides, 3 for tetranucleotides, 3 for pentanucleotides, and 3 for hexanucleotide repeats. The DnaSP-v5.10 software was used to calculate nucleotide variability (Pi) values and variable sites using the aligned chloroplast genome sequences of C. fargesii and C. delavayi with a window length of 600 bp and a step size of 200 bp [33].

2.5. Adaptive Evolution Analysis

The positive selection sites were evaluated in 80 coding sequences (CDSs) of the chloroplast genomes of C. fargesii and C. delavayi using the PAML-v4.7 [34] package implemented in EasyCodeML software [35]. The ratio of nonsynonymous (dN) and synonymous substitution (dS) (ω = dN/dS) was calculated using site model based on the four site-specific models (M0 vs M3, M1a vs. M2a, M7 vs. M8, and M8a vs. M8) with likelihood ratio test (LRT) threshold of p < 0.05 elucidating adaptation signatures within the genome. Here, each CDS sequence was aligned using codons in the MAFFT-v7.409 program [36] and then concatenated using the program Concatenate Sequence. Comparing the four site-specific models, M7 vs. M8 (positive selection) was calculated to identify positive selection sites based on both ω and LRTs values. The methods of Bayes Empirical Bayes (BEB) analysis [37] and Naive Empirical Bayes (NEB) analysis were implemented in the M8 model to detect positive selection sites of the selected genes.

2.6. Phylogenetic Analysis

To estimate the phylogenetic position of Clethra within the Ericales, 80 CDSs of the chloroplast genomes of 40 species was used to construct phylogenetic tree by combining maximum likelihood (ML) with Bayesian (BI), including 12 families in Ericales and two outgroups (Cornus chinensis Wangerin and Hydrangea davidii Franch.) (Table S1). Each CDS sequence was aligned using the software MAFFT-v7.409 [36], and then, we removed the stop codons and discarded poor fragments in the Gbloks program [38] and concatenated in the program Concatenate Sequence. On one hand, the aligned sequences were used to select the best-fit model for the BI methods according to the Bayesian information criterion (BIC) in the ModelFinder program [39]. GTR+I+G+F was recommended to be the best-fit model and then the BI tree (1,000,000 generations, sampling every 1000 generations) was constructed by the software MrBayes-3.2.6 [40], in which the initial 25% of sampled data were discarded as burn-in. On the other hand, the best fit model GTR+F+I+G4 was selected for maximum likelihood (ML) analysis by ModelFinder program according to BIC. The software IQ–TREE was implemented to construct the ML tree with 1000 bootstrap replications [41,42,43], which is performed in PhyloSuite-v1.2.1 [44]. The ML tree and Bayesian tree were manually recombined using AI software based on the consistent topological structures. The constructed phylogenetic tree was visualized using the software Figtree-v1.4.4 (https://www.figtreeasia.com/, (accessed on 1 April 2021)).

3. Results and Discussion

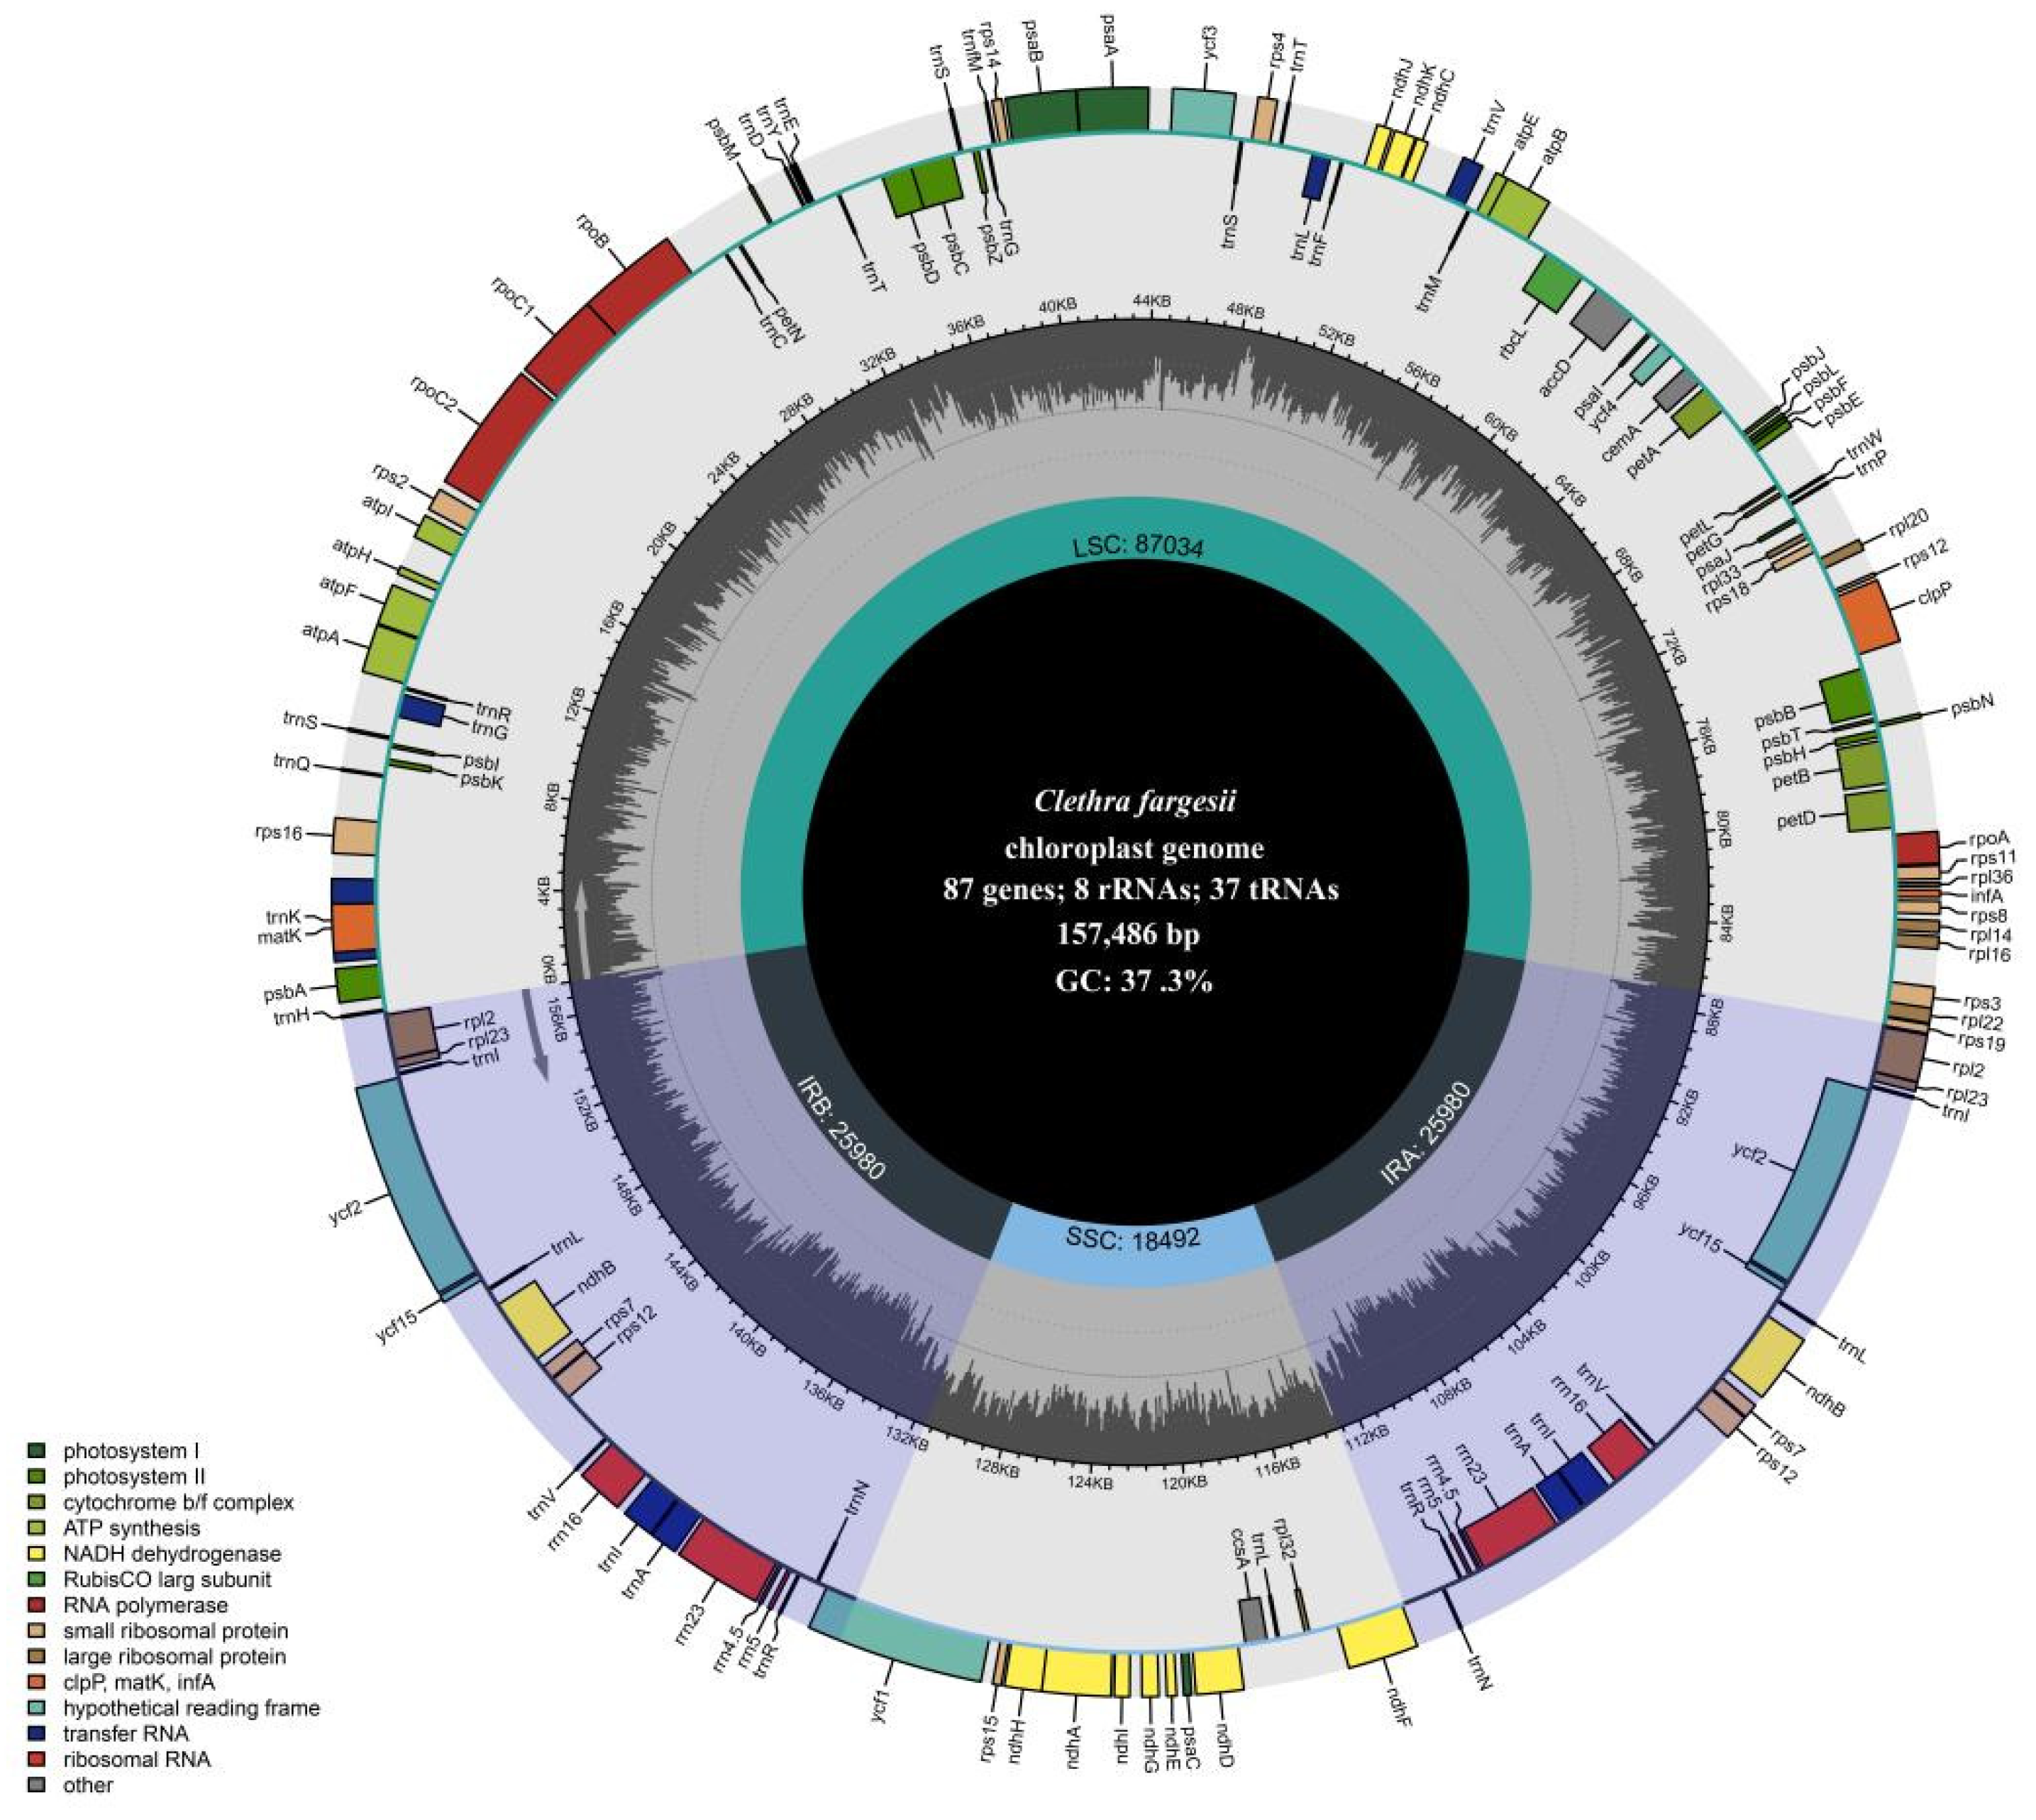
3.1. Chloroplast Genome Features

The complete chloroplast genome of C. fargesii is circular DNA of 157,486 bp in length with a quadripartite structure typical of most angiosperms (Figure 1). It comprises a large single-copy (LSC) region of 87,034 bp, a small single-copy (SSC) region of 18,492 bp, and a pair of inverted repeat (IRa and IRb) regions of 25,980 bp each, which separate the LSC and SSC regions (Figure 1 and Table 1). The GC content of the whole genome is 37.3%, while the GC contents in LSC, SSC, and IR regions are 35.4%, 30.7%, and 43.0%, respectively (Table 1). The higher GC content in IR regions may be due to the presence of tRNA and rRNA genes that dominate the majority of the regions and have a relatively higher GC content. The GC content is an important indicator to distinguish different species groups [45,46] and higher GC content contributes to maintaining the stability of the DNA strands [47]. According to Liu et al. and Kim et al., the GC content in the IR regions of two Ericaceae species (Rhododendron griersonianum Balf. f. & Forrest and Vaccinium oldhamii Miquel) is significantly lower than that of the other six species (Table 1) [48,49], which may lead to more variations in length and gene number in their chloroplast genomes than other species in Ericales.
In the chloroplast genome of C. fargesii, 132 functional genes were annotated. These genes can be divided into three categories and subdivided into 18 groups [50,51], including 87 protein-coding genes (PCGs), 37 tRNA genes, and 8 rRNA genes. Among them, 18 genes are duplicated in the IR regions, including 7 PCGs (ndhB, rpl2, rpl23, rps7, rsp12, ycf2, and ycf15), 7 tRNA genes (trnI-CAU, trnL-CAA, trnV-GAC, trnI-GAU, trnA-UGC, trnR-ACG, and trnN-GUU), and 4 rRNA (rrn4.5, rrn5, rrn16, and rrn23) (Table 1 and Table 2). The LSC region contains 61 PCGs and 22 tRNA genes, while the SSC region contains 12 PCGs and 1 tRNA genes (Table S2). In addition, introns hold an important role in some gene expressions as intragenic regulatory sequences [52]. A total of 18 genes has introns, comprising six tRNA (trnK-UUU, trnG-UCC, trnL-UAA, trnV-UAC, trnI-GAU, and trnA-UGC) genes and 12 PCGs (atpF, ndhA, ndhB, petB, petD, rpl2, rpl16, rps7, rps12, rps16, rpoC1, and ycf3). Particularly, among them, ycf30 and clpP genes have two introns (Table S3 and Table 2). Besides, rps12 is a trans-splicing gene (discontinuous distributed) in the chloroplast genome sequence, with the 5′- exon found in the LSC region and the other parts (two exons separated by one intron) found in IR regions. The trnK-UUU gene has the longest intron (2524 bp) among 18 genes and contains the matK gene inside completely. This phenomenon had been reported in other plants [53,54].
The chloroplast genome of C. fargesii is most similar to C. delavayi and highly resemblant to Styrax japonicus Sieb. et Zucc. and Schima superba Gardn. et Champ. in genome size, GC content, number of genes, and introns, in general, by comparing the structure features among eight Ericales species (Table 1 and Table S3). Although the Ericaceae (R. griersonianum and V. oldhamii) and the Actinidiaceae (Saurauia tristyla DC. and Actinidia eriantha Benth.) are two adjacent clades of the Clethraceae clade in the phylogenetic relationship while the other two species are in the farther clades [55], their chloroplast genome features displayed more differences in the expansion and contraction of whole chloroplast genomes and four regions. The contraction of IR regions leads to the expansion of SSC regions for two Actinidiaceae species, while the extreme expansion of IR regions reduces the length of the SSC regions to about 2000–3000 bp for two Ericaceae species (Table 1). Besides, the clpP gene is a typical phenomenon of gene loss in the structural variation of the chloroplast genome [56,57], which has been lost in the two Ericaceae species and two Actinidiaceae species while still present in S. japonicus and S. superba. Therefore, Clethra species appear to have conserved chloroplast genome structures based on the above analysis.

3.2. Comparative Chloroplast Genome Structure

The multiple genome alignments revealed significant structural differences for eight Ericales species using the Mauve program. Two Ericaceae species are longer than the other six species in the genome length due to the expansion of IR regions (Figure 2). Some inversion and rearrangement regions were observed in the LSC region of two Ericaceae species, while other regions showed a lower variation ratio in gene structure. The two Ericaceae species may be prone to the structural mutations in DNA strands and accumulate constantly due to the low GC content in their chloroplast genomes under the long evolutionary history. However, the two Clethra species and the other four Ericales species are more conserved, which leads to a growing divergence in the genome structure of them from that of the two Ericaceae species. Except for two Ericaceae species, whole chloroplast genome alignment revealed relatively low variation and high similarity between two Clethra species and the other four Ericales species.

3.3. Junction Characteristics

The size of chloroplast genomes varies depending on the size variation of the LSC and IR regions [58], especially in the expansion and contraction of two IR regions [59,60]. Detailed comparison of the IR/SSC and IR/LSC junction regions among six species are presented in Figure 3. The junction characteristics of two Clethra species are also highly similar to S. japonicus and S. superba. Among the four species, the rps19 gene is located within the IRb/LSC boundary and expands to the IRb region with 32, 44, 46, and 67 bp, and the rpl2 gene is duplicated in the IR region close to two IR/LSC boundaries. Although the case in two Actinidiaceae species is different from the above four species, the trnH-GUG gene is duplicated in the IR region close to two IR/LSC boundaries, while in the other four species, the trnH-GUG gene is completely located to the right of the IRa/LSC boundary. Moreover, in two Actinidiaceae species, the psbA gene is located within the IRa/LSC boundary with 238 and 60 bp in IRa region, and the left of the IRb/LSC boundary is the rpl23 gene. Additionally, the ycf1 gene occupies the IRa/LSC boundary, with a length ranging from 404 to 1078 bp in IRa region, a corresponding ycf1 pseudogene in IRb boundary among the six species. The ndhF gene among five species is entirely located to the right of the IRb/SSC boundary except that 24 bp expands to the IRb regions in S. japonicus. Based on the above results, the two Clethra species have more resemblances to S. japonicus and S. superba in the expansions and contractions of IR region boundaries than two Actinidiaceae species.

3.4. Codon Usage Analysis

The relative synonymous codon usage (RSCU) was analyzed using the protein-coding regions of C. fargesii chloroplast genome and a total of 26,407 codons were identified. UUA (1.86%, leucine) is the most frequently used codon, while AGC (0.35%, Serine) was the least abundant. Serine (6.01%), arginine (6.00%), and leucine (6.00%) are the three most abundant amino acids, whereas methionine (1.00%) and tryptophan (1.00%) are the two least abundant amino acids. As the most abundant amino acid, a preference for leucine was also observed in other reported angiosperm chloroplast genomes [54,61], which have been frequently reported in other angiosperm taxa [62,63]. Interestingly, the majority of the RSCU values with A/T-ending codons are more than one (RSCU > 1.00), while the majority of the RSCU values with C/G-ending codons were less than one (RSCU < 1.00). Moreover, most of the amino acids had no less than two synonymous codons, except that methionine (AUG) and tryptophan (UGG) have no codon usage bias due to only one encoded codon (Table S4 and Figure 4).
The total of codons varied from 23,024 (A. eriantha) to 26,595 (S. superba) according to the comparative analysis of the RSCU among six species in Ericales. Among these codons, serine (5.99–6.02%), arginine (6.00–6.02%), and leucine (6.00–6.01%) were also maximum value the same as C. fargesii, while codons for methionine (1.00%) and tryptophan (1.00%) were also minimum (Table S4). The comparison of the RSCU value of the six species was almost no different (Figure 5), which indicated that both two Clethra species and the other four species belonging to the same order have relative stability in codon usage bias.

3.5. Analysis of Simple Sequence Repeats (SSRs) and Nucleotide Diversity

Simple sequence repeat (SSR), also known as microsatellite as an excellent molecular markers tool with highly reproductive, polymorphic, and reliable advantages, is widely used in plant species identification, phylogeny, and population genetic studies [64]. In this study, SSRs were done using MISA software to identify the potential repeats based on the chloroplast genome sequences of two Clethra species. A total of 73 SSRs were detected in the chloroplast genome of C. fargesii, with the sequence length of 8–19 bp and 3–14 repeats, including 18 mononucleotides (24.7%), 45 dinucleotides (61.6%), 3 trinucleotides (4.1%), 5 tetranucleotides (6.8%), 1 pentanucleotide (1.4%), and 1 hexanucleotide (1.4%). Contrastively, in the C. delavayi chloroplast genome, a total of 78 SSRs were detected with the sequence length of 8–19 bp and 3–19 repeats, of which mononucleotides are 23 (29.5%), dinucleotides are 45 (57.7%), trinucleotides are 3 (3.8%), tetranucleotides are 5 (6.4%), pentanucleotide is 1 (1.3%), and hexanucleotide is 1 (1.3%) (Figure 6A and Figure 7).
Most of the SSRs types are mononucleotide and dinucleotide repeats, while the other complex SSRs are at lower frequencies in the two-chloroplast genome sequences, and these results conform with previous studies [65,66,67]. It is a particular case that the number of dinucleotide SSRs is significantly greater than mononucleotide SSRs and A/T (no C/G) is the only mononucleotide SSRs type in the two species (Figure 6A and Figure 7), which are rarely found in other species [68,69,70,71,72]. Of the four copy regions of two species chloroplast genomes, the SSRs mainly in the LSC regions (64.4% and 67.9%) and the proportion close to two-thirds of the total are largely beyond the corresponding proportion of LSC length occupying the whole chloroplast genomes (Figure 6B). In addition, the SSRs proportion in the CDS region (36.5% and 32.1%) is far less than that in non-coding regions (Figure 6C) and does not match with the proportion of CDS length occupying the whole chloroplast genomes. The SSRs were disproportionately found in the LSC and non-coding regions, which may have higher molecular marker potential for Clethra species. The identified SSRs will be useful in studying phylogeny and population genetics of the Clethra genus in the future. It is also revealed that the chloroplast genome sequences of the two Clethra species have high similarity based on SSR analysis.
The Pi value of nucleotide diversity was calculated to analyze the sequence divergence based on the chloroplast genome of C. fargesii and C. delavayi. The values of the entire genome sequence range from 0 to 0.01000 and the average value is 0.00110. The analysis displayed that the highest level of mean nucleotide diversity is 0.00225 (range: 0–0.00667) in the SSC regions, while the lowest level of mean nucleotide diversity is 0.00333 (range: 0–0.00024) in the IR regions. Comparing the four regions, the highest Pi value is found in the LSC region by having a comparison among four regions. These values of the LSC region vary from 0 to 0.01000, with a mean value of 0.00142. Furthermore, seven high divergent regions (Pi > 0.00600, the mean value = 0.00787) were detected, of which four are located in non-coding regions (trnH/psbA, psbE/petL, rps16/rpl36, and rps15/ycf1) while three are in CDS regions (atpH, rpl16, and rps3/rpl22), and the highest Pi value is in rpl16 region. Among the seven divergent regions, six existed in LSC regions and only rps15/ycf1 was in SSC regions (Figure 8).
The nucleotide diversity of two Clethra species shows a lower Pi value compared to other previous analyzed genera [73,74] and indicates evolutionary conservation in the chloroplast genome. The IR regions have lower nucleotide diversity than the LSC and SSC regions similar to other reported results [75,76,77,78] owing to their stability and consistency [79]. Moreover, combining the above results, it is evident that the LSC region is less conserved and has high nucleotide diversity than the other three regions, especially the IR regions. The analysis of nucleotide diversity also deduces that the non-coding regions have higher development and utilization values. More significantly, all these regions could be potential molecular markers for DNA barcodes used in species identification in this genus and future phylogenetic analysis studies of the family Clethraceae.

3.6. Adaptive Evolution Analysis

The ratio of non-synonymous (dN) to synonymous substitutions (dS), dN/dS, has been widely used to evaluate the natural selection pressure and evolution rates of nucleotides in genes [80]. The dN/dS ratio > 1 specifies positive selection (adaptive evolution) while dN/dS ratio < 1 signifies negative selection (purifying evolution). Bayes Empirical Bayes (BEB) and naive empirical Bayes (NEB) analysis were executed to detect positively selected sites using the M8 model based on 80 CDSs of two Clethra species. In the BEB method, only 38 positively selected sites were detected, of which 37 sites represent the ycf1 gene and a site is in the rps4 gene. A total of 107 positively selected sites were detected in the NEB method, which were distributed in ycf1, ycf2, cemA, ndhB, and psbD genes (Table 3). Generally, a few genes have detected as positively selected sites by the analysis either using BEB method or NEB method for analysis, which means that the two Clethra species display less selection pressure and conserved evolution history.

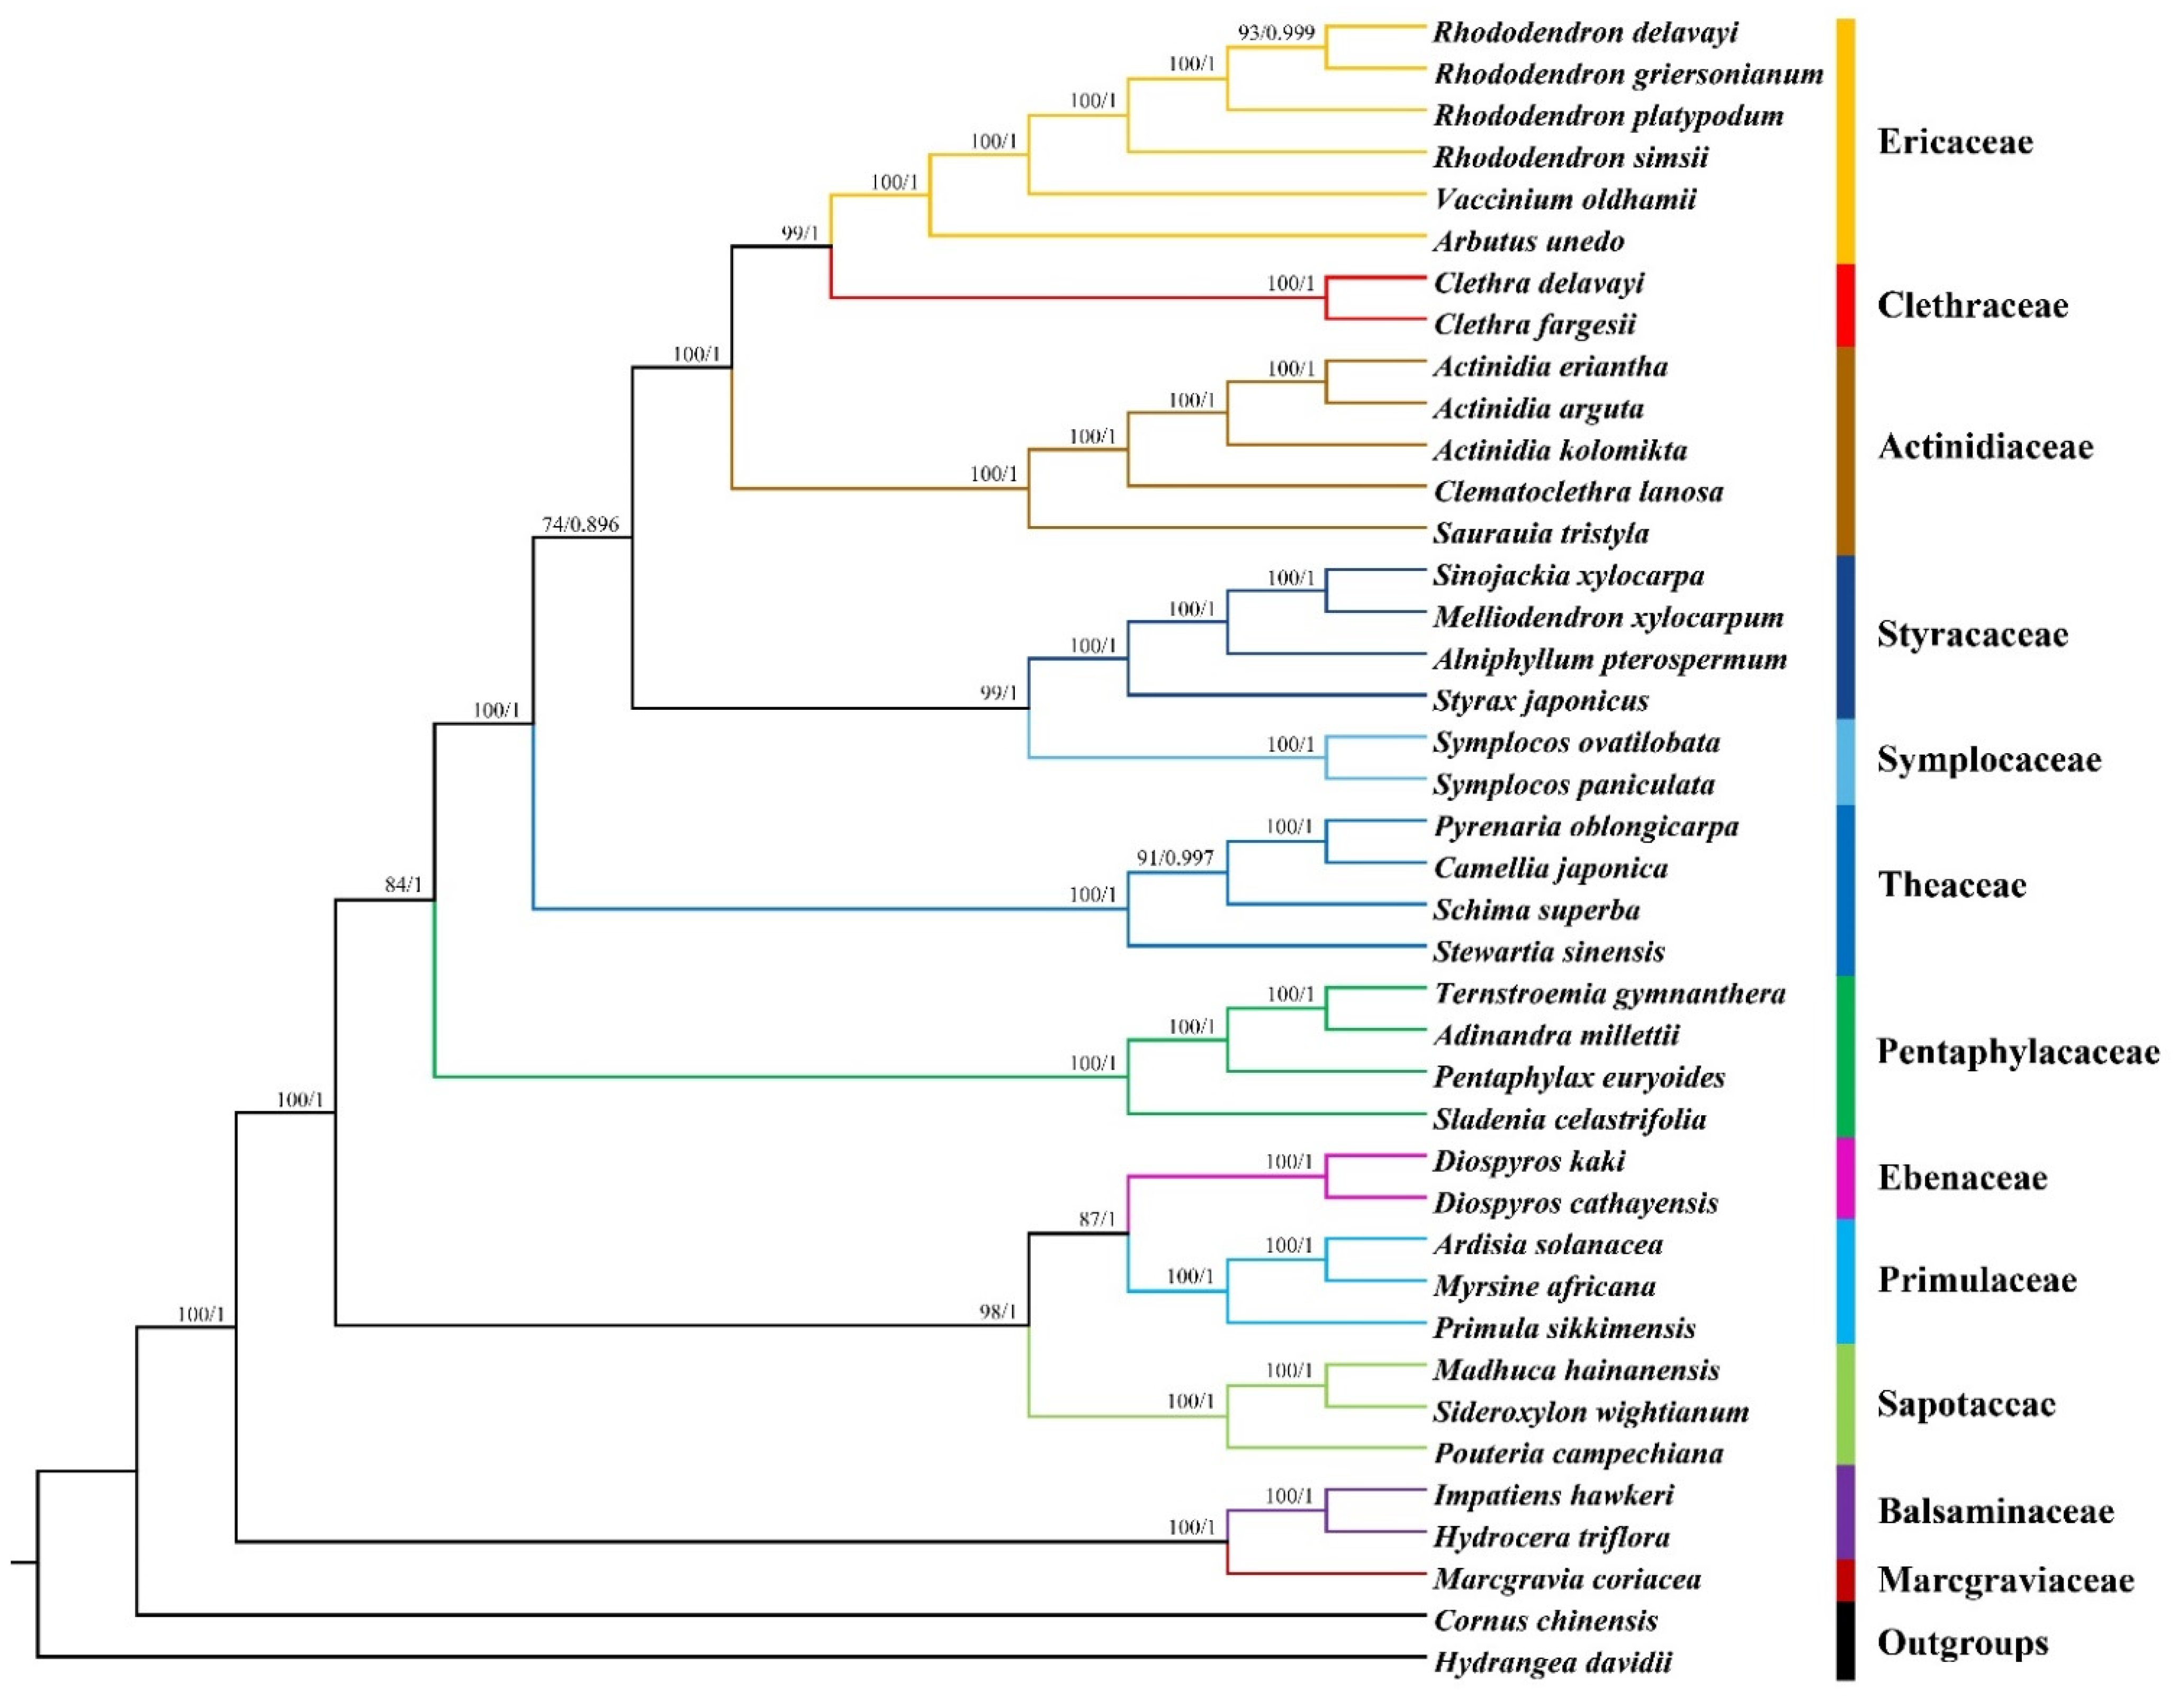
3.7. Phylogenetic Analysis

The chloroplast genome sequences have been widely used to study the evolution and phylogenetic relationships in plants owing to the advance of sequencing technologies [81]. The phylogenetic position of Clethra in Ericales was shown using the 75 chloroplast CDSs of 40 species by combining the ML tree with the BI tree (Figure 9). Both the posterior probabilities values of the BI tree and the bootstrap values of the ML tree are high displayed on the nodes generally. Also, the Clethraceae clade and Ericaceae clade form a sister group. The topological structure is highly consistent with the phylogenetic relationship of Ericales in the APG IV system [55]. In previous morphological classifications, the genus Clethra was removed from the Ericaceae and promoted to a new family Clethraceae closely related with Ericaceae since 1851 [8]. In recent years, molecular systematics study has revealed that Clethraceae has a sister relationship with Cyrillaceae and Ericaceae using molecular data, whether by partial DNA fragments [9,82] or chloroplast genome to construct phylogenetic trees [83]. The stable taxonomic position in Ericales firmly reconfirms the previous deduction of a high degree of the conserved chloroplast genome of Clethra.

4. Conclusions

In this study, we reported the complete chloroplast genome of C. fargesii and comparative analysis for the genome features of Clethra species with closely related species in Ericales for the first time. The number of annotated unique genes was 112, including 80 PCGs, 30 tRNAs, and 4 rRNAs. A total of 73 SSRs and 7 high Pi value sites of nucleotide diversity were identified, which could be useful as potential and exploitable molecular markers. Additionally, we accepted the hypothesis that the chloroplast genomes of Clethra species present a lower variation ratio and conserved evolution history based on the comparative analysis of genome features, genome alignment, junction characteristics, codon usage bias, SSRs, nucleotide diversity, and selection pressure. The phylogenetic analysis revealed that Clethraceae and Ericaceae are sister groups. The stable taxonomic position reconfirms the previous deduction that Clethra species have a highly conserved chloroplast genome, which means that C. fargesii could be used as a reference for annotating the chloroplast genome of other Ericales species. The genome information and above analysis in our study will provide a theoretical basis for future studies of Clethraceae in phylogeny, taxonomy, and biogeography.

Supplementary Materials

The following are available online at https://www.mdpi.com/article/10.3390/f12040441/s1, Table S1: NCBI accession number of 40 chloroplast genomes, Table S2: The gene number of the chloroplast genome of C. fargesii in four regions, Table S3: Comparison of the kinds and length of introns among eight chloroplast genome sequences, Table S4: Comparison of the relative synonymous codon usage (RSCU) among six chloroplast genomes.

Author Contributions

G.H. designed and supervised the study; S.D., X.D., and J.Y. performed the experiment; S.D., B.C., Y.G., and C.G. performed data analysis; S.D. drafted the manuscript; X.D. and J.Y. reviewed the manuscript; G.H. provided funding. All authors have read and agreed to the published version of the manuscript.

Funding

This study got financial support from the funds of the National Science & Technology Fundamental Resources Investigation Program of China (Grant No. 2019FY101807), National Natural Science Foundation of China (31970211), and Sino-Africa Joint Research Center, CAS (SAJC202101).

Institutional Review Board Statement

Not applicable.

Informed Consent Statement

Informed consent was obtained from all subjects involved in the study.

Data Availability Statement

The data presented in this study are available in the article and Supplementary Materials.

Acknowledgments

We sincerely thank to National Wild Plant Germplasm Resource Center for all kinds of support, also to Caifei Zhang for providing useful and precious suggestions related to the data analysis. We also give thanks to Peninah Cheptoo Rono and Elijah Mbandi Mkala for reviewing the manuscript. Thanks to the peer reviewers for their helpful comments on this manuscript.

Conflicts of Interest

The authors declare no conflict of interest.

References

  1. Hu, L.C. Clethraceae. In Flora Reipublicae Popularis Sinicae; Fang, W.P., Hu, W.K., Eds.; Science Press: Beijing, China, 1990; Volume 56, pp. 120–156. [Google Scholar]
  2. Wu, Z.-Y. The areal-types of Chinese genera of seed plants. Acta Bot. Yunnanica 1991, 4, 1–139. [Google Scholar]
  3. Zhu, D.M. Sowing and seedling cultivation of Clethra barbinervis. Pract. For. Technol. 2011, 9, 33–34. [Google Scholar]
  4. Ikeda, H.; Natori, T.; Totsuka, T.; Iwaki, H. High SO2 resistance of Clethra barbinervis established in a smoke-polluted area of Ashio, Tochigi Prefecture, Japan. Ecol. Res. 1992, 7, 363–370. [Google Scholar] [CrossRef]
  5. Yamaji, K.; Watanabe, Y.; Masuya, H.; Shigeto, A.; Yui, H.; Haruma, T. Root fungal endophytes enhance heavy-metal stress tolerance of Clethra barbinervis growing naturally at mining sites via growth enhancement, promotion of nutrient uptake and decrease of heavy-metal concentration. PLoS ONE 2016, 11, e0169089. [Google Scholar] [CrossRef] [Green Version]
  6. Yamaguchi, T.; Takenaka, C.; Tomioka, R. Accumulation of cobalt and nickel in tissues of Clethra barbinervis in a metal dosing trial. Plant Soil 2017, 421, 273–283. [Google Scholar] [CrossRef]
  7. Yamaguchi, T.; Tsukada, C.; Takahama, K.; Hirotomo, T.; Tomioka, R.; Takenaka, C. Localization and speciation of cobalt and nickel in the leaves of the cobalt-hyperaccumulating tree Clethra barbinervis. Trees 2019, 33, 521–532. [Google Scholar] [CrossRef]
  8. Qin, H.N.; Fritsch, P. Clethraceae. In Flora of China; Wu, Z.Y., Raven, P.H., Hong, D.Y., Eds.; Science Press: Beijing, China; Missouri Botanical Garden Press: St. Louis, MO, USA, 2005; Volume 14, pp. 238–241. [Google Scholar]
  9. Anderberg, A.A.; Zhang, X. Phylogenetic relationships of Cyrillaceae and Clethraceae (Ericales) with special emphasis on the genus Purdiaea Planch. Org. Divers. Evol. 2002, 2, 127–137. [Google Scholar] [CrossRef] [Green Version]
  10. Fior, S.; Karis, P.O.; Anderberg, A.A. Phylogeny, taxonomy, and systematic position of Clethra (Clethraceae, Ericales) with notes on biogeography: Evidence from plastid and nuclear DNA sequences. Int. J. Plant Sci. 2003, 164, 997–1006. [Google Scholar] [CrossRef]
  11. Wicke, S.; Schneeweiss, G.M.; dePamphilis, C.W.; Muller, K.F.; Quandt, D. The evolution of the plastid chromosome in land plants: Gene content, gene order, gene function. Plant Mol. Biol. 2011, 76, 273–297. [Google Scholar] [CrossRef] [Green Version]
  12. Daniell, H.; Lin, C.S.; Yu, M.; Chang, W.J. Chloroplast genomes: Diversity, evolution, and applications in genetic engineering. Genome Biol. 2016, 17, 134. [Google Scholar] [CrossRef] [Green Version]
  13. Ravi, V.; Khurana, J.P.; Tyagi, A.K.; Khurana, P. An update on chloroplast genomes. Plant Syst. Evol. 2007, 271, 101–122. [Google Scholar] [CrossRef]
  14. Parks, M.; Cronn, R.; Liston, A. Increasing phylogenetic resolution at low taxonomic levels using massively parallel sequencing of chloroplast genomes. BMC Biol. 2009, 7, 84. [Google Scholar] [CrossRef] [Green Version]
  15. Dobrogojski, J.; Adamiec, M.; Luciński, R. The chloroplast genome: A review. Acta Physiol. Plant. 2020, 42, 98. [Google Scholar] [CrossRef]
  16. Shaw, J.; Lickey, E.B.; Schilling, E.E.; Small, R.L. Comparison of whole chloroplast genome sequences to choose noncoding regions for phylogenetic studies in angiosperms: The tortoise and the hare III. Am. J. Bot. 2007, 94, 275–288. [Google Scholar] [CrossRef] [Green Version]
  17. Moore, M.J.; Bell, C.D.; Soltis, P.S.; Soltis, D.E. Using plastid genome-scale data to resolve enigmatic relationships among basal angiosperms. Proc. Natl. Acad. Sci. USA 2007, 104, 19363–19368. [Google Scholar] [CrossRef] [Green Version]
  18. Liu, Y.C.; Lin, B.Y.; Lin, J.Y.; Wu, W.L.; Chang, C.C. Evaluation of chloroplast DNA markers for intraspecific identification of Phalaenopsis equestris cultivars. Sci. Hortic. 2016, 203, 86–94. [Google Scholar] [CrossRef]
  19. CBOL Plant Working Group. A DNA barcode for land plants. Proc. Natl. Acad. Sci. USA 2009, 10, 12794–12797. [Google Scholar]
  20. Moore, M.J.; Soltis, P.S.; Bell, C.D.; Burleigh, J.G.; Soltis, D.E. Phylogenetic analysis of 83 plastid genes further resolves the early diversification of eudicots. Proc. Natl. Acad. Sci. USA 2010, 107, 4623–4628. [Google Scholar] [CrossRef] [PubMed] [Green Version]
  21. Mardis, E.R. Next-generation sequencing platforms. Annu. Rev. Anal. Chem. 2013, 6, 287–303. [Google Scholar] [CrossRef] [PubMed] [Green Version]
  22. Chase, M.W.; Hills, H.H. Silica gel: An ideal material for field preservation of leaf samples for DNA studies. Taxon 1991, 40, 215–220. [Google Scholar] [CrossRef]
  23. Doyle, J.J. A rapid DNA isolation procedure for small quantities of fresh leaf tissue. Phytochem. Bull. 1987, 19, 11–15. [Google Scholar]
  24. Jin, J.J.; Yu, W.B.; Yang, J.B.; Song, Y.; dePamphilis, C.W.; Yi, T.S.; Li, D.Z. GetOrganelle: A fast and versatile toolkit for accurate de novo assembly of organelle genomes. Genome Biol. 2020, 21, 241. [Google Scholar] [CrossRef] [PubMed]
  25. Wick, R.R.; Schultz, M.B.; Zobel, J.; Holt, K.E. Bandage: Interactive visualization of de novo genome assemblies. Bioinformatics 2015, 31, 3350–3352. [Google Scholar] [CrossRef] [PubMed] [Green Version]
  26. Qu, X.J.; Moore, M.J.; Li, D.Z.; Yi, T.S. PGA: A software package for rapid, accurate, and flexible batch annotation of plastomes. Plant Methods 2019, 15, 50. [Google Scholar] [CrossRef] [PubMed] [Green Version]
  27. Kearse, M.; Moir, R.; Wilson, A.; Stones-Havas, S.; Cheung, M.; Sturrock, S.; Buxton, S.; Cooper, A.; Markowitz, S.; Duran, C.; et al. Geneious basic: An integrated and extendable desktop software platform for the organization and analysis of sequence data. Bioinformatics 2012, 28, 1647–1649. [Google Scholar] [CrossRef] [PubMed]
  28. Zheng, S.; Poczai, P.; Hyvonen, J.; Tang, J.; Amiryousefi, A. Chloroplot an online program for the versatile plotting of organelle genomes. Front. Genet. 2020, 11, 576124. [Google Scholar] [CrossRef]
  29. Darling, A.C.; Mau, B.; Blattner, F.R.; Perna, N.T. Mauve: Multiple alignment of conserved genomic sequence with rearrangements. Genome Res. 2004, 14, 1394–1403. [Google Scholar] [CrossRef] [Green Version]
  30. Kumar, S.; Stecher, G.; Tamura, K. MEGA7: Molecular evolutionary genetics analysis version 7.0 for bigger datasets. Mol. Biol. Evol. 2016, 33, 1870–1874. [Google Scholar] [CrossRef] [Green Version]
  31. Thiel, T.; Michalek, W.; Varshney, R.K.; Graner, A. Exploiting EST databases for the development and characterization of gene-derived SSR-markers in barley (Hordeum vulgare L.). Theor. Appl. Genet. 2003, 106, 411–422. [Google Scholar] [CrossRef]
  32. Beier, S.; Thiel, T.; Munch, T.; Scholz, U.; Mascher, M. MISA-web: A web server for microsatellite prediction. Bioinformatics 2017, 33, 2583–2585. [Google Scholar] [CrossRef] [Green Version]
  33. Librado, P.; Rozas, J. DnaSP v5: A software for comprehensive analysis of DNA polymorphism data. Bioinformatics 2009, 25, 1451–1452. [Google Scholar] [CrossRef] [Green Version]
  34. Yang, Z. PAML 4: Phylogenetic analysis by maximum likelihood. Mol. Biol. Evol. 2007, 24, 1586–1591. [Google Scholar] [CrossRef] [Green Version]
  35. Gao, F.; Chen, C.; Arab, D.A.; Du, Z.; He, Y.; Ho, S.Y.W. EasyCodeML: A visual tool for analysis of selection using CodeML. Ecol. Evol. 2019, 9, 3891–3898. [Google Scholar] [CrossRef] [Green Version]
  36. Katoh, K.; Standley, D.M. MAFFT multiple sequence alignment software version 7: Improvements in performance and usability. Mol. Biol. Evol. 2013, 30, 772–780. [Google Scholar] [CrossRef] [PubMed] [Green Version]
  37. Yang, Z.; Wong, W.S.; Nielsen, R. Bayes empirical bayes inference of amino acid sites under positive selection. Mol. Biol. Evol. 2005, 22, 1107–1118. [Google Scholar] [CrossRef] [PubMed] [Green Version]
  38. Talavera, G.; Castresana, J. Improvement of phylogenies after removing divergent and ambiguously aligned blocks from protein sequence alignments. Syst. Biol. 2007, 56, 564–577. [Google Scholar] [CrossRef] [PubMed] [Green Version]
  39. Kalyaanamoorthy, S.; Minh, B.Q.; Wong, T.K.F.; von Haeseler, A.; Jermiin, L.S. ModelFinder: Fast model selection for accurate phylogenetic estimates. Nat. Methods 2017, 14, 587–589. [Google Scholar] [CrossRef] [PubMed] [Green Version]
  40. Ronquist, F.; Teslenko, M.; van der Mark, P.; Ayres, D.L.; Darling, A.; Hohna, S.; Larget, B.; Liu, L.; Suchard, M.A.; Huelsenbeck, J.P. MrBayes 3.2: Efficient Bayesian phylogenetic inference and model choice across a large model space. Syst. Biol. 2012, 61, 539–542. [Google Scholar] [CrossRef] [PubMed] [Green Version]
  41. Guindon, S.; Dufayard, J.F.; Lefort, V.; Anisimova, M.; Hordijk, W.; Gascuel, O. New algorithms and methods to estimate maximum-likelihood phylogenies: Assessing the performance of PhyML 3.0. Syst. Biol. 2010, 59, 307–321. [Google Scholar] [CrossRef] [Green Version]
  42. Minh, B.Q.; Nguyen, M.A.; von Haeseler, A. Ultrafast approximation for phylogenetic bootstrap. Mol. Biol. Evol. 2013, 30, 1188–1195. [Google Scholar] [CrossRef] [PubMed]
  43. Nguyen, L.T.; Schmidt, H.A.; von Haeseler, A.; Minh, B.Q. IQ-TREE: A fast and effective stochastic algorithm for estimating maximum-likelihood phylogenies. Mol. Biol. Evol. 2015, 32, 268–274. [Google Scholar] [CrossRef]
  44. Zhang, D.; Gao, F.; Jakovlić, I.; Zou, H.; Zhang, J.; Li, W.X.; Wang, G.T. PhyloSuite: An integrated and scalable desktop platform for streamlined molecular sequence data management and evolutionary phylogenetics studies. Mol. Ecol. Resour. 2019, 20, 348–355. [Google Scholar] [CrossRef]
  45. He, Y.; Xiao, H.; Deng, C.; Xiong, L.; Yang, J.; Peng, C. The complete chloroplast genome sequences of the medicinal plant Pogostemon cablin. Int. J. Mol. Sci. 2016, 17, 820. [Google Scholar] [CrossRef] [Green Version]
  46. Shen, X.; Wu, M.; Liao, B.; Liu, Z.; Bai, R.; Xiao, S.; Li, X.; Zhang, B.; Xu, J.; Chen, S. Complete chloroplast genome sequence and phylogenetic analysis of the medicinal plant Artemisia annua. Molecules 2017, 22, 1330. [Google Scholar] [CrossRef]
  47. Necsulea, A.; Lobry, J.R. A new method for assessing the effect of replication on DNA base composition asymmetry. Mol. Biol. Evol. 2007, 24, 2169–2179. [Google Scholar] [CrossRef] [PubMed] [Green Version]
  48. Kim, S.-C.; Baek, S.-H.; Lee, J.-W.; Hyun, H.J. Complete chloroplast genome of Vaccinium oldhamii and phylogenetic analysis. Mitochondrial DNA B 2019, 4, 902–903. [Google Scholar] [CrossRef] [Green Version]
  49. Liu, D.; Fu, C.; Yin, L.; Ma, Y. Complete plastid genome of Rhododendron griersonianum, a critically endangered plant with extremely small populations (PSESP) from southwest China. Mitochondrial DNA B 2020, 5, 3086–3087. [Google Scholar] [CrossRef] [PubMed]
  50. Wakasugi, T.; Tsudzuki, T.; Sugiura, M. The genomics of land plant chloroplasts: Gene content and alteration of genomic information by RNA editing. Photosynth. Res. 2001, 70, 107–118. [Google Scholar] [CrossRef] [PubMed]
  51. Kahlau, S.; Aspinall, S.; Gray, J.C.; Bock, R. Sequence of the tomato chloroplast DNA and evolutionary comparison of solanaceous plastid genomes. J. Mol. Evol. 2006, 63, 194–207. [Google Scholar] [CrossRef] [PubMed]
  52. Xu, J.; Feng, D.; Song, G.; Wei, X.; Chen, L.; Wu, X.; Li, X.; Zhu, Z. The first intron of rice EPSP synthase enhances expression of foreign gene. Sci. China Life Sci. 2003, 46, 561–569. [Google Scholar] [CrossRef]
  53. Li, X.; Zuo, Y.; Zhu, X.; Liao, S.; Ma, J. Complete chloroplast genomes and comparative analysis of sequences evolution among seven Aristolochia (Aristolochiaceae) medicinal species. Int. J. Mol. Sci. 2019, 20, 1045. [Google Scholar] [CrossRef] [PubMed] [Green Version]
  54. Souza, U.J.B.D.; Vitorino, L.C.; Bessa, L.A.; Silva, F.G. The complete plastid genome of Artocarpus camansi: A high degree of conservation of the plastome structure in the family Moraceae. Forests 2020, 11, 1179. [Google Scholar] [CrossRef]
  55. The Angiosperm Phylogeny Group. An update of the Angiosperm Phylogeny Group classification for the orders and families of flowering plants: APG IV. Bot. J. Linn. Soc. 2016, 181, 1–20. [Google Scholar] [CrossRef] [Green Version]
  56. Martin, W.; Herrmann, R.G. Gene transfer from organelles to the nucleus: How much, what happens, and why? Plant Physiol. 1998, 118, 9–17. [Google Scholar] [CrossRef] [PubMed] [Green Version]
  57. Martin, W. Gene transfer from organelles to the nucleus: Frequent and in big chunks. Proc. Natl. Acad. Sci. USA 2003, 100, 8612–8614. [Google Scholar] [CrossRef] [Green Version]
  58. Chung, H.J.; Jung, J.D.; Park, H.W.; Kim, J.H.; Cha, H.W.; Min, S.R.; Jeong, W.J.; Liu, J.R. The complete chloroplast genome sequences of Solanum tuberosum and comparative analysis with Solanaceae species identified the presence of a 241-bp deletion in cultivated potato chloroplast DNA sequence. Plant Cell Rep. 2006, 25, 1369–1379. [Google Scholar] [CrossRef]
  59. Timme, R.E.; Kuehl, J.V.; Boore, J.L.; Jansen, R.K. A comparative analysis of the Lactuca and Helianthus (Asteraceae) plastid genomes identification of divergent regions and categorization of shared repeats. Am. J. Bot. 2007, 94, 302–312. [Google Scholar] [CrossRef]
  60. Dugas, D.V.; Hernandez, D.; Koenen, E.J.; Schwarz, E.; Straub, S.; Hughes, C.E.; Jansen, R.K.; Nageswara-Rao, M.; Staats, M.; Trujillo, J.T.; et al. Mimosoid legume plastome evolution: IR expansion, tandem repeat expansions, and accelerated rate of evolution in clpP. Sci. Rep. 2015, 5, 16958. [Google Scholar] [CrossRef] [Green Version]
  61. Li, Y.; Sylvester, S.P.; Li, M.; Zhang, C.; Li, X.; Duan, Y.; Wang, X. The complete plastid genome of Magnolia zenii and genetic comparison to Magnoliaceae species. Molecules 2019, 24, 261. [Google Scholar] [CrossRef] [Green Version]
  62. Munyao, J.N.; Dong, X.; Yang, J.X.; Mbandi, E.M.; Wanga, V.O.; Oulo, M.A.; Saina, J.K.; Musili, P.M.; Hu, G.W. Complete chloroplast genomes of Chlorophytum comosum and Chlorophytum gallabatense: Genome structures, comparative and phylogenetic analysis. Plants 2020, 9, 296. [Google Scholar] [CrossRef] [Green Version]
  63. Li, D.M.; Zhu, G.F.; Xu, Y.C.; Ye, Y.J.; Liu, J.M. Complete chloroplast genomes of three medicinal Alpinia Species: Genome organization, comparative analyses and phylogenetic relationships in family Zingiberaceae. Plants 2020, 9, 286. [Google Scholar] [CrossRef] [PubMed] [Green Version]
  64. Provan, J.; Powell, W.; Hollingsworth, P.M. Chloroplast microsatellites: New tools for studies in plant ecology and evolution. Trends Ecol. Evol. 2001, 16, 142–147. [Google Scholar] [CrossRef]
  65. Oulo, M.A.; Yang, J.X.; Dong, X.; Wanga, V.O.; Mkala, E.M.; Munyao, J.N.; Onjolo, V.O.; Rono, P.C.; Hu, G.W.; Wang, Q.F. Complete chloroplast genome of Rhipsalis baccifera, the only cactus with natural distribution in the old world: Genome rearrangement, intron gain and loss, and implications for phylogenetic studies. Plants 2020, 9, 979. [Google Scholar] [CrossRef]
  66. Jiang, K.; Miao, L.Y.; Wang, Z.W.; Ni, Z.Y.; Hu, C.; Zeng, X.H.; Huang, W.C. Chloroplast genome analysis of two medicinal coelogyne spp. (Orchidaceae) shed light on the genetic information, comparative genomics, and species identification. Plants 2020, 9, 1332. [Google Scholar] [CrossRef] [PubMed]
  67. Guo, X.L.; Zheng, H.Y.; Price, M.; Zhou, S.D.; He, X.J. Phylogeny and comparative analysis of Chinese Chamaesium species revealed by the complete plastid genome. Plants 2020, 9, 965. [Google Scholar] [CrossRef]
  68. Li, X.; Li, Y.; Zang, M.; Li, M.; Fang, Y. Complete chloroplast genome sequence and phylogenetic analysis of Quercus acutissima. Int. J. Mol. Sci. 2018, 19, 2443. [Google Scholar] [CrossRef] [Green Version]
  69. Liu, H.; Hu, H.; Zhang, S.; Jin, J.; Liang, X.; Huang, B.; Wang, L. The complete chloroplast genome of the rare species Epimedium tianmenshanensis and comparative analysis with related species. Physiol. Mol. Biol. Plants 2020, 26, 2075–2083. [Google Scholar] [CrossRef]
  70. Park, J.; Xi, H.; Kim, Y. The complete chloroplast genome of Arabidopsis thaliana isolated in Korea (Brassicaceae): An investigation of intraspecific variations of the chloroplast genome of Korean A. thaliana. Int. J. Genom. 2020, 2020, 3236461. [Google Scholar] [CrossRef] [PubMed]
  71. Zhou, T.; Ruhsam, M.; Wang, J.; Zhu, H.; Li, W.; Zhang, X.; Xu, Y.; Xu, F.; Wang, X. The complete chloroplast genome of Euphrasia regelii, pseudogenization of ndh genes and the phylogenetic relationships within Orobanchaceae. Front. Genet. 2019, 10, 444. [Google Scholar] [CrossRef] [Green Version]
  72. Wu, L.; Nie, L.; Xu, Z.; Li, P.; Wang, Y.; He, C.; Song, J.; Yao, H. Comparative and phylogenetic analysis of the complete chloroplast genomes of three Paeonia Section moutan species (Paeoniaceae). Front. Genet. 2020, 11, 980. [Google Scholar] [CrossRef]
  73. Yu, X.Q.; Drew, B.T.; Yang, J.B.; Gao, L.M.; Li, D.Z. Comparative chloroplast genomes of eleven Schima (Theaceae) species: Insights into DNA barcoding and phylogeny. PLoS ONE 2017, 12, e0178026. [Google Scholar] [CrossRef] [Green Version]
  74. Li, D.M.; Ye, Y.J.; Xu, Y.C.; Liu, J.M.; Zhu, G.F. Complete chloroplast genomes of Zingiber montanum and Zingiber zerumbet: Genome structure, comparative and phylogenetic analyses. PLoS ONE 2020, 15, e0236590. [Google Scholar] [CrossRef]
  75. Khakhlova, O.; Bock, R. Elimination of deleterious mutations in plastid genomes by gene conversion. Plant J. 2006, 46, 85–94. [Google Scholar] [CrossRef] [PubMed]
  76. Li, X.; Gao, H.; Wang, Y.; Song, J.; Henry, R.; Wu, H.; Hu, Z.; Yao, H.; Luo, H.; Luo, K.; et al. Complete chloroplast genome sequence of Magnolia grandiflora and comparative analysis with related species. Sci. China Life Sci. 2013, 56, 189–198. [Google Scholar] [CrossRef] [PubMed] [Green Version]
  77. Cheng, H.; Li, J.; Zhang, H.; Cai, B.; Gao, Z.; Qiao, Y.; Mi, L. The complete chloroplast genome sequence of strawberry (Fragaria x ananassa Duch.) and comparison with related species of Rosaceae. PeerJ 2017, 5, e3919. [Google Scholar] [CrossRef] [Green Version]
  78. Li, D.M.; Zhao, C.Y.; Liu, X.F. Complete chloroplast genomesequences of Kaempferia galanga and Kaempferia elegans: Molecular structures and comparative analysis. Molecules 2019, 24, 474. [Google Scholar] [CrossRef] [PubMed] [Green Version]
  79. Souza, U.J.B.; Nunes, R.; Targueta, C.P.; Diniz-Filho, J.A.F.; Telles, M.P.C. The complete chloroplast genome of Stryphnodendron adstringens (Leguminosae-Caesalpinioideae): Comparative analysis with related Mimosoid species. Sci. Rep. 2019, 9, 14206. [Google Scholar] [CrossRef] [PubMed]
  80. Yang, Z.; Nielsen, R. Estimating synonymous and nonsynonymous substitution rates under realistic evolutionary models. Mol. Biol. Evol. 2000, 17, 32–43. [Google Scholar] [CrossRef] [Green Version]
  81. Tonti-Filippini, J.; Nevill, P.G.; Dixon, K.; Small, I. What can we do with 1000 plastid genomes? Plant J. 2017, 90, 808–818. [Google Scholar] [CrossRef] [Green Version]
  82. Anderberg, A.A.; Rydin, C.; Kallersjo, M. Phylogenetic relationships in the order Ericales s.l.: Analyses of molecular data from five genes from the plastid and mitochondrial genomes. Am. J. Bot. 2002, 89, 677–687. [Google Scholar] [CrossRef]
  83. Yan, M.; Fritsch, P.W.; Moore, M.J.; Feng, T.; Meng, A.; Yang, J.; Deng, T.; Zhao, C.; Yao, X.; Sun, H.; et al. Plastid phylogenomics resolves infrafamilial relationships of the Styracaceae and sheds light on the backbone relationships of the Ericales. Mol. Phylogenet. Evol. 2018, 121, 198–211. [Google Scholar] [CrossRef] [PubMed]
Figure 1. Circular chloroplast genome map of C. fargesii. Genes drawn inside the circle are transcribed counter-clockwise and those outside are clockwise. Genes of different functional groups are colored by different colors. The darker gray in the inner circle corresponds to the DNA GC content, while the lighter gray corresponds to the DNA AT content.
Forests 12 00441 g001
Figure 2. Comparison of the chloroplast genome structures among eight species. Within the alignments, local collinear blocks are represented as blocks of similar color connected with lines. The DNA fragments above the line are corresponding to the clockwise direction and those below the line are counterclockwise direction.
Forests 12 00441 g002
Figure 3. Comparison of the borders of large single-copy (LSC), small single-copy (SSC), and inverted repeat (IR) regions among six chloroplast genomes.
Forests 12 00441 g003
Figure 4. Relative synonymous codon usage (RSCU) value of 20 amino acid and stop codon of C. fargesii in protein-coding regions. The colors of the histograms are corresponding to the colors of codons.
Forests 12 00441 g004
Figure 5. Amino acid proportion in protein-coding sequences among six chloroplast genomes in Ericales order. The histogram from the left-hand side of each amino acid shows codon usage bias (from left to right: C. fargesii, C. delavayi, S. tristyla, A. eriantha, S. japonicus, and S. superba).
Forests 12 00441 g005
Figure 6. Distribution of simple sequence repeats (SSRs) detected in the chloroplast genome of C. fargesii and C. delavayi. (A) The number and proportion of SSR types; (B) the number and proportion of SSRs in LSC, SSC, and IR regions; (C) and the number and proportion of SSRs in coding sequence (CDS) and non-coding regions.
Forests 12 00441 g006
Figure 7. The number of different SSR units in the chloroplast genome of C. fargesii and C. delavayi.
Forests 12 00441 g007
Figure 8. Nucleotide diversity of the chloroplast genomes of two Clethra species.
Forests 12 00441 g008
Figure 9. The phylogenetic tree is based on the 75 chloroplast protein-coding sequences of 40 species using maximum likelihood (ML) and Bayesian (BI) methods. The ML tree is consistent with the BI tree in topological structure. The ML bootstrap values/Bayesian posterior probabilities are displayed on the nodes.
Forests 12 00441 g009
Table 1. Features of the complete chloroplast genomes of C. fargesii and seven related species in Ericales order.
Genome FeaturesClethra fargesii Franch.Clethra delavayi Franch.Rhododendron griersonianum Balf. F. et ForrestVaccinium oldhamii MiquelSaurauia tristyla DC.Actinidia eriantha Benth.Styrax japonicus Sieb. et Zucc.Schima superba Gardn. et Champ.
Total size (bp)157,486157,253206,467173,245156,676156,964157,929157,254
LSC size (bp)87,03486,870108,922105,49888,27488,63987,54087,202
SSC size (bp)18,49218,4692611306720,48220,54118,28118,100
IR size (bp)25,98025,95747,46732,3402396023,89226,05425,976
Total GC (%)37.337.435.836.836.937.237.037.4
LSC of GC (%)35.435.435.335.835.235.434.835.5
SSC of GC (%)30.730.830.029.230.631.130.330.8
IR of GC (%)43.043.036.538.742.943.642.942.8
Total genes132132150130132132132132
Unique genes114114118108113113114114
PCGs8787958584848787
tRNA genes3737473739393737
rRNA genes88888888
Duplicated PCGs7717115577
Unique PCGs8080787479798080
Table 2. List of the annotated genes in the chloroplast genomes of C. fargesii.
CategoryGroups of GenesName of Genes
Self-replicationRibosomal RNArrn4.5c, rrn5c, rrn16c, rrn23c
Transfer RNAtrnA-UGCa,c, trnC-GCA, trnD-GUC, trnE-UUC, trnF-GAA, trnG-GCC, trnG-UCCa, trnH-GUG, trnI-CAUc, trnI-GAU a,c, trnK-UUUa, trnL-CAAc, trnL-UAAa, trnL-UAG, trnM-CAU, trnfM-CAU, trnN-GUUc, trnP-UGG, trnQ-UUG, trnR-UCU, trnR-ACGc, trnS-UGA, trnS-GCU, trnS-GGA, trnT-GGU, trnT-UGU, trnV-UACa, trnV-GACc, trnW-CCA, trnY-GUA
Small subunit of ribosomerps2, rps3, rps4, rps7c, rps8, rps11, rps12a,c, rps14, rps15, rps16a, rps18, rps19
Large subunit of ribosomerpl2a,c, rpl14, rpl16a, rpl20, rpl22, rpl23c, rpl32, rpl33, rpl36
RNA polymerase subunitsrpoA, rpoB, rpoC1a, rpoC2
PhotosynthesisPhotosystem IpasA, pasB, pasC, pasI, pasJ
Photosystem IIpsbA, psbB, psbC, psbD, psbE, psbF, psbH, psbI, psbJ, psbK, psbL, psbM, psbN, psbT, psbZ
Subunits of cytochromepetA, petBa, petDa, petG, petL, petN
ATP synthaseatpA, atpB, atpE, atpFa, atpH, atpI
NADH-dehydrogenasendhAa, ndhBa,c, ndhC, ndhD, ndhE, ndhF, ndhG, ndhH, ndhI, ndhJ, ndhK
Other genesRubisco large subunitrbcL
Translational initiation factorinfA
Maturase KmatK
Envelope membrane proteincemA
Acetyl-CoA carboxylaseaccD
ProteolysisclpPb
Cytochrome c biogenesisccsA
Conserved open reading framesycf1, ycf2c, ycf3b, ycf4, ycf15c
a, genes with one intron; b, genes with two introns; c, two gene copied in IR regions.
Table 3. Positively selected sites detected based on the coding sequences (CDSs) of C. fargesii and C. delavayi.
M8Gene NameRegionSelected SitesPr (w > 1)Number of Selected Sites
Bayes Empirical Bayes (BEB)ycf1SSC3027 I/3113 Y0.953 */1.000 **37
rps4LSC7916 P0.993 **1
Naive Empirical Bayes (NEB)ycf1SSC2544 P/3119 E1.000 **74
ycf2IR5115 F/6946 V1.000 **7
cemALSC12302 T/12375A1.000 **6
ndhBIR13905 I/14140 E1.000 **19
psbDLSC20701 S1.000 **1
*: p > 95%; **: p > 99%.
Publisher’s Note: MDPI stays neutral with regard to jurisdictional claims in published maps and institutional affiliations.

