Abstract
The aim of the paper was to compare young silver birch (Betula pendula Roth.) and Norway spruce (Picea abies L. Karst) growing at the identical site, from the point of contribution of tree components to their aboveground biomass stock, their wood density, radial increment and aboveground biomass production. Our research activities were performed in the High Tatra Mts., which belong to the Tatra National Park (TANAP), Northern Slovakia. Currently, the substantial part of the TANAP territory is covered by post-disturbance young forests which have been growing there since the large-scale windstorm episode in November 2004. Our study combined non-destructive repeated tree measurements performed at two transects in 2016–2020, with destructive tree sampling of twenty 14-year-old individuals for each species. From the gathered data, we derived models estimating standing stock and annual production of aboveground biomass in individual tree components (foliage, branches, stem bark and stem wood), using diameter at breast height (DBH) as a predictor. The results showed contrasting contributions of tree compartments to aboveground biomass stock between birch and spruce. While spruce trees had four times higher contribution of foliage than birches, the reverse situation (1.5-fold difference) was observed for stem over bark biomass. At the same time, birch trees had a 40% greater diameter increment and a 30% denser stem wood than spruce. As for aboveground biomass production, the contribution of the stem as an economically important component was greater in birch than spruce. The results suggest that, in the young growth stage, birch may be advantageous over spruce in both ecological and production properties. Therefore, we believe that strengthening research activities focused on birch ecology and production issues would bring practical recommendations for better utilization of this tree species in forestry and wood-processing industry sectors
1. Introduction
Windstorms cause serious damages to forests in most European countries, especially in Western, Central and Northern Europe [1]. Its impact is evident also in the Western Carpathians (mostly situated in Slovakia), where the area of damaged forests by windstorms accompanied by bark beetle outbreaks has a gradually increasing tendency especially since the beginning of the new millennium [2]. Generally, increasing frequency of strong winds and their growing impacts on forests in these European regions are mostly interpreted as an inherent phenomenon of climate change [3] and accumulating amount of aboveground tree biomass [4], which can together with some other aspects worsen forest stability [5]. The main consequence of recent windstorm disturbances is the increasing windthrown area, later covered by young forests. This is the principal reason why current scientific attention should focus on post-disturbance areas and forest development to a larger extent than in the past.
Under the conditions of boreal and temperate Europe, Norway spruce (Picea abies L. Karst) is considered the tree species most prone to wind damage [6]. At the same time, the species has long been economically extremely important [7]. Since the regeneration potential of this species is usually high (thanks to seed-producing survivors after disturbance and well-dispersing and germinating seeds), spruce trees often dominate in species composition of young post-disturbance forests [8]. At the same time, in disturbed forest areas, seeds of different species—especially light-demanding, are granted an opportunity to germinate and cover the open soil surface [9]. In the case of large-scale disturbances, “pioneer tree species” play an important role in forest regeneration, which are in Slovakia especially silver birch (Betula pendula Roth.), goat willow (Salix caprea L.) and common rowan (Sorbus aucuparia L.; see for instance Konôpka et al. [10]).
On the Slovak forests, the largest windstorm disaster occurred on 19 November 2004 [11]. The negative feature of the episode was that the epicentre of wind destruction was located in the Tatra National Park (TANAP), which is the oldest and most famous national park in Slovakia. At that time, wind damaged nearly 130 km2 of forests dominated by Norway spruce [12]. Our previous work [13] indicated that Norway spruce and birches (Betula sp.), especially silver birch (B. pendula Roth.), were most frequent and most contributing tree species to forest biomass stock in the post-disturbance area of TANAP. These two species have very contrasting qualities, out of which some are well-known, such as foliage traits (leaves vs. needles, deciduous vs. evergreen), lifespan, ecological demands (e.g., drought and light tolerance). Due to the above-mentioned differences, we assume that the species differ also in biomass production and allocation, which have not been examined in the form of an inter-specific comparative study yet.
We investigated these two tree species under post-disturbance conditions because both prominently contribute to forest regeneration [13] and thanks to their contrasting properties they may complement each other at the mutual site. For instance, since in initial developmental stages birch grows faster and tolerates extreme climatic conditions better than spruce [14], birch trees often create a “shelter” and make favorable conditions for spruce growth [15]. Although unlike in Northern Europe birch species are not important for commercial purposes in Slovakia, their ecological advantages, as well as their production potential, can be exploited in the context of disturbances and global warming environment (e.g., see Reference [7]). Previous works showed that in early developmental stages birches are usually more productive than most other forest tree species on post-disturbance [13] or former agricultural lands [16,17]. Wood of birches, but also of other pioneer tree species regenerated on disturbed areas, will very probably become a source of supply for production of renewable energy [18]. This may reduce demands for wood of “traditional” commercial tree species, such as Norway spruce.
Thanks to fast growth, birches can play an important role in carbon sequestration at sites where other tree species hardly survive. Experience from Scandinavian and Baltic countries [19,20] suggests that birches can be economically relevant species with a variety of utilization possibilities. According to Tiebel et al. [21], renewed interest in silver birch has been recently raised with regard to forest management at higher altitudes. The main reason for it is the ability of birch to promptly and extensively re-colonize post-disturbance areas (mostly after windfalls and bark beetle outbreaks), which is an extremely important quality in the context of the increased risk of catastrophic events in European spruce-dominant forests. At the same time, such a development creates conditions for mixed forests stands with higher species richness. Likely, Norway spruce might be then preferred exclusively only on autochthonous sites, i.e., at high altitudes with mostly sufficiency of precipitation. That is besides other ecological aspects important in terms of the ongoing climate change [22].
The aim of the paper was to compare contribution of tree components to aboveground biomass between silver birch and Norway spruce growing at the identical site, specifically in the post-disturbance area of TANAP. Further, we focused on the inter-specific comparisons from the point of their wood density, diameter increment and aboveground biomass production. The main mission of our study was to widen the knowledge base related to the potential (especially in wood production and carbon sequestration) of silver birch as an alternative or additive species to Norway spruce in young forest growth stages.
2. Materials and Methods
2.1. Research Site and Transects
Our field activities were performed in the High Tatra Mts., which are a part of TANAP, Northern Slovakia. The bedrock of the High Tatra Mts. is predominantly represented by granodiorites sediments. The soils in the mountains are mostly lithic leptosols, cambisoils and podzols. The climate is typically cold with annual mean temperature around 5.0 °C, annual precipitation totals over 1000 mm, and snow cover of nearly 120 days.
Currently, the main part of the TANAP territory is covered by post-disturbance forests which have been growing there since the large-scale windstorm episode on 19 November 2004. On that day, the wind destroyed spruce-dominated forests at elevations from 700 to 1400 m a.s.l. The destroyed forests occurred within 3–5 km wide and nearly 35 km long belt [13]. The forest stands inside the windstorm epicenter were almost completely destroyed (more often uprooted than stem-broken) except for a few forest clusters dominated by European larch (Larix decidua Mill.) and Scots pine (Pinus sylvestris L.).
Post-disturbance management was differentiated based on the degree of nature protection: from salvaging all amount of merchantable wood in the parts with the lower degree of nature protection, through partial processing of calamity wood, up to complete exclusion of salvage harvesting with exclusive natural succession in the parts under the higher degree of nature protection. The substantial amount of the calamity wood was logged during the years 2005–2006. Similarly, various approaches were implemented for reforestation respecting the degree of nature protection. While natural regeneration was generally preferred, combined natural and artificial reforestation occurred at some sites, and in a few exceptional cases forests were reforested exclusively by tree planting.
Our research started in 2016 (i.e., twelve years after the wind disturbance), when the area was prevailingly covered by young forests that originated from both natural regeneration and planting. Open areas that occurred within the young forest stands were overgrown by other plant species adapted to forest clearings, particularly by grasses, herbs, and shrubs. To acquire the information on tree characteristics, two research transects—one near the site called “Danielov dom” (hereinafter as DD transect) and another one close to the village of Horný Smokovec (HS transect) were established. The forests at these localities are managed by the State Forests of the Tatra National Park. Both sites belong to the territory with the lowest degree of nature protection. Hence, the post-disturbance management at these sites was performed as full-area processing of calamity wood and combined (tree planting and natural regeneration) reforestation. Actually, the entire forest management, i.e., from forest regeneration to harvest, in this area is very close to “ordinary” forestry approaches in Slovakia promoting both wood production and other ecosystem services. On the other hand, forest management is limited or fully excluded only in the core area of the Tatra National Park (not our case), specifically at high altitudes typical with alpine vegetation, and in deep valleys with old-growth forests.
Both transects are located in the central part of the wind-disturbed belt. Their orientations are from Northwest to Southeast. The altitudes of the DD and HS transects varied from 970 to 1000 m a.s.l and between 920 and 950 m a.s.l., respectively. The transects are 4 m wide and 300 m long. Detailed data from both transects have already been analyzed in our previous works, which thoroughly describe their stand properties [13,23].
For our current study we used only data covering tree heights and stem breast diameters (diameter at breast height (DBH)) of Norway spruce and silver birch trees with DBH ≥ 7.0 cm. The minimum DBH of 7 cm was chosen since in Slovak forestry this dimension is a standard threshold used in forestry evidence to calculate stand stock of merchantable wood and other related forest characteristics. Tree heights were measured with a hypsometer TruPulse 360°R with a precision of ±0.1 m, and DBH with a digital caliper Masser BT, precision ± 0.1 mm. The data on tree heights and DBHs of spruce and birch trees measured in the years 2016, 2017, 2018, 2019 and 2020 were utilized for further calculation and modeling. Since additional trees reached the DBH limit of 7 cm in consecutive years, the set of measured trees inter-annually increased (Table 1). While in 2016, 114 birches and 42 spruces were measured, in 2020 we measured 153 birch and 227 spruce trees. Here we would like to point out that both measured and sampled trees (described in the following chapter) represented the upper tree layer of stands. At the same time, it is necessary to note that trees did not create a closed canopy, but rather sparse forests with mild crown competition.

Table 1.
Basic tree characteristics of silver birch and Norway spruce trees measured in the years 2016–2020. Standard deviations are shown in parentheses.
2.2. Aboveground Tree Biomass Sampling
At the end of 2019 growing season, i.e., nearly 15 years after the wind disturbance, destructive collection of aboveground tree biomass was performed. We selected 20 spruce and 20 birch trees with predominant, dominant or co-dominant social position (Kraft classes [24]) growing in the surrounding of the DD transect. Each selected tree was cut with a chain saw at the ground level. Tree age was determined as number of annual tree rings visible on the cross section of the stem base. Tree height and DBH were measured with metal measuring roller (precision of ±1 mm) and a digital caliper Masser BT (precision of ±0.01 mm). Then, branches with foliage were cut off from the stem and the stem was divided into 100 cm–long sections. These components were packed separately to labeled paper bags and transported to laboratory.
In laboratory, diameters of stem sections were measured with a digital caliper (precision of ±0.01 mm) at both ends in two perpendicular directions. Bark was peeled off from stems with a knife, and diameters of stem wood were measured in the same way as before debarking. Stem wood and stem bark of individual trees were packed in labeled paper bags and dried in a large-capacity drying oven, Komeg KOV-1500L, to reach the constant weight (under a temperature of 95 °C for 120 h). Dry material of stem wood and bark was weighed by using a digital scale, Radwag, WLT 3/6/X (precision of ±0.1 g). Branches with foliage were left in a well-ventilated room for a couple of weeks. Then, foliage was manually separated from branches (nearly all spruce needles and a part of birch leaves shed from branches themselves). Foliage and branches were dried in the drying machine, to reach the constant weight (under a temperature of 95 °C for 96 and 72 h for foliage and branches, respectively) and weighed.
2.3. Calculations, Modeling and Statistical Approach
Stem volumes under and over bark (VSUB, VSOB) were calculated for each sampled tree as a sum of volumes of all 100 cm–long stem sections. Volume of one stem section was calculated by using Newton’s formula:
where Vij is volume of stem section i of tree j (cm3), L is a length of stem section (cm), Ab is a cross-sectional area at the bottom end of the section (cm2), Am is a cross-sectional area in the middle of the section (cm2) and As is a cross-sectional area at the top end of the section (cm2).
Bark volume was calculated as a difference of stem volume over bark and stem volume under bark.
Stem wood density and stem bark density were calculated as ratios between the respective biomass weight (of wood or bark) and the corresponding volume. Under the term “wood density” we understand here basic wood density, ρ, calculated as a ratio of oven-dry wood mass, m0, to its green volume, Vmax:
where ρ is basic wood or bark density (kg m−3), m0 is oven-dry wood or bark mass (g), Vmax is green wood or bark volume with wood moisture above the hygroscopicity threshold (m3).
Further, we constructed allometric relations for stem volume and biomass of separate tree components (foliage, branches, stem bark and stem wood), as well as aboveground tree biomass using DBH and a combination of DBH and tree height as predictors. We applied a basic (Y = a Xb), as well as an expanded version of an allometric equation as follows:
where Y is the dependent variable, i.e., either stem volume under or over bark (VSUB, VSOB in m3), or biomass (B in kg) of a particular tree component as defined above; X1 and X2 are independent variables, i.e., breast height diameter (DBH in cm) and tree height (h in m); b0, b1, and b2 are model regression coefficients; and θ is a multiplicative error term.
The relationship between tree height h and DBH was described with the following equation:
where h is tree height (m); DBH is tree diameter at breast height, i.e., at a height of 1.3 m (cm); c0, c1 and c2 are regression coefficients.
Tree annual production of aboveground biomass, of stem biomass over bark, and of stem volume over bark was calculated as an inter-annual change of the respective variable, using the formula:
where ΔY is the tree annual production of a particular biomass, i.e., its annual increment (kg); DBH1 is the actual diameter at breast height in the first year (cm); DBH2 is the diameter at breast height in the second year (cm) estimated as the actual diameter at breast height increased by species-specific mean annual diameter increment, i.e., DBH2 = DBH1 + ΔDBH; b0 and b1 are regression coefficients of a particular equation.
Mean annual diameter increment ΔDBH was calculated separately for each tree species from repeated measurements of trees monitored at transects. By accounting for all years of measurements, we obtained mean annual increment of spruce and birch equal to 1.0 and 1.4 cm, respectively.
Species-specific annual production of foliage was derived by using biomass equations as follows:
The formula for the calculation of spruce annual production of foliage is based on the previous experience and knowledge obtained from a similar experiment [25] that annual foliage production of spruce is approximately one third of the total foliage biomass at the end of the growing season.
To test significant differences between the tree species we used two-way ANOVA followed by Fisher’s Least Significant Difference (LSD) test and t-test (with p < 0.05).
3. Results
Based on the number of annual tree rings at a stem base of the sampled trees we found that in the year 2019 trees were 14 (±1) years old. Hence, they were born in the growing season of 2005 or 2006. Our set of sampled trees indicated that birch trees had greater dimensions than spruce trees (Table 2). Specifically, in the sample of trees taken for biomass analysis, birches were thicker and higher than spruce trees (mean DBH = 14.98 cm versus 8.9 m, and mean height = 9.80 versus 6.4 m), and rather interestingly the difference in mean aboveground tree biomass between the species was threefold (biomass of a birch and a spruce tree was 72.86 and 24.08 kg, respectively).
Table 2.
Basic characteristics of 14-year-old sampled trees—average numbers derived from twenty individuals of silver birch and twenty Norway spruce trees. Standard deviations are shown in parentheses.
Derived allometric relationships for aboveground tree components of birch (Table 3) and spruce (Table 4) showed that DBH was a good predictor of their biomass since R2 values of derived relationships fluctuated between 0.923 and 0.972 for birch and between 0.914 and 0.980 for spruce. Adding tree height to the model improved the model explanatory power only slightly, specifically R2 values of these relationships were between 0.940 and 0.977 for birch and between 0.917 and 0.992 for spruce depending on the tree component (Table 3 and Table 4).
Table 3.
Models for biomass quantities of tree components derived from the information on twenty sampled individuals of silver birch, using DBH and DBH plus tree height as predictors. Specific abbreviations indicate as follows: b0, b1 and b2 are regression coefficients with their standard errors (SEs); p is the respective p-value; R2 is coefficient of determination; and MSE is mean standard error.
Table 4.
Models for biomass quantities for tree components derived from the information on twenty sampled individuals of Norway spruce, using DBH and DBH plus tree height as predictors. Specific abbreviations indicate as follows: b0, b1 and b2 are regression coefficients with their standard errors (SEs); p is p-value; R2 is coefficient of determination; and MSE is mean standard error.
The models showed that birch and spruce trees with identical DBH had nearly the same amounts of aboveground biomass (Figure 1a). For instance, the aboveground tree biomass of an individual tree with DBH of 15 cm was about 70 kg irrespective of tree species. The derived models showed also very similar branch biomass of both species (Figure 1c), moderate differences in stem bark biomass (Figure 1d), as well as in stem biomass under bark (Figure 1e) and over bark (Figure 1f), but very contrasting amounts in foliage (Figure 1b). For instance, a spruce tree with DBH equal to 15 cm had as much as 20 kg of foliage biomass, while the foliage amount of the birch tree with the same DBH was only 5 kg. As for stem volume, the two species had very similar relationships between DBH and stem volume under bark (Figure 2a) or over bark (Figure 2b). Derived models for stem volume prediction using DBH as an explanatory variable were significant and explained more than 90% of volume variability for both birch (Table 5) and spruce (Table 6). The models clearly showed that for the specific DBH the compared tree species were characterized by almost identical values of stem volume, both under and over bark.
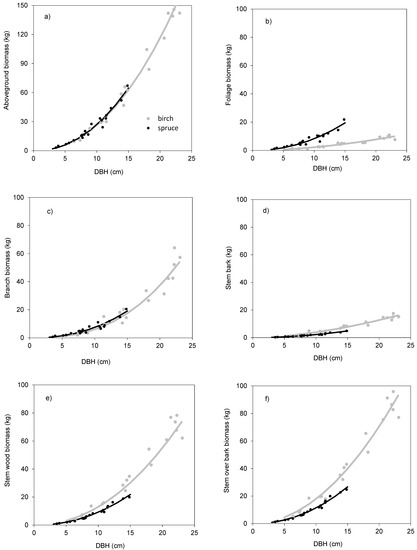
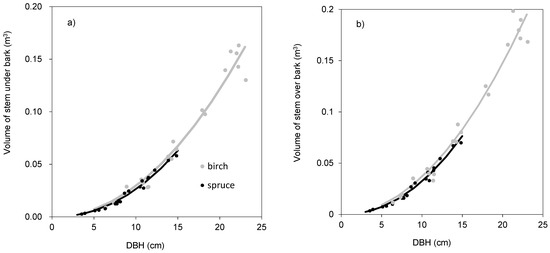
Table 5.
Models for volume of stem over and under bark made from twenty sampled individuals of silver birch, using DBH and DBH plus tree height as predictors. Specific abbreviations indicate as follows: b0, b1 and b2 are regression coefficients with their standard errors (SEs); p is p-value; R2 is coefficient of determination; and MSE is mean standard error.
Table 6.
Models for volume of stem over and under bark made from twenty sampled individuals of Norway spruce, using DBH and DBH plus tree height as predictors. Specific abbreviations indicate following characteristics: b0, b1 and b2 are regression coefficients with their standard errors (SEs); p is p-value; R2 is coefficient of determination; and MSE is mean standard error.
Further, we used the data from the sampled trees to derive mean tree compartments contributions to aboveground tree biomass (Figure 3). The results showed that only mean contribution of branches to aboveground biomass was insignificantly different between both species (29.5% and 27.2% for birch and spruce, respectively). The difference in foliage contribution was fourfold (7.5% and 31.7% for birch and spruce, respectively), and nearly the double difference was revealed in stem bark (13.3% and 8.4% for birch and spruce, respectively). Stem wood contributed to aboveground biomass most regardless of species, but its contribution in birch was significantly higher (46.7%) than in spruce (32.7%).
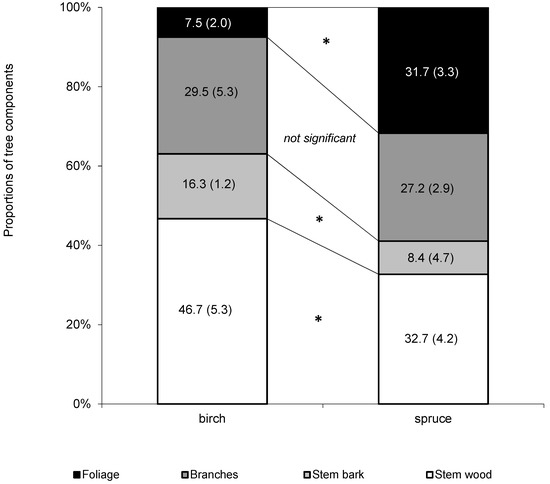
Figure 3.
Comparison of mean biomass allocated in aboveground tree components between silver birch and Norway spruce (n = 20 for each species). Values for averages and standard deviations (in parentheses) are shown. Asterisk indicates significant differences between species in a specific component (Least Significant Difference (LSD) test, p < 0.05).
As for density, significantly higher density values of both stem wood and stem bark were revealed for birch than spruce (Figure 4). While spruce wood and bark densities were similar (360 versus 370 kg m−3), birch wood density was significantly lower than its bark density (470 versus 520 kg m−3). Moreover, the results also revealed that the variability of birch bark density was greater than the variability of birch or spruce wood or bark density (Figure 4).
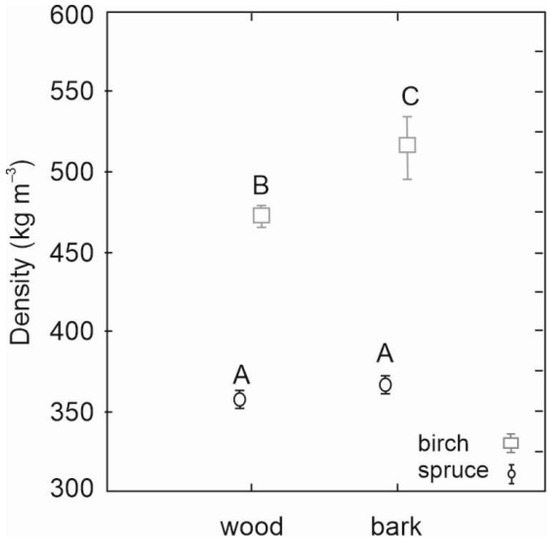
Figure 4.
Stem wood density and stem bark density of silver birch and Norway spruce determined from sampled trees (n = 20 for each species). Error bars represent standard errors. Different letters indicate significant differences between the respective density values (LSD test, p < 0.05).
The relationships between measured tree heights and DBH of birch and spruce trees growing at transects showed differences between the two species (Figure 5). Specifically, birch trees were by about 1.0 m higher than spruce trees with the same DBH. Even greater differences occurred between highest birches (about 15 m) and highest spruces (approx. 10 m). The data also showed that, while DBH of the thickest birches was about 28 cm, the greatest measured DBH of spruce was only 23 cm.
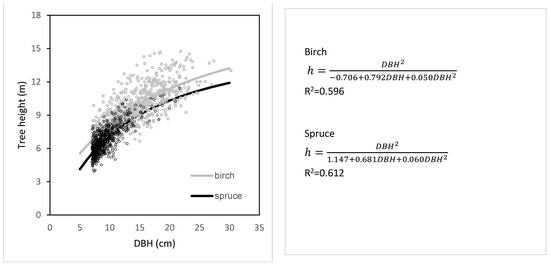
Figure 5.
Relationship between DBH and tree height (h) for silver birch and Norway spruce derived from all tree measurements in the years 2016–2020.
The analysis of mean annual diameter increments derived from consecutive DBH measurements revealed significantly faster diameter growth of birch trees than spruce (Figure 6). The increments differed significantly not only between tree species but also between some years. While in the case of spruce, only one mean annual diameter increment in the year 2019 was significantly lower than in other years, the differences between the annual increments of birch were more pronounced, except for similar increments in the last two years (2019 and 2020).
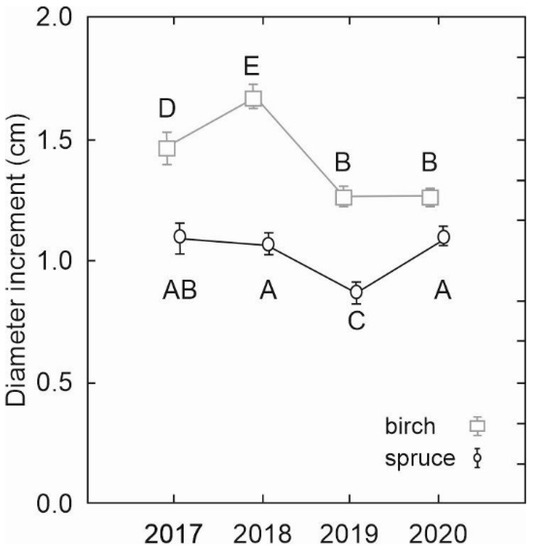
Figure 6.
Comparison of mean annual diameter increments between silver birch and Norway spruce in the years 2017–2020. Error bars represent standard errors. Different letters indicate significant differences between the increments (LSD test, p < 0.05).
Moreover, inter-specific comparisons of annual production of aboveground biomass and of individual tree components were performed (Figure 7). The comparisons considered real mean values of diameter increment for each species derived as averages of four mean annual diameter increments, i.e., 1.4 cm and 1.0 for birch and spruce, respectively. The results indicated that 14-year-old birch trees produced annually slightly more aboveground biomass than the spruce trees of the same age with the same DBH (Figure 7a). The opposite situation was found for foliage production, especially for trees with greater DBH (Figure 7b). Birch produced annually more branch biomass than spruce (Figure 7c), as well as more stem bark (Figure 7d), stem wood (Figure 7e) and, hence, also more stem under bark biomass (Figure 7f). The interspecific differences in the production of tree component biomass increased with DBH (Figure 7).
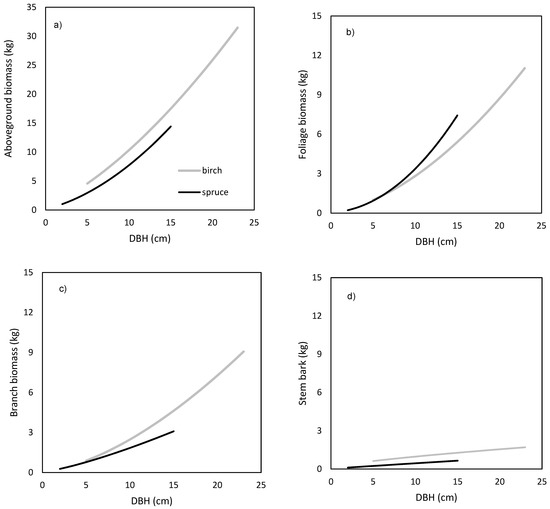
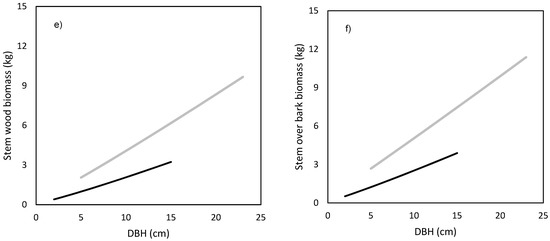
Figure 7.
Comparison of modeled annual production of aboveground tree biomass (a), foliage biomass (b) branches (c), stem bark (d), stem wood (e) and stem over bark (f) between silver birch and Norway spruce. We considered real values of mean annual diameter increment for each species, i.e., 1.4 and 1.0 cm for birch and spruce, respectively.
To present an example of tree component biomass stock and production (Table 7 and Table 8) we selected DBH approximately in the middle of the interval of sampled trees (i.e., 10 cm). Aboveground biomass stocks of both species in the current (x) year and the previous (x − 1) year were very similar. On the other hand, annual aboveground biomass production of birch was by 33.6% greater than of spruce. The greatest inter-species differences in production were found for foliage (in favor of spruce) and stem bark and wood (in favor of birch, see Table 7 and Table 8). In addition, we also revealed the difference in the annual production of litter. While the annual foliage litter production of a birch tree was 2.23 kg year−1, that of spruce was 1.53 kg year−1 (or 1.69 kg year−1 if applying the relationship derived by Pajtík et al. [26] and Konôpka [27]).
Table 7.
Example of silver birch tree biomass stock and annual production by components in the case of DBH = 10 cm and radial increment = 1.4 cm.
Table 8.
Example of Norway spruce tree biomass stock and annual production by components in the case of DBH = 10 cm and radial increment = 1.0 cm.
Finally, we focused on modeling the contribution of stem (both over and under bark) biomass to aboveground biomass production (Figure 8) with respect to tree DBH. The results showed that the proportion of stem production on the annual aboveground biomass production had a decreasing trend with the increasing DBH. Moreover, birch trees invested a higher share of aboveground biomass production to stem than spruce ones.
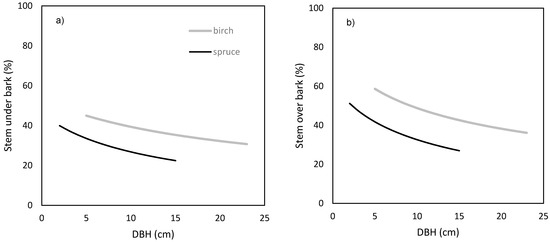
Figure 8.
Contribution of stem over bark (a) and under bark (b) annual production to aboveground biomass production against diameter at breast height (DBH) for silver birch (considering radial increment = 1.4 cm) and Norway spruce (radial increment = 1.0 cm).
4. Discussion
4.1. Ecological Aspects
Our results showed that birch leaves contributed to aboveground biomass four times less than spruce needles (8% versus 32%). Rather surprisingly, contribution of spruce needles was nearly the same as that of stem wood (without bark). At the same time, birch produced about double the stem biomass (an example of DBH of 10 cm) than spruce. This suggests that stem wood production efficiency of birch leaves is much higher than that of spruce needles. In other words, much less birch foliage biomass is needed for the production of the same amount of stem wood biomass than in the case of spruce. This is probably related to different morphological features of foliage between the species (especially specific leaf area (SLA)) but also foliage age. As for SLA, our previous results in young stands showed that while birch SLA was about 180 cm2 g−1 [28,29], SLA of spruce was three times lower [25,29]. While birch has only current-year leaves, spruce retains also older (2–5-year-old) needle sets besides current needles. Older needles are less efficient in photosynthesis and production of carbohydrates than current ones (e.g., see Reference [30]).
As for quantity of spruce foliage litter, our previous papers (combined data from References [26,27]) from the research site Vrchslatina in central Slovakia suggested that it was about 1/6 of total needle biomass. Since the altitude and tree age of our stands in this study were very similar to those at Vrchslatina, we may expect approximately similar ratios between needle litter and needle standing stock at the transects. At the same time, we found that the standing stock of spruce needles was about four times greater than birch foliage. Since all foliage of birch drops annually (foliage production ≈ foliage standing stock ≈ foliage litter), under the assumption of equal stem diameters (DBH = 10 cm) greater amount of birch foliage litter can be expected than spruce needle litter (by 67% more in birch than spruce). Moreover, quality of birch litter is higher than that of Norway spruce especially in terms of alkaline elements (calcium, magnesium and potassium) concentration [31] and nitrogen [32]. These two aspects, i.e., quantity and quality of foliage litter are more favorable for birch, which is commonly recognized as a soil improving species (e.g., see References [33,34]). In contrast, litter of Norway spruce needles accumulates because it decays more slowly than foliage litter of broadleaved tree species [26,35]. Berger and Berger [35] stated that lowered decomposition rate of spruce needles is mostly related to environmental conditions typically created under its monocultures. Therefore, mixed stands conditions would stimulate litter decomposition with consequent promotion of species diversity in the understory. In most cases, transformation of spruce stands into birch stands restored or improved soil fertility via limiting the loss of base cations and decreasing the nitrate percolation [36] and even reversing soil podsolization [37]. Silver birch foliage litter in contrast to Norway spruce needle litter, increases soil pH and decreases carbon to nitrogen ratio that, besides other consequences, has positive effects on humus quality (from mor to mull form [38]). Positive effects on soil properties can be expected not only in the case of complete stand transformation, i.e., from spruce to birch monoculture, but also via enhancing share of birch in coniferous, especially spruce-dominant, stands [14].
Silver birch and Norway spruce have very different ecological demands, morphological features and as for Slovakia also contrasting frequency in forests and contrasting economic importance. On the other hand, both species can often occur together especially in young growth stages on post-disturbance areas after destruction of spruce-dominant stands [13]. Silver birch is prospective in post-disturbance areas thanks to huge production of seeds (one tree can produce a few millions of seeds in a mast year) and their very large dispersal distance (e.g., see Reference [21]). Birch trees can provide a protective habitat for seedlings of other tree species, including those that are rather frost-sensitive, such as Norway spruce [39]. Birches growing in areas with high soil erosion rate can provide a particularly valuable service in watershed protection and soil stabilization [40]. From the point of keeping or supporting growth of silver birch in mixed stands, its great advantage is the fact that it is much less attractive for large herbivores than most other broadleaved species, especially the pioneer ones like aspen and willows [41]. This is thanks to terpenoides, especially betulin [42]. At the same time, birch is rather resistant to wind load and can be a stabilizing species even on water-logged sites [43]. On the other hand, birch is known to be very sensitive to snow and ice mechanical damage, especially in sparse forest stands that might be its disadvantage at some exposed sites [15]. Anyway, admixture of birch in Norway spruce plantations was pointed, especially in the newest works [44,45] as an efficient means to increase habitat and species diversity, including diversity of ground flora [46], invertebrates [47] or birds [48].
4.2. Wood Production Aspects
Our results obtained for post-disturbance conditions of Northern Slovakia showed that diameter increment of young silver birch trees was by about 40% greater than that of Norway spruce (Figure 6). Consequently, similar differences in favor of birch were recorded also for stem wood production—more in biomass than in volume expression (Figure 7 and Figure 8), due to the greater density of birch wood (Figure 4). On the other hand, smaller inter-species differences were found for aboveground biomass production (Figure 7a). The phenomenon is related to rather contrasting biomass allocation of silver birch and Norway spruce, since birch invested a higher share of biomass to stem wood. In the examined early developmental stage, Norway spruce invested a higher proportion of biomass to the non-merchantable component, i.e., needles, than silver birch (Figure 7 and Table 7 and Table 8).
At the same time, we estimated that density of birch stem wood was about 470 kg m−3 and its bark density was nearly 520 kg m−3. Both values were significantly greater than for Norway spruce (Figure 4), which is in accordance with the results from Finland [49]. This wood quality of silver birch is advantageous not only in terms of production (quantitative) aspects, but it is also beneficial for further wood utilization as material with high mechanical resistance [14]. In Slovakia, stem wood density of birch can vary between 460 and 610 kg m−3 [50]. Works from Poland show silver birch wood densities between 400 and 652 kg m−3 [51,52,53], while the research from Latvia reported about 455 kg m−3 [54]. Some authors (e.g., see References [49,51]) commented that wood density is related to a variety of factors, especially tree age, habitat and geographic location.
Wood density determines its mechanical properties, namely the denser wood the better features might be expected. Reference [55] reported better mechanical properties of birch, specifically bending strength (modulus of rupture), stiffness (modulus of elasticity) and compressive strength parallel to grain, than of most common broadleaved species. Similarly, the newest review paper on silver birch [14] pointed out at very good mechanical properties of birch wood. They indicated that physical and mechanical properties of birch are similar to those of European beech. Moreover, due to the diffuse-porous structure of birch wood the quality of wood products is not affected by the ring width, and its processing and finishing is easy [14]. At the same time, silver birch has higher share of lignin in wood than Norway spruce [56]. Silver birch produces good quality hardwood pulp and veneer, and for these purposes it is used in Northern Europe and North America [19,57].
At our site, some of our 14-year-old birch trees reached a height of nearly 14 m, which means that their annual mean height increment was about 1 m. This value slightly exceeded heights of the same old trees shown in several birch tables from Northern Europe [58]. Eriksson et al. [59] pointed out that birch is typical with rapid early growth, and at best sites it can reach a height of up to 24–25 m within 30 years.
Results from Estonia [60] showed that maximum annual volume increment in silver birch was reached at the age of about 15 years. That is nearly the age of the birch trees included in our study, which may indicate that the volume increment may be reduced in next years. Although silver birch is typical with fast growth and great production potential (e.g., see Reference [61]), its vitality and vigorous growth is sustained only if it grows as dominant trees in a stand with a relatively wide spacing [19]. Therefore, silvicultural measures (thinning and tending) applied in mixed spruce–birch stands would be very probably based on maintaining rather low stand density. Older works from Scandinavia [62,63] manifested that the growth of spruce was simulated by increasing proportion of birch. Similarly, Mielikäinen [64] found that the yield obtained from mixed stands of Norway spruce and silver birch was greater than that from a pure spruce stand. Valkonen and Valsta [65] indicated that in Finnish economic and technical conditions it is profitable to grow a birch overstorey in a spruce plantation up to commercial volume. Their suggestions were based on economic analyses of the two-storied birch–spruce mixed stands.
Management of mixed birch–spruce stands should respect different rotation periods of the two species. While the rotation period of birch is usually about 40–50 years (e.g., see Reference [55]), the one of spruce is almost twice as long [66], although it might be shortened in the case of low initial tree density [67,68]. Liski et al. [69] manifested that shortening the rotation length of Norway spruce decreased the carbon stock of trees but increased the carbon stock of soil because of increased production of litter and harvest residues. They concluded that longer rotation periods at spruce sites would be favorable for carbon sequestration. On the other hand, increasing risk caused by inherent climate change phenomena (especially strong wind and drought stress) and consecutive secondary pests (mainly bark beetles) of spruce support shortening the rotation period (e.g., see Reference [6]). Under the conditions of Czechia, Martiník et al. [70] suggested birch as an alternative tree species to spruce and beech vegetation at middle altitudes of the north-eastern part of the country after the ongoing spruce decline. Similar situations concerning spruce forest decline exist also in neighboring countries of Czechia, especially in Germany and Slovakia. Therefore, we think that broad and intensive research of mixed birch–spruce stands with regard to their management is necessary. Research should not only focus on wood production, including its profitability, but also on carbon sequestration and forest adaption issues.
5. Conclusions
Our results proved that silver birch is a very fast-growing (40% greater diameter increment than in Norway spruce) tree species that is typical for young developmental stages of a forest. At the same time, it produced denser wood (by 30%) and allocated a higher share of biomass to stem wood (economically important tree fraction) than Norway spruce. However, birch silviculture, processing and market have not been thoroughly studied in Central and Western Europe. Due to this, the production potential of this species is not properly examined and utilized. Nevertheless, long-term experience from Scandinavia, Baltic countries and Russia showed that this genus, especially the species silver birch, can be efficiently used in forestry and forest-based industry. Another great advantage of silver birch is its high ecological adaptability, thanks to which it is a prospective species under the conditions of climate change. Moreover, birch presence may enrich tree species composition, and probably also diversity of flora and fauna in mixed forest stands in almost the entire Eurasian continent. Based on the results of our own study and findings from other works, we suggest strengthening research activities focused on birch ecology and production issues and subsequently bringing practical recommendations for better utilization of this tree species in forestry and wood-processing industry sectors.
Author Contributions
Conceptualization, B.K.; data curation, J.P. and V.Š.; funding acquisition, B.K.; investigation, B.K., J.P. and V.Š.; methodology, B.K. and P.S.; visualization, J.P. and V.Š.; supervision, B.K.; writing—original draft, B.K., J.P., V.Š., P.S. and K.M.; writing—review and editing, B.K. and K.M. All authors have read and agreed to the published version of the manuscript.
Funding
This research was funded by grant “EVA4.0,” No. Z.02.1.01/0.0/0.0/16_019/0000803 financed by OP RDE, and also by the projects APVV-16-0086, APVV-18-0086 and APVV-19-0387 from the Slovak Research and Development Agency, and by the project “Scientific support of climate change adaptation in agriculture and mitigation of soil degradation” (ITMS2014+ 313011W580), supported by the Integrated Infrastructure Operational Programme funded by the ERDF.
Institutional Review Board Statement
Not applicable.
Informed Consent Statement
Not applicable.
Conflicts of Interest
The authors declare no conflict of interest.
References
- Gregow, H.; Laaksonen, A.; Alpert, M.E. Increasing large scale windstorm damage in Western, Central and Northern European forests, 1951–2010. Sci. Rep. 2017, 7, 46397. [Google Scholar] [CrossRef]
- Kunca, A.; Zúbrik, M.; Galko, J.; Vakula, J.; Leontovyč, R.; Konôpka, B.; Nikolov, C.; Gubka, A.; Longauerová, V.; Maľová, M.; et al. Salvage felling in the Slovak Republic’s forests during the last twenty years (1998–2017). Cent. Eur. For. J. 2019, 65, 3–11. [Google Scholar]
- Seidl, R.; Schelhaas, M.J.; Rammer, W.; Verkerk, H. Increasing forest disturbances in Europe and their impact on carbon storage. Nat. Clim. Chang. 2014, 4, 806–810. [Google Scholar] [CrossRef]
- Mitchell, S.J. Wind as a natural disturbance agent in forests: A synthesis. Forestry 2013, 86, 147–157. [Google Scholar] [CrossRef]
- Merganič, J.; Merganičová, K.; Výbošťok, J.; Valent, P.; Bahýľ, J.; Yousefpour, R. Searching for Pareto fronts for forest stand wind stability by incorporating timber and biodiversity values. Forests 2020, 11, 583. [Google Scholar] [CrossRef]
- Lindner, M.; Maroschek, M.; Netherer, S.; Kremer, A.; Barbati, A.; Garcia-Gonzalo, J.; Seidl, R.; Delzon, S.; Corona, P.; Kolström, M.; et al. Climate change impacts, adaptive capacity, and vulnerability of European forest ecosystems. For. Ecol. Manag. 2010, 259, 698–709. [Google Scholar] [CrossRef]
- San-Miguel-Ayanz, J.; de Rigo, D.; Caudulllo, G.; Houston Durant, T.; Mauri, A.; Tinner, W.; Ballian, D.; Beck, P.; Birks, H.J.B.; Eaton, E.; et al. European Atlas of Forest Tree Species; European Commission: Luxembourg, 2016; p. 200. [Google Scholar]
- Tsvetanov, N.; Dountchev, A.; Panayotov, M.P.; Zhelev, P.; Bebi, P.; Yurukov, S. Short- and long-term natural regeneration after windthrow disturbances in Norway spruce forests in Bulgaria. iForest 2018, 11, 675–684. [Google Scholar] [CrossRef]
- Fenner, M. Seed Ecology; Chapman and Hall Ltd.: New York, NY, USA, 1985; p. 151. [Google Scholar]
- Konôpka, B.; Pajtík, J.; Máliš, F.; Šebeň, V.; Maľová, M. Carbon stock in aboveground biomass of vegetation at the High Tatra Mts. twelve years after disturbance. Cent. Eur. For. J. 2017, 63, 142–151. [Google Scholar] [CrossRef][Green Version]
- Koreň, M. Wind calamity on 19th November. New views and consequences. Tatry 2005, 6, 1–29. [Google Scholar]
- Šebeň, V. Natural regeneration after the calamity in November 2004 at the High Tatras. In Research of Destabilized Spruce Forests; Konôpka, B., Ed.; National Forest Centre: Zvolen, Slovakia, 2011; pp. 297–308. [Google Scholar]
- Konôpka, B.; Šebeň, V.; Pajtík, J. Species composition and carbon stock of tree cover at a postdisturbance area in Tatra national park, western Carpathians. Mount. Res. Dev. 2019, 39, 71–80. [Google Scholar] [CrossRef]
- Dubois, H.; Verkasalo, E.; Claessens, H. Potential of birch (Betula pendula Roth and B. pubescens Ehrh.) for forestry and forest-based industry sector within the changing climatic and socio-economic context of Western Europe. Forests 2020, 11, 336. [Google Scholar] [CrossRef]
- Kula, E. Importance of Birch for Sustainable Forest Development in the Immission Regions; Publishing House for Forestry: Prague, Czech Republic, 2011; p. 276. [Google Scholar]
- Zasada, M.; Bijak, S.; Bronisz, K.; Bronisz, A.; Gaweda, T. Biomass dynamics in young silver birch stands on post-agricultural lands in central Poland. Drewno 2014, 57, 29–39. [Google Scholar]
- Šebeň, V.; Kučera, M.; Konôpka, B.; Merganičová, K. The current state of non-forest land in the Czech Republic and Slovakia—forest cover estimates based on the national inventory data. Cent. Eur. For. J. 2018, 64, 207–222. [Google Scholar]
- Stark, H.; Nothdurft, A.; Bauhus, J. Allometries for widely spaced Populus ssp. and Betula ssp. in nurse crop systems. Forests 2013, 4, 1003–1031. [Google Scholar] [CrossRef]
- Hynynen, J.; Niemistö, P.; Viherä-Aarnio, A.; Brunner, A.; Hein, S.; Velling, P. Silviculture of birch (Betula pendula Roth and Betula pubescens Ehrh.) in Northern Europe. Forestry 2010, 83, 103–119. [Google Scholar] [CrossRef]
- Kurvits, V.; Ots, K.; Kangur, A.; Korjus, H.; Muiste, P. Assessment of load and quality of logging residues from clear-felling areas in Järveselja: A case study from Southeast Estonia. Cent. Eur. For. J. 2020, 66, 3–11. [Google Scholar]
- Tiebel, K.; Huth, F.; Frischbier, N.; Wagner, S. Restrictions on natural regeneration of storm-felled spruce sites by silver birch (Betula pendula Roth.) through limitations in fructification and seed dispersal. Eur. J. For. Res. 2020, 139, 731–745. [Google Scholar] [CrossRef]
- Hlásny, T.; Mátyás, C.; Seidl, R.; Kulla, L.; Merganičová, K.; Trombik, J.; Dobor, L.; Barcza, Z.; Konôpka, B. Climate Change Increases the Drought Risk in Central European Forests: What Are the Options for Adaptation? Cent. Eur. For. J. 2014, 60, 5–18. [Google Scholar] [CrossRef]
- Máliš, F.; Konôpka, B.; Šebeň, V.; Pajtík, J.; Merganičová, K. Short-term dynamics of vegetation diversity and aboveground biomass of Picea abies (L.) H. Karst. forests after heavy windstorm disturbance. Forests 2020, 12, 97. [Google Scholar] [CrossRef]
- Kraft, G. Beiträge zur Lehre von den Durchforstungen, Schlagstellungen und Lichtungshieben; Klindworth’s Verlag: Hannover, Germany, 1884; p. 156. [Google Scholar]
- Konôpka, B.; Pajtík, J. Similar foliage area but contrasting foliage biomass between young beech and spruce stands. Lesn. Cas. For. J. 2014, 60, 205–213. [Google Scholar]
- Pajtík, J.; Konôpka, B.; Marušák, R. Above-ground net primary productivity in young stands of beech and spruce. Lesn. Cas. For. J. 2013, 59, 154–162. [Google Scholar] [CrossRef][Green Version]
- Konôpka, B. Foliage and fine root litter: A comparative study in young, natural regenerated stands of European beech and Norway spruce. Austr. J. For. Scien. 2017, 134, 99–118. [Google Scholar]
- Konôpka, B.; Pajtík, J.; Šebeň, V.; Merganičová, K.; Surový, P. Silver birch above-ground biomass allocation pattern, stem and foliage traits with regard to intraspecific crown competition. Cent. Eur. For. J. 2020, 66, 159–169. [Google Scholar]
- Konôpka, B.; Pajtík, J.; Marušák, R.; Bošeľa, M.; Lukac, M. Specific leaf area and leaf area index in developing stands of Fagus sylvatica L. and Picea abies L. Karst. For. Ecol. Manag. 2016, 364, 52–59. [Google Scholar] [CrossRef]
- Freeland, R.O. Effect of age of leaves on rate of photosynthesis in some conifers. Plant. Physiol. 1952, 27, 685–690. [Google Scholar] [CrossRef] [PubMed]
- Carnol, M.; Bazgir, M. Nutrient return to the forest floor through litter and throughfall under 7 forest species after conversions from Norway spruce. For. Ecol. Manag. 2013, 309, 66–75. [Google Scholar] [CrossRef]
- Johansson, M.-B. The chemical composition of needle and leaf litter from Scots pine, Norway spruce and white birch in Scandinavian forests. Forestry 1995, 68, 49–62. [Google Scholar] [CrossRef]
- Kanerva, S.; Smolander, A. Microbial activity in forest floor layers under silver birch, Norway spruce and Scots pine. Soil. Biol. Biochem. 2007, 39, 1459–1467. [Google Scholar] [CrossRef]
- Zapata-Carbonell, J.; Ciadamidaro, L.; Parelle, J.; Chalot, M.; Tatin-Froux, F. Improving silver birch (Betula pendula) growth and Mn accumulation in residual red gypsum using organic amendments. Front. Environ. Sci. 2020, 8, 24. [Google Scholar] [CrossRef]
- Berger, T.W.; Berger, P. Greater accumulation of litter in spruce (Picea abies) compared to beech (Fagus sylvatica) stands is not a consequence of the inherent recalcitrance of needles. Plant Soil 2012, 358, 349–369. [Google Scholar] [CrossRef]
- De Schrijver, A.; Nachtergale, L.; Staelenes, J.; Luyssaert, S.; de Keersmaeker, L. Comparison of throughfall and soil solution chemistry between a high-density Corsican pine stand and naturally regenerated silver fir birch stand. Environ. Pollut. 2004, 131, 93–105. [Google Scholar] [CrossRef] [PubMed]
- Emmer, I.M.; Fanta, J.; Kobus, A.T.; Kooijman, A.; Sevink, J. Reversing borealization as a means to restore biodiversity in Central-European mountain forests—An example from the Krkonose Mountains, Czech Republic. Biodivers. Conserv. 1998, 7, 229–247. [Google Scholar] [CrossRef]
- Kacálek, D.; Mauer, O.; Podrázský, V.; Slodičák, M. Soil Improving and Stabilising Function of Forest Trees; Lesnická Práce: Prague, Czech Republic, 2017; p. 300. [Google Scholar]
- Praciak, A. The CABI Encyclopedia of Forest Trees; CABI: Wallingford, UK, 2013; p. 536. [Google Scholar]
- Norris, J.E.; di Iorio, A.; Stokes, A.; Nicoll, B.C.; Achim, A. Slope Stability and Erosion Control: Ecotechnical Solutions; Norris, J.E., Stokes, A., Mickovski, S.B., Cammeraat, E., van Beek, R., Nicoll, B.C., Achim, A., Eds.; Springer: Berlin/Heidelberg, Germany, 2008; pp. 167–210. [Google Scholar]
- Muiruri, E.W.; Milligan, H.T.; Morath, S.; Koricheva, J. Moose browsing alters tree diversity effectes on birch growth and insect herbivory. Funct. Ecol. 2015, 29, 724–735. [Google Scholar] [CrossRef]
- Bergvall, U.A.; Co, M.; Bergström, R.; Sjöberg, P.J.R.; Waldebäck, M.; Turner, C. Anti-browsing effects of birch bark extract on fallow deer. Eur. J. For. Res. 2013, 132, 717–725. [Google Scholar] [CrossRef]
- Krišans, O.; Matisons, R.; Kitenberga, M.; Donis, J.; Rust, S.; Elferts, D.; Jansons, A. Wind resistance of Eastern Baltic silver birch (Betula pendula Roth.) suggests its suitability for periodically waterlogged sites. Forests 2021, 12, 21. [Google Scholar] [CrossRef]
- Holmström, E.; Carlström, T.; Goude, M.; Lidman, F.D.; Felton, A. Keeping mixture of Norway spruce and birch in production forests: Insights from survey data. Scand. J. For. Res. 2021. [Google Scholar] [CrossRef]
- Huuskonen, D.; Dormisch, T.; Finér, L.; Hantula, J.; Hynynen, J.; Matala, J.; Miina, J.; Neuovone, S.; Nevalainen, S.; Niemstö, P. What is the potential for replacing monocultures with mixed-species stands to enhance ecosystem services in boreal forests in Fennoscandia? For. Ecol. Manag. 2021, 479, 118558. [Google Scholar] [CrossRef]
- Wallace, H.L. Ground flora associated with birch in Scottish spruce plantations. In Birch in Spruce Plantations. Management for Biodiversity; Humphrey, J., Holl, K., Broome, A., Eds.; Forestry Comission: Edinburgh, UK, 1998; pp. 13–24. [Google Scholar]
- Patterson, G. The Value of Birch in Upland Forests for Wildlife Conservation; Forestry Commission: London, UK, 1993.
- Felton, A.; Andersson, E.; Ventorp, D.; Lindbladh, M. A comparison of avian diversity in spruce monocultures and spruce-birch polycultures in Southern Sweden. Silva. Fenn. 2011, 45, 1143–1150. [Google Scholar] [CrossRef]
- Repola, J. Models for vertical wood density of Scots pine, Norway spruce and birch stems, and their application to determine average wood density. Silva. Fenn. 2006, 40, 673–685. [Google Scholar] [CrossRef]
- National Forest Centre. Basic Characteristics of Forest Tree Species; National Forest Centre: Zvolen, Slovakia, 2010; p. 47.
- Lachowicz, H.; Paschalis-Jakubowicz, P.; Wojtan, R. Multivariate analysis of the variability in the density of oven-dry wood of silver birch (Betula pendula Roth) in Poland. Drewno 2018, 61, 39–56. [Google Scholar]
- Jakubowski, M.; Tomczak, A.; Jelonek, T.; Grzywinski, W. Variations of wood properties of birch (Betula pendula Roth) from a 23-old seed orchard. Wood Res. 2020, 65, 75–86. [Google Scholar] [CrossRef]
- Dobrowolska, E.; Wroniszewska, P.; Jankowska, A. Density distribution in wood of European birch (Betula pendula Roth.). Forests 2020, 11, 445. [Google Scholar] [CrossRef]
- Liepins, K.; Rieksts-Riekstins, J. Stemwood density of juvenile silver birch trees (Betula pendula roth) from plantations on former farmlands. Balt. For. 2013, 19, 179–185. [Google Scholar]
- Cameron, A.D. Managing birch woodlands for the production of quality timber. Forestry 1996, 69, 357–371. [Google Scholar] [CrossRef]
- Faleva, A.V.; Belesov, A.V.; Kozhevnikov, A.Y.; Falev, D.I.; Chukhchin, D.G.; Novozhilov, E.V. Analysis of the functional group composition of the spruce and birch phloem lignin. Int. J. Biol. Macromol. 2021, 166, 913–922. [Google Scholar] [CrossRef] [PubMed]
- Luostarinen, K.; Verkasalo, E. Birch as Sawn Timber and in Mechanical Further Processing in Finland. A Literature Study; Forest Research Institute: Helsinki, Finland, 2000. [Google Scholar]
- Kund, M.; Vares, A.; Sims, A.; Tullus, H.; Uri, V. Early growth and development of silver birch (Betula pendula roth) plantations on abandoned agricultural land. Eur. J. For. Res. 2010, 129, 679–688. [Google Scholar] [CrossRef]
- Eriksson, H.; Johansson, U.; Kiviste, A. A site-index model for pure and mixed stands of Betula pendula and Betula pubescens in Sweden. Scand. J. For. Res. 1997, 12, 149–156. [Google Scholar] [CrossRef]
- Lutter, R.; Tullus, A.; Kanal, A.; Tullus, T.; Vares, A.; Tullus, H. Growth development and plant-soil relations in midterm silver birch (Betula pendula Roth) plantations on previous agricultural lands in hemiborel Estonia. Eur. J. For. Res. 2015, 134, 653–667. [Google Scholar] [CrossRef]
- Uri, V.; Lohmus, K.; Ostonen, I.; Tullus, H.; Lastik, R.; Vildo, M. Biomass production, foliar and root characteristics and nutrient accumulation in young silver birch (Betula pendula roth.) stand growing on abandoned agricultural land. Eur. J. For. Res. 2007, 126, 495–506. [Google Scholar] [CrossRef]
- Jonsson, B. Yield of Mixed Coniferous Forest; Meddelanden Fran Statens Skogsforskning Institute: Stockholm, Sweden, 1962; pp. 1–173. [Google Scholar]
- Tham, A. Prediction of individual tree growth in managed stands of mixed Picea abies (L.) Karst. and Betula pendula Roth. and Betula pubescens Ehrh. Scand. J. For. Res. 1989, 4, 491–512. [Google Scholar] [CrossRef]
- Mielikäinen, K. Effect of an admixture of birch on the structure and development of Norway spruce stands. Communicationes Instituti Forestalis Fenniane 1985, 133, 79. [Google Scholar]
- Valkonen, S.; Valsta, L. Productivity and economics of mixed two-storied spruce and birch stands in Southern Finland simulated with empirical models. For. Ecol. Manag. 2001, 140, 133–149. [Google Scholar] [CrossRef]
- Poleno, Z. Forestry Handbook II; Ministry of Agriculture of Czech Republic: Prague, Czech Republic, 1995; p. 683.
- Coordes, R. Influence of planting density and rotation age on the profitability of timber production for Norway spruce in Central Europe. Eur. J. For. Res. 2013, 132, 297–311. [Google Scholar] [CrossRef]
- Katrevičs, J.; Džerina, B.; Neimane, U.; Desaine, I.; Bigača, Z.; Jansons, A. Production and profitability of low density Norway spruce (Picea abies (L.) Karst.) plantation at 50 years of age: Case study from Eastern Latvia. Agron. Res. 2018, 16, 113–121. [Google Scholar]
- Liski, J.; Pussinen, A.; Pingoud, K.; Mäkipää, R.; Karjalainen, T. Which rotation length is favourable to carbon sequestration? Can. J. For. Res. 2001, 31, 2004–2013. [Google Scholar] [CrossRef]
- Martiník, A.; Knott, R.; Krejza, J.; Černý, J. Biomass production of Betula pendula stands regenerated in the region of allochthonous Pice abies dieback. Silva. Fenn. 2018, 52, 1–15. [Google Scholar] [CrossRef]
Publisher’s Note: MDPI stays neutral with regard to jurisdictional claims in published maps and institutional affiliations. |
© 2021 by the authors. Licensee MDPI, Basel, Switzerland. This article is an open access article distributed under the terms and conditions of the Creative Commons Attribution (CC BY) license (https://creativecommons.org/licenses/by/4.0/).