Abstract
Larix gmelinii forest is one of the dominant forest types in boreal forest and plays a unique eco-hydrological role in the terrestrial ecosystem. However, the throughfall variability in boreal forest ecosystems, which plays a crucial role in regulating hydrology, remains unclear. Here, we investigated the spatial variability and temporal stability of throughfall within a Larix gmelinii forest in the full leaf stage in Great Kingan Mountain, Northeast China, and the effects of rainfall properties and canopy structure on throughfall variability were systematically evaluated. The results indicate that throughfall represented 81.26% of the gross rainfall in the forest. The throughfall CV (coefficient of variation of throughfall) had a significant and negative correlation with the rainfall amount, rainfall intensity, rainfall duration, and distance from the nearest trunk, whereas it increased with increasing canopy thickness and LAI (leaf area index). The correlation analysis suggested that the throughfall variability was mainly affected by the rainfall amount (R2 = 0.7714) and canopy thickness (R2 = 0.7087). The temporal stability analysis indicated that the spatial distribution of the throughfall was temporally stable. Our findings will facilitate a better understanding of the spatiotemporal heterogeneity of throughfall and help the accurate assessment of throughfall and soil water within boreal forests.
1. Introduction
When rainfall passes through the forest canopy, it partitions into interception loss, throughfall, and stemflow [1]. Commonly, interception loss and stemflow both occupy a smaller proportion, typically ranging from approximately 14.7 to 31.8% [2] and 0 to 10% [3] of gross rainfall, respectively. In contrast to these, throughfall represents the largest proportion, and usually constitutes more than 70% of gross rainfall [4]. Throughfall can be subdivided into three parts—free throughfall, splash throughfall, and canopy drip, and the relative proportion of each part of throughfall in different forests is different [5]. As the major component of understory rainfall, throughfall inputs are spatially variable and affect the spatial distribution of water and solutes in soil, root distribution, and the soil microbial community structure [6,7]. Therefore, throughfall is a key input parameter in ecological, hydrological, and biogeochemical processes. In-depth understanding of the spatiotemporal patterns of throughfall is necessary for constructing hydrological models.
Throughfall variability plays a crucial role in regulating hydrological and biogeochemical processes in forest ecosystems [8,9], and is influenced by many factors, including tree species, canopy structure (e.g., distance from nearest trunk, canopy thickness and leaf are index) [10,11,12], rainfall properties (e.g., rainfall amount, rainfall intensity and rainfall duration) [10,13] and meteorological conditions (e.g., wind speed and direction, air temperature, evaporation) [9,14,15,16]. In recent years, numerous studies have explored the relationship between influence factor and throughfall, but up to now, there are disagreements within the literature about how the spatial distribution of throughfall varies. For example, Zhang et al. [6] found that throughfall increased with the increasing distance from the shrub base, Vellak et al. [17] reported that it is invariant with distance from the trunk, and Kowalska et al. [10], Sun et al. [18], Fang et al. [16], and Shi et al. [19] found that throughfall variability is not related to the distance from the tree trunk. Meanwhile, Shen et al. [20] found that throughfall variability reduced with increasing rainfall amount, Fang et al. [16] found that canopy structure was the key influencing factor of throughfall variability, and Zhang et al. [9] found that throughfall variability was affected mainly by the maximum 10 min rainfall intensity, wind speed, and air temperature during the leafed period, but mean rainfall intensity during the leafless period. Additionally, numerous studies have attempted to estimate the optimal number of collectors needed to obtain a proper average throughfall [11,20,21]. However, differences in plot size, stand density, tree species, leaf phenology, and even leaf shapes can lead to throughfall spatial heterogeneity [9,22,23,24], which makes it difficult to obtain representation of throughfall measurements. Although the spatial variability of throughfall has been studied in tropical and temperate forests [10], the relationship between throughfall spatial variability and its influencing factors remains unclear [25].
Previous studies have shown great variability of throughfall in diverse forest types globally [9], and the spatial variability of throughfall largely depends on rainfall characteristics and the canopy structure [10]. However, how these factors affect throughfall variability in cold temperate deciduous forests remains poorly known, though the importance of the water conservation function of boreal forest ecosystems is acknowledged. As such, a systematic study is needed to clarify throughfall spatial patterns in deciduous species.
Boreal forest is widely distributed in the boreal-arctic region of the Northern Hemisphere [26]. Dahurian larch (Larix gmelinii) is the dominant species in boreal forest, especially in the northern Greater Khingan Range, where the only boreal coniferous forest in China is located. The Greater Khingan Mountains are an important water conservation and biodiversity protection functional area and ecological barrier in China. Nevertheless, previous research mostly focused on the impact of climate change, permafrost thaw, and forest recovery on water yield [27,28] and forest canopy interception loss [29], while ignoring the impact of the complexity of forest cover on hydrological processes. According to studies conducted in different forest types, throughfall is a key transfer mechanism in the biogeochemical cycles [25]. Therefore, a better understanding of distribution patterns of throughfall in a larch forest is a precondition to give full play to the water conservation function of boreal forest.
In the present paper, we investigate the spatiotemporal patterns of throughfall during the full leaf stage in a Larix gmelinii forest in the Greater Khingan Mountains of northeastern China. The objectives of the study are (1) to characterize the spatial pattern of throughfall in the full leaf stage; (2) to quantify the effects of rainfall characteristics and canopy structure on the variability of throughfall; and (3) to estimate the time stability of throughfall spatial patterns.
2. Materials and Methods
2.1. Site Descriptions
The study area, Heilongjiang Mohe Forest Ecosystem National Observation and Research Station (53°27′37.85′′ N, 122°21′12.16′′ E), is within the zone of boreal forest. The site lies at the northern part of the Greater Khingan Mountains and near the southern edge of Siberia, with low hills at an average elevation of 300~500 m. The regional mean annual temperature (1959–2017) is −5.5 °C and the mean annual precipitation in the same period is 460.8 mm, with approximately 70% occurring as rainfall during the wet season [26].
The native forest in the study area is boreal coniferous forest, with the dominant species being Larix gmelinii, along with Scots pine (Pinus sylvestris var. mongolica), white birch (Betula platyphylla), and aspen (Populus davidiana). Understory shrubs include Ledum palustre, Vaccinium uliginosum, Vaccinium vitis-idaea, and Rhododendron dauricum. The main herbs include Pyrola incarnata, Saussurea japonica, Adenophora tetraphylla, Maianthemum bifolium, Sanguisorba officinalis, Vicia cracca, and Carex argyi. According to permanent plot (100 × 100 m) surveys, tree heights of larch were 12.34 ± 6.04 m (mean ± s.d.) with 10.6 ± 6.1 cm diameter at breast height (DBH) and 7.1 ± 5.2 m2 canopy area in 2011 (Table 1). The experimental plot (20 × 20 m) is adjacent to the permanent plot and has similar flora. In the experimental plot, the leaf area index (LAI) is 1.64 ± 0.68, and the understory heights were 0.1~1.0 m with 10~60% ground coverages. The details of experimental plot are shown in Figure 1.

Table 1.
Forest conditions in the permanent plot.
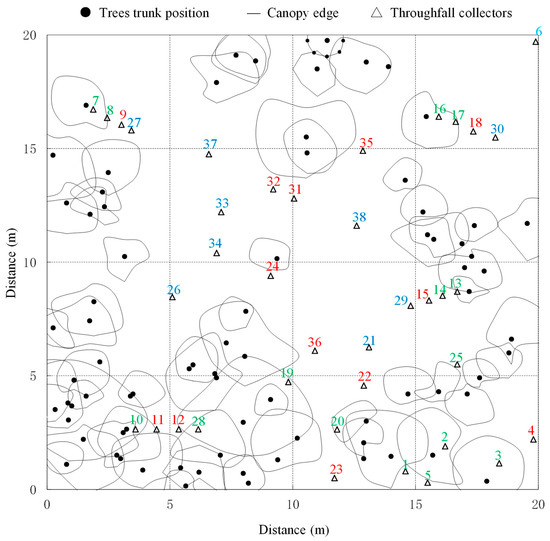
Figure 1.
Map of the experimental plot (20 × 20 m) showing the locations of trees and collectors. The Arabic numerals represent the serial number of throughfall collectors, green means the collector is located in the inner canopy, red means the collector is located in the canopy periphery, and blue means the collector is located beneath gaps.
2.2. Forest Canopy Structure Index Measurement
Three indices were calculated in order to characterize the canopy structure: the distance from the nearest trunk, the canopy thickness, and the leaf area index (LAI) at each throughfall collector. To investigate the distance from nearest trunk, spatial analysis was performed with ArcGIS software. The input data included the position of each tree and each throughfall collector in the experimental plot to an accuracy of 0.1 m. The minimum value of the distance from one collector to all trees was the distance from nearest trunk. The canopy thickness was measured with a 15 m long benchmark with scale. We stood the benchmark above each collector, and read the scale values above and below the canopy through a telescope. The difference between the two scale values is the canopy thickness. The LAI of each collector was measured with LAI-2200 and the mean of 38 throughfall collectors LAI was defined as LAI of the experimental plot. The LAI of the experimental plot was divided into three leaf stages during our observational period from 15 April to 20 October 2013 (Figure 2). In different leaf stages, the main controlling factors of throughfall variability were different [9]. In this study, the full leaf when the canopy was relatively stable was selected for research in order to better understand the influence of rainfall properties and canopy structure on throughfall variability.
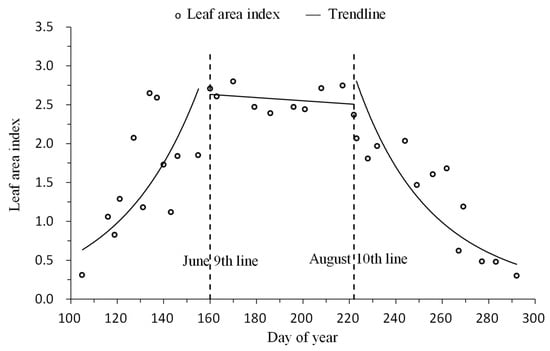
Figure 2.
Time series of leaf area index (LAI) and trend line.
2.3. Measurements of Gross Rainfall and Throughfall
Gross rainfall was measured during the growing seasons (May to September) in 2013 with three cylindrical collectors (diameter 20 cm) located in an open space 100 m away from the experimental plot. Meanwhile, we used a tipping-bucket rain gauge (0.1 mm/tip) and a data logger (CR3000, Campbell Scientific, Logan, UT, USA), which was extended above the forest canopy and mounted at 23 m height of the observation tower (36 m high and 500 m away from the experimental plot) to calibrate the gross rainfall data, and obtained the rainfall duration and rainfall intensity data. When the previous rainfall interval time exceeded 4 h, then it was divided into different rainfall events [2].
To investigate the spatial variability of throughfall, 38 throughfall collectors with a diameter of 20 cm (314.16 cm2) were randomly placed in the experimental plot (Figure 1). The throughfall in each collector was measured using a graduated cylinder (sensitivity is 1 mL) within 2 h after the cessation of rainfall or after sunrise if the event occurred or extended into nighttime hours. Dividing the volume of water by the collecting area, we got the throughfall amount (in mm) for each throughfall collector. The mean throughfall amount (in mm) of 38 throughfall collectors was defined as one rainfall event throughfall amount, and the sum of throughfall amount (in mm) for 22 rainfall events of the same collector was defined as the throughfall amount of the collector location.
2.4. Statistical Analysis
Spatial variability of throughfall was identified by the coefficient of variation of throughfall (throughfall CV). The coefficient of variation of throughfall for different rainfall events was defined as throughfall CVRP, and coefficient of variation of throughfall for different collector was defined as throughfall CVCS.
Temporal stability plot was used to describe the temporal persistence of the throughfall amount. According to Zimmermann et al. [30] and Zhang et al. [9], the throughfall amount was normalized by the median and the median absolute deviation in this study (Equation (1)). According to Keim et al. [31] and Zhang et al. [9], four kinds of collectors with different temporal persistence could be derived from the stability plot: (1) extreme dry persistence, (2) extreme wet persistence, (3) general persistence, and (4) unstable persistence. For details, please refer to the article published by Zhang et al. [9].
where and TFit represent the normalized value and measurement value of the throughfall amounts for an individual collector i of t periods, respectively. MTFt and MADTFt represent the median and the median absolute deviation of throughfall amounts of all collectors for t periods, respectively.
3. Results
3.1. Gross Rainfall
We collected rainfall in the study region from early May to the end of September 2013 (growing season); a total of 57 events amounting to a cumulative depth of 359.4 mm were recorded, and snowfall was not detected. Mean incident rainfall event was 6.3 mm and varied from 0.2 to 24.1 mm (Table 2). Of the 57 rainfall events, 22 events (with a total of 195.9 mm) in the full leaf stage were registered, which produced an average rainfall of 8.9 mm, with individual events ranging from 0.2 to 24.1 mm. Therefore, the rainfall pattern in the full leaf stage can be characterized as typical of the growing season. During the experimental period (full leaf stage: 10 June to 10 August), most of the rainfall events exhibited a low rainfall intensity and long duration. As our study objects, rainfall characteristics of each of these events in the full leaf stage are provided in Table 2.
Table 2.
Rainfall characteristics during full leaf stage.
3.2. Characteristics of Throughfall
Throughfall was measured for 22 events during the full leaf stage. The mean cumulative throughfall was 159.18 ± 21.22 mm (≈81.26% of total rainfall). There was a significant linear relationship between the average throughfall, which was derived from all 38 collectors, and gross rainfall (TH = 0.8111GR + 0.0138, R2 = 0.9254, p < 0.001) (Figure 3). Statistical analysis revealed that throughfall was zero when gross rainfall was no more than 0.01 mm, indicating that there must be generated throughfall in any rainfall event. This is due to some part of the collector being located in the canopy gap. The positions of the 38 collectors are presented in Figure 1.
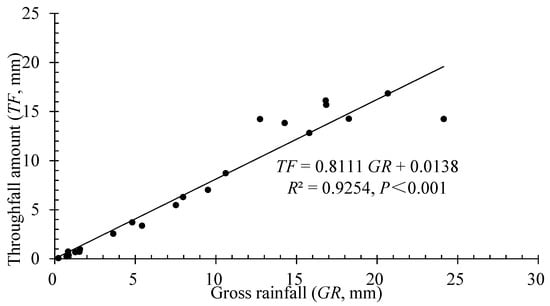
Figure 3.
The relationship between gross rainfall and throughfall amount which was based on mean values from 38 throughfall collectors.
Event throughfall as a proportion of total rainfall was 81.26% and ranged from 33.07 to 111.88%. Throughfall rate against gross rainfall is shown in Figure 4 by means of box and whisker plots. Throughfall rate increased with increasing gross rainfall amount, and gradually stabilize at larger rainfall events. Throughfall rate values greater than 100% were commonly monitored in larger rainfall events. In this study, we found that the mean throughfall rate of 12.73 mm event (19 July 2013) was higher than gross rainfall. The mean throughfall rate of 14.26 mm event (5 August 2013) was also as high as 97.07%. For these rainfall events, based on the data of rainfall characteristics (Table 2), we find the rainfall amount was heavy (more than 10 mm), the rainfall intensity (both hour intensity and 5 min max intensity) was large, and there, heavy rain had already occurred the day before these rainfall events. In addition, when the leaf area index value was small, the mean throughfall rate (0.83 mm rain event, 10 June 2013) can also be very high (90.28%).
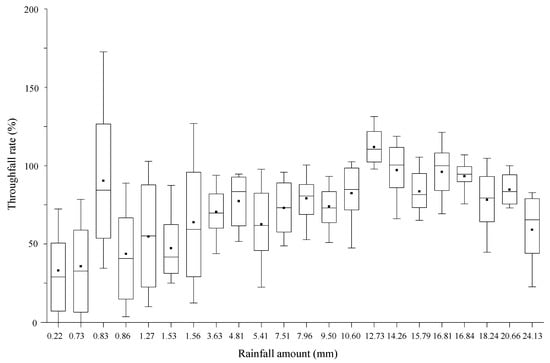
Figure 4.
Box and whisker plots of throughfall rate against rainfall amount. The center line, black solid squares, bottom and top of the boxes represent the median, average, 25th and 75th percentiles, respectively. The whiskers represent the 5th and 95th percentiles.
3.3. Throughfall Variability in Relation to Rainfall Properties
On a rainfall event basis, the coefficients of variation of throughfall (throughfall CVRP), which was derived from all 38 collectors, were found to be highly variable during the full leaf stage. The average throughfall CVRP which was derived from all 38 collectors was 34.67%, and varied from 9.62% to 89.07% for all rainfall events. Throughfall CVRP displayed a large variability for rainfall events <5 mm, and the throughfall CVRP became quasi-constant after reaching a gross rainfall input of 5 mm. This implies that higher rainfall amount would cause less spatial variability of throughfall.
At the event level, the CVRP of throughfall first sharply decreased and then began to stabilize with increasing rainfall amount (Figure 5a), rainfall duration (Figure 5b), and rainfall intensity (Figure 5c), respectively. There was a significant logarithmic function relationship between throughfall CVRP and rainfall amount and rainfall duration, but a power function relationship with rainfall intensity (Figure 5c). The threshold value was approximately at 5 mm for rainfall amount, 2 mm·h−1 for rainfall intensity, and 200 min for rainfall duration, respectively. This implies that rainfall amount, rainfall intensity, and rainfall duration have the same influence on the variation of throughfall.
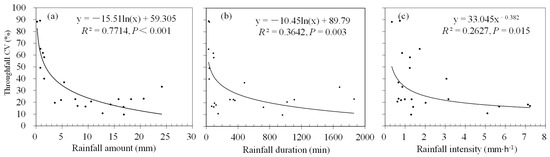
Figure 5.
Coefficient of variation of throughfall (throughfall CVRP) in relation to the rainfall amount (a), rainfall duration (b), and rainfall intensity (c).
3.4. Throughfall Variability in Relation to Canopy Structure
The coefficients of variation of throughfall of each collector (throughfall CVCS), which were derived from all 22 rainfall events, were found to be relatively stable during the full leaf stage. The average throughfall CVCS derived from each collector was 38.41%, and varied from 17.23 to 65.63% for all rainfall events. During the full leaf stage, throughfall variability was affected by tree locations and canopy structures. To investigate the possible effects of tree locations and canopy structures, the relationships between throughfall CVCS and distance from nearest trunk, canopy thickness, leaf area index (LAI) were investigated (Figure 6). There was a logarithmic function relationship between the throughfall CVCS and the distance from the nearest trunk. The CVCS of throughfall decreased with increasing distance from the nearest trunk (Figure 6a), with the highest being near the stem and the lowest in the canopy gaps. In contrast, throughfall CVCS has a linear relationship with canopy thickness and leaf area index (Figure 6b,c). The CVCS of throughfall increases with increasing canopy thickness and leaf area index. These tendencies are clearly visible in Figure 6.
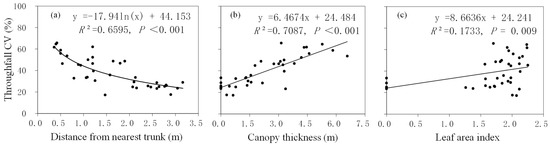
Figure 6.
Coefficient of variation of throughfall (throughfall CVCS) as a function of distance from nearest trunk (a), canopy thickness (b), and leaf area index (c).
Further regression analysis implies that there is a linear relationship existing between the accumulated throughfall, the distance from the nearest trunk, and the canopy thickness. Obviously, the accumulated throughfall amount increases with the greater distance from the nearest trunk and decreases with a thicker canopy. The regression equation is described as:
where ATH, DNT, and CT represent the accumulate throughfall (mm), distance from the nearest trunk (m), and canopy thickness (m), respectively.
ATH = 130.978 + 13.946DNT − 0.351CT, n = 33, R2 = 0.379, p = 0.001
3.5. Temporal Stability of Throughfall
We ranked the mean normalized throughfall from minimum to maximum and plotted the values, and the 95% confidence interval was used as the limit criteria of persistence (Figure 7). In the plot, the distance between the point and the horizontal axis shows the deviation of the variables from the median for all collectors. The temporal stability plot indicated the spatial distribution of throughfall was stable during the full leaf stage. According to the description in the method section, there are four kinds of temporal persistence were showed in Figure 7. Some collectors showed extreme dry persistence (e.g., 4, 16, 13, 17, 8, 3, 6, 7 and 5) or extreme wet persistence (e.g., 27, 12, 36, 31, 37, 34, 32, 33, 38 and 30), which would create extreme dry or extreme wet conditions on the ground surface. Some collectors showed general persistence (e.g., 14, 2, 10, 1, 15, 20, 28, 24, 22 and 21), which would result in relatively dry or relative wet points on the forest floor. At the same time, there were also some collectors that showed unstable persistence (e.g., 11, 23, 9, 26, 29, 18, 25, 19 and 35).
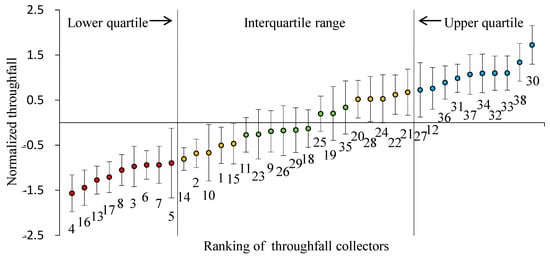
Figure 7.
Temporal stability plot of normalized throughfall during the full leaf stage. The upper and lower error whiskers represent the 95% confidence interval. Red solid circles: extreme dry persistent collectors; blue solid circles: extreme wet persistent collectors; yellow solid circles: general persistent collectors; green solid circles: instability persistent collectors. The Arabic numerals represent the serial number of throughfall collectors.
4. Discussion
4.1. Characteristics of Throughfall
The throughfall ratio is an important indicator of how much rainfall falls to the forest floor, and has been investigated in diverse forest types in China [32]. The mean cumulative throughfall ratio was 81.26% in this study. In the same area, this was lower than the throughfall ratio of 84.27% [33] in the Betula platyphylla forest, but higher than the throughfall ratio of 77.12% in Pinus sylvestris var. mongolica forest [34] during the whole growing season. The throughfall ratio was affected by the amount and location of throughfall collectors [20]. Previous studies have shown that the interception, throughfall, and stemflow of Larix gmelinii forest were 23.29%, 76.57%, and 0.14% of gross rainfall [29], respectively. In the research of [29], only five fixed trough gauges beneath the canopy of Larix gmelinii forest were used to estimate mean throughfall depth, and the particularity of the canopy gap area was ignored. However, 38 throughfall collectors were used to collect throughfall, and different positions of the canopy are considered in our study (Figure 1), which resulted in different throughfall ratios of Larix gmelinii forests in the same region. The higher throughfall percentage in our study may also be attributed to the large rainfall amount [29]. In this study, the average rainfall of 22 rainfall events was 8.9 mm (Table 2). When the rainfall is small, most of the rainfall is first intercepted by the forest canopy. With the increase in rainfall amount, throughfall begins to occur. When the rainfall exceeds the threshold of the canopy interception capacity, the throughfall increases sharply, which may take away some intercepted rainwater.
The coefficient of variation of throughfall (throughfall CV) has been reported in numerous studies [4,6,20]. The average CVRP (34.67%) and CVCS (38.41%) in this study were higher than that in most studies. Siegert et al. [35] reported that throughfall CV of a temperate deciduous forest ranged from approximately 15.9% to 20.1%, and Su et al. [4] found that the mean throughfall CV was 27.27% in a mixed evergreen-deciduous broadleaved forest in central China. The higher throughfall CV in our study may be attributed to the more collectors beneath the forest canopy, which could be greatly affected by meteorological conditions. For example, the windward side of the canopy receiving more rainfall would increase the canopy drip [6,25], and the movement of the canopy caused by strong wind would reduce water coalescence and increase spattered rainwater from the windward side canopy crown [36], causing greater throughfall variation. Furthermore, the amount and area of throughfall collectors, as well as the forest and rainfall characteristics of the aforementioned studies differed significantly from his study. Therefore, it is difficult to directly compare the throughfall spatial variability.
4.2. Influencing Factors of Spatial Heterogeneity of Throughfall
Most studies confirmed that the spatial distribution patterns of throughfall were affected by rainfall characteristics. The relationship between rainfall amount and throughfall CV has been well studied, but few studies have investigated the effect of rainfall intensity and rainfall duration on throughfall CV. Many studies have reported that throughfall CV has a power function [4,6,20] or linear regression [37,38] relationship with rainfall amount. The relationship between throughfall CV and rainfall intensity was a power function [4,38,39], and a power function relationship exists between throughfall CV and rainfall duration [6]. In our study, the throughfall CV has a logarithmic function relationship with rainfall amount and rainfall duration, but a power function with rainfall intensity (Figure 5), which was consistent with the above results. This shows that longer duration and/or higher intensity rainfall events have the same impact on throughfall variability as rainfall amount.
Throughfall spatial variability is caused by the interaction between rainfall and the forest canopy [25]. At present, most research has focused on the spatial distribution characteristics of throughfall [6,11], the optimal number of collectors to obtain a proper average throughfall [11,20,40], and the relationship between throughfall amount and the forest canopy [10,38]. Previous research has shown that there is no general consensus regarding the relationship between throughfall and the distance from the tree trunk [6,41], and the throughfall had no clear relationship with LAI [10,37,38]. However, Fang et al. [16] found there was linear correlation between throughfall and LAI, and the relationship weakened with increasing rainfall. In our study, we found that throughfall CV decreased with increasing distance from nearest trunk but increased with increasing canopy thickness and leaf area index (LAI). Distinguish the different sampling zones (inner canopy, canopy periphery, and beneath gaps) found that throughfall variability was significantly greater below tree canopies (inner canopy and canopy periphery) than beneath the gaps (Table 3). Additionally, throughfall heterogeneity was greater in the inner canopy compared with the canopy periphery. Our findings suggest that different canopy traits influence the throughfall variability and that the index of canopy thickness may be a good choice for analyzing the canopy effect on throughfall (Figure 6b).
Table 3.
Distribution of throughfall under the canopy of L. gmelinii.
The influences of canopy structure on throughfall variability are complex [25]. The spatial distribution of accumulate throughfall in a plot is also affected by many other factors such as crowding degree of trees, the mixed species, the stand density, the canopy overlapped density, tree traits (breast diameter, tree height), and even leaf traits [9,24,38]. For example, needle leaves or broad leaves will cause different throughfall volume in terms of the same canopy thickness. The distance from the nearest trunk as an influencing parameter of throughfall is not able to encompass the influence of surrounding trees, regardless of these neighbor trees adding canopy thickness. In particular, rainfall characteristics can also contribute to the spatial pattern of throughfall since lower intensity precipitation hardly bring throughfall under canopy [38]. Therefore, the model derived from only two parameters in this paper is not enough to accurately simulate the throughfall spatial distribution, and the application of the model is limited. Hence, the combined effect of multiple influencing factors should be considered in future study of modeling of the throughfall spatial distribution.
4.3. Temporal Stability of Throughfall
Throughfall has not only spatial variability but also temporal stability. In previous studies, throughfall displayed a high temporal stability [9,25,42], and this phenomenon was verified in this present study (Figure 6). Based on field observations, the extremely wet collectors were all beneath the gaps, the extremely dry and relatively dry persistent collectors were all in the inner the forest canopy, and the relatively wet and unstable persistence collectors were likely to be located underneath the canopy periphery. These results are consistent with the findings from studies in a subtropical deciduous forest [9], in a broadleaf-deciduous forest [43], and even under a single tree [11]. A possible explanation was that there were more branches, moss, and other epiphytes above the dry persistent collectors, which can store a lot of water during the full leaf stage. In addition, the branches and leaves at the canopy edge played the role of rain funnels, and the wet persistent collectors may have been just below the drop tips or under the canopy gaps. The forest canopy may be the deterministic factor controlling the persistence of throughfall variability.
5. Conclusions
In this present study, we analyzed the spatial variability of throughfall and its temporal stability in a larch forest. Specifically, we evaluated the effect of rainfall characteristics and canopy structure on the variability of throughfall. The results show that throughfall CV had a logarithmic function relationship with rainfall amount and rainfall duration and a power correlation with rainfall intensity, and the fitting effect of rainfall amount was the best (R2 = 0.7714, p < 0.001). We also found that throughfall CV decreased with an increase in the distance from the nearest trunk but increased with increasing canopy thickness and leaf area index (LAI), and the fitting effect of canopy thickness was the best (R2 = 0.7087, p < 0.001). The spatial pattern of throughfall was highly temporally stable during the full leaf stage, and led to the spatial distribution of soil water in forest land. Given the complex canopy and meteorological conditions (especially rainfall characteristics), long-term monitoring data spanning several years are needed to gain a deeper understanding of the temporal and spatial distribution patterns of throughfall and stemflow. Future studies need to quantify the effect of meteorological factors on the spatial distribution of throughfall and stemflow, as well as the spatiotemporal patterns of solute deposition in the larch forest.
Author Contributions
H.S. and T.C. conceived the idea and designed the research themes; H.S. performed the experiment and wrote the paper. T.C. contributed to data preparation. Both authors have read and agreed to the published version of the manuscript.
Funding
This work was supported by the Joint Funds of the National Natural Science Foundation of China (U20A2082), the Natural Science Foundation of Heilongjiang Province of China (LH2020C032), and Fundamental Research Funds for the Central Universities (2572018BA10).
Data Availability Statement
Datasets generated and/or analyzed during the current study are available from the corresponding author on request.
Acknowledgments
The authors extend sincere thanks to the Associate Editor and anonymous reviewers who provided comments to improve this manuscript.
Conflicts of Interest
The authors declare no conflict of interest.
References
- Durocher, M.G. Monitoring spatial variability of forest interception. Hydrol. Process. 1990, 4, 215–229. [Google Scholar] [CrossRef]
- Sheng, H.C.; Cai, T.J. Influence of rainfall on canopy interception in mixed broad-leaved-Korean pine forest in Xiaoxing’an Mountains, northeastern China. Forests 2019, 10, 248. [Google Scholar] [CrossRef]
- Van Stan, J.T.; Gordon, D.A. Mini-review: Stemflow as a resource limitation to near-stem soils. Front. Plant Sci. 2018, 9, 248. [Google Scholar] [CrossRef] [PubMed]
- Su, L.; Xie, Z.Q.; Xu, W.T.; Zhao, C.M. Variability of throughfall quantity in a mixed evergreen-deciduous broadleaved forest in central China. J. Hydrol. Hydromech. 2019, 67, 225–231. [Google Scholar] [CrossRef]
- Levia, D.F.; Nanko, K.; Amasaki, H.; Giambelluca, T.W.; Hotta, N.; Iida, S.; Mudd, R.G.; Nullet, M.A.; Sakai, N.; Shinohara, Y.; et al. Throughfall partitioning by trees. Hydrol. Process. 2019, 33, 1698–1708. [Google Scholar] [CrossRef]
- Zhang, Y.F.; Wang, X.P.; Hu, R.; Pan, Y.X. Throughfall and its spatial variability beneath xerophytic shrub canopies within water-limited arid desert ecosystems. J. Hydrol. 2016, 539, 406–416. [Google Scholar] [CrossRef]
- Janeau, J.L.; Grellier, S.; Podwojewski, P. Influence of rainfall interception by endemic plants versus short cycle crops on water infiltration in high altitude ecosystems of Ecuador. Hydrol. Res. 2015, 46, 1008–1018. [Google Scholar] [CrossRef]
- Yousefi, S.; Sadeghi, S.H.; Mirzaee, S.; Ploeg, M.V.D.; Keesstra, S.; Cerdà, A. Spatio-temporal variation of throughfall in a hyrcanian plain forest stand in Northern Iran. J. Hydrol. Hydromech. 2018, 66, 97–106. [Google Scholar] [CrossRef]
- Zhang, H.X.; Wu, H.W.; Li, J.; He, B.; Liu, J.F.; Wang, N.; Duan, W.L.; Liao, A.M. Spatial-temporal variability of throughfall in a subtropical deciduous forest from the hilly regions of eastern China. J. Mt. Sci. 2019, 16, 1788–1801. [Google Scholar] [CrossRef]
- Kowalska, A.; Boczoń, A.; Hildebrand, R.; Polkowska, Ż. Spatial variability of throughfall in a stand of scots pine (pinus sylvestris L.) with deciduous admixture as influenced by canopy cover and stem distance. J. Hydrol. 2016, 538, 231–242. [Google Scholar] [CrossRef]
- Fathizadeh, O.; Sadeghi, S.M.M.; Holder, C.; Su, L. Leaf phenology drives spatio-temporal patterns of throughfall under a single quercus castaneifolia C.A.Mey. Forests 2020, 11, 688. [Google Scholar] [CrossRef]
- Hall, R.L. Interception loss as a function of rainfall and forest types: Stochastic modelling for tropical canopies revisited. J. Hydrol. 2003, 280, 1–12. [Google Scholar] [CrossRef]
- Nanko, K.; Onda, Y.; Ito, A.; Moriwaki, H. Spatial variability of throughfall under a single tree: Experimental study of rainfall amount, raindrops, and kinetic energy. Agric. For. Meteorol. 2011, 151, 1173–1182. [Google Scholar] [CrossRef]
- Staelens, J.; De Schrijver, A.; Verheyen, K.; Verhoest, N.E.C. Rainfall partitioning into throughfall, stemflow, and interception within a single beech (Fagus sylvatica L.) canopy: Influence of foliation, rain event characteristics, and meteorology. Hydrol. Process. 2008, 22, 33–45. [Google Scholar] [CrossRef]
- Kato, H.; Onda, Y.; Kazuki, N.; Gomi, T.; Yamanaka, T.; Kawaguchi, S. Effect of canopy interception on spatial variability and isotopic composition of throughfall in Japanese cypress plantations. J. Hydrol. 2013, 504, 1–11. [Google Scholar] [CrossRef]
- Fang, S.M.; Zhao, C.Y.; Jian, S.Q. Spatial variability of throughfall in a Pinus tabulaeformis plantation forest in Loess Plateau, China. Scand. J. For. Res. 2016, 31, 1–39. [Google Scholar] [CrossRef]
- Vellak, K.; Paal, J.; Liira, J. Diversity and distribution pattern of bryophytes and vascular plants in a boreal spruce forest. Silva Fenn. 2003, 37, 3–13. [Google Scholar] [CrossRef]
- Sun, X.; Onda, Y.; Chiara, S.; Kato, H.; Gomi, T. The effect of strip thinning on spatial and temporal variability of throughfall in a Japanese cypress plantation. Hydrol. Process. 2015, 29, 5058–5070. [Google Scholar] [CrossRef]
- Shi, L.; Sheng, H.C.; Man, X.L.; Cai, T.J. Rainfall redistribution and the spatial heterogeneity of throughfall in Larix gmelinii forest, northeast China. J. Nanjing For. Univ. 2017, 41, 90–96, (In Chinese with English abstract). [Google Scholar]
- Shen, H.T.; Wang, X.X.; Jiang, Y.; You, W.H. Spatial variations of throughfall through secondary succession of evergreen broad-leaved forests in eastern China. Hydrol. Process. 2012, 26, 1739–1747. [Google Scholar]
- Carlyle-Moses, D.E.; Laureano, J.S.F.; Price, A.G. Throughfall and throughfall spatial variability in Madrean oak forest communities of northeastern Mexico. J. Hydrol. 2004, 297, 124–135. [Google Scholar] [CrossRef]
- Sun, X.C.; Onda, Y.C.; Kato, H.K.; Gomic, T.S.; Liu, X.Y. Estimation of throughfall with changing stand structures for Japanese cypress and cedar plantations. For. Ecol. Manag. 2017, 402, 145–156. [Google Scholar] [CrossRef]
- Sadeghi, S.M.M.; Van Stan, J.T.; Pypker, T.G.; Tamjidi, J.; Friesen, J.; Farahnaklangroudi, M. Importance of transitional leaf states in canopy rainfall partitioning dynamics. Eur. J. For. Res. 2018, 137, 121–130. [Google Scholar] [CrossRef]
- Zhang, W.J.; Liu, W.J.; Li, W.X.; Zhu, X.A.; Chen, C.F.; Zeng, H.H.; Jiang, X.J.; Singh, A.K.; Yang, B. Characteristics of throughfall kinetic energy under the banana (Musa nana Lour.) canopy: The role of leaf shapes. Catena 2021, 197, 104985. [Google Scholar] [CrossRef]
- Carlyle-Moses, D.E.; Lishman, C.E. Temporal persistence of throughfall heterogeneity below and between the canopies of juvenile lodgepole pine (Pinus contorta). Hydrol. Process. 2015, 29, 4051–4067. [Google Scholar] [CrossRef]
- Liu, J.L.; Cheng, F.Y.; Munger, W.; Jiang, P.; Whitby, T.G.; Chen, S.Y.; Ji, W.W.; Man, X.L. Precipitation extremes influence patterns and partitioning of evapotranspiration and transpiration in a deciduous boreal larch forest. Agric. For. Meteorol. 2020, 287, 107936. [Google Scholar] [CrossRef]
- Duan, L.L.; Man, X.L.; Kurylyk, B.L.; Cai, T.J.; Li, Q. Distinguishing streamflow trends caused by changes in climate, forest cover, and permafrost in a large watershed in northeastern China. Hydrol. Process. 2017, 31, 1938–1951. [Google Scholar] [CrossRef]
- Duan, L.L.; Cai, T.J. Quantifying Impacts of Forest Recovery on Water Yield in Two Large Watersheds in the Cold Region of Northeast China. Forests 2018, 9, 392. [Google Scholar] [CrossRef]
- Sheng, H.C.; Cai, T.J.; Li, Y.; Liu, Y.J. Rainfall redistribution in Larix gmelinii forest on northern of Daxing’an Mountains, northeast of China. J. Soil Water Conserv. 2014, 28, 101–105, (In Chinese with English abstract). [Google Scholar]
- Zimmermann, A.; Germer, S.; Neill, C.; Krusche, A.V.; Elsenbeer, H. Spatiotemporal patterns of throughfall and solute deposition in an open tropical rain forest. J. Hydrol. 2008, 360, 87–102. [Google Scholar] [CrossRef]
- Keim, R.F.; Skaugset, A.E.; Weiler, M. Temporal persistence of spatial patterns in throughfall. J. Hydrol. 2005, 314, 263–274. [Google Scholar] [CrossRef]
- Wei, X.H.; Liu, S.R.; Zhou, G.Y.; Wang, C.K. Hydrological processes in major types of Chinese forest. Hydrol. Process. 2005, 19, 63–75. [Google Scholar] [CrossRef]
- Tian, Y.H.; Man, X.L.; Liu, X.; Li, Y. Research on rainfall redistribution of Betula platyphylla secondary forests in north of Greater Xing’an Mountains. J. Soil Water Conserv. 2014, 28, 109–113, (In Chinese with English abstract). [Google Scholar]
- Li, Y.; Cai, T.J.; Man, X.L.; Sheng, H.C.; Ju, C.Y. Canopy interception loss in a Pinus sylvestris var. mongolica forest of Northeast China. J. Arid Land 2015, 7, 831–840. [Google Scholar] [CrossRef]
- Siegert, C.M.; Levia, D.F.; Hudson, S.A.; Dowtin, A.L.; Zhang, F.; Mitchell, M.J. Small-scale topographic variability influences tree species distribution and canopy throughfall partitioning in a temperate deciduous forest. For. Ecol. Manag. 2016, 359, 109–117. [Google Scholar] [CrossRef]
- Nanko, K.; Hotta, N.; Suzuki, M. Evaluating the influenc e of canopy species and meteorological factors on throughfall drop size distribution. J. Hydrol. 2006, 329, 422–431. [Google Scholar] [CrossRef]
- Teale, N.G.; Mahan, H.; Bleakney, S.; Berger, A.; Shibley, N.; Frauenfeld, O.W.; Quiring, S.M.; Rapp, A.D.; Roark, E.B.; Washington-Allen, R. Impacts of vegetation and precipitation on throughfall heterogeneity in a tropical premontane transitional cloud forest. Biotropica 2014, 46, 667–676. [Google Scholar] [CrossRef]
- Liu, J.Q.; Liu, W.J.; Li, W.X.; Zeng, H.H. How does a rubber plantation affect the spatial variability and temporal stability of throughfall? Hydrol. Res. 2019, 50, 60–74. [Google Scholar] [CrossRef]
- Fan, J.L.; Oestergaard, K.T.; Guyot, A.; Jensen, D.G.; Lockington, D.A. Spatial variability of throughfall and stemflow in an exotic pine plantation of subtropical coastal Australia. Hydrol. Process. 2015, 29, 793–804. [Google Scholar] [CrossRef]
- He, Z.B.; Yang, J.J.; Du, J.; Zhao, W.Z.; Liu, H.; Chang, X.X. Spatial variability of canopy interception in a spruce forest of the semiarid mountain regions of China. Agric. For. Meteorol. 2014, 188, 58–63. [Google Scholar] [CrossRef]
- Nanko, K.; Onda, Y.; Kato, H.; Gomi, T. Immediate change in throughfall spatial distribution and canopy water balance after heavy thinning in a dense mature Japanese cypress plantation. Ecohydrology 2016, 9, 300–314. [Google Scholar] [CrossRef]
- Sato, A.M.; Avelar, A.D.; Netto, A.L.C. Spatial variability and temporal stability of throughfall in a eucalyptus plantation in the hilly lowlands of southeastern Brazil. Hydrol. Process. 2011, 25, 1910–1923. [Google Scholar] [CrossRef]
- Hsueh, Y.; Allen, S.T.; Keim, R.F. Fine-scale spatial variability of throughfall amount and isotopic composition under a hardwood forest canopy. Hydrol. Process. 2016, 30, 1796–1803. [Google Scholar] [CrossRef]
Publisher’s Note: MDPI stays neutral with regard to jurisdictional claims in published maps and institutional affiliations. |
© 2021 by the authors. Licensee MDPI, Basel, Switzerland. This article is an open access article distributed under the terms and conditions of the Creative Commons Attribution (CC BY) license (http://creativecommons.org/licenses/by/4.0/).