
The Influence of Forest Management and Changed Hydrology on Soil Biochemical Properties in a Central-European Floodplain Forest

 , , , ,
Abstract
1. Introduction
2. Materials and Methods
2.1. Study Area
2.2. Study Sites
2.3. Soil Sampling
2.4. Laboratory Analysis
2.5. Statistical Analyses
3. Results
3.1. The Between-Site Variation in Soil Properties
3.2. The Annual Variation in Soil Properties
3.3. The Within-Site Variation of Soil Biological Properties
4. Discussion
4.1. Soil OC and N Dynamics in Floodplain Forest Soils
4.2. Effects of the Water Regime on Soil Chemistry
4.3. The Influence of Mineral Accumulation on Soil Biochemical Properties
5. Conclusions
Author Contributions
Funding
Institutional Review Board Statement
Informed Consent Statement
Data Availability Statement
Acknowledgments
Conflicts of Interest
Appendix A

| Site | Water | Sample | pH | EC µS·cm−1 | TDS mg·L−1 | HCO3− mg·L−1 | SO42− mg·L−1 | Cl− mg·L−1 | Na+ mg·L−1 | Ca2+ mg·L−1 | Mg2+ mg·L−1 | Fe mg·L−1 | Mn mg·L−1 | Depth m * |
|---|---|---|---|---|---|---|---|---|---|---|---|---|---|---|
| PL | GW | ČGS (2014) | 7.06 | 1160 | 940 | 360 | 210 | 94 | 48 | 150 | 41 | 4.60 | 1.50 | n.a. |
| GW | Novotná (2014) | 7.25 | 4290 | 3975 | 663 | 1740 | 505 | 346 | 515 | 227 | 5.25 | 0.15 | n.a. | |
| GW | Franzová (1988) | 7.14 | 1178 | 1158 | 482 | 350 | 27 | 36 | 183 | 70 | 2.56 | 0.24 | n.a. | |
| GW | Franzová (1988) | 7.12 | 1578 | 1500 | 543 | 460 | 45 | 108 | 247 | 87 | 3.97 | 0.45 | n.a. | |
| GW | Franzová (1988) | 6.91 | 1671 | 1752 | 525 | 503 | 69 | 102 | 263 | 85 | 7.27 | 0.61 | n.a. | |
| GW | Franzová (1988) | 7.00 | 1630 | 1423 | 505 | 390 | 57 | 142 | 263 | 55 | 5.68 | 2.01 | n.a. | |
| GW | Franzová (1988) | 7.01 | 1104 | 976 | 436 | 187 | 31 | 92 | 180 | 36 | 8.69 | 1.59 | n.a. | |
| GW | Franzová (1988) | 7.18 | 1179 | 1072 | 412 | 285 | 36 | 85 | 203 | 36 | 7.81 | 1.81 | n.a. | |
| PL | GW | PL1 | 6.70 | 6890 | 5,238 | 683 | 1590 | 1420 | 348 | 879 | 309 | <0.10 | 1.36 | 0.41 |
| GW | PL3 | 6.90 | 1430 | 1198 | 453 | 352 | 78 | 30 | 197 | 78 | <0.10 | 0.19 | 0.70 | |
| GW | PL4 | 7.05 | 1230 | 973 | 459 | 151 | 106 | 54 | 144 | 52 | 0.12 | 0.29 | 0.79 | |
| BE | GW | BE 1 | 6.81 | 1040 | 820 | 358 | 166 | 75 | 34 | 127 | 43 | 5.68 | 1.68 | 3.33 |
| GW | BE 2 | 6.68 | 1420 | 1074 | 414 | 212 | 150 | 55 | 166 | 57 | 5.24 | 3.80 | 3.00 | |
| PL | SW | PL 101 | 7.34 | 920 | 698 | 314 | 111 | 81 | 46 | 102 | 32 | <0.10 | <0.05 | – |
| SW | PL 102 | 7.77 | 1290 | 1044 | 529 | 131 | 110 | 60 | 150 | 57 | <0.10 | <0.05 | – | |
| SW | PL 103 | 7.26 | 2880 | 2,230 | 671 | 557 | 355 | 206 | 323 | 112 | <0.10 | <0.05 | – | |
| SW | PL 104 | 7.58 | 2400 | 1889 | 549 | 542 | 260 | 126 | 291 | 108 | 0.14 | 1.28 | – | |
| SW | PL 105 | 7.04 | 1000 | 773 | 350 | 118 | 90 | 51 | 117 | 34 | <0.10 | 0.15 | – | |
| SW | PL 106 | 7.07 | 820 | 620 | 243 | 125 | 77 | 45 | 85 | 22 | 0.13 | 0.22 | – | |
| SW | PL 107 | 7.31 | 920 | 715 | 314 | 106 | 99 | 49 | 104 | 30 | <0.10 | <0.05 | – | |
| SW | PL 108 | 7.49 | 2070 | 1583 | 470 | 474 | 200 | 107 | 228 | 102 | <0.10 | <0.05 | – | |
| SW | PL 109 | 7.35 | 1200 | 930 | 375 | 181 | 117 | 58 | 140 | 46 | <0.10 | <0.05 | – | |
| SW | PL 110 | 7.24 | 830 | 603 | 240 | 104 | 80 | 49 | 85 | 22 | <0.10 | 0.17 | – | |
| BE | SW | BE 101 | 7.77 | 630 | 435 | 129 | 105 | 60 | 37 | 50 | 23 | <0.10 | 0.05 | – |
| SW | BE 102 | 7.59 | 620 | 428 | 126 | 104 | 59 | 37 | 48 | 22 | <0.10 | <0.05 | – |

| Average Temperature (°C) | Total Precipitation (mm) | |||
|---|---|---|---|---|
| Month/Year | 2019 | 2020 | 2019 | 2020 |
| January | 0.3 | 0.1 | 32.1 | 12.1 |
| February | 2.3 | 5.2 | 11.2 | 26.4 |
| March | 7.1 | 5.8 | 14.9 | 22.6 |
| April | 11.8 | 10.5 | 20.6 | 11.2 |
| May | 12.7 | 13.1 | 93.5 | 70.9 |
| June | 22.5 | 18.2 | 96.9 | 227.8 |
| July | 20.5 | 19.5 | 75.8 | 69.8 |
| August | 20.9 | 20.7 | 65.4 | 69.0 |
| September | 14.8 | 15.2 | 52.3 | 83.8 |
| October | 10.1 | 10.4 | 32.8 | 79.2 |
| November | 7.4 | 4.9 | 38.6 | 24.4 |
| December | 2.2 | 2.9 | 47.9 | 34.3 |
| January–December | 11.0 | 10.5 | 582.0 | 731.5 |


References
- Oswalt, S.N.; King, S.L. Channelization and floodplain forests: Impacts of accelerated sedimentation and valley plug formation on floodplain forests of the Middle Fork Forked Deer River, Tennessee, USA. For. Ecol. Manag. 2005, 215, 69–83. [Google Scholar] [CrossRef]
- Tockner, K.; Bunn, S.; Gordon, C.; Naiman, J.; Robert, P.Q.; Gerry, A.; Stanford, J. Flood plains: Critically threatened ecosystems. In Aquatic Ecosystems. Trends and Global Prospects; Polunin, N.V.C., Ed.; Cambridge University Press: Cambridge, UK, 2008; pp. 45–61. ISBN 9780521833271. [Google Scholar]
- Kowalska, N.; Šigut, L.; Stojanović, M.; Fischer, M.; Kyselova, I.; Pavelka, M. Analysis of floodplain forest sensitivity to drought. Philos. Trans. R. Soc. B Biol. Sci. 2020, 375, 20190518. [Google Scholar] [CrossRef]
- Pautou, G.; Décamps, H.; Fortuné, M.; Gazelle, F. Historical influence of man on the riparian dynamics of a fluvial landscape. Landsc. Ecol. 1988, 1, 163–173. [Google Scholar] [CrossRef]
- Nilsson, C.; Berggren, K. Alterations of Riparian Ecosystems Caused by River Regulation. BioScience 2000, 50, 783–792. [Google Scholar] [CrossRef]
- Schindler, M.; Jungmann, L.; Donath, T.W.; Ludewig, K. Influence of flooding duration and aeration on saplings of ten hardwood floodplain forest species. PLoS ONE 2020, 15, e0234936. [Google Scholar] [CrossRef] [PubMed]
- Gallardo, A. Spatial Variability of Soil Properties in a Floodplain Forest in Northwest Spain. Ecosystems 2003, 6, 564–576. [Google Scholar] [CrossRef]
- Acosta, M.; Darenova, E.; Dušek, J.; Pavelka, M. Soil carbon dioxide fluxes in a mixed floodplain forest in the Czech Republic. Eur. J. Soil Biol. 2017, 82, 35–42. [Google Scholar] [CrossRef]
- Sutfin, N.A.; Wohl, E.E.; Dwire, K.A. Banking carbon: A review of organic carbon storage and physical factors influencing retention in floodplains and riparian ecosystems. Earth Surf. Process. Landf. 2015, 41, 38–60. [Google Scholar] [CrossRef]
- Ricker, M.C.; Lockaby, B.G. Soil Organic Carbon Stocks in a Large Eutrophic Floodplain Forest of the Southeastern Atlantic Coastal Plain, USA. Wetlands 2015, 35, 291–301. [Google Scholar] [CrossRef]
- Pechanec, V.; Machar, I.; Sterbova, L.; Prokopova, M.; Kilianova, H.; Chobot, K.; Cudlin, P. Monetary Valuation of Natural Forest Habitats in Protected Areas. Forests 2017, 8, 427. [Google Scholar] [CrossRef]
- Stromberg, J.C.; Tiller, R.; Richter, B. Effects of Groundwater Decline on Riparian Vegetation of Semiarid Regions: The San Pedro, Arizona. Ecol. Appl. 1996, 6, 113–131. [Google Scholar] [CrossRef]
- Machar, I.; Hager, H.; Pechanec, V.; Kulhavy, J.; Mindas, J. Floodplain Forests—Key Forest Ecosystems for Maintaining and Sustainable Management of Water Resources in Alluvial Landscape. In Management of Water Resources in Poland; Zeleňáková, M., Kubiak-Wójcicka, K., Negm, A., Eds.; Springer International Publishing: Cham, Switzerland, 2019; pp. 249–274. [Google Scholar]
- Achat, D.L.; Fortin, M.; Landmann, G.; Ringeval, B.; Augusto, L. Forest soil carbon is threatened by intensive biomass harvesting. Sci. Rep. 2015, 5, 15991. [Google Scholar] [CrossRef] [PubMed]
- Cseh, V.; Kiss, M.; Tanács, E. Carbon sequestration of floodplain forests: A case study from Hungary, Maros river valley. Tiscia 2014, 40, 3–10. [Google Scholar]
- Lininger, K.B.; Polvi, L.E. Evaluating floodplain organic carbon across a gradient of human alteration in the boreal zone. Geomorphology 2020, 370, 107390. [Google Scholar] [CrossRef]
- Pietsch, S.A.; Hasenauer, H.; Kučera, J.; Čermák, J. Modeling effects of hydrological changes on the carbon and nitrogen balance of oak in floodplains. Tree Physiol. 2003, 23, 735–746. [Google Scholar] [CrossRef]
- Kuzmina, Z.V.; Treshkin, S.E.; Karimova, T.Y. Effects of river flow regulation and climate fluctuations on dynamic changes in the terrestrial ecosystems of the Lower Volga delta and floodplain. Arid. Ecosyst. 2015, 5, 230–242. [Google Scholar] [CrossRef]
- Goenster-Jordan, S.; Jannoura, R.; Jordan, G.; Buerkert, A.; Joergensen, R.G. Spatial variability of soil properties in the floodplain of a river oasis in the Mongolian Altay Mountains. Geoderma 2018, 330, 99–106. [Google Scholar] [CrossRef]
- Noe, G.B.; Krauss, K.W.; Lockaby, B.G.; Conner, W.H.; Hupp, C.R. The effect of increasing salinity and forest mortality on soil nitrogen and phosphorus mineralization in tidal freshwater forested wetlands. Biogeochemistry 2013, 114, 225–244. [Google Scholar] [CrossRef]
- Wang, W.; McDowell, N.G.; Ward, N.D.; Indivero, J.; Gunn, C.; Bailey, V.L. Constrained tree growth and gas exchange of seawater-exposed forests in the Pacific Northwest, USA. J. Ecol. 2019, 107, 2541–2552. [Google Scholar] [CrossRef]
- Yabusaki, S.B.; Myers-Pigg, A.N.; Ward, N.D.; Waichler, S.R.; Sengupta, A.; Hou, Z.; Chen, X.; Fang, Y.; Duan, Z.; Serkowski, J.A.; et al. Floodplain Inundation and Salinization from a Recently Restored First-Order Tidal Stream. Water Resour. Res. 2020, 56. [Google Scholar] [CrossRef]
- Herbert, E.R.; Boon, P.; Burgin, A.J.; Neubauer, S.C.; Franklin, R.B.; Ardón, M.; Hopfensperger, K.N.; Lamers, L.P.M.; Gell, P. A global perspective on wetland salinization: Ecological consequences of a growing threat to freshwater wetlands. Ecosphere 2015, 6, art206. [Google Scholar] [CrossRef]
- Saviozzi, A.; Cardelli, R.; di Puccio, R. Impact of Salinity on Soil Biological Activities: A Laboratory Experiment. Commun. Soil Sci. Plant Anal. 2011, 42, 358–367. [Google Scholar] [CrossRef]
- Machado, R.M.A.; Serralheiro, R.P.; Machado, R.M.A.; Serralheiro, R.P. Soil Salinity: Effect on Vegetable Crop Growth. Management Practices to Prevent and Mitigate Soil Salinization. Horticulturae 2017, 3, 30. [Google Scholar] [CrossRef]
- Eriksen, J.; Murphy, M.D.; Schnug, E. The Soil Sulphur Cycle. In Sulphur in Agroecosystems; Schnug, E., Ed.; Springer: Dordrecht, The Netherlands, 1998; pp. 39–73. [Google Scholar]
- Lamers, L.P.; Dolle, G.E.T.; Berg, S.T.V.D.; van Delft, S.P.; Roelofs, J.G. Differential responses of freshwater wetland soils to sulphate pollution. Biogeochemistry 2001, 55, 87–101. [Google Scholar] [CrossRef]
- Loeppert, R.H.; Inskeep, W.P. Iron. In Methods of Soil Analysis, Part 3: Chemical Methods; Sparks, D.L., Page, A.L., Helmke, P.A., Loeppert, R.H., Soltanpour, P.N., Tabatabai, M.A., Johnston, C.T., Sumner, M.E., Eds.; Soil Science Society of America and American Society of Agronomy: Madison, WI, USA, 1996; pp. 639–664. [Google Scholar]
- Gambrell, R.P. Manganese. In Methods of Soil Analysis, Part 3: Chemical Methods; Sparks, D.L., Page, A.L., Helmke, P.A., Loeppert, R.H., Soltanpour, P.N., Tabatabai, M.A., Johnston, C.T., Sumner, M.E., Eds.; Soil Science Society of America and American Society of Agronomy: Madison, WI, USA, 1996; pp. 665–682. [Google Scholar]
- Hernandez, L.; Probst, A.; Probst, J.L.; Ulrich, E. Heavy metal distribution in some French forest soils: Evidence for atmospheric contamination. Sci. Total Environ. 2003, 312, 195–219. [Google Scholar] [CrossRef]
- Norouzi, M.; Ramezanpour, H. Effect of Fire on Chemical Forms of Iron and Manganese in Forest Soils of Iran. Environ. Forensics 2013, 14, 169–177. [Google Scholar] [CrossRef]
- Sun, T.; Cui, Y.; Berg, B.; Zhang, Q.; Dong, L.; Wu, Z.; Zhang, L. A test of manganese effects on decomposition in forest and cropland sites. Soil Biol. Biochem. 2019, 129, 178–183. [Google Scholar] [CrossRef]
- Berg, B.; Davey, M.P.; de Marco, A.; Emmett, B.; Faituri, M.; Hobbie, S.E.; Johansson, M.-B.; Liu, C.; McClaugherty, C.; Norell, L.; et al. Factors influencing limit values for pine needle litter decomposition: A synthesis for boreal and temperate pine forest systems. Biogeochemistry 2010, 100, 57–73. [Google Scholar] [CrossRef]
- Hofrichter, M. Review: Lignin conversion by manganese peroxidase (MnP). Enz. Microb. Technol. 2002, 30, 454–466. [Google Scholar] [CrossRef]
- Středová, H.; Středa, T.; Rožnovský, J. Long-term comparison of climatological variables used for agricultural land appraisement. Contrib. Geophys. Geod. 2013, 43, 179–195. [Google Scholar] [CrossRef]
- Novotná, J.; Juřička, D.; Burnog, M.; Kotlánová, M.; Kynický, J. Remote Infiltration Areas as a Main Source of Ground Water for Floodplain Forest Without Floods. Acta Univ. Agric. Silvic. Mendel. Brun. 2019, 67, 723–731. [Google Scholar] [CrossRef]
- Franzová, M. A Report on the Hydrogeological Survey at Localities Iváň I, II, and III; GEOtest, a.s.: Slatina, Czech Republic, 1988. (In Czech) [Google Scholar]
- Czech Geological Survey the Database of Geologicaly Documented Objects: Chemical Analysis 2018. Available online: http://www.geology.cz/app/gdo (accessed on 14 March 2018). (In Czech).
- Novotná, J. A Protocol on the laboratory Analysis No. 3201—818/2014; GEOtest, a.s.: Slatina, Czech Republic, 2014. (In Czech) [Google Scholar]
- IUSS Working Group. World Reference Base for Soil Rsources 2014, Update 2015; World Soil Resources Reports No. 106; FAO: Rome, Italy, 2015. [Google Scholar]
- Zanella, A.; Jabiol, B.; Ponge, J.-F.; Sartori, G.; de Waal, R.; van Delft, B.; Graefe, U.; Cools, N.; Katzensteiner, K.; Hager, H.; et al. A European morpho-functional classification of humus forms. Geoderma 2011, 164, 138–145. [Google Scholar] [CrossRef]
- Zbíral, J.; Malý, S.; Čižmár, D. Soil Analysis III: The Unified Methods; ÚKZÚZ Brno: Brno, Czech Republic, 2011. (in Czech) [Google Scholar]
- Mehlich, A. Mehlich 3 soil test extractant: A modification of Mehlich 2 extractant. Commun. Soil Sci. Plant Anal. 1984, 15, 1409–1416. [Google Scholar] [CrossRef]
- Gömöryová, E.; Vass, D.; Pichler, V.; Gömöry, D. Effect of alginite amendment on microbial activity and soil water content in forest soils. Biologia 2009, 64, 585–588. [Google Scholar] [CrossRef]
- RCore Team. A Language and Environment for Statistical Computing; R Foundation for Statistical Computing: Vienna, Austria, 2016. [Google Scholar]
- Venables, W.N.; Ripley, B.D. Modern Applied Statistics with S, 4th ed.; Springer: New York, NY, USA, 2002; ISBN 0-387-95457-0. [Google Scholar]
- Jandl, R.; Lindner, M.; Vesterdal, L.; Bauwens, B.; Baritz, R.; Hagedorn, F.; Johnson, D.W.; Minkkinen, K.; Byrne, K.A. How strongly can forest management influence soil carbon sequestration? Geoderma 2007, 137, 253–268. [Google Scholar] [CrossRef]
- Wäldchen, J.; Schulze, E.-D.; Schöning, I.; Schrumpf, M.; Sierra, C. The influence of changes in forest management over the past 200years on present soil organic carbon stocks. For. Ecol. Manag. 2013, 289, 243–254. [Google Scholar] [CrossRef]
- James, J.; Harrison, R. The Effect of Harvest on Forest Soil Carbon: A Meta-Analysis. Forests 2016, 7, 308. [Google Scholar] [CrossRef]
- Lal, R. Forest soils and carbon sequestration. For. Ecol. Manag. 2005, 220, 242–258. [Google Scholar] [CrossRef]
- Cierjacks, A.; Kleinschmit, B.; Kowarik, I.; Graf, M.; Lang, F. Organic matter distribution in floodplains can be predicted using spatial and vegetation structure data. River Res. Appl. 2010, 27, 1048–1057. [Google Scholar] [CrossRef]
- Samaritani, E.; Mitchell, E.A.; Rich, J.; Shrestha, J.; Fournier, B.; Frey, B. Soil bacterial communities and ecosystem functioning change more strongly with season than habitat in a restored floodplain. Appl. Soil Ecol. 2017, 112, 71–78. [Google Scholar] [CrossRef]
- Rhoades, J.; Kandiah, A.; Mashali, A.M. The Use of Saline Waters for Crop Production; FAO Irrigation and Drainage Paper 48; FAO: Rome, Italy, 1992. [Google Scholar]
- Swenson, H.; Baldwin, H. A Primer on Water Quality: USGS General Interest Publication; USGS: Reston, VA, USA, 1965.
- Pereira, C.S.; Lopes, I.; Sousa, J.P.; Chelinho, S. Effects of NaCl and seawater induced salinity on survival and reproduction of three soil invertebrate species. Chemosphere 2015, 135, 116–122. [Google Scholar] [CrossRef]
- Yin, S.; Bai, J.; Wang, W.; Zhang, G.; Jia, J.; Cui, B.; Liu, X. Effects of soil moisture on carbon mineralization in floodplain wetlands with different flooding frequencies. J. Hydrol. 2019, 574, 1074–1084. [Google Scholar] [CrossRef]
- Mayer, B.; Fritz, P.; Prietzel, J.; Krouse, H. The use of stable sulfur and oxygen isotope ratios for interpreting the mobility of sulfate in aerobic forest soils. Appl. Geochem. 1995, 10, 161–173. [Google Scholar] [CrossRef]
- Žalud, Z.; Brotan, J.; Hlavinka, P.; Trnka, M. Trends in temperature and precipitation in the period of 1961–2010 in Žabčice locality. Acta Univ. Agric. Silvic. Mendel. Brun. 2013, 61, 1521–1531. [Google Scholar] [CrossRef]
- Fukalová, P.; Středová, H.; Vejtasová, K. Development and Prediction of Selected Temperature and Precipitation Characteristics in Southern Moravia. Acta Univ. Agric. Silvic. Mendel. Brun. 2014, 62, 91–98. [Google Scholar] [CrossRef]
- Rinklebe, J.; Langer, U. Microbial diversity in three floodplain soils at the Elbe River (Germany). Soil Biol. Biochem. 2006, 38, 2144–2151. [Google Scholar] [CrossRef]
- Berg, B.; Erhagen, B.; Johansson, M.-B.; Nilsson, M.; Stendahl, J.; Trum, F.; Vesterdal, L. Manganese in the litter fall-forest floor continuum of boreal and temperate pine and spruce forest ecosystems—A review. For. Ecol. Manag. 2015, 358, 248–260. [Google Scholar] [CrossRef]
- Trum, F.; Titeux, H.; Ponette, Q.; Berg, B. Influence of manganese on decomposition of common beech (Fagus sylvatica L.) leaf litter during field incubation. Biogeochemistry 2015, 125, 349–358. [Google Scholar] [CrossRef]
- Clarholm, M.; Skyllberg, U. Translocation of metals by trees and fungi regulates pH, soil organic matter turnover and nitrogen availability in acidic forest soils. Soil Biol. Biochem. 2013, 63, 142–153. [Google Scholar] [CrossRef]
- Meharg, A.A.; Cairney, J.W. Ectomycorrhizas—extending the capabilities of rhizosphere remediation? Soil Biol. Biochem. 2000, 32, 1475–1484. [Google Scholar] [CrossRef]
- Rabinovich, M.L.; Bolobova, A.V.; Vasilchenko, L.G. Fungal Decomposition of Natural Aromatic Structures and Xenobiotics: A Review. Appl. Biochem. Microbiol. 2004, 40, 1–17. [Google Scholar] [CrossRef]
- Bödeker, I.T.; Nygren, C.M.; Taylor, A.F.; Olson, Å.; Lindahl, B.D. ClassII peroxidase-encoding genes are present in a phylogenetically wide range of ectomycorrhizal fungi. ISME J. 2009, 3, 1387–1395. [Google Scholar] [CrossRef] [PubMed]
- Hobbie, S.E.; Ogdahl, M.; Chorover, J.; Chadwick, O.A.; Oleksyn, J.; Zytkowiak, R.; Reich, P.B. Tree Species Effects on Soil Organic Matter Dynamics: The Role of Soil Cation Composition. Ecosystems 2007, 10, 999–1018. [Google Scholar] [CrossRef]


| Site | Dependent Variable | Explanatory Variables | Coefficient | t-Value | p-Value | Variance Explained | F-Statistics * | p-Value * | R2 * | R2 Adj. * | Residual SE * |
|---|---|---|---|---|---|---|---|---|---|---|---|
| Bedrich (n = 50) | Cmic | EC | 0.381 | 2.99 | 0.0045 | 0.15 | 6.775 | 0.0026 | 0.22 | 0.19 | 0.892 |
| Mn | 0.257 | 2.01 | 0.0498 | 0.07 | |||||||
| SIR | SO42− | 0.300 | 2.20 | 0.0326 | 0.09 | 4.834 | 0.0327 | 0.09 | 0.07 | 0.954 | |
| BR | EC | 0.605 | 5.72 | <0.0001 | 0.38 | 20.68 | <0.0001 | 0.46 | 0.44 | 0.741 | |
| Mn | 0.285 | 2.69 | 0.0098 | 0.08 | |||||||
| CA | - | - | - | - | - | - | - | - | - | - | |
| Placek A (n = 50) | Cmic | EC | 0.404 | 3.01 | 0.0042 | 0.10 | 5.91 | 0.0051 | 0.20 | 0.16 | 0.905 |
| Fe | −0.324 | −2.41 | 0.0197 | 0.10 | |||||||
| SIR | EC | 0.439 | 3.84 | 0.0004 | 0.39 | 18.75 | <0.0001 | 0.44 | 0.42 | 0.757 | |
| C:N | 0.285 | 2.09 | 0.0421 | 0.05 | |||||||
| BR | EC | 0.628 | 6.83 | <0.0001 | 0.48 | 26.52 | <0.0001 | 0.61 | 0.59 | 0.633 | |
| Mn | 0.361 | 3.92 | 0.0003 | 0.13 | |||||||
| CA | Mn | 0.747 | 9.13 | <0.0001 | 0.63 | 53.59 | <0.0001 | 0.69 | 0.68 | 0.562 | |
| EC | 0.247 | 3.02 | 0.0041 | 0.06 |
| Site | Dependent Variable | Explanatory Variables | Coefficient | t-Value | p-Value | Variance Explained | F-Statistics * | p-Value * | R2 * | R2 Adj. * | Residual SE * |
|---|---|---|---|---|---|---|---|---|---|---|---|
| Bedrich (n = 10) | Cmic | - | - | - | - | - | - | - | - | - | - |
| SIR | Mn | 0.654 | 3.02 | 0.0166 | 0.32 | 6.898 | 0.018 | 0.63 | 0.54 | 0.643 | |
| SO42− | −0.563 | −2.60 | 0.0317 | 0.31 | |||||||
| BR | EC | 0.760 | 3.51 | 0.0067 | 0.58 | 12.3 | 0.007 | 0.58 | 0.53 | 0.650 | |
| CA | - | - | - | - | - | - | - | - | - | - | |
| Placek A (n = 10) | Cmic | EC | 0.722 | 4.60 | 0.0018 | 0.70 | 18.61 | <0.0001 | 0.82 | 0.78 | 0.446 |
| C:N | 0.366 | 2.33 | 0.0481 | 0.12 | |||||||
| BR | SO42− | 1.305 | 7.21 | <0.0001 | 0.75 | 32.10 | 0.0002 | 0.89 | 0.86 | 0.353 | |
| Fe | −0.580 | −3.21 | 0.0125 | 0.14 | |||||||
| SIR | EC | 0.874 | 5.41 | <0.0001 | - | 29.24 | <0.0001 | 0.76 | 0.74 | 0.485 | |
| CA | Mn | 0.919 | 6.21 | <0.0001 | 0.57 | 21.09 | <0.0001 | 0.84 | 0.80 | 0.424 | |
| SO42− | 0.544 | 3.68 | 0.0062 | 0.27 | |||||||
| Placek B (n = 31) | Cmic | EC | 4.814 | 5.22 | <0.0001 | 0.07 | 14.35 | <0.0001 | 0.50 | 0.46 | 0.721 |
| EC^2 | −4.604 | −4.99 | <0.0001 | 0.43 | |||||||
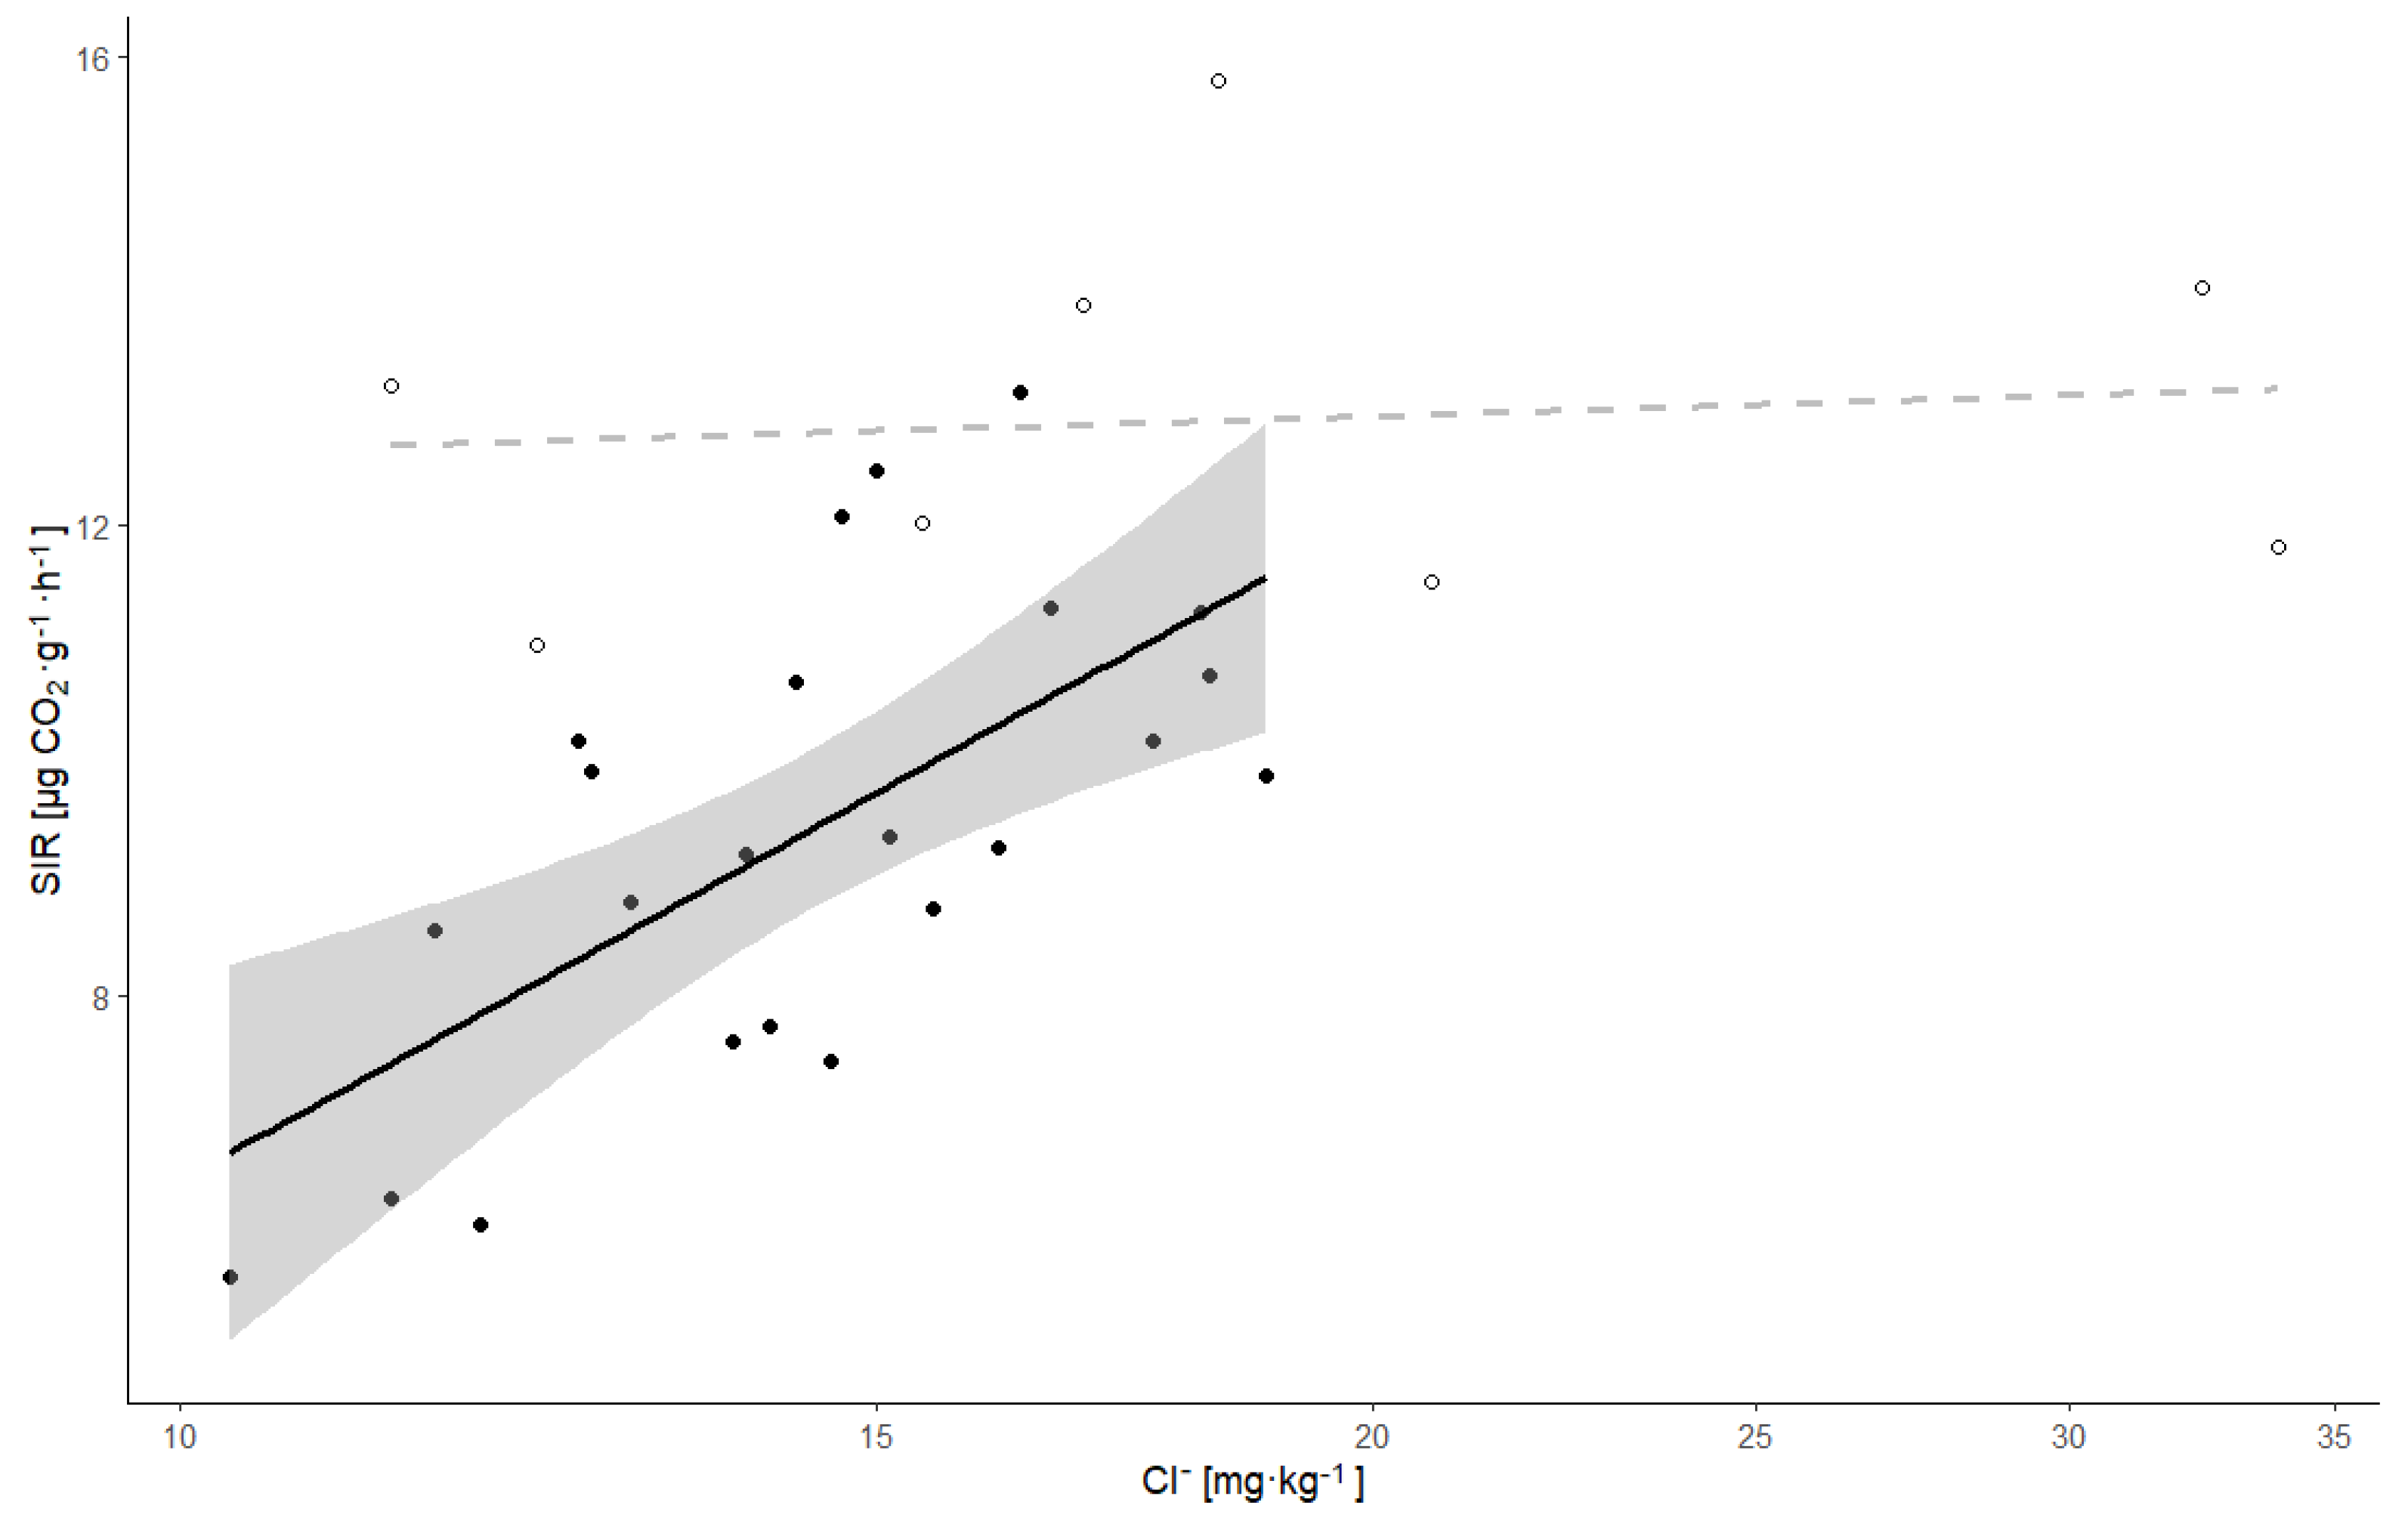
| SIR | Cl− | 0.551 | 3.88 | 0.0006 | 0.33 | 10.50 | 0.00037 | 0.42 | 0.38 | 0.775 | |
| Fe | −0.300 | −2.12 | 0.0430 | 0.09 | |||||||
| BR | EC | 4.410 | 5.73 | <0.0001 | 0.35 | 27.01 | <0.0001 | 0.65 | 0.63 | 0.601 | |
| EC^2 | −3.860 | −5.02 | <0.0001 | 0.30 | |||||||
| CA | Mn | 0.726 | 4.81 | <0.0001 | 0.36 | 11.59 | 0.00020 | 0.44 | 0.41 | 0.758 | |
| C:N | 0.325 | 2.15 | 0.0399 | 0.09 |
Publisher’s Note: MDPI stays neutral with regard to jurisdictional claims in published maps and institutional affiliations. |
© 2021 by the authors. Licensee MDPI, Basel, Switzerland. This article is an open access article distributed under the terms and conditions of the Creative Commons Attribution (CC BY) license (http://creativecommons.org/licenses/by/4.0/).
Share and Cite
Valtera, M.; Volánek, J.; Holík, L.; Pecina, V.; Novotná, J.; Slezák, V.; Juřička, D. The Influence of Forest Management and Changed Hydrology on Soil Biochemical Properties in a Central-European Floodplain Forest. Forests 2021, 12, 270. https://doi.org/10.3390/f12030270
Valtera M, Volánek J, Holík L, Pecina V, Novotná J, Slezák V, Juřička D. The Influence of Forest Management and Changed Hydrology on Soil Biochemical Properties in a Central-European Floodplain Forest. Forests. 2021; 12(3):270. https://doi.org/10.3390/f12030270
Chicago/Turabian StyleValtera, Martin, Jiří Volánek, Ladislav Holík, Václav Pecina, Jitka Novotná, Vojtěch Slezák, and David Juřička. 2021. "The Influence of Forest Management and Changed Hydrology on Soil Biochemical Properties in a Central-European Floodplain Forest" Forests 12, no. 3: 270. https://doi.org/10.3390/f12030270
APA StyleValtera, M., Volánek, J., Holík, L., Pecina, V., Novotná, J., Slezák, V., & Juřička, D. (2021). The Influence of Forest Management and Changed Hydrology on Soil Biochemical Properties in a Central-European Floodplain Forest. Forests, 12(3), 270. https://doi.org/10.3390/f12030270