Abstract
Site productivity provides critical information for forest management practices and is a fundamental measure in forestry. It is determined using site index (SI) models, which are developed using two primary groups of methods, namely, phytocentric (plant-based) or geocentric (earth-based). Geocentric methods allow for direct site growth modelling, in which the SI is predicted using multiple environmental indicators. However, changes in non-static site factors—particularly nitrogen deposition and rising CO2 concentration—lead to an increase in site productivity, which may be visible as an age trend in the SI. In this study, we developed a geocentric SI model for oak. For the development of the SI model, we used data from 150 sample plots, representing a wide range of local topographic and site conditions. A generalized additive model was used to model site productivity. We found that the oak SI depended predominantly on physicochemical soil properties—mainly nitrogen, carbon, sand, and clay content. Additionally, the oak SI value was found to be slightly shaped by the topography, especially by altitude above sea level, and topographic position. We also detected a significant relationship between the SI and the age of oak stands, indicating the long-term increasing site productivity for oak, most likely caused by nitrogen deposition and changes in climatic conditions. The developed geocentric site productivity model for oak explained 77.2% of the SI variation.
1. Introduction
Site productivity arises from the complex interactions between biotic and abiotic drivers in a particular location [1]. It provides key information for forest management and is the primary determinant of decisions concerning species composition selection, the rotation period and allowable cut estimation, the planning of silvicultural prescriptions, and forecasting the timber yield [2,3,4,5]. Under various management alternatives, site productivity provides a decision support tool and knowledge about species variability resulting from sensitivity to environmental factors. Thus, research on the site productivity is crucial for operational purposes and contributes to our understanding of site factors affecting the site productivity for given species.
The most commonly used indirect proxy for forest site productivity is the site index (SI) [1,6,7,8], which can be estimated using two methods, namely, phytocentric (plant-based) or geocentric (earth-based) [1]. In the case of even-aged stands, the SI is most commonly estimated using phytocentric methods based on stand age and height [6]. However, for non-forest areas or stands of young age or uneven-aged with complex species composition, phytocentric methods are subject to significant uncertainty or even become impossible. In the case of such limitations, geocentric methods can provide a much better alternative. Geocentric methods allow for direct site-growth modelling, in which the SI is predicted from multiple environmental indicators [9]. These complex interactions, especially considering environmental drivers related to climate, topography, geology, and soil properties included in site productivity models, are crucial for interpreting the ecological processes in forest ecosystems [10].
Site productivity depends mostly on the soil physical and chemical properties, temperature, and precipitation [11,12,13]. Plant growth is also limited by nitrogen availability [14,15,16,17] and soil water capacity [18]. Both phytocentric and geocentric methods assume that the SI is independent of stand age. However, a significant part of the variables used in geocentric SI estimation is directly or indirectly affected by non-static factors, such as nitrogen deposition, increases in CO2 concentration, and climate change. In recent decades, nitrogen deposition in terrestrial ecosystems has significantly increased due to anthropogenic activities; it has been forecasted that this trend becomes even stronger [19,20]. Recent research results have indicated that nitrogen deposition is one of the most important environmental drivers of the growth of pure, even-aged European forests [21]. Therefore, increasing nitrogen deposition may increase site productivity. Moreover, increasing temperature, which results in elongation of the vegetation period and rising CO2 concentration, may increase SI [22]. Changes in non-static site factors, which increase the site productivity manifest through a negative correlation between SI and stand age, are called age trends [23,24,25,26]. As a result of age trends in the SI, younger stands growing in given site conditions indicate higher SI than older stands [23,25,26]. Age trends in the SI have been reported for different species throughout Europe [5,23,26,27,28,29,30,31]. Correlation of the SI with age hinders the appropriate estimation of site productivity; however, this phenomenon could be used to measure long-term changes in site productivity for given species [32].
The impact of climate change has been linked with shifts in species occurrence ranges [33] and has a significant impact on the dynamics of forest ecosystems [34]. It has been predicted that the observed changes in site conditions in Central Europe increase the importance of oak, due to its increased competitiveness with coniferous species [35,36]. Therefore, it is expected that the ecological and economic importance of oak in Central Europe will increase. At the same time, research on the productivity of this species has, to date, received little attention [37]. Hence, knowledge about the factors determining the site productivity of oak remains incomplete. Therefore, identifying the factors determining the site productivity of oak by developing geocentric site productivity model will partially fill this gap.
This study aimed to (i) determine site factors affecting the site productivity and growth potential for oak. Selected site factors were used for (ii) the development of a geocentric site productivity model for oak. In our research, we assumed that observed changes in site conditions increased the site productivity for oak. Therefore, the next (iii) purpose of this study was to analyze the change in site productivity by estimation of the age trend in the SI. The conducted research contributes to understanding the autecology of oak by determining the factors influencing its growth and productivity. However, knowledge concerning the changes in site productivity for oak is crucial from the point of view of developing management scenarios and adaptation strategies for this species. Assessment of the direction and dynamics of changes in site productivity is essential for determining the future role of oak in forest ecosystems under the influence of changing climatic conditions.
2. Methods
2.1. Study Area
The study area was located in Staszów and Łagów Forest Districts, in the sixth natural forest region of Poland, covering an area of 34,299.80 ha (Figure 1). The climate in the research area is temperate, characterized by cold winters, hot summers, and long warm autumns. The mean annual temperature is about 7 °C with an annual rainfall of 570 mm [38]. A great variety of topographic conditions can be observed in the research area. Despite their location in a lowland landscape, the sample plots describe relatively large differences in altitude, varying from 164–352 m above sea level. The study area is characterized by a wide range of forest site types, with the highest proportion being fresh mixed broadleaved forest; thus, the established sample plots represent wide geological, topographic, and site variations.
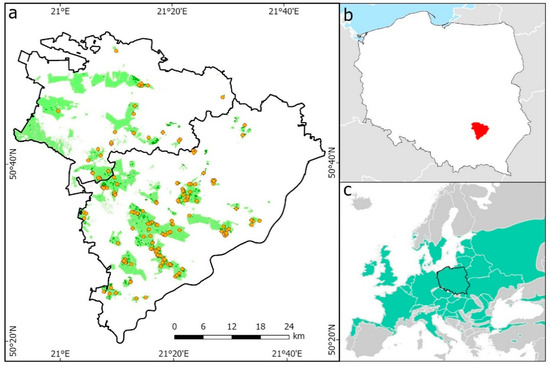
Figure 1.
Location of sample plots (yellow points) in oak stands (dark green) (a); location of research area in Poland (b); the range of oak distribution in Europe (c).
2.2. Data
2.2.1. Sample Plot Data
The research material collected in the years 2013–2014 consisted of data from 150 circular sample plots established in oak-dominated (Quercus sessilis and Quercus robur) stands. Plot size varied between 0.02 and 0.12 ha, depending on the age of the stand, and was adjusted so that the number of trees on the plot was at least 20 (Table 1). The number of trees per hectare ranged from 75 to 2350 (Table 1).

Table 1.
Summary statistics of sample plot characteristics.
Diameter at breast height (>7 cm) and height of all trees were measured in each sample plot. The stand age was estimated on the basis of increment core samples collected in each sample plot from the 5 trees with the largest diameter.
The top height (TH) was defined as the mean height of 100 thickest trees per hectare. In order to eliminate the dependence of TH on the plot size, we used the adjusted largest trees (ALT) method, developed by García and Batho [39], in the calculations. According to the ALT method, TH for a sample plot of size A (ha) is calculated on the basis of 160 × A − 0.6 of the thickest trees. The SI was determined for the sample plots using the SI model developed for oak in Poland [40], on the basis of the dynamic formulation of the Korf equation [41], which describes changes in the top height with age Equation (1):
where b0 and b1 are parameters of the model; H0 is the height (in m) at age t0; and t1 is the base age, equal to 100 years.
2.2.2. Soil Data and Physiography
Soil samples were taken as a collective sample mixed of 5 sub-samples sampled within each plot from the mineral layer (0–40 cm). Prior to analysis, samples were sieved through a 2 mm mesh. The 2 mm sieved samples were used to measure the particle size composition (the percentage content of sand, silt, and clay), as determined using laser diffraction (Fritsch Analysette 22), and pH in water (pH H2O) and in 1M KCl solution (pH KCl), as determined potentiometrically. The sub-samples were ground to fine fraction using a ball mill (Fritsch) to improve their homogeneity. We measured the content of soil carbon (C) and nitrogen (N) with a LECO CNS True Mac analyzer in the fine sub-samples. The soil type was determined using a digital soil map for Poland with the scale of 1:500,000 [42].
The topographies of particular sample plots were described on the basis of indices derived from the European Digital Elevation Model (EU-DEM) [43]. On the basis of the EU-DEM, we calculated a set of derived topography variables: the hillshade, determining the degree of shading of the terrain [44]; landform, which provides information about categories of surface features [45]; and terrain convexity metrics, the Topographic Position Index (TPI), specifying the position of any point on the earth surface in relation to the neighboring points located at a given distance, and slope position. Hillshade was calculated according to the methodology proposed by Siwek and Wacławik [44]. The landform index was calculated on the basis of TPI values calculated for the 2 neighbor scales of 900 and 1500 m [45]. TPI was computed on the basis of a digital terrain model using the ArcGIS 10.3 software. The slope position was calculated using the TPI and its standard deviation [45].
The geological substratum type was determined using a geological map of Poland with a scale of 1:500,000 [46]. The basic characteristics of the environmental variables are summarized in Table 2.
Table 2.
Characteristics of the soil and physiographic variables estimated for sample plots.
2.3. Model Development
Site productivity may be modelled through a wide range of modelling approaches; however, we proceed with different types of variables (quantitative and qualitative). Therefore, collinearity of predictor variables may occur and problems with fulfilling criteria for the normal distribution of residual values of analyzed variables. Aertsen et al. [47] showed that generalized additive models (GAM) are one of the best methods for geocentric site productivity modelling, which offers good model performance and the best ecological interpretability.
GAM models [48] enable the estimation of multivariate variables using the additive approximation of the regression function by substituting the explanatory variable linear function with a non-parametric function; this can be estimated using a smoothing spline function (spline). Application of a GAM method allows us to explain the effects of independent variables by analyzing the model graphs’ partial residual spline curves, depending on the independent variable values. This approach allows for establishing a direct relationship of the SI with individual variables while holding all other variables fixed [49]. This property of GAM allows for analyzing the specific patterns of site productivity in response to environmental gradients. The GAM method allows for interpretability, flexibility and automation, and regularization [49]. Mainly, when the model contains nonlinear effects, GAM provides a regularized and interpretable solution, whereas other methods generally lack at least one of these three features. GAM strikes a nice balance between the interpretable, yet biased, linear model and the extremely flexible “black box” learning algorithms [49].
Considering that GAM models are not fully resistant to predictors collinearity, we applied the correlation matrix to assess the presence of collinearity for quantitative variables with a cut-off value of 0.9. The variables for which collinearity was found were eliminated from the set of independent variables. The procedure was performed using the R package caret [50].
An established set of variables was used for the developed final GAM models according to Equation (2) in order to determine the relationship between the SI and the multiple variables characterizing tree growth conditions for oak stands.
where is a function that links the expected value of the variable Y ) with additive functions of the explanatory variables ; Y is a dependent variable of SI; (Xi) are explanatory variables f1, f2, … fn spline functions; and β is free term, assuming that errors ε have constant variance and mean equal 0.
For examination, the model performance, and possible overfitting in calculating adjusted R2, we also used 10-fold cross-validation. The procedure was performed using the R language package gam and package caret [50].
Next, we examined the effect of age on SI in order to detect an age trend. For this purpose, besides soil properties, geology, and topography, the age of oak stands was accounted for in the model. Using the GAM method, we were able to examine the effect of age of stands on the SI whilst holding all site variables fixed. Therefore, this approach provides the ability to remove the effects of other variables that affect site productivity, which may lead to over-representation of the oldest stands on infertile sites and more productive young stands [51,52].
In the last step, we assessed the GAM model performance; for this purpose, the following measures were used:
- mean absolute error: MAE ;
- root mean squared error: ;
- where is the observed value and is the predicted value.
- adjusted coefficient of determination: ;
where are the observed values, is the model value, p denotes the number of parameters used in the model, and R2 is the coefficient of determination. We also assessed the adequacy of the SI model fitted to the whole data set by analyzing the plot of the model residuals and the histogram of the error distribution.
3. Results
For the analyzed sample plots, the SI ranged between 21.09 and 37.77 (Table 2). As a result of modelling, it was found that most of the variables selected for the analysis had a significant impact on the SI. Only TPI900, pH H2O, silt [%], and C/N were the variables that were not significant or showed collinearity; therefore, they were not included in the model. Analyzing individual environmental variables, we found that the SI of oak stands was highly determined by the percentage of nitrogen and carbon content in the soil. Nitrogen content was positively correlated with the site productivity for oak. Increasing the nitrogen content in the range from about 0.01 to 0.08 caused a rapid increase in the SI; however, after reaching 0.10, further increasing the nitrogen content did not increase the SI. A high level of carbon content in soil indicated lower site productivity for oak (Figure 2). The relatively fast decrease in SI was observable, with increasing carbon content up to 1%; however, after reaching this level, the SI decrease slowed down significantly. Analysis of the spline curves of the model partial residuals for nitrogen and carbon content in soil demonstrated that the variation of SI was in the range of 5 m; however, in the case of soils with higher nitrogen and carbon contents, considerable uncertainty was visible (Figure 2).
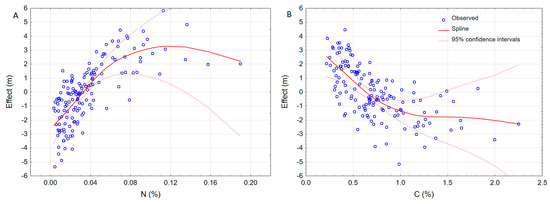
Figure 2.
Partial effects of nitrogen content (A) and carbon content (B) in soil on the site index (SI) for oak. The effect of nitrogen and carbon content change is displayed with all other factors held constant.
Our analysis also indicates the influence of soil physical properties on the SI. We found an alteration in site productivity observable with sand and clay content shifts in the soil (Figure 3). Sand content in soil was negatively correlated with the SI. These results indicate a reduction of site productivity, especially for soils with sand content above 50%. The percentage content of the clay fraction in the soils had an opposite effect on the site productivity for oak. The positive effect of the percentage of clay content in soil was pronounced until the level of 40% was reached; after that, a further increase of the clay fraction in the soil did not significantly improve the site productivity for oak.
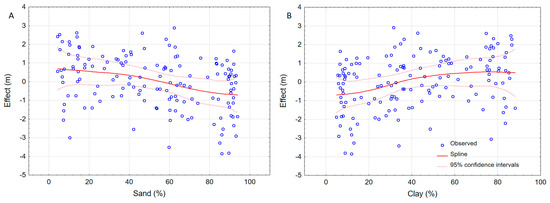
Figure 3.
Partial effects of sand content (A) and clay content (B) in soil on the site index for oak. The effect of sand content and clay content change is displayed with all other factors held constant.
Besides the soil properties, the obtained results showed a significant influence of soil type on the site productivity variability. The highest site indices were found in the stands growing on gley-podzol mucky soils, while the lowest valuations were observed on gley-podzol soils appropriate for coniferous sites (Figure 4). Other soil types showed less variation of SI, with differences not exceeding 1 m, compared with the brown rusty soil benchmark in the GAM model.
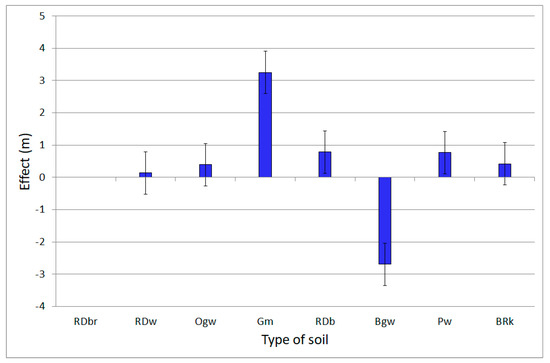
Figure 4.
Partial effects of the soil types on the site index for oak; the effect is displayed with all other factors held constant. Mean differences and error bars represent the parameters of the generalized additive model and its confidence interval. Legend: RDbr, rusty brown soils; RDw, proper rusty soils; Ogw, gleysols; Gm, gley-podzol mucky soils; RDb, podzolised rusty soils; Bgw, gley-podzol soils; Pw, clay-illuvial soils; BRk, acid brown soils.
We found high differentiation in site productivity, depending on the geological substratum type (Figure 5). The highest mean values of site productivity were obtained for Quaternary Holocene fluvial deposits (6), forming fertile soil formations. The lowest potential productivity can be expected in the Quaternary South Poland Pleistocene sands, silt, and gravel (4); Quaternary Pleistocene sand and gravel with boulders (8); as well as Quaternary southern Poland Pleistocene tills and their residues (11) and Quaternary Pleistocene loess (12), which are associated with sandy soil formations. Other types of geology substrata showed a smaller variability of site productivity.
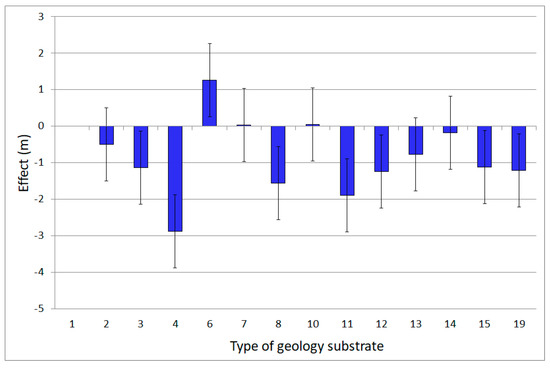
Figure 5.
The geological substrate partial effects on the site index for oak; the effect is displayed with all other factors held constant. Legend: 1—Quaternary aeolian sand; 2—Quaternary sand and residual gravel with boulders; 3—tertiary Neogene Krakowieckie clay; 4—Quaternary South Polish Pleistocene sand, silt, and gravel; 5—Quaternary Pleistocene glacial till; 6—Quaternary Holocene fluvial deposits; 7—Quaternary dune aeolian sand; 8—Quaternary Pleistocene sand and gravel with boulders; 9—Quaternary Holocene preglacial sand and gravel; 10—Quaternary Pleistocene glacial till residuum; 11—Quaternary South Poland Pleistocene glacial till and its residuum; 12—Quaternary Pleistocene loess; 13—Cambrian mudstone, claystone, and sandstone; 14—Devonian limestone; 15—Quaternary Pleistocene sand, glaciofluvial, and fluvial gravel; 16—Quaternary Pleistocene loess with fossil soil, Baltic glaciation; 17—Cambrian claystone, clay slate, mudstone, sandstone, and quartzitic sandstone; 18—Quaternary Pleistocene periglacial deposits; 19—Quaternary Holocene fluvial deposits in general.
The site productivity for oak was also slightly affected by elevation a.s.l. and the TPI1500 index. The optimum range of site productivity was found to be between 225 and 275 m a.s.l., with further elevation increases associated with a gradual decrease in the SI (Figure 6). The relationship between the residuals of the geocentric GAM model and TPI was relatively low. However, some regularity was identified. Higher values of the TPI were related to a slightly higher average SI, as determined on the basis of the spline curve (Figure 6).
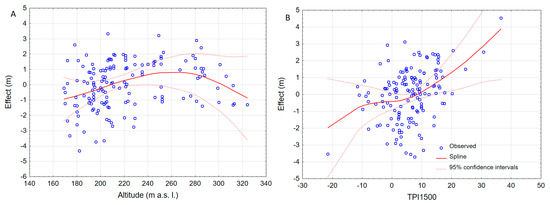
Figure 6.
Partial effects of altitude (A) Topographic Position Index in neighbor scales of 1500 (B) on the site index for oak. The effect altitude and Topographic Position Index change is displayed with all other factors held constant.
The results of GAM modelling showed a strong age trend in the SI for oak (Figure 7). From the age of 60, we found that SI demonstrated a sharp and successive decrease, reaching 2 m in every subsequent age class. Therefore, a 140-year-old stand growing in the same site conditions obtained a SI reduced by 6 m, compared with 60-year-old (youngest age) stands.
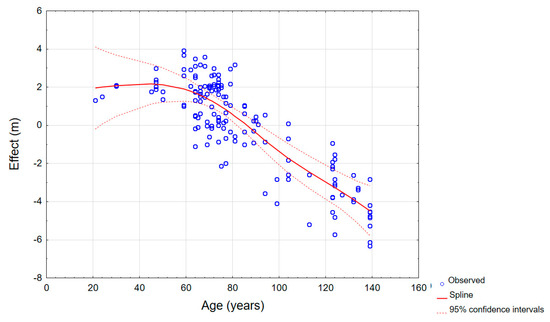
Figure 7.
Partial effects of the age of the stand on the site index for oak; the effect is displayed with all other factors held constant.
The geocentric GAM model developed for the entire dataset obtained the following performance measures: mean absolute error (MAE): 1.725 m, root mean square error (RMSE): 2.114 m, and R2adj: 0.772. R2adj calculated on the basis of 10-fold cross-validation decreased to 0.72, which does not indicate the problem of model overfitting. Thus, the developed model presented goodness-of-fit statistics, which also indicate its good predictive ability.
The plot of residuals against the values predicted by the GAM model indicates the residual values homoscedasticity and shows no correlation with the predicted SI values (Figure 8).
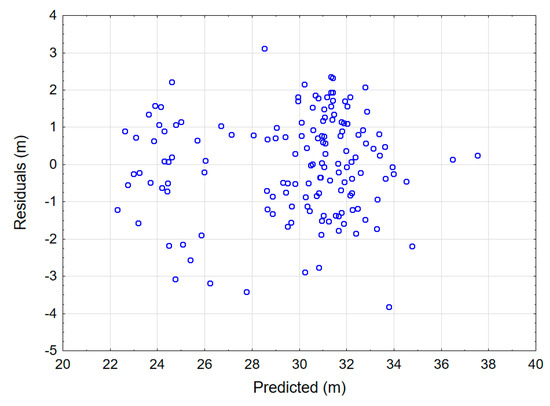
Figure 8.
Residual versus predicted values of the developed GAM site index model for oak.
4. Discussion
Our results demonstrate that the developed geocentric model explained a significant part of the variability of the site productivity for oak. Among all investigated site variables, a significant impact on SI was observed for predictors concerning soil properties. The nitrogen content had the most substantial effect on the site productivity for oak. In investigated stands, an increase in the nitrogen content in soils was associated with a considerable rise in the SI to a certain level. Similar results have been stated in studies involving pine stands, in which it was found that, after reaching a certain threshold, a further increase in nitrogen concentration does not result in a proportional increase of the SI [53]. The effect of nitrogen content in soil on the site productivity is biologically plausible and compliant with oak ecological requirements. Due to the high site requirements, this species prefers soils rich in nutrients and clay; therefore, the highest site productivity was observed with soils that represented such conditions, especially those with the high nitrogen content. The relationship between SI and N content indicates the possibility of improving the site productivity for oak resulting from the increasing nitrogen deposition. The opposite relationship between SI and carbon content in soil (Figure 2) turned out to be a good indicator of the site productivity for oak. A high level of carbon content is characteristic of low fertility soils with low biological activity and a slow rate of soil processes; therefore, a high carbon content indicates that the soil is less suitable for oak growth. Sites with high carbon content were unfavorable for oak, which was reflected in its correlation with SI.
Our results showed shifts in site productivity along with the physical properties of soil and soil type. The types of soils characterized by high clay content, moderate moisture, and pH close to neutral demonstrated the highest site productivity (Figure 5). The lowest productivity of oak sites was observed with gley-podzol soils—typical of coniferous forest sites—with high sand content. The optimal substrate for oak is fertile, rich, and moderately moist with a neutral or close to alkaline pH soil. Therefore, sites with such properties showed the highest SI values. Besides soil properties, we found that oak stand productivity was strongly affected by the type of geological substrate. In comparison with Quaternary aeolian sands—used as a reference level for modelling—the highest SI was obtained for the stands growing on Quaternary Holocene fluvial deposits, which are the most fertile. Fine-grained and loamy material contains a large amount of the smallest soil fractions rich in macro- and micronutrients [54] and, therefore, is associated with higher productivity. Additionally, research involving indigenous oak stands [55] indicated that the penetration of roots of both oak species through gravelly and loamy soils was hampered while riverside meadows were hampered where clay soils prevail—oak roots could easily reach the groundwater table. The type of geological substrate accounts for a large proportion of the SI variation and, along with soil sub-type, it should be taken into account when evaluating the potential productivity of oak stands.
Our results also suggest that the topography affects the site productivity of oak. Topography, expressed as altitude and TPI, can be used as an indirect measure of climatic condition variability [56]. The gradual decrease of SI from 260 m a.s.l. is likely caused by interactions between factors affecting moisture and temperature that can be observed at different elevations above the sea level. The research conducted by Lyr [57] indicated that the optimal temperature for the growth of aerial parts of common oak is 25 °C, while, in the period from April to September, this tree species requires average temperatures reaching at least 12 °C. The increase of altitude up to 250 m is connected with the limited occurrence of frost hollows and positively correlates with the total annual precipitation, which is the most likely reason for exerting a positive effect on the oak growth [52]. Additionally, higher SI values were obtained for higher TPI values, corresponding to the location above the surrounding area. It can be assumed that this resulted from the effect of topography on moisture and thermal conditions. Higher locations, however, are associated with worse thermal conditions, which is the likely cause of the decline in site productivity for stands located above 250 m above sea level.
Interestingly, the oak SI displayed a strong negative correlation with stand age. The results presented in our studies are almost tantamount to observations from central Europe. Changes in the SI reported for oak stands in southwestern Germany [52] indicated the average increase in the SI amounted to 2.1 m per each 20-year period. Similar age trends have also been previously detected and usually interpreted as an effect of the changes in site conditions [24,27,28,30,52] associated with the effects of non-static factors such as nitrogen deposition and rising CO2 concentration. However, highly productive forests are usually managed under short rotation. Therefore, old stands are often found on poor sites [30,51,52], which may also result in the negative correlation of SI with stand age. In the present research, this problem was solved by the use of GAM models. The advantage of GAM is that the influence of each explanatory variable can be examined individually, while all other variables are constant [49]. Using this approach, we examined the effect of germination age on SI, keeping all site variables fixed. This allowed us to remove the effect of site variables and individually assess age influence on the SI.
The occurrence of an age trend means that the stand density increases in a shorter time and trees more quickly reaching specific dimensions [58]. Therefore, its detection can be a powerful tool to develop forest management guidelines concerned with planning the rotation age and silvicultural treatments. Furthermore, understanding this phenomenon effect may be crucial in predicting climate and environmental changes and the impact of non-static factors on forest productivity. We found the age trend in SI, indicating an increase of site productivity for oak. SI is strongly affected by nitrogen content in the soil. However, after reaching a specific level, a further increase in nitrogen content did not increase SI (Figure 3). Therefore, it is probable that the observed increase in the productivity of oak stands will stabilize at a certain level. This phenomenon may be of great importance for future carbon sequestration in oak stands, and thus it is a call for further research.
The results of the geocentric modelling of site productivity demonstrated in this article are crucial to precisely define the conditions under which oak stands will achieve the highest productivity in Central Europe. Information concerning trends in site productivity may provide essential information for management, as well as adaptation and mitigation strategies against changing climatic conditions [23]. There have been many site productivity simulations under the changing climate conditions of European forests [5,59,60]. The observed trends of increasing the average temperature and reducing rainfall during the growing season adversely affect North American species (e.g., lodgepole and white spruce) [61]. The range of distribution of other species, such as oak (Quercus L.)—which are more thermophilic and relatively resistant to drought or strong winds—may increase their economic importance [36,52]. Our study points out the drivers of site productivity for oak, as related to terrain and soil properties. The relationships between site productivity and features demonstrated in this study confirm this possibility of directly applying selected environmental characteristics for assessing the potential productivity of oak at the local scale. The limitation of this study is related to the relatively small scale of the research area. Data of this type do not allow for extrapolation of the results to large areas. However, research limited to a smaller area also has some advantages, as it allows for the exclusion of the influence of many factors that differ at a large scale, such as, for example, climatic conditions [37]. Because we excluded the influence of variation of climate conditions, it was possible to describe the influence of local drivers of site productivity, mainly nitrogen content, and microclimate represented by the topography. The results enrich the knowledge about the autecology of oak; however, they cannot be uncritically related to the entire area of its occurrence. Our results also highlight the role of non-static environmental factors in affecting forest site productivity, as expressed by an age trend. The strong age trend in SI confirms increasing site productivity for oak for several decades in the research area. This calls for further research in order to assess the relationships between SI and environmental factors and age on a larger spatial scale and for other tree species.
5. Conclusions
We developed a geocentric model of site productivity, providing an appropriate explanation of site variable impact on the site productivity for oak. The oak SI value depends predominantly on the physicochemical soil properties—mainly nitrogen, carbon, sand, and clay content. The oak SI is also slightly shaped by the topography, especially altitude (a.s.l.). We also detected a significant relationship between SI and age, indicating the long-term increasing site productivity for oak, which is most likely caused by nitrogen deposition and climate conditions changes.
Author Contributions
Conceptualization, J.S.; methodology, J.S., L.T.-C. and D.C.; validation., L.T.-C.; formal analysis L.T.-C.; investigation, J.S., L.T.-C. and D.C.; resources, J.S.; data curation, J.S., M.M.; writing—original draft preparation, L.T.-C., J.S., D.C. and X.V.H.D.; writing—review and editing, L.T.-C. and J.S.; visualization, L.T.-C.; funding acquisition, J.S. All authors have read and agreed to the published version of the manuscript.
Funding
This work was supported by the project I-MAESTRO. Project I-MAESTRO (Innovative forest MAnagEment STrategies for a Resilient biOeconomy under climate change and disturbances) is supported under the umbrella of ForestValue ERA-NET Cofund by the National Science Center, Poland; the French Ministry of Agriculture, Agrifood, and Forestry; the French Ministry of Higher Education, Research and Innovation; the German Federal Ministry of Food and Agriculture (BMEL) via Agency for Renewable Resources (FNR); and the Slovenian Ministry of Education, Science and Sport (MIZS). ForestValue has received funding from the European Union’s Horizon 2020 research and innovation program under grant agreement No. 773324.
Data Availability Statement
Data sharing is not applicable to this article.
Conflicts of Interest
The authors declare no conflict of interest.
References
- Skovsgaard, J.P.; Vanclay, J.K. Forest site productivity: A review of the evolution of dendrometric concepts for even-aged stands. Forestry 2008, 81, 13–31. [Google Scholar] [CrossRef]
- Pretzsch, H.; Grote, R.; Reineking, B.; Rötzer, T.; Seifert, S. Models for forest ecosystem management: A European perspective. Ann. Bot. 2008, 101, 1065–1087. [Google Scholar] [CrossRef]
- Splechtna, B.E. Height growth and site index models for Pacific silver fir in southwestern British Columbia. J. Ecosyst. Manag. 2001, 1, 1–14. [Google Scholar]
- Brandl, S.; Falk, W.; Klemmt, H.-J.; Stricker, G.; Bender, A.; Rötzer, T.; Pretzsch, H. Possibilities and Limitations of Spatially Explicit Site Index Modelling for Spruce Based on National Forest Inventory Data and Digital Maps of Soil and Climate in Bavaria (SE Germany). Forests 2014, 5, 2626–2646. [Google Scholar] [CrossRef]
- Bontemps, J.-D.; Bouriaud, O. Predictive approaches to forest site productivity: Recent trends, challenges and future perspectives. Forestry 2013, 87, 109–128. [Google Scholar] [CrossRef]
- Hägglund, B.; Lundmark, J.E. Site index estimation by means of site properties of Scots pine and Norway spruce in Sweden. Stud. Suec. 1977, 138, 5–38. [Google Scholar]
- Raulier, F.; Lambert, M.-C.; Pothier, D.; Ung, C.-H. Impact of dominant tree dynamics on site index curves. Ecol. Manag. 2003, 184, 65–78. [Google Scholar] [CrossRef]
- Tewari, V.P.; Rivas, J.J.C.; VilČko, F.; Gadow, K. Von Height-Growth and site index equations for social forestry plantations of acacia nilotica and eucalyptus hybrid in gujarat state of India. Trees Livelihoods 2007, 17, 125–140. [Google Scholar] [CrossRef]
- Weiskittel, A.R.; Hann, D.W.; Kershaw, J.A., Jr.; Vanclay, J.K. Forest Growth and Yield Modeling; John Wiley & Sons: Hoboken, NJ, USA, 2011. [Google Scholar]
- Dănescu, A.; Albrecht, A.T.; Bauhus, J.; Kohnle, U. Geocentric alternatives to site index for modeling tree increment in uneven-aged mixed stands. Ecol. Manag. 2017, 392, 1–12. [Google Scholar] [CrossRef]
- Chen, H.Y.H.; Krestov, P.V.; Klinka, K. Trembling aspen site index in relation to environmental measures of site quality at two spatial scales. Can. J. Res. 2002, 32, 112–119. [Google Scholar] [CrossRef]
- Wang, G.G.; Klinka, K. Use of synoptic variables in predicting white spruce site index. Ecol. Manag. 1996, 80, 95–105. [Google Scholar] [CrossRef]
- Socha, J. Effect of topography and geology on the site index of Picea abies in the West Carpathian, Poland. Scand. J. Res. 2008, 23, 203–213. [Google Scholar] [CrossRef]
- Gholz, H.L.; Ewel, K.C.; Teskey, R.O. Water and forest productivity. Ecol. Manag. 1990, 30, 1–18. [Google Scholar] [CrossRef]
- Raison, R.J.; Khanna, P.K.; Connell, M.J.; Falkiner, R.A. Effects of water availability and fertilization on nitrogen cycling in a stand of Pinus radiata. Ecol. Manag. 1990, 30, 31–43. [Google Scholar] [CrossRef]
- Vacchiano, G.; Magnani, F.; Collalti, A. Modeling Italian forests: State of the art and future challenges. Iforest Biogeosci. 2012, 5, 113–120. [Google Scholar] [CrossRef]
- Kahle, H.P.; Karjalainen, T.; Schuck, A.; Ågren, G.I.; Kellomäki, S.; Mellert, K.H.; Prietzel, J.; Rehfuess, K.E.; Spiecker, H. Causes and Consequences of Forest Growth Trends in Europe-Results of the RECOGNITION Project; EFI Research Report 21; Brill Leiden: Boston, MA, USA, 2008; pp. 68–85. [Google Scholar]
- Claessens, H.P.D.T.A.; Rondeu. J. Site index curves and autecology of ash, sycamore and cherry in Wallonia (Southern Belgium). Forestry 1999, 72, 171–182. [Google Scholar] [CrossRef]
- Galloway, J.N.; Townsend, A.R.; Erisman, J.W.; Bekunda, M.; Cai, Z.; Freney, J.R.; Martinelli, L.A.; Seitzinger, S.P.; Sutton, M.A. Transformation of the Nitrogen Cycle: Recent Trends, Questions, and Potential Solutions. Science 2008, 320, 889–892. [Google Scholar] [CrossRef]
- Reay, D.S.; Dentener, F.; Smith, P.; Grace, J.; Feely, R.A. Global nitrogen deposition and carbon sinks. Nat. Geosci. 2008, 1, 430–437. [Google Scholar] [CrossRef]
- Etzold, S.; Ferretti, M.; Reinds, G.J.; Solberg, S.; Gessler, A.; Waldner, P.; Schaub, M.; Simpson, D.; Benham, S.; Hansen, K.; et al. Nitrogen deposition is the most important environmental driver of growth of pure, even-aged and managed European forests. Ecol. Manag. 2020, 458, 117762. [Google Scholar] [CrossRef]
- Pretzsch, H.; Biber, P.; Schütze, G.; Uhl, E.; Rötzer, T. Forest stand growth dynamics in Central Europe have accelerated since 1870. Nat. Commun. 2014, 5, 4967. [Google Scholar] [CrossRef]
- Albert, M.; Schmidt, M. Climate-sensitive modelling of site-productivity relationships for Norway spruce (Picea abies (L.) Karst.) and common beech (Fagus sylvatica L.). Ecol. Manag. 2010, 259, 739–749. [Google Scholar] [CrossRef]
- Bravo-Oviedo, A.; Gallardo-Andrés, C.; del Río, M.; Montero, G. Regional changes of Pinus pinaster site index in Spain using a climate-based dominant height model. Can. J. Res. 2010, 40, 2036–2048. [Google Scholar] [CrossRef]
- Socha, J.; Coops, N.C.; Ochal, W. Assessment of age bias in site index equations. IForest 2016, 9, 402–408. [Google Scholar] [CrossRef]
- Sharma, R.P.; Brunner, A.; Eid, T. Site index prediction from site and climate variables for Norway spruce and Scots pine in Norway. Scand. J. Res. 2012, 27, 619–636. [Google Scholar] [CrossRef]
- Elfving, B.; Tegnhammar, L. Trends of tree growth in Swedish forests 1953−1992: An analysis based on sample trees from the national forest inventory. Scand. J. Res. 1996, 11, 26–37. [Google Scholar] [CrossRef]
- Kiviste, A. Site Index Change in the 1950s-1990s according to Estonian Forest Inventory Data. In Proceedings of the International Seminar Held, Nancy, France, 14–16 May 1998; pp. 87–100. [Google Scholar]
- Solberg, S.; Dobbertin, M.; Reinds, G.J.; Lange, H.; Andreassen, K.; Fernandez, P.G.; Hildingsson, A.; de Vries, W. Analyses of the impact of changes in atmospheric deposition and climate on forest growth in European monitoring plots: A stand growth approach. Ecol. Manag. 2009, 258, 1735–1750. [Google Scholar] [CrossRef]
- Yue, C.; Mäkinen, H.; Klädtke, J.; Kohnle, U. An approach to assessing site index changes of Norway spruce based on spatially and temporally disjunct measurement series. Ecol. Manag. 2014, 323, 10–19. [Google Scholar] [CrossRef]
- Metslaid, S.; Sims, A.; Kangur, A.; Hordo, M.; Jõgiste, K.; Kiviste, A.; Hari, P. Growth patterns from different forest generations of Scots pine in Estonia. J. Res. 2011, 16, 237–243. [Google Scholar] [CrossRef]
- Bontemps, J.-D.; Hervé, J.-C.; Dhôte, J.-F. Long-Term Changes in Forest Productivity: A Consistent Assessment in Even-Aged Stands. For. Sci. 2009, 55, 549–564. [Google Scholar]
- del Barrio, G.; Harrison, P.A.; Berry, P.M.; Butt, N.; Sanjuan, M.E.; Pearson, R.G.; Dawson, T. Integrating multiple modelling approaches to predict the potential impacts of climate change on species’ distributions in contrasting regions: Comparison and implications for policy. Environ. Sci. Policy 2006, 9, 129–147. [Google Scholar] [CrossRef]
- Nabuurs, G.J.; Pussinen, A.; Karjalainen, T.; Erhard, M.; Kramer, K. Stemwood volume increment changes in European forests due to climate change-A simulation study with the EFISCEN model. Glob. Chang. Biol. 2002, 8, 304–316. [Google Scholar] [CrossRef]
- Dyderski, M.K.; Paź, S.; Frelich, L.E.; Jagodziński, A.M. How much does climate change threaten European forest tree species distributions? Glob. Chang. Biol. 2018, 24, 1150–1163. [Google Scholar] [CrossRef]
- Hanewinkel, M.; Cullmann, D.A.; Schelhaas, M.-J.; Nabuurs, G.-J.; Zimmermann, N.E. Climate change may cause severe loss in the economic value of European forest land. Nat. Clim. Chang. 2012, 3, 203–207. [Google Scholar] [CrossRef]
- Aertsen, W.; Kint, V.; de Vos, B.; Deckers, J.; van Orshoven, J.; Muys, B. Predicting forest site productivity in temperate lowland from forest floor, soil and litterfall characteristics using boosted regression trees. Plant. Soil 2012, 354, 157–172. [Google Scholar] [CrossRef]
- Starkel, L.; Baugart- Kotarba, M.; Michna, E.; Gil, E.; Pohl, J.; Słupik, J.; Zawora, T. Studia Nad Typologią I Oceną Środowiska Geograficznego Karpat I Kotliny Sandomierskiej. Pract. Geogr. 1978, 125. [Google Scholar]
- Garcia, O.; Batho, A. Top Height Estimation in Lodgepole Pine. West. J. Appl. 2005, 20, 64–68. [Google Scholar]
- Socha, J.; Tymińska-Czabańska, L.; Grabska, E.; Orzeł, S. Site Index Models for Main Forest-Forming Tree Species in Poland. Forests 2020, 11, 301. [Google Scholar] [CrossRef]
- Anta, M.B.; Dorado, F.C.; Diéguez-Aranda, U.; Álvarez González, J.G.; Parresol, B.R.; Soalleiro, R.R. Development of a basal area growth system for maritime pine in northwestern Spain using the generalized algebraic difference approach. Can. J. Res. 2006, 36, 1461–1474. [Google Scholar] [CrossRef]
- Mapa Gleb Polski 1:500 000 [Detailed Soil Map of Poland 1:500 000]; Instytut Uprawy Nawożenia i Gleboznawstwa Państwowy Instytut Badawczy: Warszawa, Poland, 2014. (In Polish)
- EU-DEM v1.1. Available online: https://land.copernicus.eu/imagery-in-situ/eu-dem/eu-dem-v1.1?tab=metadata (accessed on 30 November 2019).
- Siwek, J.; Wacławik, W. Can analytical shading be art? Pol. Cart. Rev. 2016, 47, 121–135. [Google Scholar] [CrossRef]
- Weiss, A. Topographic Position and Landforms Analysis. In Proceedings of the ESRI User Conference, San Diego, CA, USA, 8–12 July 2001. [Google Scholar]
- Szczegółowa Mapa Geologiczna Polski 1:500 000 [Detailed Geological Map of Poland 1:500 000]; Państwowy Instytut Geologiczny: Warszawa, Poland, 2006. (In Polish)
- Aertsen, W.; Kint, V.; van Orshoven, J.; Özkan, K.; Muys, B. Comparison and ranking of different modelling techniques for prediction of site index in Mediterranean mountain forests. Ecol. Model. 2010, 221, 1119–1130. [Google Scholar] [CrossRef]
- Hastie, T.J.; Tibshirani, R.J. Generalized Additive Models; CRC Press: Boca Raton, FL, USA, 1990. [Google Scholar]
- Larsen, K. GAM: The Predictive Modeling Silver Bullet. Stitch Fix 2015, 30, 196–223. [Google Scholar]
- R Core Team. R: A Language and Environment for Statistical Computing; R Foundation for Statistical Computing: Vienna, Austria, 2020; Available online: http://www.R-project.org/ (accessed on 21 December 2020).
- Tegnhammar, L. On the Estimation of Site Index for Norway Spruce; Department of Forest Survey Report 53; Swedish University of Agricultural Sciences: Uppsala, Sweden, 1992; p. 259. ISSN 0348-0496. (In Swedish with English Summary). [Google Scholar]
- Nothdurft, A.; Wolf, T.; Ringeler, A.; Böhner, J.; Saborowski, J. Spatio-temporal prediction of site index based on forest inventories and climate change scenarios. Ecol. Manag. 2012, 279, 97–111. [Google Scholar] [CrossRef]
- Pietrzykowski, M.; Socha, J.; van Doorn, N.S. Scots pine (Pinus sylvestris L.) site index in relation to physico-chemical and biological properties in reclaimed mine soils. New For. 2015, 46, 247–266. [Google Scholar] [CrossRef]
- Gradziński, R.; Kostecka, A.; Radomski, A.; Unrug, R. Sedymentologia. Wydaw. Geol. 1976, 628. [Google Scholar]
- Köstler, J.N.; Brückner, E.; Bibelriether, H. Die Wurzeln der Waldbäume: Untersuchungen zur Morphologie der Waldbäume in Mitteleuropa; Verlag, P., Ed.; Parey: Hamburg, Germany, 1968. [Google Scholar]
- Monserud, R.A.; Rehfeldt, G.E. Genetic and Environmental Components of Variation of Site Index in Inland Douglas-Fir. Science 1990, 36, 1–9. [Google Scholar]
- Lyr, H. Effect of the root temperature on growth parameters of H Lyr to cite this version: HAL Id: Hal-00883054 Effect of the root temperature on growth parameters. Ann. For. Sci. 1996, 53, 317–323. [Google Scholar] [CrossRef]
- Bettinger, P. Forest management in a climate change era: Options for planning Forest Management Climate Change Era: Options for Planning. J. Plan. 2011, 16, 57–66. [Google Scholar]
- Yue, C.; Kahle, H.-P.; von Wilpert, K.; Kohnle, U. A dynamic environment-sensitive site index model for the prediction of site productivity potential under climate change. Ecol. Model. 2016, 337, 48–62. [Google Scholar] [CrossRef]
- Fontes, L.; Bontemps, J.-D.; Bugmann, H.; Van Oijen, M.; Gracia, C.; Kramer, K.; Lindner, M.; Rötzer, T.; Skovsgaard, J.P. Models for supporting forest management in a changing environment. For. Syst. 2010, 19, 8–29. [Google Scholar] [CrossRef]
- Lo, Y.-H.; Hamish, J.P.; Seely, B.; Welham, C. Linking Climate Change and Forest Ecophysiology to Project Future Trends in Tree Growth: A Review of Forest Models. In Climate Change-Research Technology Adaptation Mitigation; Janeza Trdine: Rijeka, Croatia, 2011. [Google Scholar]


Publisher’s Note: MDPI stays neutral with regard to jurisdictional claims in published maps and institutional affiliations. |
© 2021 by the authors. Licensee MDPI, Basel, Switzerland. This article is an open access article distributed under the terms and conditions of the Creative Commons Attribution (CC BY) license (http://creativecommons.org/licenses/by/4.0/).