Article

Growth and Physiological Responses of Norway Spruce (Picea abies (L.) H. Karst) Supplemented with Monochromatic Red, Blue and Far-Red Light

1
State Key Laboratory of Tree Genetics and Breeding, Key Laboratory of Tree Breeding and Cultivation of State Forestry Administration, Research Institute of Forestry, Chinese Academy of Forestry, Beijing 100093, China
2
Beijing Botanical Garden, Beijing Floriculture Engineering Technology Research Centre, Beijing Laboratory of Urban and Rural Ecological Environment, Beijing 100091, China
3
College of Forestry, Southwest Forestry University, Yunnan 650224, China
4
Gansu Provincial Key Laboratory of Secondary Forest Cultivation, Research Institute of Forestry of Xiaolong Mountain, Gansu 741022, China
5
Institute of Forestry Science of Tibet Autonomous Region, Tibet 850000, China
6
Department of Biology, Centre for Forest Biology, University of Victoria, Victoria, BC V8W 2Y2, Canada
7
State Key Laboratory of Tree Genetics and Breeding, Northeast Forestry University, Harbin 150040, China
8
Southern Swedish Forest Research Center, Swedish University of Agricultural Sciences, Box 49, 23053 Alnarp, Sweden
*
Author to whom correspondence should be addressed.
Forests 2021, 12(2), 164; https://doi.org/10.3390/f12020164
Submission received: 30 November 2020 / Revised: 28 January 2021 / Accepted: 28 January 2021 / Published: 30 January 2021

Abstract

:
Monochromatic red light (R) supplementation is more efficient than blue light (B) in promoting Norway spruce (Picea abies (L.) H. Karst) growth. Transcriptome analysis has revealed that R and B may regulate stem growth by regulating phytohormones and secondary metabolites; however, the effects of light qualities on physiological responses and related gene expression in Norway spruce require further study. In the present study, three-year-old Norway spruce seedlings received sunlight during the daytime were exposed to monochromatic B (460 mm), monochromatic R (660 nm), monochromatic far-red light (FR, 730 nm), and a combination of three monochromatic lights (control, R:FR:B = 7:1:1) using light-emitting diode (LED) lamps for 12 h after sunset for 90 day. Growth traits, physiological responses, and related gene expression were determined. The results showed that light quality significantly affected Norway spruce growth. The stem height, root collar diameter, and current-year shoot length of seedlings treated with R were 2%, 10% and 12% higher, respectively, than those of the control, whereas seedlings treated with B and FR showed significantly lower values of these parameters compared with that of the control. The net photosynthetic rate (Pn) of seedlings under R treatment was 10% higher than that of the control, whereas the Pn values of seedlings treated with FR and B were 22% and 33%, respectively, lower than that of the control. The ratio of phosphoenolpyruvate carboxylase to ribulose-1,5-bisphosphate carboxylase/oxygenase (PEPC/Rubisco) of seedlings after the R treatment (0.581) was the highest and 3.98 times higher than that of the seedlings treated with B. Light quality significantly affected the gibberellic acid (GAs) levels, which was 13% higher in seedlings treated with R (6.4 g/100 ng) than that of the control, whereas, the GAs level of seedlings treated with B and FR was 17% and 19% lower, respectively, than that of the control. In addition, seedlings treated with R achieved the lowest ratio of leaf chlorophyll content to fresh weight (8.7). Compared to the R and control treatments, seedlings received FR treatment had consistently lower values of the quantum yield of electron transport beyond QA (primary quinone, ϕEo) and efficiency, with which a trapped exciton moves an electron into the electron transport chain beyond QA (ψo), while higher values of the relatively variable fluorescence at the J step and normalized relatively variable fluorescence at the K step (Wk). The values of ϕEo, ψO, VJ and Wk in seedlings treated with B were similar to those in the control group. The expression of genes associated with light signal transduction, such as PHYTOCHROME C (PHYC), ELONGATED HYPOCOTYL5 (HY5), CONSTITUTIVE PHOTOMORPHOGENIC 1-2 (COP1-2), and PHYTOCHROME INTERACTING FACTOR 3 (PIF3), was significantly higher in seedlings under B treatment than those under other light treatments. Nevertheless, significant differences were not observed in the expression of COP1-2, HY5, and PIF3 between the R treatment and the control. The expression value of COP1-2 was significantly lower in R than FR light treatments. In conclusion, compared with the control, R promotes, whereas B and FR inhibit Norway spruce growth, which was accompanied by physiological changes and genes expression regulation that may be relate to a changing phytochrome photostationary state (PSS) with the supplemental R in seedlings.

1. Introduction

Light not only provides energy for plant photosynthesis, but also regulates plant growth and development as a signal. The relative distribution of the light spectrum changes with variations in latitude and weather and on a daily and seasonal basis [1]. This variation is sensed through the activation of various receptors used to regulate growth and adaptation to changes in light environment [2]. There are various photoreceptors, such as phytochromes, cryptochromes, phototropins and UVR8 [3]. Phytochromes exist in two forms: the red light (R) absorbing form (Pr), which absorbs maximally at 660 nm and is generally considered to be biologically inactive; and the far-red light (FR) absorbing form (Pfr), which absorbs maximally at 730 nm and is biologically active [4]. Absorption of light by either Pr or Pfr results in phototransformation between these two forms, which drives the on/off switching of the successive signaling pathway [5]. Phytochrome photostationary state (PSS) indicates the ratio of the active form of phytochrome (Pfr) to total phytochrome (Ptotal) (Pfr/Ptotal) [6]. As the FR ratio increases, i.e., R/FR decreases, PSS decreases due to the conversion of active Pfr to the inactive, Pr. That is a low R/FR results in a low PSS [7,8].
Different light qualities have different impacts on plant growth [9], and plants are particularly sensitive to R, FR and blue light (B). FR is required to maintain the growth of angiosperms and gymnosperms, and clinal variations are observed in these requirements [10,11,12]. It has been shown that FR is more effective than R for maintaining Norway spruce (Picea abies (L.) H. Karst) growth [13], whereas a mix of R and FR at a ratio of 1:1 is more effective than the use of either R or FR alone. Growth under the FR-rich light treatments produced tall seedlings with a greater needle dry mass [14], and the trend would be strengthened when light intensity was lower [13,15]. However, southern populations (59° N) that do not generate a complete bud set are more sensitive to R even at low levels of radiation (0.1 Wm−2). Furthermore, Norway spruce seedlings originating from 62° N latitude grow normally under the exclusion of FR treatment [14]. Blue light is a short-wavelength light with high energy, and it promotes the hydraulic conductivity of white birch (Betula pendula Roth.) [16]. Blue light induces the generation of bud sets in Norway spruce seedlings [13], although it does not have an effect on extending the hypocotyl of Scots pine (Pinus sylvestris L.) seedlings, which require FR to regulate stem extension [17].
Light quality regulates plant growth and development through the regulation of plant physiological activities. Light quality regulates photosynthesis, including photosynthetic electron transport chain redox state [18], photosystem ratio adjustments [19], photosynthetic pigment synthesis [20], photosynthetic carbon assimilation [21], stomatal movement [22], chloroplast structure [23], and corresponding gene expression [24,25,26,27]. Light quality also affects the levels of chemical substances and metabolic processes in the plant, including soluble proteins, soluble sugars, and plant secondary metabolites. For example, blue light promotes flavonoid accumulation [28,29]. Different light spectra regulate stem extension through different mechanisms, which affect phytohormone levels and interactions between plant hormones and lights [30].
A number of studies has focused on the light-regulated transcriptional network in Arabidopsis thaliana (L.) Heynh. seedling morphogenesis [31,32,33] and physiological responses of A. thaliana [18,34], algae [35,36], and vegetables [9,37,38] under different light conditions. However, the regulatory mechanism for light response may differ between gymnosperms and angiosperms [39]. Although there were similar previous studies of different Norway spruce seedlings that evaluated the effects of origin of populations on response to light quality [11,13,14,15,27], there exist uncertainties on the effects of distinct wavelengths on growth and physiological responses and the involvement of sensing the photo-receptors and cross-talks of signal transduction pathways. In the present study, 3-year-old Norway spruce seedlings were treated under R, B, FR, and a combination of these three monochromatic lights at a ratio of R:B:FR = 7:1:1(control) using light-emitting diode (LED) lamps, and growth, photosynthetic parameters, photosynthetic enzyme, photosystem II (PSII) activity, GAs content, and related gene expression were determined. The study aimed at revealing the growth and physiological responses of an important forest species, Norway spruce, at seedling stage and under “semi-controlled” growth environment, using greenhouse facilities and supplemental R, FR and B.

2. Materials and Methods

2.1. Plant Materials and Experimental Design

Three-year-old Norway spruce seedlings, which were rooted cuttings from a single genotype, were used for all experiments in a greenhouse located at the Research Institute of Forestry of Xiaolongshan, Gansu Province (E 105°54′37′′, N 34°28′50′′), China. The cutting orchard of Norway spruce was established from the seedlings of Czech origin (E 14°25′15′′, N 50°13′13′′). Previous experiments showed that Norway spruce of Czech origin had a good growth performance in the test site (data not shown). The seedlings from these cuttings were sufficient for conducting the investigation, so we selected these Norway spruce seedlings for this study. The seedlings normally received sunlight during the day and were illuminated after sunset for 12 h under LED light (Lian Bang Zhong Ke Electronic Technology Co., Ltd., Shenzhen, China). A timer was used to control the switching on and off of the lamps. The seedlings were exposed to LED light treatments in a greenhouse from May to August (90 day) in two successive years. The four LED light sources were monochromatic blue light (B, 460 nm), monochromatic red light (R, 660 nm), monochromatic far-red light (FR, 730 nm), and a combination of these three monochromatic blue, red and far-red lights (R:B:FR = 7:1:1). Hereafter, the blue, red and far-red light referred to as B, R, and FR. The B, R, and FR correspond to the wavelengths of maximum activation of the cryptochrome and phytochrome Pr and Pfr forms, respectively. Previous study has shown that FR is effective for improving the yield and quality of plants produced in a plant nursery under artificial lights and the ratio of the existing R and B sources should be considered upon applying FR [7]. The ratio of R:B:FR light = 8:1:1 or 7:1:1 was determined to be the optimal parameters in the cultivation of horticultural crop. Thus, 7:1:1 R:B:FR was chosen in our study as it has been applied to the production of plant nurseries to improve the efficiency of plant growth and save energy. It should be noted that the purpose of this study was to compare the effects of different light qualities on the growth and physiological responses of Norway spruce seedlings. In addition, if Norway spruce is grown without any additional light, it would stop growing with short growth period (50 d) [40]; therefore, we used a combination of three monochromatic lights (R:B:FR = 7:1:1) as control (CK). The LED lamps (90 cm long) were mounted over each experimental plot, and the intensity of photosynthetically active radiation (PAR) was maintained at 50 μmolm−2s−1. Six seedlings were grown in a plot with 10 cm spacing, and each LED treatment covered up to three plots. A shading cloth was placed at sunset to shield the plants from external light and was removed at sunrise.
The average temperature in the nursery was 20~26 °C, and the average humidity was 50%–65%. All seedlings were consistently managed, watered regularly and fertilized every two weeks using a foliar nutrient spray, containing 5 kgm−2 4/1000 mono potassium phosphate (main ingredient KH2PO4) and 0.002 kgkg−1 phospham (main ingredient (NH4)2HPO4), calcium phosphate (Ca3(PO4)2), and carbamide (H2NCONH2). A shading net was used to control the temperature at noon on sunny days, and automatic sprinkler irrigation facilities were used for watering and controlling humidity.

2.2. Growth and Needle Traits

We measured plant growth traits (initial stem height, initial root collar diameter and initial length of current-year shoot) at the start of the experiment. We determined the stem height, root collar diameter and current-year shoot length for all seedlings after light treatments for two continuous growth periods. The leaf area and leaf weight were measured using 30 needles collected from six seedlings per light treatment, with specific leaf area (SLA) representing the leaf area/leaf fresh weight ratio. The needles were scanned and leaf area was analyzed using the WinRHIZO root analysis system (Regent Instruments Inc., Quebec, QC, Canada, Agent: Ecotech ecological technology Ltd.).

2.3. Phytohormone Level

An enzyme-linked immunosorbent assay (ELISA) was used to determine the gibberellic acid (GAs), auxin (IAA), abscisic acid (ABA), and zeatin (ZR) level. Mouse monoclonal antigens and antibodies against GAs, IAA, ABA and ZR and the IgG-horseradish peroxidase used in ELISA were obtained from the Research Institute of China Agricultural University (Beijing, China). The specific method of ELISA has been previously described [41].

2.4. Chlorophyll Content

The chlorophyll content of the needles was measured using 6 seedlings per light treatment. Chlorophyll was extracted using 95% ethanol in dark conditions for 72 h at 4 °C. Absorbance was analyzed using a UV-1601 ultraviolet-visible (UV-VIS) spectrophotometer (Shimadzu, Tokyo, Japan). The contents of chlorophyll a and chlorophyll b were individually calculated and then added together for total chlorophyll content according to the methods described by Porra et al. [42]. The ratio of leaf chlorophyll content to fresh weight was calculated as leaf chlorophyll content/leaf fresh weight.

2.5. Photosynthetic Enzymes

Needles (0.1 g for each sample) were ground in a mortar with liquid nitrogen to obtain fine powder that was subsequently mixed with 150 mg polyvinylpolypyrrolidone (PVPP) and extraction buffer (1.5 mL) containing 40 mM Tris-HCl buffer solution (pH 7.6), 10 mM MgCl2, 0.25 mM EDTA, 5 mM GSSG, and silica sand. The homogenate was centrifuged for 15 min at 20,000 g and 4 °C, stored at −70 °C, and subsequently used to determine the enzyme activity. Ribulose-1,5-bisphosphate carboxylase/oxygenase (Rubisco) activity was determined as the rate of nicotinamide-adennine dinucleotide (NADH) decline (ε = 6.22 mM−1 cm−1) at 340 nm. A reaction system (1 mL) containing 40 mM Tris-HCl buffer solution (pH 7.8), 12 mM MgCl2, 0.4 mM EDTA-Na2, 1 mM NADH, 10 mM ATP, 10 mM phosphocreatine, 40 mM NaHCO3, 20 U creatine phosphate kinase, 20 U phosphoglycerate kinase, 20 U phosphoglyceraldehyde dehydrogenase, 5 mM RuBP, and 100 μL enzyme liquid was initiated upon addition of RuBP. The results were recorded in alternating intervals of 10 s, and the drop-out absorbance value at 230 nm within 3 min was determined.
The phosphoenolpyruvate carboxylase (PEPC) reaction was coupled with the malate dehydrogenase reaction and assayed at 30 °C to monitor the reduced form of NADH oxidation at 340 nm using a Gilford recording spectrophotometer. According to the instruction of PEPC kit (Solarbio, 50T) and reference to a previous study [43], the PEPC activity was analyzed and calculated. The ratio of PEPC to Rubisco was calculated as PEPC activity/Rubisco activity.

2.6. Gas-Exchange Measurements

Gas-exchange was measured in the morning between 9:00–11:30 h on six seedlings per treatment using a Li-6400XT system (LI-COR, Lincoln, NE, USA) equipped with a conifer leaf chamber. Li-6400-white light source was used, and the CO2 was set at 400 ppm, which was near the ambient CO2 concentration, air humidity at 60%–70%, temperature at 28 °C, and PPFD at 1000 μmol m−2 s−1. We selected the current-year mature needles on the current-year shoot of the lateral branch of the first morphogenetic cycle of Norway spruce to measure the net photosynthetic rate (Pn, μmol CO2 m−2 s−1), stomatal conductance (Gs, mol H2O m−2 s−1), intercellular CO2 concentration (Ci, µmol CO2 mol1) and transpiration rate (Tr, µmol H2O m2 s1). The needles used for gas exchange analysis were also collected to determine the leaf area and correct the photosynthetic parameters.

2.7. Chlorophyll a Fluorescence

Chlorophyll a fluorescence transients were measured using a Handy Plant Efficiency Analyzer (Hansatech, UK) at night after lighting for 1, 3, and 9 h with four light sources. For each treatment and plot, four seedlings were selected to measure the chlorophyll a fluorescence parameters. In a clear and windless day, a row of needles (8–10 needles) of lateral branch (three lateral branches for each cutting and six cuttings per light treatment) were glued with transparent glue. The middle part of the leaves was clamped with a dark adaptor. After adapting to dark for 30 min, the probe was placed on the clip. The needles were exposed to saturated pulse light (3000 mmol/m2/s1) for 1 s. Initial fluorescence (Fo) and maximum fluorescence (Fm) of dark adaptation were read directly from the instrument, and the variable fluorescence (Fv) was calculated as Fv = Fm − Fo, and PSII maximum light energy conversion efficiency as Fv/Fm. Two intermediate steps designated J and I appeared at 2 and 30 ms, respectively; hence, a fast rise of the chlorophyll a fluorescence transient with the notation of O-J-I-P was obtained.
Chlorophyll a fluorescence transients were analyzed by utilizing the original data from the polyphasic fluorescence transients according to the JIP test. The following fluorescence parameters were calculated using the JIP test [44]: the quantum yield of electron transport beyond QA (primary quinone) (ϕEo), ϕEo = ETo/ABS, where ABS is energy flux for absorption and ET is energy flux for electron transport; the efficiency that a trapped exciton moves an electron into electron transport chain beyond QAo), ψo = ETo/TRo, where TR stand for energy flux for trapping; the normalized relative variable fluorescence at the K-th step (Wk), Wk = (Fk − Fo)/(FJ − Fo); the relative variable fluorescence at any time (Vt), Vt = (Ft − Fo)/(Fm − Fo).

2.8. Photosynthesis-Related Gene Expression

The difference in gene expression among light qualities was analyzed using qRT-PCR with three biological replicates for each treatment. In all cases, the primers spanned exon-exon boundaries, and actin was used as a reference control. The reaction was performed using a 26SYBR Green Master Mix (TIANGEN, Beijing, China) and CFX96 Real-Time System (Bio-Rad, Hercules, CA, USA) under the following conditions: denaturation at 95 °C for 10 min followed by 40 amplification cycles (95 °C for 15 s, 60 °C for 45 s, and 72 °C for 30 s). The relative expression was calculated using the delta-delta-Ct method. The primer sequences are listed in Table 1.

2.9. Statistical Analysis

All data were analyzed using the analysis of variance (ANOVA) procedure in SAS [45], where light treatments were considered as fixed effects and residuals were considered as random experimental errors. ANOVA was applied to the measured and observed values to reveal any differences, and the significance of these differences was verified (p < 0.05) using Duncan’s test. Pearson correlation analysis was applied to the different traits using mean values for each light spectrum.

3. Results

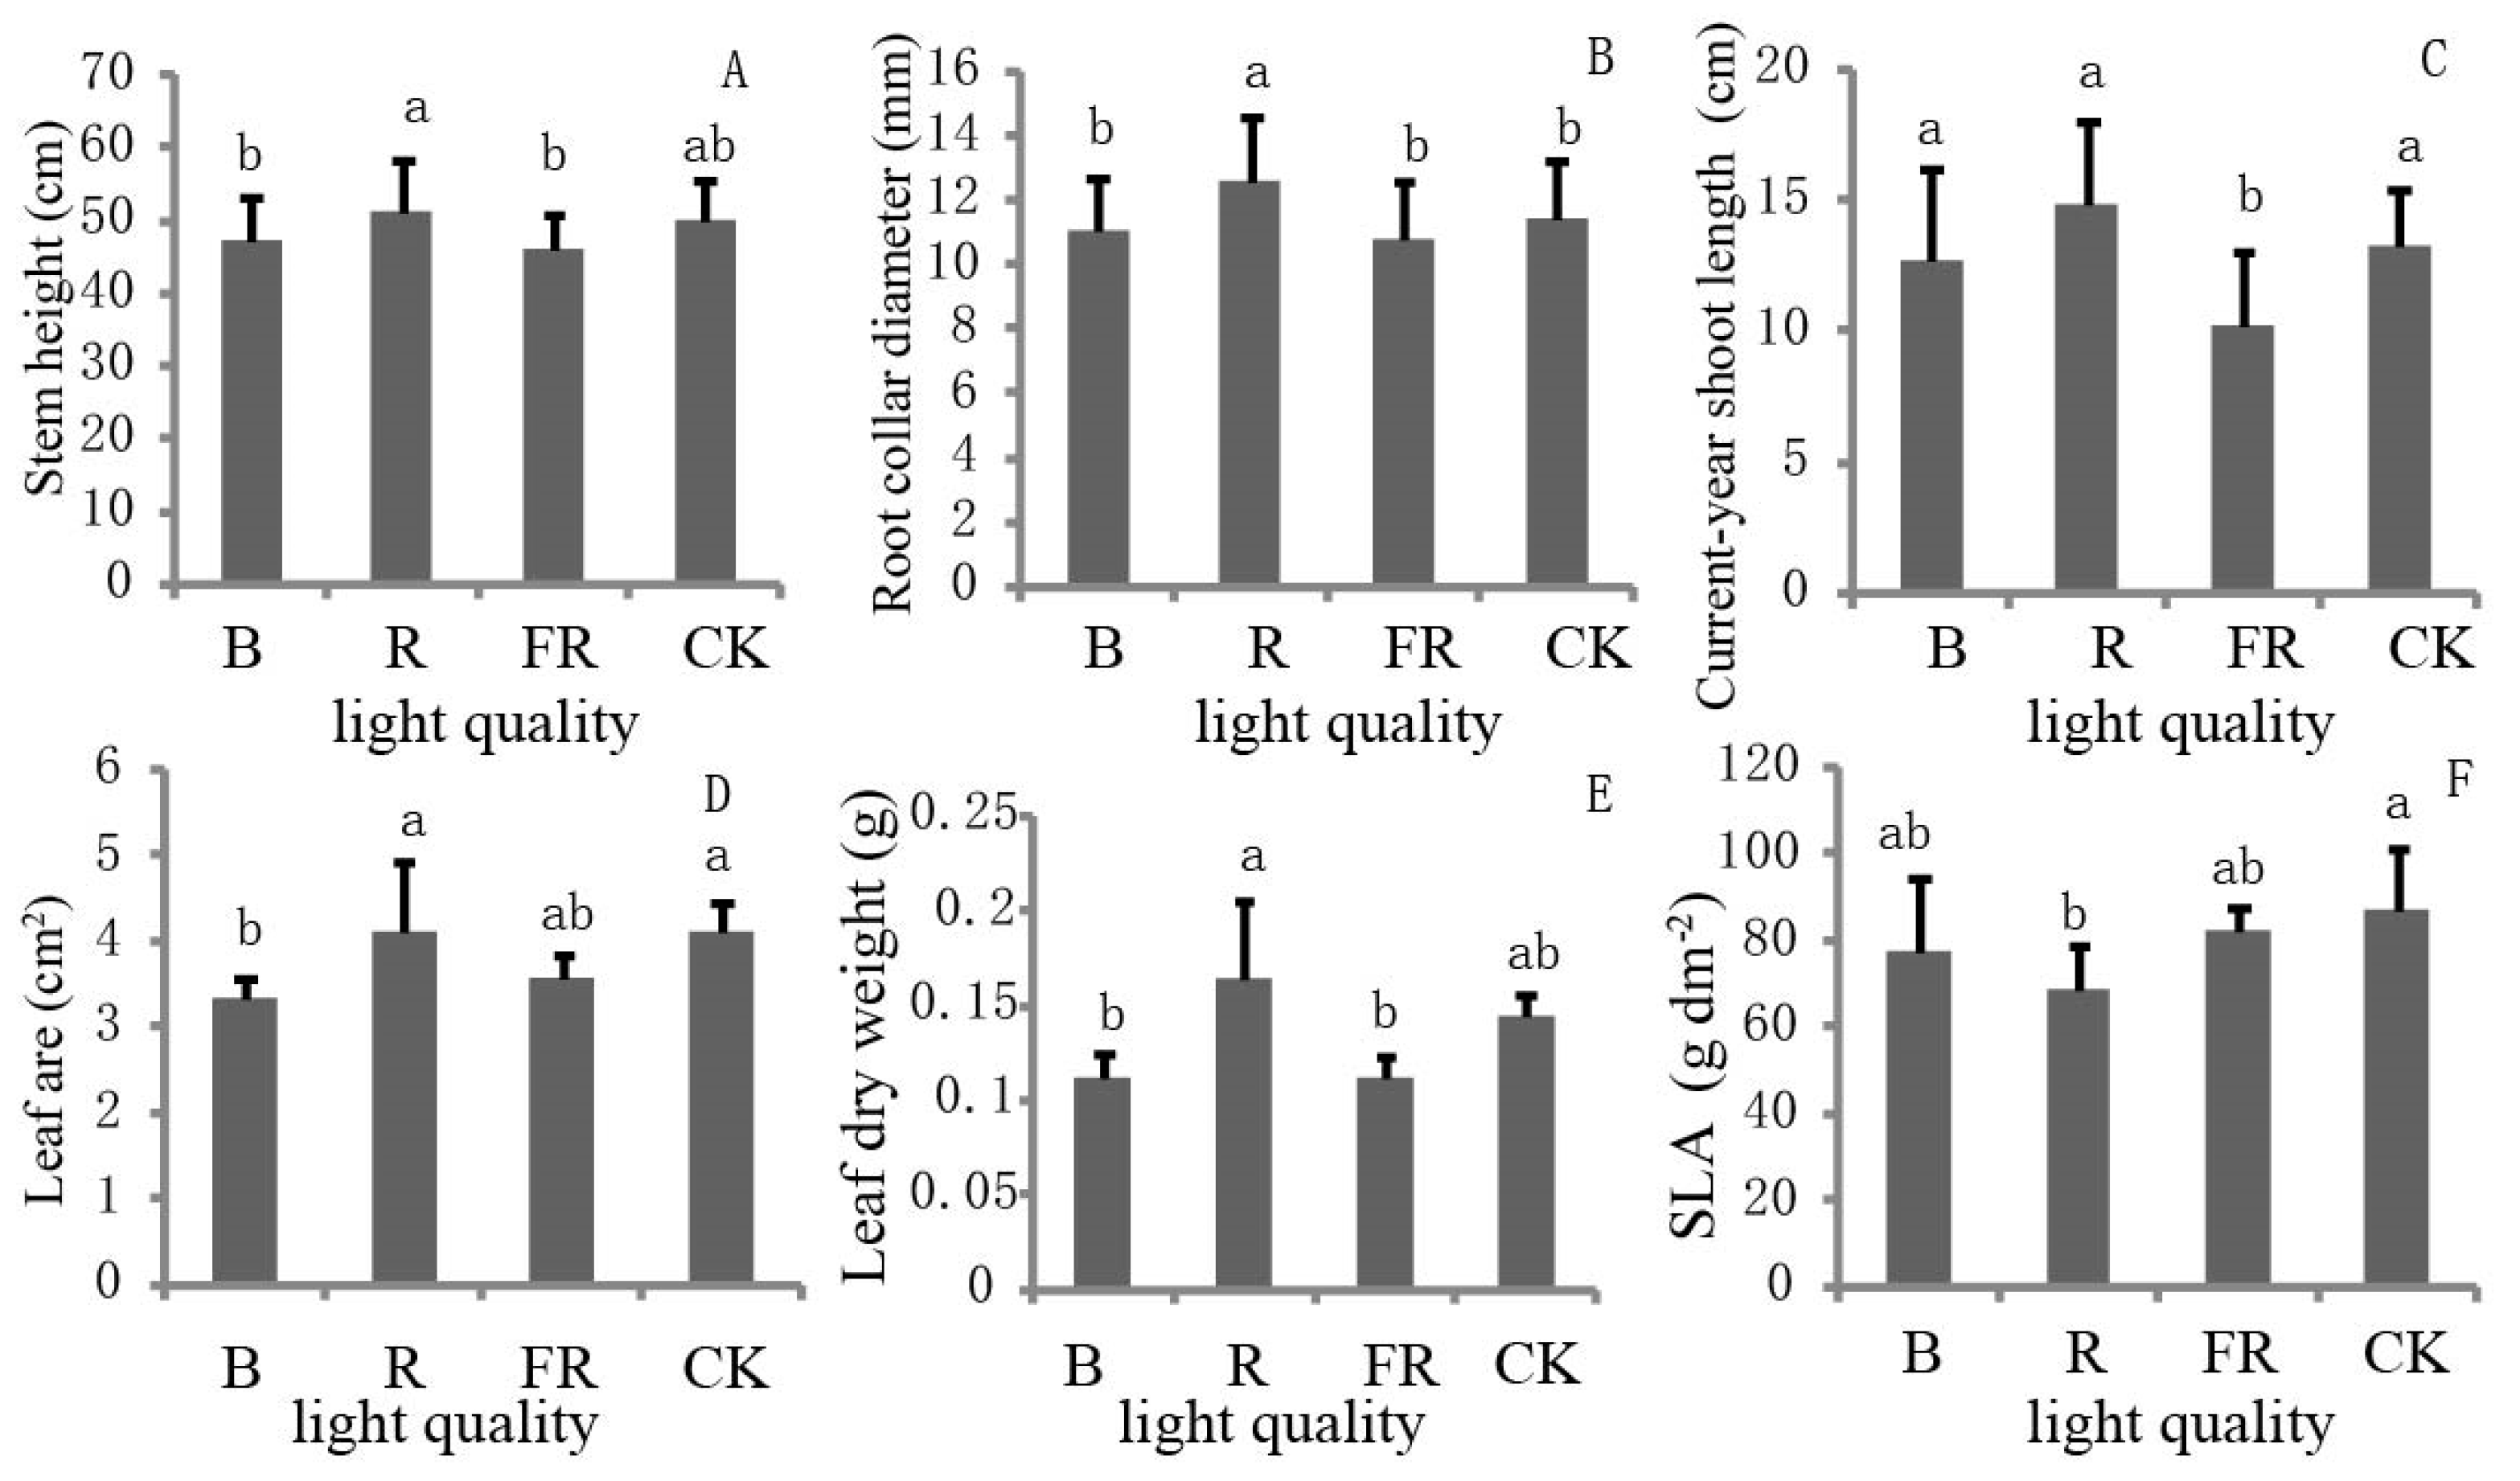
3.1. Effect of Light Quality on Growth Performance

Significant differences were observed in stem height, root collar diameter, current-year shoot length, leaf area, leaf dry weight, and SLA of Norway spruce seedlings exposed to four light spectra treatments (p < 0.05, Table 2). The average values of stem height, root collar diameter and current-year shoot length of seedlings that received R treatment were 51.16 cm, 12.58 mm, and 14.91 cm, which were 2%, 10%, and 12%, respectively higher than those of the control (Figure 1). Whereas, those treated with B and FR showed reduced growth compared to those of the control. To be more specific, the current-year shoot length of seedlings treated with B (12.69 cm) was slight lower by 5% than that of the control, while it was considerable lower (by 23%) in seedlings treated with FR light (10.17 cm) than that of the control. However, changes in stem height and root collar diameter of seedlings treated with B showed similar trends to those treated with FR, with 2%–5%, 6%–8%, respectively lower that of the control.
There were no significant differences in the leaf dry weight and leaf area between seedlings treated with R and control; however, they were significantly lower in seedlings treated with B and FR than those of the control (Figure 1). SLA showed an opposite trend to that of leaf dry weight and leaf area. SLA of seedlings treated with R was significantly lower than that of the control, but it was not significantly different from seedlings treated with B and FR.

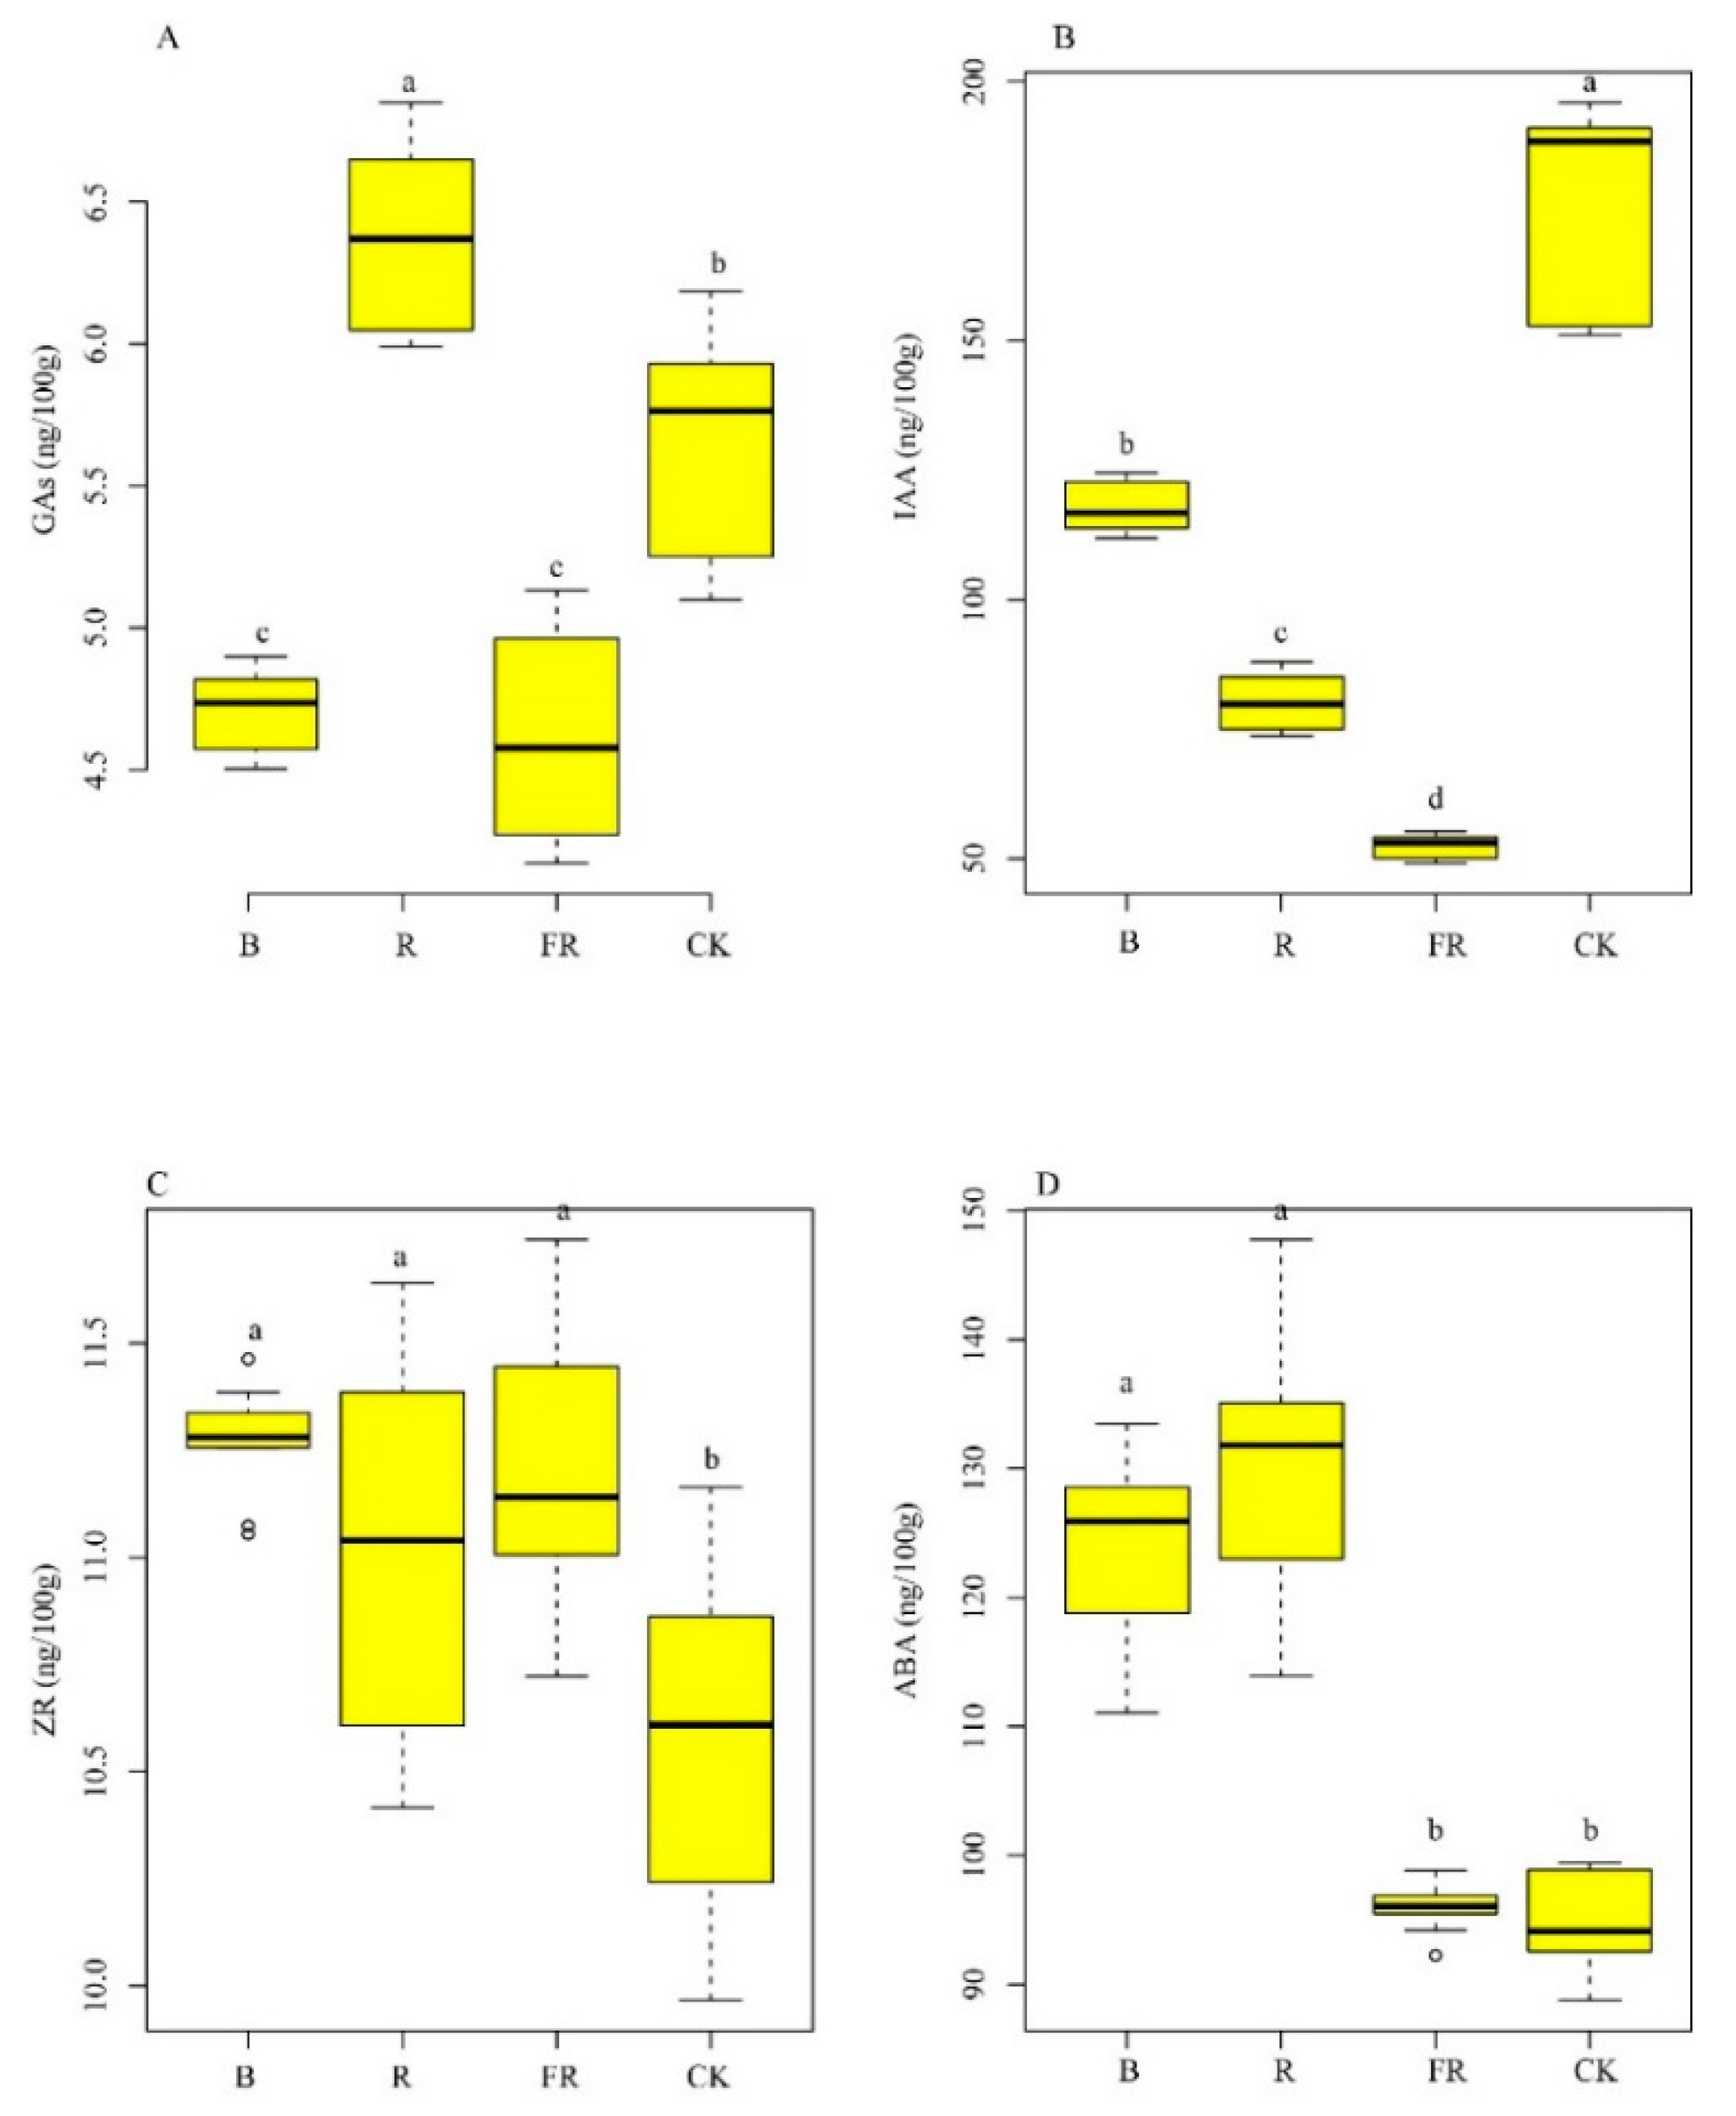
3.2. Effect of Light Quality on Phytohormone Level

Light quality significantly affected the GAs level (Table 2), which was 13% higher in seedlings treated with R (6.38 ng/100 g) than the control (Figure 2). The GAs levels of seedlings treated with B and FR were 17% and 19%, respectively lower than those of the control (Figure 2). Light quality also significantly affected IAA, ZR and ABA levels (Table 2). The monochromatic R, B, and FR significantly improved the ZR level compared to the control, while the IAA levels were significant lower than those of the control. The ABA levels of seedlings treated with monochromatic R and B did not differ significantly, but ABA levels in both treatments were higher than those of FR treatment and the control.

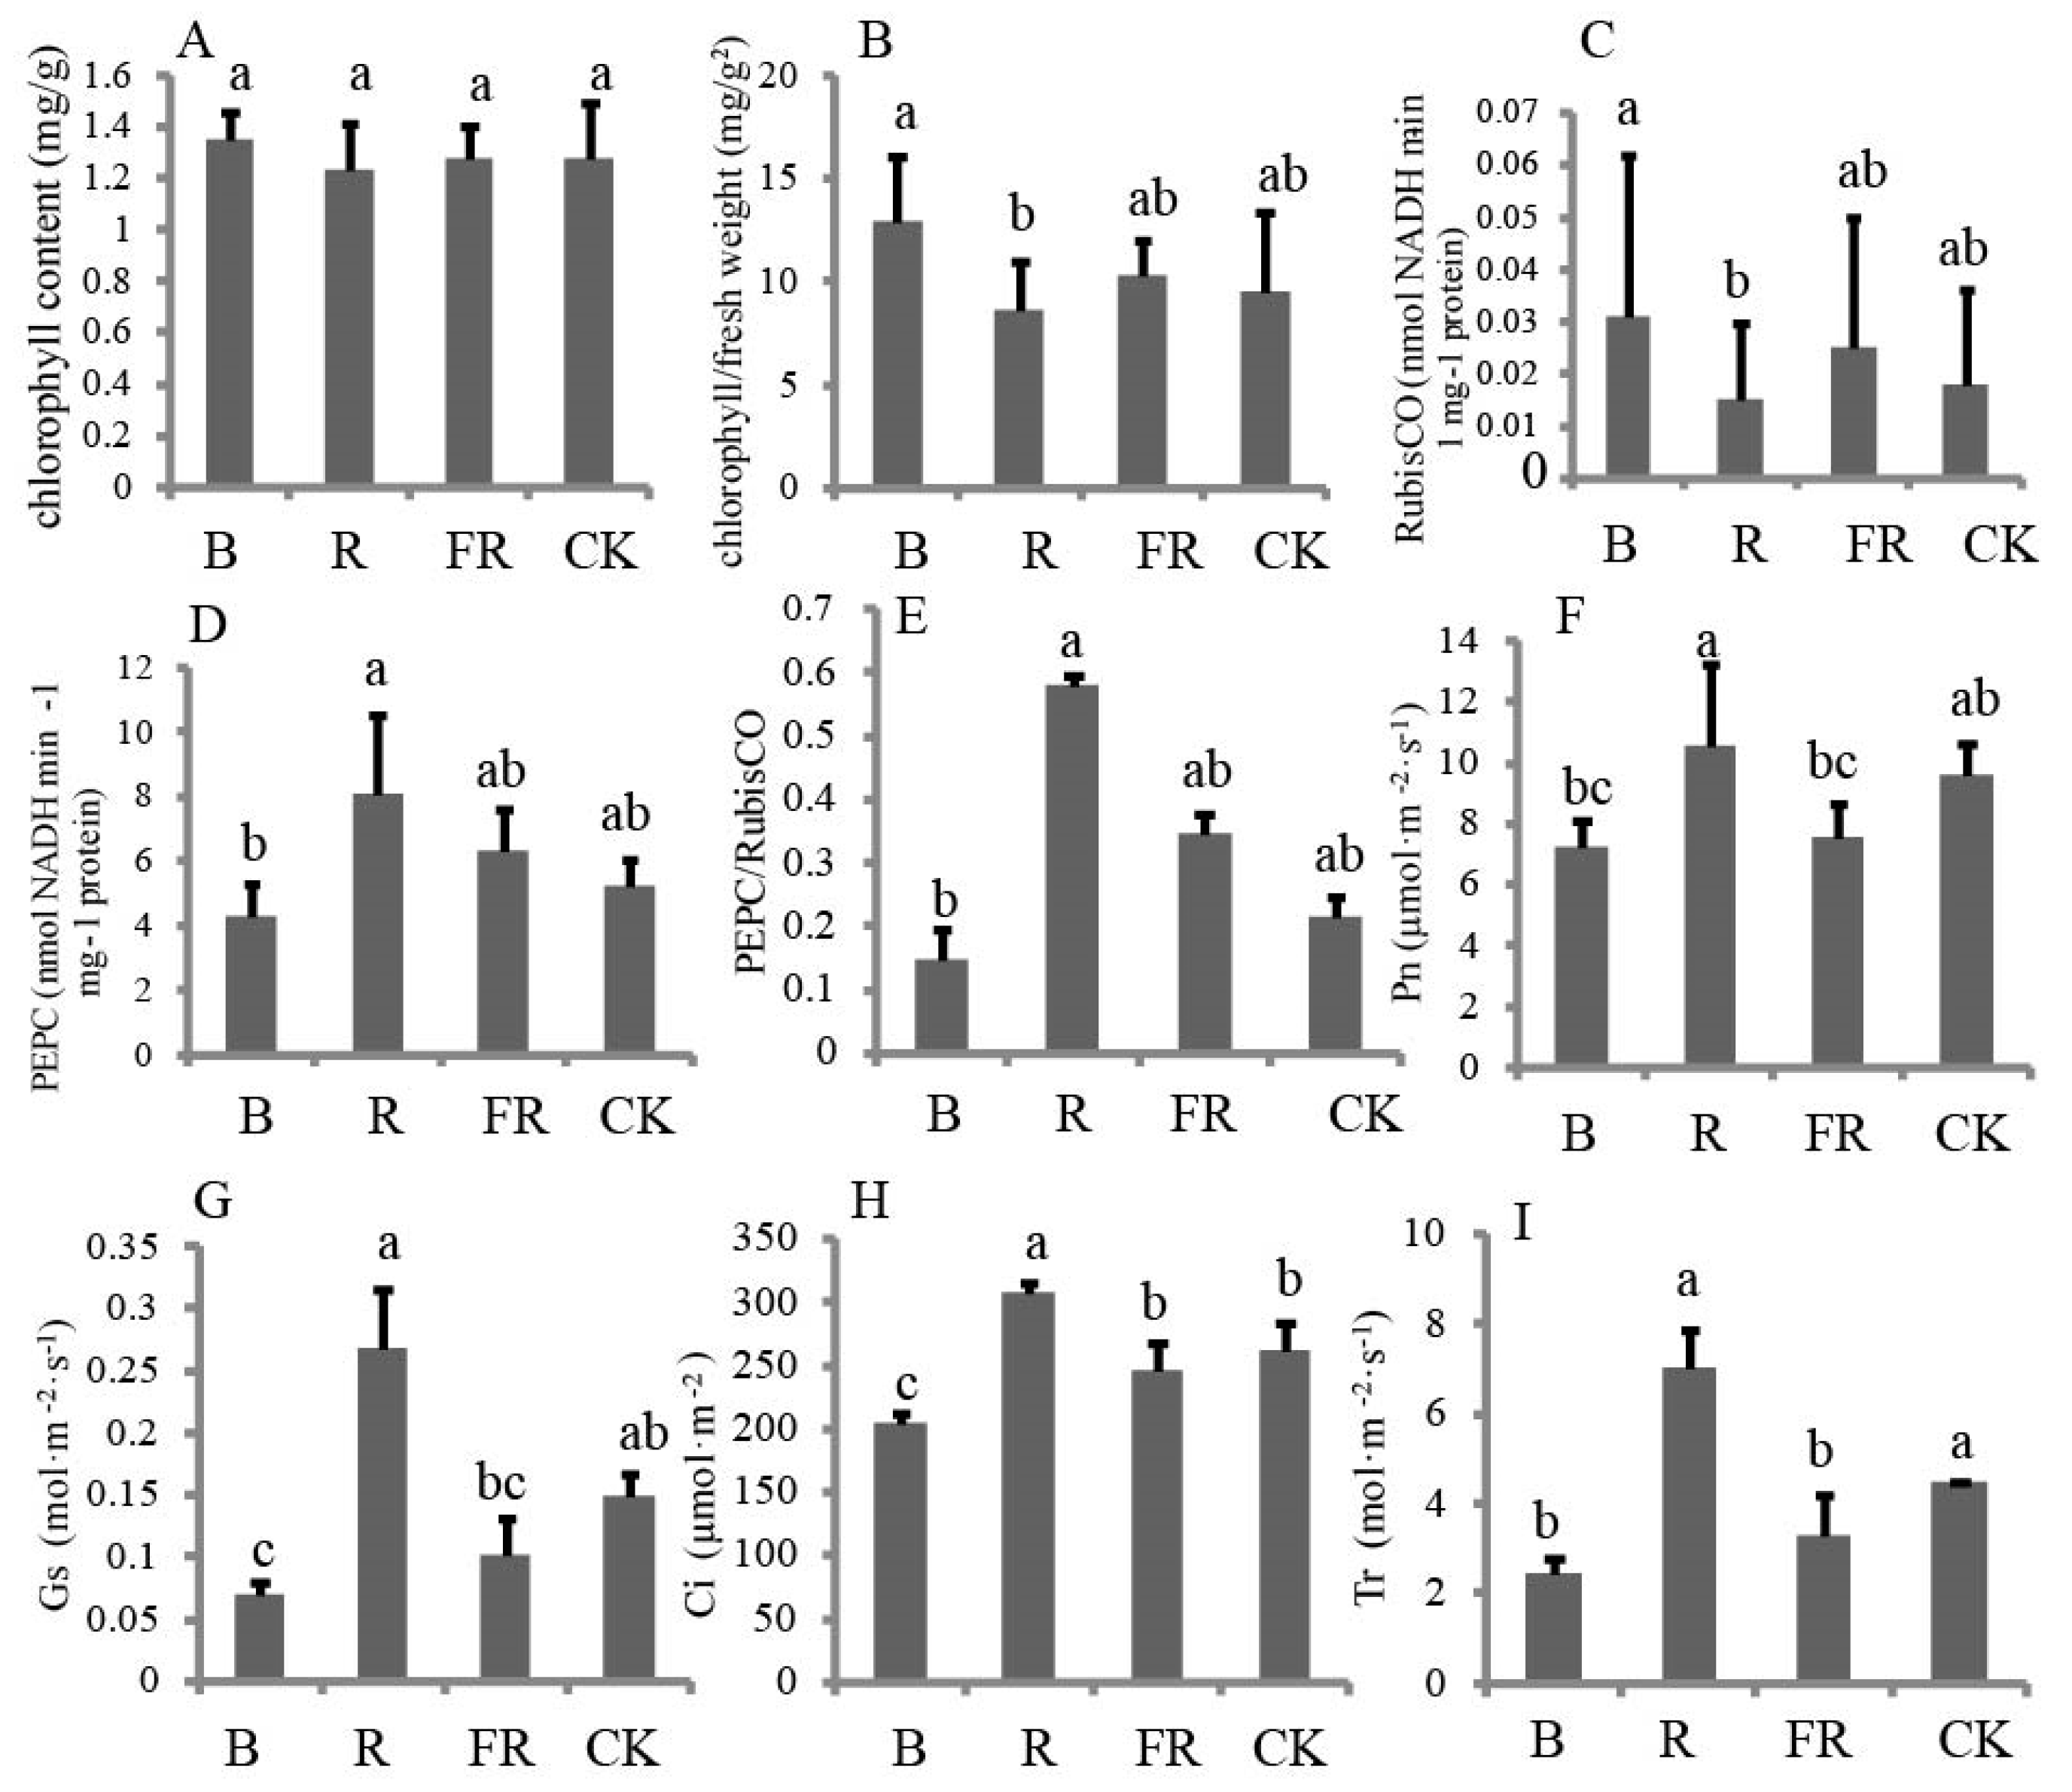
3.3. Effect of Light Quality on Chlorophyll Content

There was significant difference in the ratio of leaf chlorophyll content to fresh weight of seedlings treated with four light spectra (Figure 3A); however no significant difference was observed in chlorophyll content (Table 2). The ratio of leaf chlorophyll content to fresh weight of seedlings treated with B (12.93) was 36% higher than that of the control (9.51), which, in turn, had no significant difference with those treated with FR (10.35). The lowest ratio was observed in seedlings treated with R (8.67) (Figure 3B).

3.4. Effect of Light Quality on Photosynthetic Enzyme and Gas Exchange Parameters

Light quality significantly affected the PEPC, Rubisco, and the PEPC/Rubisco ratio (Table 2), with the lowest Rubisco activities (0.015 nmol NADH min−1 mg−1 protein) were detected in seedlings treated with R (Figure 3C), which was about 52% lower than that of seedlings treated with B (0.031 nmol NADH min−1 mg−1 protein). However the highest PEPC and PEPC to Rubisco ratio were detected in seedlings treated with R (Figure 3D,E). Specifically, PEPC and PEPC to Rubisco ratio were 8.11 nmol NADH min−1 mg−1 protein and 0.58, respectively in seedlings treated with R, which was approximately 2 and 4 times higher than those treated with B (PEPC = 4.31 nmol NADH min−1 mg−1 protein and PEPC/Rubisco = 0.15). Besides, the values for PEPC, Rubisco and PEPC/Rubisco in seedlings treated with FR and in the control group were intermediate and did not vary significantly.

3.5. Effect of Light Quality on Chlorophyll Fluorescence Parameters

Light quality significantly affected ϕEo, ψO, Fv/Fm, VJ, and Wk in seedlings exposed to light for 1, 3, 9 h at night, except for Wk after 1 h exposure to light (Table 3). The changes for chlorophyll fluorescence parameters were almost consistent among 1, 3 and 9 h exposure to light at night. To be more specific, the highest values for ϕEo and ψO were observed in seedlings treated with R than FR regardless of the exposure time, whereas the opposite was observed for VJ (Table 4). In contrast, Wk did not differ among different light treatments for 1 h, but it was significantly higher in B treatment for 3 h than R treatment and in FR treatment for 9 h than R treatment. The Fv/Fm was higher for seedlings treated with FR light for 1 h and 9 h than those treated with R and the control, respectively.

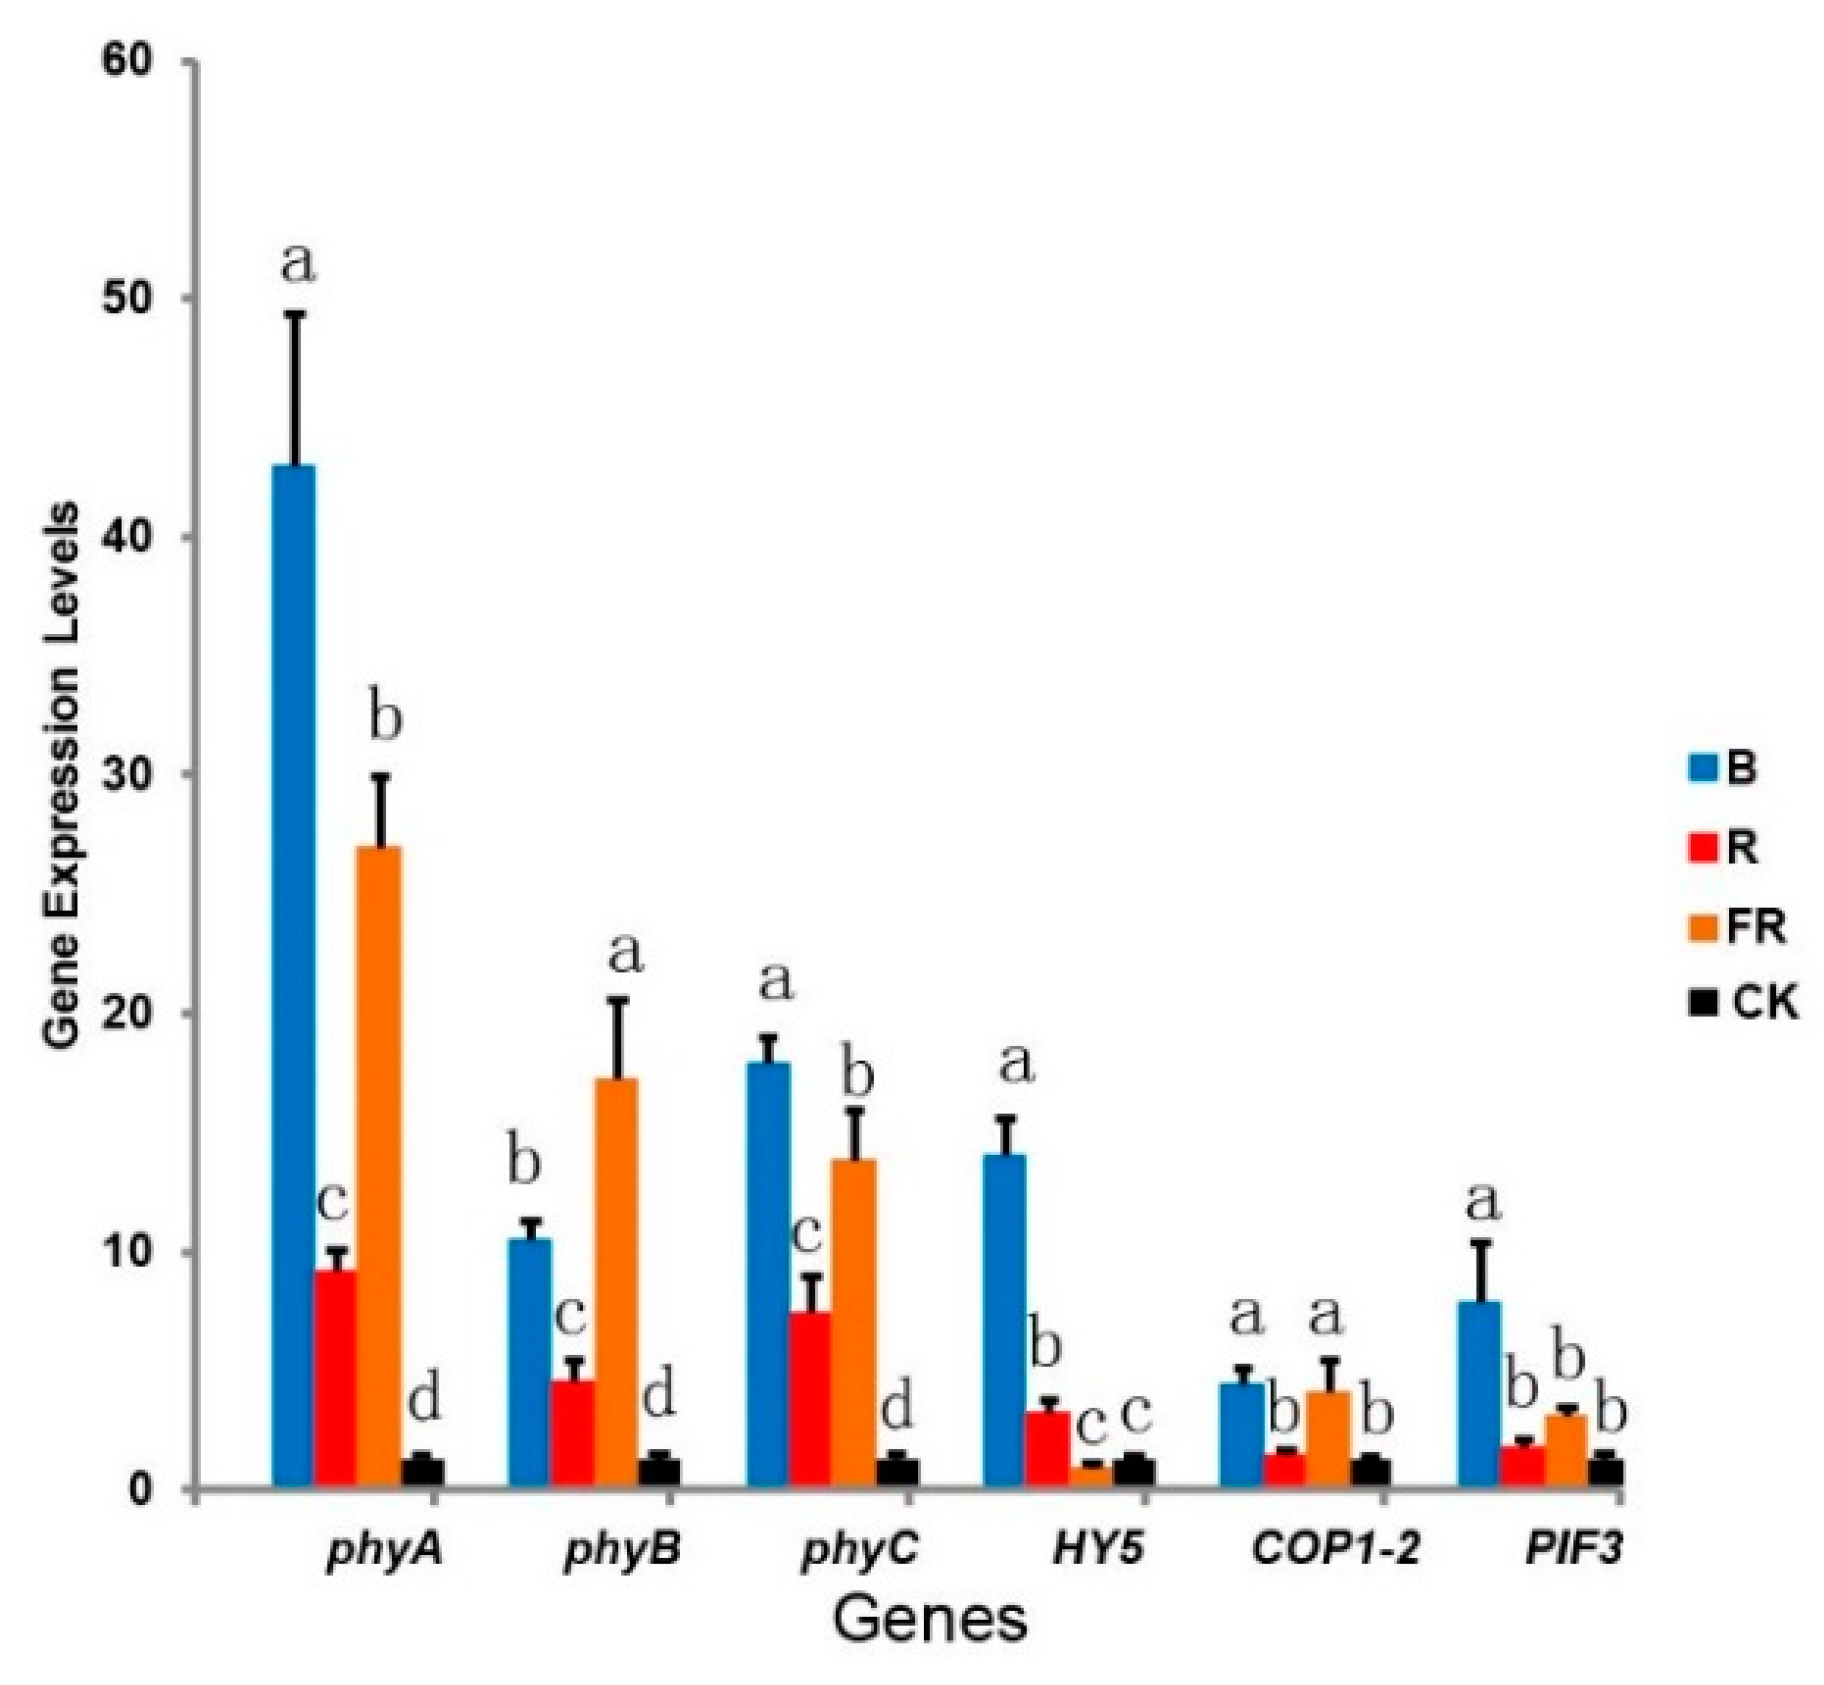
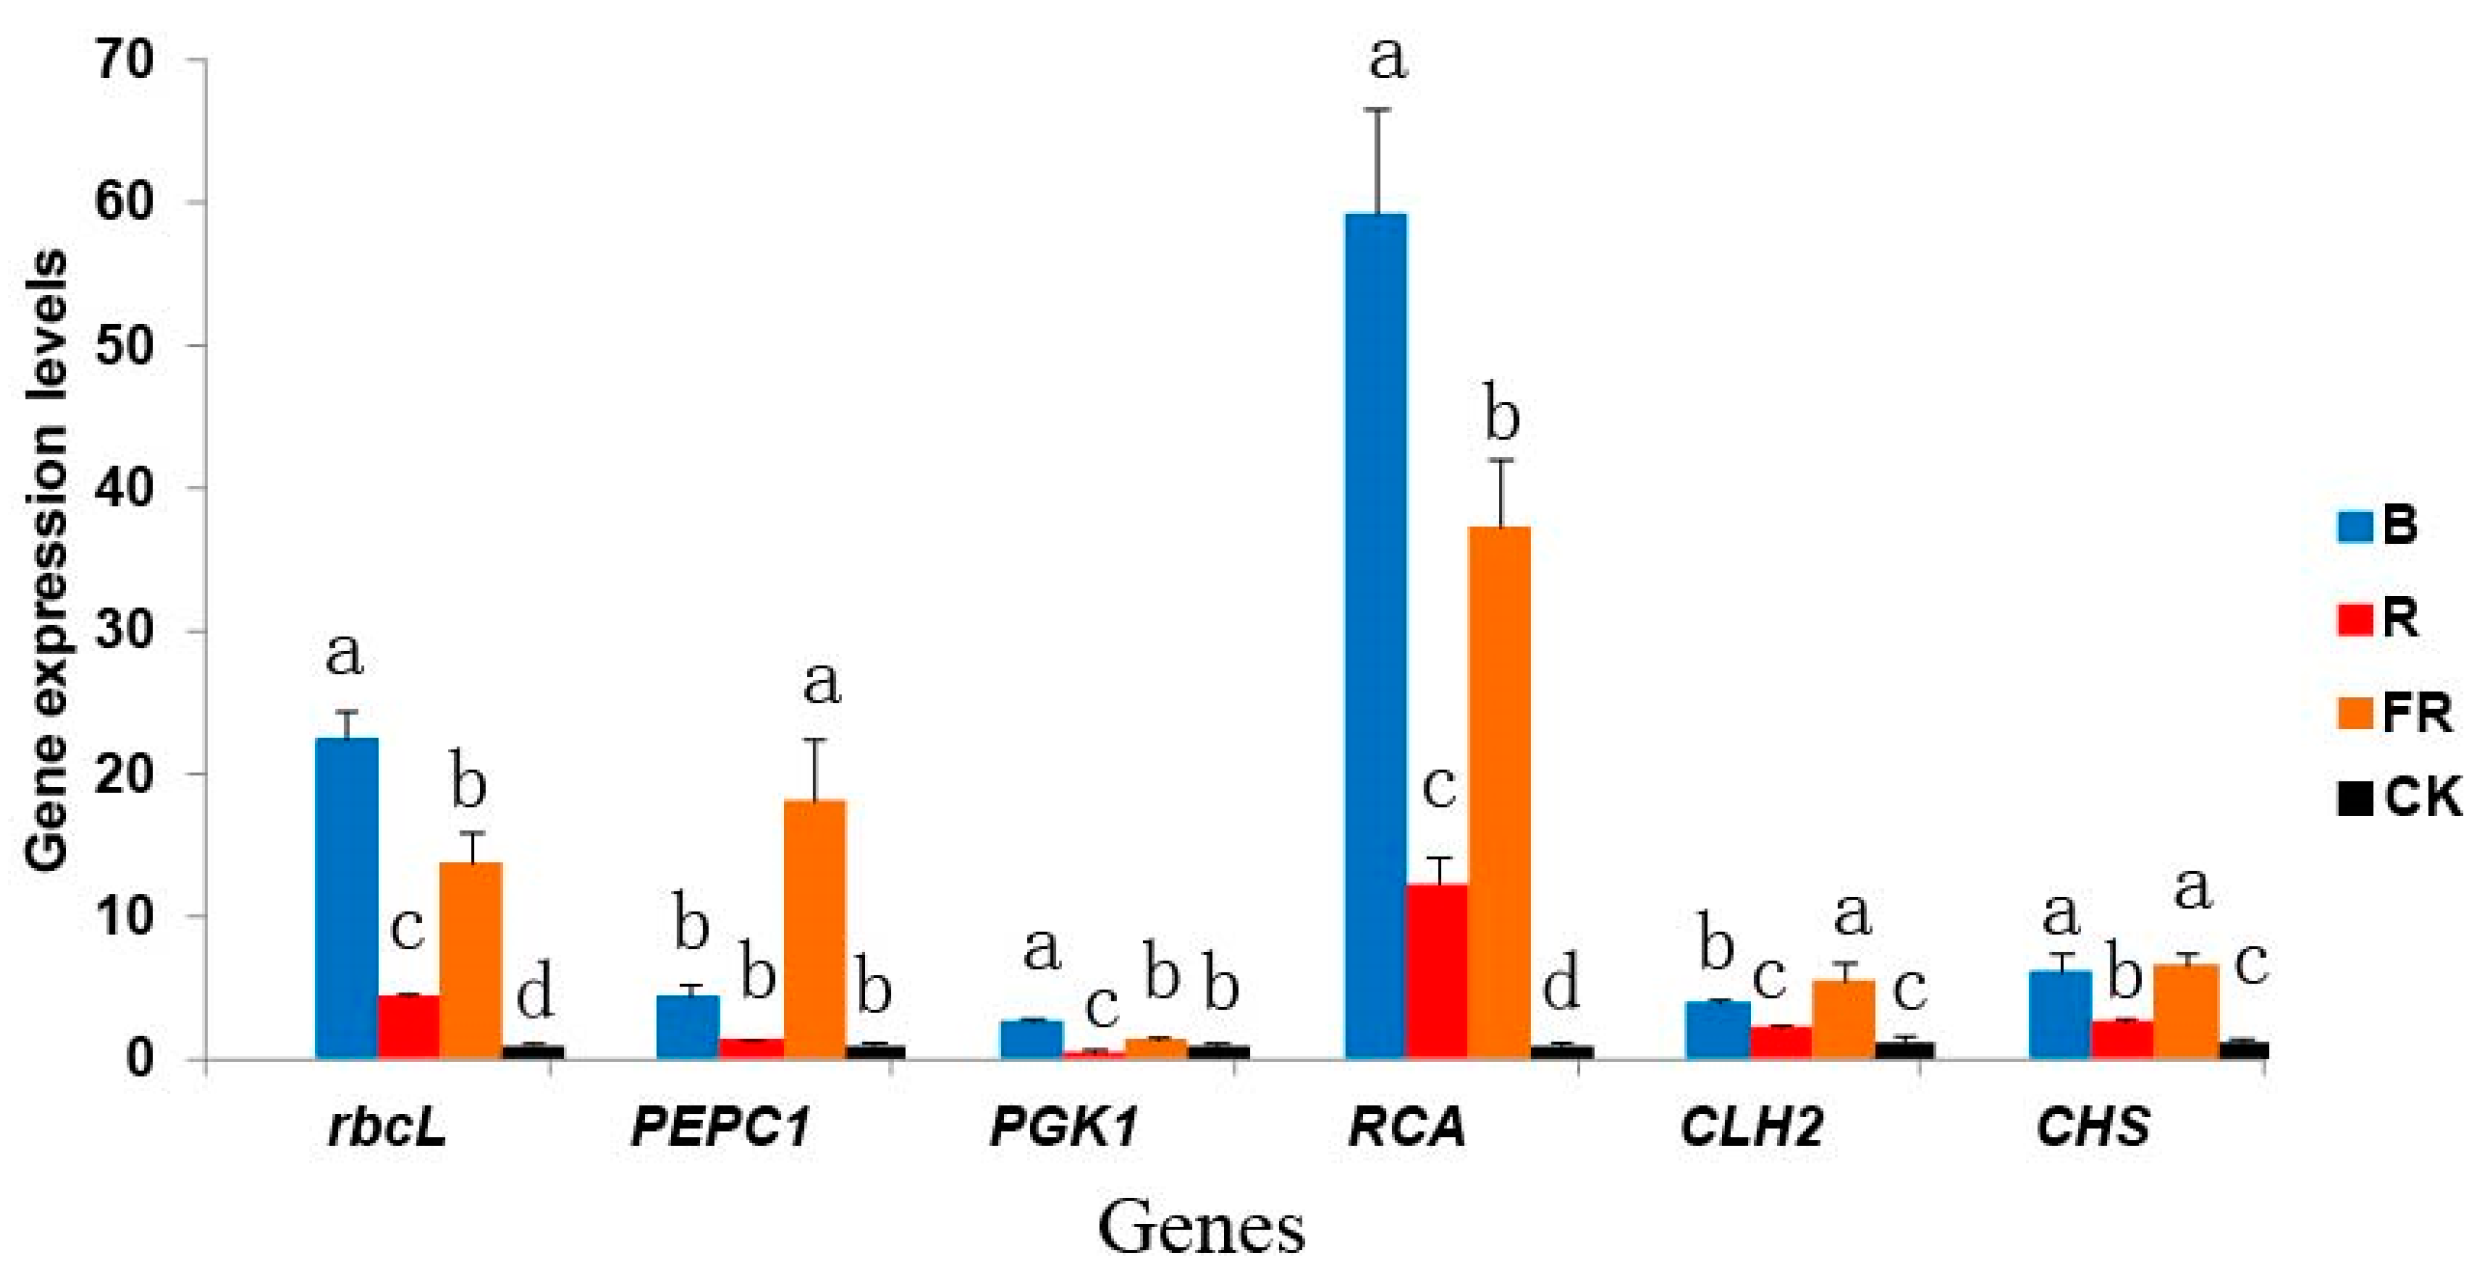
3.6. Effect of Light Quality on Photosynthesis-Related Gene Expression

Light quality significantly affected the expression of 12 photosynthesis-related genes (p < 0.01). Compared with the control, the expression levels of PHYA, PHYB and PHYC were all up-regulated in needles of Norway spruce treated with individual monochromatic lights. Specifically, the expression level of three genes in needles of Norway spruce seedlings treated with B and FR witnessed a noticeable upward trend, with 10–40 times that of the control, whereas those treated with R showed slightly increasing trend with 4–9 times that of the control (Figure 4). In addition, HY5, COP1-2, and PIF3 expression under B treatment was significantly higher than that under R and FR treatments, with 5–14 times that of the control. Although significant differences were not observed in the expression of COP1-2 and PIF3 between the R treatment and control, the expression level of COP1-2 was significantly lower compared with that in seedlings under FR treatment.
Compared to the control, the expression levels of photosynthesis-related genes were considerably higher in seedlings treated with FR and B, especially for Rubisco activase (RCA), with 37 and 59 times, respectively (Figure 5). In addition, the expression of PEPC1 and CLH2 in seedlings under the FR treatment was significantly higher than that under the B treatment. Whereas, the expression of ribulose-1,5-biphosphate carboxylase/oxygenase large subunit (rbcL), phosphoglycerate kinase-1 (PGK1), and RCA was significantly lower than that of seedlings under the B treatment. However, there was no significant difference in chalcone synthase (CHS) expression between these two treatments.
Significant differences were not observed in the expression of PEPC1 and chlorophyll 2 (CLH2) between seedlings treated with R and in the control (Figure 5). However, the other four genes showed considerably divergent expression patterns between seedlings under R treatment and in the control group. Only the expression PGK1 in seedlings treated with R was lower than the control, while the expression of CHS, rbcL, and RCA, was 3, 4, and 12 times higher in seedlings treated with R compared with the control, respectively.

4. Discussion

Norway spruce has strong morphological and physiological plasticity to heterogeneous light environments [46]. FR, R and a mixture of R and FR are all effective for maintaining Norway spruce growth [13]. In our study, supplemental monochromatic R after sunset showed great potential as a light source with the ability to drive plant photosynthesis and promote growth, while monochromatic FR and B might inhibit the growth of Norway spruce. Previous studies have shown that PSS influences plant physiology and morphology [7,47]. Red light presumably influences not only the photosynthesis but also growth traits, thus the supplemental R might influence the PSS in Norway spruce seedlings. There is a positive correlation between the R/FR ratio and the PSS (Pfr/Ptotal) levels [7,8,47]. According to this linear relationship, the PSS value of the complex light with the ratio of R:B:FR = 7:1:1 was roughly 0.82, while the PSS value of R and FR in the present study were 0.85 and 0.03, respectively. The maximum inhibition of hypocotyl growth in Lactuca sativa seedlings was achieved at PSS ≈ 0.06, which may be due to the far-red high irradiance responses that depend on phytochrome A (phyA). Regardless of increasing or decreasing of the PSS value, the inhibition ratios of hypocotyl growth were both decreased but at different rates [47]. As such, we speculated maybe the PSS of R in our study was the best light environment for Norway spruce growth among four light treatments. The crown of the spruce forest is dense and closed, thus the light below the canopy is weak, and the spruce forest is also called “dark coniferous forest”. The R/FR ratio below the plant canopy is greatly reduced, and the light intensity also decreases. Under full sunlight, the R/FR ratio value is generally up to 1.02, but below the canopy, the R/ FR ratio could be reduced to 0.2 [48]. So the PSS in a shaded place is lower than that above the plant canopy because most R is absorbed by plant leaves, and FR is easily transmitted below the plant canopy. It was observed that one to-one mixture of R and FR was more effective in maintaining Norway spruce growth than either FR or R alone [13], indicating a possible interaction between R and FR. In future studies, it may be necessary to consider the R/FR ratio and determine the best PSS for growth of Norway spruce seedlings.
The effects of R and FR on Norway spruce growth seem to vary with latitude. Those seedlings from southern populations (59° N) are more sensitive to R than those from northern populations, even at low levels of radiation (0.1 Wm−2) [8]. Studies have shown that FR is required for growth of Norway spruce [12,13], but seedlings originating from 62° N latitude grow normally under the exclusion of FR treatment [14]. The latitude of the test site (34° N) in the present study is lower than the latitude of Czech provenance (50° N) where the Norway spruce originated from. This suggested that the Norway spruce from Czech provenance may be more sensitive to R. In conclusion, R supplementation at night is effective for the growth of the Norway spruce seedlings in this study. Blue light inhibits the growth of the Norway spruce, which seems to be consistent with the previous study [13].
Regulation and response to environmental signals are coordinated between photosynthetic and carbon fixing systems in the plant. The light quality alters photosynthesis by affecting the activity of the photosynthetic apparatus in the leaves and expression and/or activity of the Calvin-Benson cycle enzymes [49]. Rubisco catalyzes the first step in net photosynthetic CO2 assimilation and photorespiratory carbon oxidation [50,51]. With very slow catalytic rate, Rubisco is the rate-limiting enzyme of photosynthesis [51]. Compared with seedlings in the control group and under the R treatment, higher Rubisco activity and expression levels of Calvin cycle-related genes, RCA, PGK1, and rbcL were observed in seedlings treated with B and FR light (Figure 5). However, expression level of PEPC and PEPC/Rubisco showed the opposite trend, which had been previously demonstrated in several studies [52,53]. The ratio of the two enzyme activities indicates the relative predominance of C3 compared with the C4 photosynthetic pathway. The PEPC/Rubisco ratio in C3 plants was approximately 0.1, while in C4 plants, this ratio was approximately 10 [44,45]. The PEPC/Rubisco ratio in seedlings under R was highest (0.581) and 3.98 times higher than that observed in seedlings under B treatment. The results of the present study indicated that when the photoperiod was extended with different light qualities, the PEPC/Rubisco ratio will be improved in Norway spruce. In addition, the effects of the R treatment will be superior to those of the B and FR treatments.
In addition to photosynthetic enzyme, chlorophyll is an important factor that affects photosynthesis. In the present study, the chlorophyll content per unit weight was significantly different among different light qualities. Seedlings treated with R light had the lowest chlorophyll content per unit weight (Figure 3), and CLH2 expression in seedlings under the R treatment was significantly lower than those under B and FR treatments (Figure 5). Red LEDs emit a narrow-spectrum of light (660 nm with 25 nm bandwidth at half-peak height), which closely matches the peak absorbance of chlorophyll [54]. Plants with lower chlorophyll content use chlorophyll more efficiently to strengthen stem elongation [49]. It has been demonstrated that shade-tolerant plants typically have a high chlorophyll content per unit weight [55]. CLH1 (At1 g19670) and CLH2 (At5 g43860) are homologous genes encoding chlorophyll enzymes in A. thaliana [48]. AtCLH2 might play a distinctive role in chlorophyll catabolism in vivo. The expression of AtCLH2 was inhibited by RNA interference (RNAi). RNA in plants shows decreased contents of chlorophyllide without a substantial change in the total amount of the extractable chlorophyll [56].
For maximum photosynthetic efficiency, plants can absorb different excitation energies to switch between PSI and PSII [57,58] which likely reflects the significant difference among the light qualities. When the donor side of PSII is reduced, the chlorophyll fluorescence yield increases after a short time (before the J point), and the K point (300 µs) is subsequently observed [59,60,61]. The emergence of the K point was associated with oxygen evolution complex (OEC) inactivation. The value of Wk in seedlings under FR treatment was significantly higher than those under the R and in the control group (Table 4), indicating that OEC activity was reduced. Thus, the ability of the donor side of PSII to supply electrons to the reaction centers was decreased. The efficiency of electron transfer from the PSII reaction center is associated with electron supply in the reaction center from the donor side of PSII as well as with the electron acceptor. The electron acceptor of PSII primarily includes QA and QB, the PQ library, etc. The ϕEo and ψO reflect changes in the receptor side of PSII. The value of Wk of seedlings under FR was higher than those under other light treatments for 1 and 9 h, while electron transport complex decreased on the receptor side of PSII, which led to a decrease in ψo and φEo. The VJ value reflects the quantity of QA reduction, namely QA accumulation. Seedlings under FR treatment had a significantly high VJ value. Thus, the electron transfer from QA to QB at the PSII receptor side was restricted, and the intensity of the J point was enhanced (Table 4). These findings suggest that R promotes and FR inhibits the electron transfer in PSII. Thus, FR might primarily decrease PSII photochemical activity and inhibit electron transfer, resulting in a decline in photosynthetic capacity.
The light quality also influences endogenous hormones and secondary metabolites [27]. GAs play an important role in promoting growth. Seedlings treated with R light showed the highest level of GAs, while those treated with B light showed the lower GAs level (Figure 3, [27]), which may be the reason for inhibiting growth by B light. The expression levels of PHY, HY5, COP1-2 and PIF3 were significantly increased in seedlings treated with B light compared with those exposed to other light treatments (Figure 4). The transcription factors, PIFs, interact directly with endogenous hormones and function mainly as repressors of photomorphogenesis [31]. It has been reported that PIF expression increased in poplar trees under short day conditions [62], which stimulated the expression of DELLA inhibitors and reduced the sensitivity of GAs and terminated plant bud setting and growth. Similarly, DELLA and PIF3, involved in negative GAs signaling, are also upregulated under B light treatment. Thus, the significantly higher expression of PIF3 in seedlings under B and FR light treatments may be associated with significantly lower growth in height (Figure 1). CHS is a flavonoid biosynthesis enzyme with inhibitory effects on Pn [63]. CHS expression was significantly higher in seedlings treated with B light compared with those exposed to other light treatments, which might explain the lowest Pn in seedlings exposed to B light treatment (Figure 3). Previous studies have shown that B light promotes the biosynthesis of flavonoids and other secondary metabolites [28,64] and reduces the primary metabolites of plant growth [27].

5. Conclusions

Our results demonstrate that light quality significantly affect Norway spruce growth. Compared with the control, R light promotes, whereas B and FR light inhibit Norway spruce growth, which are accompanied by corresponding changes in photosynthetic physiology and genes expression regulation. The supplemental R light at night might alter the PSS, which in turn influences Norway spruce physiology and morphology. Seedlings treated with R light showed the highest values of GAs level, Pn and PEPC/Rubisco ratio, which might explain why these seedlings had higher growth increments. FR and B light might inhibit the growth of Norway spruce since they resulted in lower Pn compared with the control. In addition, FR and B light treatments primarily inhibited photosynthetic electron transport with higher values of VJ and Wk. In addition, light quality influenced the expression levels of the genes associated with light signal components and photosynthesis. The effects of the supplemental light on the growth also depends on the latitude of the habitat where Norway spruce grows.

Author Contributions

Conceptualization, F.O. and J.W.; formal analysis, F.O., Y.O., T.Z., J.M., S.A., L.K. and H.Z.; data analysis, F.O.; writing—original draft preparation, F.O.; writing—review and editing, M.T. supervision, J.W.; funding acquisition, F.O., J.W. All authors have read and agreed to the published version of the manuscript.

Funding

This research was funded by National Natural Science Foundation of China (NSFC 31600541), the Thirteenth Five-Year Plan for Key & Research Project of China (2017YFD0600606-09), the Central Finance Promotion Program of China, Cutting breeding and afforestation of Picea smithiana and Picea abies, the National Promotion Projects of Forestry and Grassland Scientific and Technological Achievements, Demonstration of elite Norway spruce clones industrialization (2020133110).

Data Availability Statement

Not applicable.

Acknowledgments

We thank the editor and the reviewers for comments and suggestions, and Jian-Feng Mao (Beijing Forestry University) and Qingzhu Zhang (Northeast Forestry University) for critically reading the manuscript. We apologize to colleagues whose work could not be cited due to space limitations.

Conflicts of Interest

The authors declare no conflict of interest.

References

  1. Olsen, J.E.; Junttila, O. Far red end-of-day treatment restores wild type-like plant length in hybrid aspen overexpressing phytochrome A. Physiol. Plant 2002, 115, 448–457. [Google Scholar] [CrossRef] [PubMed]
  2. Quail, P.H. Photosensory perception and signaling in plant cells: New paradigms? Curr. Opin. Cell Biol. 2002, 14, 180–188. [Google Scholar] [CrossRef]
  3. Kong, S.-G.; Okajima, K. Diverse photoreceptors and light responses in plants. J. Plant Res. 2016, 129, 111–114. [Google Scholar] [CrossRef] [PubMed] [Green Version]
  4. Franklin, K.A.; Whitelam, G.C. Phytochromes and Shade-avoidance Responses in Plants. Ann. Bot. 2005, 96, 169–175. [Google Scholar] [CrossRef] [PubMed] [Green Version]
  5. Smith, H. Phytochromes and light signal perception by plants—An emerging synthesis. Nat. Cell Biol. 2000, 407, 585–591. [Google Scholar] [CrossRef] [PubMed]
  6. Runkle, E.S.; Heins, R.D. Photocontrol of flowering and extension growth in the long-day plant pansy. J. Amer. Soc. Hort. Sci. 2003, 128, 479–485. [Google Scholar] [CrossRef]
  7. Bae, J.-H.; Park, S.-Y.; Oh, M.-M. Supplemental irradiation with far-red light-emitting diodes improves growth and phenolic contents in Crepidiastrum denticulatum in a plant factory with artificial lighting. Hortic. Environ. Biotechnol. 2017, 58, 357–366. [Google Scholar] [CrossRef]
  8. Bae, J.-H.; Park, S.-Y.; Oh, M.-M. Growth and phenolic compounds of Crepidiastrum denticulatum under various blue light intensities with a fixed phytochrome photostationary state using far-red light. Hortic. Environ. Biotechnol. 2019, 60, 199–206. [Google Scholar] [CrossRef]
  9. Fan, X.; Zang, J.; Xu, Z.; Guo, S.; Jiao, X.; Liu, X.; Gao, Y. Effects of different light quality on growth, chlorophyll concentration and chlorophyll biosynthesis precursors of non-heading Chinese cabbage (Brassica campestris L.). Acta Physiol. Plant 2013, 35, 2721–2726. [Google Scholar] [CrossRef]
  10. Håbjørg, A. Effects of light quality, light intensity and night temperature on growth and development of three latitudinal populations of Betula pubescens Ehrh. Nor. Landbr. Meld 1972, 51, 1–7. [Google Scholar]
  11. Clapham, D.H.; Dormling, I.; Ekberg, L.; Eriksson, G.; Qamaruddin, M.; Vince-Prue, D. Latitudinal cline of requirement for far-red light for the photoperiodic control of budset and extension growth in Picea abies (Norway spruce). Physiol. Plant 1998, 102, 71–78. [Google Scholar] [CrossRef]
  12. Clapham, D.H.; Ekberg, I.; Eriksson, G.; Norell, L.; Vince-Prue, D. Requirement for far-red light to maintain secondary needle extension growth in northern but not southern populations of Pinus sylvestris (Scots pine). Physiol. Plant 2002, 114, 207–212. [Google Scholar] [CrossRef] [PubMed]
  13. Molmann, J.A.; Junttila, O.; Johnsen, O.; Olsen, J.E. Effects of red, far-red and blue light in maintaining growth in latitudinal populations of Norway spruce (Picea abies). Plant Cell Environ. 2005, 29, 166–172. [Google Scholar] [CrossRef] [PubMed]
  14. Riikonen, J.; Kettunen, N.; Gritsevich, M.; Hakala, T.; Särkkä, L.; Tahvonen, R. Growth and development of Norway spruce and Scots pine seedlings under different light spectra. Environ. Exp. Bot. 2016, 121, 112–120. [Google Scholar] [CrossRef]
  15. Fløistad, I.S.; Patil, G.G. Growth and Terminal Bud Formation in Picea abies Seedlings Grown with Alternating Diurnal Temperature and Different Light Qualities. Scand. J. For. Res. 2002, 17, 15–27. [Google Scholar] [CrossRef]
  16. Sellin, A.; Sack, L.; Õunapuu-Pikas, E.; Karusion, A. Impact of light quality on leaf and shoot hydraulic properties: A case study in silver birch (Betula pendula). Plant. Cell Environ. 2011, 34, 1079–1087. [Google Scholar] [CrossRef]
  17. Fernbach, E.; Mohr, H. Coaction of blue/ultraviolet-A light and light absorbed by phytochrome in controlling growth of pine (Pinus sylestris L.) seedlings. Planta 1990, 180, 212–216. [Google Scholar] [CrossRef]
  18. Szymańska, R.; Nowicka, B.; Gabruk, M.; Glińska, S.; Michlewska, S.; Dlużwska, J.; Sawicka, A.; Kruk, J.; Laitinen, R. Physiological and antioxidant responses of two accessions of Arabidopsis thaliana in different light and temperature conditions. Physiol. Plant 2015, 154, 194–209. [Google Scholar] [CrossRef]
  19. Kim, J.H.; Glick, R.E.; Melis, A. Dynamics of Photosystem Stoichiometry Adjustment by Light Quality in Chloroplasts. Plant Physiol. 1993, 102, 181–190. [Google Scholar] [CrossRef] [Green Version]
  20. Krekling, T.; Appelgren, M. Light quality affects photosynthesis and leaf anatomy of birch plantlets in vitro. Plant Cell Tissue Organ Cult. (PCTOC) 1995, 41, 177–185. [Google Scholar] [CrossRef]
  21. Grams, T.E.E.; Thiel, S. High light-induced switch from C3-photosynthesis to Crassulacean acid metabolism is mediated by UV-A/blue light. J. Exp. Bot. 2002, 53, 1475–1483. [Google Scholar] [CrossRef] [PubMed]
  22. Shimazaki, K.-I.; Doi, M.; Assmann, S.M.; Kinoshita, T. Light Regulation of Stomatal Movement. Annu. Rev. Plant Biol. 2007, 58, 219–247. [Google Scholar] [CrossRef] [PubMed] [Green Version]
  23. Kasperbauer, M.J.; Hamilton, J.L. Chloroplast Structure and Starch Grain Accumulation in Leaves That Received Different Red and Far-Red Levels during Development. Plant Physiol. 1984, 74, 967–970. [Google Scholar] [CrossRef] [PubMed] [Green Version]
  24. Tsinoremas, N.; Schaefer, M.; Golden, S. Blue and red light reversibly control psbA expression in the cyanobacterium Synechococcus sp. strain PCC 7942. J. Biol. Chem. 1994, 269, 16143–16147. [Google Scholar] [CrossRef]
  25. Allen, J.F. Thylakoid protein phosphorylation, state 1-state 2 transitions, and photosystem stoichiometry adjustment: Redox control at multiple levels of gene expression. Physiol. Plant 1995, 93, 196–205. [Google Scholar] [CrossRef]
  26. El Bissati, K.; Kirilovsky, D. Regulation of psbA and psaE Expression by Light Quality in Synechocystis Species PCC 6803. A Redox Control Mechanism. Plant Physiol. 2001, 125, 1988–2000. [Google Scholar] [CrossRef] [Green Version]
  27. Ouyang, F.; Mao, J.-F.; Wang, J.; Zhang, S.; Li, Y. Transcriptome Analysis Reveals that Red and Blue Light Regulate Growth and Phytohormone Metabolism in Norway Spruce [Picea abies (L.) Karst.]. PLoS ONE 2015, 10, e0127896. [Google Scholar] [CrossRef] [Green Version]
  28. Deng, Y.; Yao, J.; Wang, X.; Guo, H.; Duan, D. Transcriptome Sequencing and Comparative Analysis of Saccharina japonica (Laminariales, Phaeophyceae) under Blue Light Induction. PLoS ONE 2012, 7, e39704. [Google Scholar] [CrossRef]
  29. Siipola, S.M.; Kotilainen, T.; Sipari, N.; Morales, L.O.; Lindfors, A.V.; Robson, T.M.; Aphalo, P.J. Epidermal UV-A absorbance and whole-leaf flavonoid composition in pea respond more to solar blue light than to solar UV radiation. Plant Cell Environ. 2015, 38, 941–952. [Google Scholar] [CrossRef]
  30. Lau, O.S.; Deng, X.W. Plant hormone signaling lightens up: Integrators of light and hormones. Curr. Opin. Plant Biol. 2010, 13, 571–577. [Google Scholar] [CrossRef]
  31. Jiao, Y.; Lau, O.S.; Deng, X.W. Light-regulated transcriptional networks in higher plants. Nat. Rev. Genet. 2007, 8, 217–230. [Google Scholar] [CrossRef] [PubMed]
  32. Soy, J.; Leivar, P.; Monte, E. PIF1 promotes phytochrome-regulated growth under photoperiodic conditions in Arabidopsis together with PIF3, PIF4, and PIF5. J. Exp. Bot. 2014, 65, 2925–2936. [Google Scholar] [CrossRef] [PubMed] [Green Version]
  33. Zhang, Z.; Ji, R.; Li, H.; Zhao, T.; Liu, J.; Lin, C.; Liu, B. Constans-like 7 (COL7) is involved in phytochrome B (phyB)-mediated light-quality regulation of auxin homeostasis. Mol. Plant 2014, 7, 1429–1440. [Google Scholar] [CrossRef] [PubMed] [Green Version]
  34. Kouril, R.; Wientjes, E.; Bultema, J.B.; Croce, R.; Boekema, E.J. High-light vs. low-light: Effect of light acclimation on photosystem II composition and organization in Arabidopsis thaliana. Biochim. et Biophys. Acta (BBA) Gen. Subj. 2013, 1827, 411–419. [Google Scholar] [CrossRef] [PubMed] [Green Version]
  35. Beel, B.; Prager, K.; Spexard, M.; Sasso, S.; Weiss, D.; Müller, N.; Heinnickel, M.; Dewez, D.; Ikoma, D.; Grossman, A.R.; et al. A flavin binding Cryptochrome photoreceptor responds to both blue and red light in Chlamydomonas reinhardtii. Plant Cell 2012, 24, 2992–3008. [Google Scholar] [CrossRef] [PubMed] [Green Version]
  36. Wang, W.J.; Wang, F.-J.; Sun, X.-T.; Liu, F.-L.; Liang, Z.-R. Comparison of transcriptome under red and blue light culture of Saccharina japonica (Phaeophyceae). Planta 2013, 237, 1123–1133. [Google Scholar] [CrossRef]
  37. Lu, N.; Maruo, T.; Johkan, M.; Hohjo, M.; Tsukagoshi, S.; Ito, Y.; Ichimura, T.; Shinohara, Y. Effects of Supplemental Lighting with Light-Emitting Diodes (LEDs) on Tomato Yield and Quality of Single-Truss Tomato Plants Grown at High Planting Density. Environ. Control. Biol. 2012, 50, 63–74. [Google Scholar] [CrossRef] [Green Version]
  38. Yu, S.-M.; Ramkumar, G.; Lee, Y. Light quality influences the virulence and physiological responses of Colletotrichum acutatum causing anthracnose in pepper plants. J. Appl. Microbiol. 2013, 115, 509–516. [Google Scholar] [CrossRef]
  39. Razzak, A.; Ranade, S.S.; Strand, Å.; García-Gil, M.R. Differential response of Scots pine seedlings to variable intensity and ratio of red and far-red light. Plant Cell Environ. 2017, 40, 1332–1340. [Google Scholar] [CrossRef]
  40. Ouyang, F.; Ma, J.; Wang, J.; Kong, L.; Zhang, H.; Tigabu, M.; Wang, J. Picea species from humid continental and temperate marine climates perform better in monsoonal areas of middle latitudes of China. J. Forestry Res. 2020. [Google Scholar] [CrossRef]
  41. Yang, Y.-M.; Xu, C.-N.; Wang, B.-M.; Jia, J.-Z. Effects of plant growth regulators on secondary wall thickening of cotton fibres. Plant Growth Regul. 2001, 35, 233–237. [Google Scholar]
  42. Porra, R.J. The chequered history of the development and use of simultaneous equations for the accurate determination of chlorophylls a and b. In Plant Cell Monographs; Springer: Berlin/Heidelberg, Germany, 2006; Volume 20, pp. 633–640. [Google Scholar]
  43. Sangwan, R.S.; Singh, N.; Plaxton, W.C. Phosphoenolpyruvate Carboxylase Activity and Concentration in the Endosperm of Developing and Germinating Castor Oil Seeds. Plant Physiol. 1992, 99, 445–449. [Google Scholar] [CrossRef] [PubMed] [Green Version]
  44. Jia, Y.-J.; Cheng, D.-D.; Wang, W.-B.; Gao, H.-Y.; Liu, A.-X.; Li, X.-M.; Meng, Q.-W. Different enhancement of senescence induced by metabolic products of Alternaria alternata in tobacco leaves of different ages. Physiol. Plant. 2010, 138, 164–175. [Google Scholar] [CrossRef] [PubMed]
  45. SAS Institute Inc. SAS/STAT User’s Guide; SAS Institute Inc.: Cary, NY, USA, 2012. [Google Scholar]
  46. Grassi, G.; Bagnaresi, U. Foliar morphological and physiological plasticity in Picea abies and Abies alba saplings along a natural light gradient. Tree Physiol. 2001, 21, 959–967. [Google Scholar] [CrossRef] [PubMed] [Green Version]
  47. Possart, A.; Fleck, C.; Hiltbrunner, A. Shedding (far-red) light on phytochrome mechanisms and responses in land plants. Plant Sci. 2014, 217, 36–46. [Google Scholar] [CrossRef] [PubMed]
  48. Silvertown, J.; Fenner, M. Seeds: The Ecology of Regeneration in Plant Communities. J. Ecol. 1993, 81, 384. [Google Scholar] [CrossRef]
  49. Wang, H.; Gu, M.; Cui, J.; Shi, K.; Zhou, Y.; Yu, J. Effects of light quality on CO2 assimilation, chlorophyll-fluorescence quenching, expression of Calvin cycle genes and carbohydrate accumulation in Cucumis sativus. J. Photochem. Photobiol. B Biol. 2009, 96, 30–37. [Google Scholar] [CrossRef] [PubMed]
  50. Lin, M.T.; Occhialini, A.; Andralojc, P.J.; Parry, M.A.J.; Hanson, M.R. A faster Rubisco with potential to increase photosynthesis in crops. Nat. Cell Biol. 2014, 513, 547–550. [Google Scholar] [CrossRef]
  51. Wang, F.; Zhang, L.; Chen, X.; Wu, X.; Xiang, X.; Zhou, J.; Xia, X.; Shi, K.; Yu, J.; Foyer, C.H.; et al. SlHY5 integrates temperature, light and hormone signaling to balance plant growth and cold tolerance. Plant Physiol. 2019, 179, 749–760. [Google Scholar] [CrossRef] [Green Version]
  52. Fontaine, V.; Pelloux, J.; Podor, M.; Afif, D.; Gerant, D.; Grieu, P.; Dizengremel, P. Carbon fixation in Pinus halepensis submitted to ozone. Opposite response of ribulose-1, 5-bisphosphate carboxylase/oxygenase and phosphoenolpyruvate carboxylase. Physiol. Plantarm 1999, 105, 187–192. [Google Scholar] [CrossRef]
  53. Berveiller, D.; Damesin, C. Carbon assimilation by tree stems: Potential involvement of phosphoenolpyruvate carboxylase. Trees 2007, 22, 149–157. [Google Scholar] [CrossRef]
  54. McCree, K. The action spectrum, absorptance and quantum yield of photosynthesis in crop plants. Agric. Meteorol. 1971, 9, 191–216. [Google Scholar] [CrossRef]
  55. Boardman, N.K. Comparative Photosynthesis of Sun and Shade Plants. Annu. Rev. Plant Physiol. 1977, 28, 355–377. [Google Scholar] [CrossRef]
  56. Tsuchiya, T.; Ohta, H.; Okawa, K.; Iwamatsu, A.; Shimada, H.; Masuda, T.; Takamiya, K.-I. Cloning of chlorophyllase, the key enzyme in chlorophyll degradation: Finding of a lipase motif and the induction by methyl jasmonate. Proc. Natl. Acad. Sci. USA 1999, 96, 15362–15367. [Google Scholar] [CrossRef] [PubMed] [Green Version]
  57. Nugent, J.H.A. Oxygenic Photosynthesis. Electron Transfer in Photosystem I and Photosystem II. JBIC J. Biol. Inorg. Chem. 1996, 237, 519–531. [Google Scholar] [CrossRef] [PubMed]
  58. Pakrasi, H.B. Genetic analysis of the form and function of photosystem I and photosystem II. Annu. Rev. Genet. 1995, 29, 755–776. [Google Scholar] [CrossRef]
  59. Strasser, B.J. Donor side capacity of Photosystem II probed by chlorophyll a fluorescence transients. Photosynth. Res. 1997, 52, 147–155. [Google Scholar] [CrossRef]
  60. De Ronde, J.; Cress, W.; Krüger, G.; Strasser, R.J.; Van Staden, J. Photosynthetic response of transgenic soybean plants, containing an Arabidopsis P5CR gene, during heat and drought stress. J. Plant Physiol. 2004, 161, 1211–1224. [Google Scholar] [CrossRef]
  61. Tóth, S.Z.; Schansker, G.; Kissimon, J.; Kovács, L.; Garab, G.; Strasser, R.J. Biophysical studies of photosystem II-related recovery processes after a heat pulse in barley seedlings (Hordeum vulgare L.). J. Plant Physiol. 2005, 162, 181–194. [Google Scholar] [CrossRef]
  62. Ruttink, T.; Arend, M.; Morreel, K.; Storme, V.; Rombauts, S.; Fromm, J.; Bhalerao, R.P.; Boerjan, W.; Rohde, A. A molecular timetable for apical bud formation and dormancy induction in Poplar. Plant Cell 2007, 19, 2370–2390. [Google Scholar] [CrossRef] [Green Version]
  63. Müller-Xing, R.; Xing, Q.; Goodrich, J. Footprints of the sun: Memory of UV and light stress in plants. Front. Plant Sci. 2014, 5, 1–12. [Google Scholar] [CrossRef] [Green Version]
  64. Son, K.-H.; Oh, M.-M. Leaf shape, growth, and antioxidant phenolic compounds of two lettuce cultivars grown under various combinations of blue and red light-emitting diodes. HortScience 2013, 48, 988–995. [Google Scholar] [CrossRef]
Figure 1. Multiple comparisons of stem height (A), ground diameter (B), current-year shoot length (C), leaf area (D), leaf dry weight (E) and the leaf area/leaf weight ratio (SLA) (F) of seedlings treated with blue (B), red (R), far-red (FR) and combinations of B, R and FR lights (CK). Lowercase letters, a, b, represent Duncan group.
Forests 12 00164 g001
Figure 2. Multiple comparisons of GAs (A), IAA (B), ZR (C), and ABA (D) levels of seedlings treated with blue (B), red (R), far-red (FR) and a combination of B, R and FR lights (CK). Lowercase letters, a, b, represent Duncan group.
Forests 12 00164 g002
Figure 3. Multiple comparisons of chlorophyll content (A), chlorophyll to fresh weight ratio (B), photosynthetic enzyme (CE), and gas exchange parameters (FI) of seedlings treated with blue (B), red (R), far-red light (FR), and a combination of B, R and FR lights (CK). Lowercase letters, a, b, represent Duncan group.Light quality significantly affected the photosynthetic parameters (Table 2), and the highest Pn (10.56 μmol CO2 m−2 s−1 ), Tr (7.04 µmol H2O m2 s1), Gs (0.27 mol H2O m−2 s−1) and Ci (306.48 µmol CO2 mol−1) were observed in seedlings treated with R (Figure 3F-I), which were 10%, 80%, 17%, and 57%, respectively higher than those of the control. However, Pn, Tr, Gs, and Ci were all lower for seedlings treated with FR and B than those of the control.
Forests 12 00164 g003
Figure 4. The expression levels of light signal transduction genes in the needles of Norway spruce seedlings that were grown under four different light spectra: blue (B), red (R), far-red light (FR) and a combination of B, R and FR lights (CK).
Forests 12 00164 g004
Figure 5. The expression levels of the photosynthesis-related genes in the needles of Norway spruce seedlings that were grown under four different light spectra: blue (B), red (R), far-red light (FR), and a combination of B, R and FR lights (CK).
Forests 12 00164 g005
Table 1. The primer sequences of photosynthesis-related genes.
Gene Mane Gene IdPrimer F (5’–3’)Primer R (5’–3’)
rbclMA_103636g0010CCACTTTAGGGTTTGTTGATCTACCTCGGTCAGAGCAGGCATA
PEPC1MA_176143g0010CGGGATGATGAATTGACAGCAGATGCCATTAGTGCCACAGGTGTAAGGTT
PGK1MA_92421g0010AAGCCGTGTCATCGTCGTCTACTAGCCGAATACGAACCTGGACTTGA
RCAMA_10433855g0010CGGAGAACTGGAGAGTGGAGATGCACGAGGATTGTCTTGCTTGTTGT
CLH2MA_5475932g0010GCAGCAGCGTGAGGAGATATGGGAAGCGATGTGTTGGAGAAGTT
CHSMA_10426264g0020GGCATTCAGGAAGGCTCAGAGAGGCACCTCCACCACAACCAT
phyAMA_6809p0010GCAGCAGCGTTCCATCTGAGACCACCACCAACAACATCCAGCATCT
phyBMA_6809g0020CAGCAGCCGCAGAACAGAAGGAAGCATATCGCAGAGCACAGTT
phyCMA_6809g0030GCATGACTCGGTTGGAATCGTGAAGCCCTGTAATCGCCTTGAAGATGAG
HY5MA_41006g0010ATGCGTGAACGAGAGTGATGATGATGTTCTGCCTCTTCTCCTCTGACTG
COP1-2MA_10433141g0010TCACGCACAGAGCCGACCATGCTGAACCAACCGCAACATAGTT
PIF3MA_29186g0010ACTGGTGTTGGTCTTGGTATGGGACTGATGTTGGCAAGCAATGTAT
actin GTGCCTGCTATGTATGTTGCCATTCGCTTCTCCTTCACATCACGGACAAT
Table 2. Summary of ANOVA results comparing Norway spruce morphological and physiological parameters among the four light treatments.
TraitsLight QualityErrorTraitsLight QualityError
Stem height90.85 **34.47Chlorophyll0.01 **0.04
Root collar diameter9.19 *1.08Chlorophyll/fresh weight18.61 *8.71
Current-year shoot length57.94 **8.45Pn11.46 **2.38
Leaf area0.92 *0.23Gs0.02 **0.09 × 10⁻²
Leaf dry weight13.25 × 10−4 *1.32 × 10−4Ci5555.20 **265.27
SLA11.91 × 10−6 *4.64 × 10−6Tr13.24 **0.44
GAs6.36 **0.10Rubisco1.46 × 10−4 *0.43 × 10−4
IAA26523 **109PEPC7.91 *2.34
ZR0.93 **0.11PEPC/Rubisco0.11 **0.02
ABA3030 **46.93
Note: ** Statistically significant at the 0.05 level; * statistically significant at the 0.01 level.
Table 3. Summary of ANOVA results comparing chlorophyll a fluorescence parameters of Norway spruce seedlings exposed to four light treatments.
Chlorophyll a Fluorescence ParametersLighting 1 hLighting 3 hLighting 9 h
Light QualityErrorLight QualityErrorLight QualityError
Vj8.06 × 10−3 *2.95 × 10−33.63 × 10−3 *1.47 × 10−39.97 × 10−3 **2.37 × 10⁻³
WK2.71 × 10−34.01 × 10−321.17 × 10⁻³ **2.93 × 10−37.83 × 10−3 *3.61 × 10−3
Fv/Fm0.32 × 10−3 **0.11 × 10−30.48 × 10−3 **0.15 × 10−30.16 × 10−3 *0.07 × 10−3
ψo8.07 × 10−3 *2.95 × 10−33.63 × 10−3 *1.47 × 10−39.97 × 10−3 **2.37 × 10⁻³
φEo4.79 × 10−3 *2.07 × 10−33.02 × 10−3 *1.18 × 10−36.69 × 10−3 **1.62 × 10⁻³
Note: ** Statistically significant at the 0.05 level; * statistically significant at the 0.01 level. Vj, the relative variable fluorescence at J time (Vj), Vj = (Fj − Fo)/(Fm − Fo); Wk, the normalized relative variable fluorescence at the K-th step, Wk = (Fk − Fo)/(FJ − Fo); Fv/Fm = (Fm − Fo)/Fo; ψo, the efficiency that a trapped exciton moves an electron into electron transport chain beyond QA; ϕEo, the quantum yield of electron transport beyond QA (primary quinone).
Table 4. Mean values (standard deviation) of Norway spruce chlorophyll a fluorescence parameters among four light treatment: blue (B), red (R), far-red (FR), and a combination of B, R and FR (CK).
Hour Light QualityVjWKFv/Fm (φPo)ψOφEo
1B0.47 (0.05) ab0.41 (0.07) a0.8332 (0.01) b0.52 (0.05) ab0.44 (0.04) ab
R0.45 (0.03) b0.39 (0.05) a0.8350 (0.01) b0.57 (0.02) a0.47 (0.03) a
FR0.48 (0.02) a0.42 (0.05) a0.8426 (0.01) a0.52 (0.02) b0.43 (0.02) b
CK0.45 (0.06) b0.40 (0.06) a0.8344 (0.01) b0.55 (0.06) ab0.45 (0.04) ab
3B0.51 (0.03) a0.44 (0.04) a0.8339 (0.01) b0.48 (0.03) b0.40 (0.03) b
R0.48 (0.04) b0.37 (0.03) b0.8446 (0.01) a0.51 (0.03) a0.43 (0.03) a
FR0.51 (0.04) a0.43 (0.05) a0.8409 (0.01) ab0.48 (0.04) b0.40 (0.03) b
CK0.49 (0.04) ab0.37 (0.06) b0.8328 (0.01) b0.50 (0.03) ab0.41 (0.03) ab
9B0.48 (0.05) ab0.38 (0.05) ab0.8369 (0.01) ab0.52 (0.05) ab0.44 (0.04) ab
R0.45 (0.03) b0.36 (0.04) b0.8378 (0.01) ab0.55 (0.03) a0.46 (0.03) a
FR0.51 (0.03) a0.42 (0.06) a0.8432 (0.01) a0.49 (0.03) b0.41 (0.03) b
CK0.51 (0.05) a0.38 (0.07) ab0.8362 (0.01) b0.49 (0.05) b0.41 (0.04) b
Note: The values with different superscripts in each row indicate significant differences among the treatments (p ≤ 0.05).
Publisher’s Note: MDPI stays neutral with regard to jurisdictional claims in published maps and institutional affiliations.

