
A Novel Approach to Evaluate the Effect of Neighboring Trees and the Orientation of Tree Social Area on Stem Radial Increment of Norway Spruce Trees


Abstract
- Highlights
- Tree size is an important indicator of relative radial increment.
- Tree social area is a better parameter than spatially-available area for estimating tree growth.
- The shape and orientation of tree social area play a significant role in tree growth dynamics.
- Trees with the lowest competition from the west showed the highest relative radial increment.
1. Introduction
2. Materials and Methods
2.1. Study Sites
2.2. Field Measurements
2.3. 5-Year Radial Increment at DBH
2.4. Tree Social and Spatially-Available Area
2.5. Tree Size Groups
2.6. The Orientation of Tree Social Area and Data Analysis
3. Results
3.1. Tree Social and Spatially-Available Area
3.2. The Orientation of the Tree Social Area Extremes
4. Discussion
5. Conclusions
Author Contributions
Funding
Data Availability Statement
Acknowledgments
Conflicts of Interest
Appendix A

| Tree Grouping According to Irregularity of AS | Social Status of Tree | Description | Link to Results (Figure 7) |
|---|---|---|---|
| Band 1 (approach 1) | dominant | evaluation of the growth according to direction of the highest competition | 1S |
| evaluation of the growth according to direction of the lowest competition | 1L | ||
| co-dominant | evaluation of the growth according to direction of the highest competition | 1S | |
| evaluation of the growth according to direction of the lowest competition | 1L | ||
| sub-dominant | evaluation of the growth according to direction of the highest competition | 1S | |
| evaluation of the growth according to direction of the lowest competition | 1L | ||
| Band 2 (approach 2) | dominant | evaluation of the growth according to direction of the highest competition | 2S |
| evaluation of the growth according to direction of the lowest competition | 2L | ||
| co-dominant | evaluation of the growth according to direction of the highest competition | 2S | |
| evaluation of the growth according to direction of the lowest competition | 2L | ||
| sub-dominant | evaluation of the growth according to direction of the highest competition | 2S | |
| evaluation of the growth according to direction of the lowest competition | 2L | ||
| Band 3 (approach 3) | dominant | evaluation of the growth according to direction of the highest competition | 3S |
| evaluation of the growth according to direction of the lowest competition | 3L | ||
| co-dominant | evaluation of the growth according to direction of the highest competition | 3S | |
| evaluation of the growth according to direction of the lowest competition | 3L | ||
| sub-dominant | evaluation of the growth according to direction of the highest competition | 3S | |
| evaluation of the growth according to direction of the lowest competition | 3L |
References
- Konôpka, B.; Pajtík, J.; Šebeň, V.; Lukac, M. Belowground biomass functions and expansion factors in high elevation Norway spruce. Forestry 2011, 84, 41–48. [Google Scholar] [CrossRef]
- Mäkinen, H.; Isomäki, A. Thinning intensity and long-term changes in increment and stem form of Norway spruce trees. For. Ecol. Manag. 2004, 201, 295–309. [Google Scholar] [CrossRef]
- Čermák, P.; Jankovský, L.; Cudlín, P. Risk evaluation of the climatic change impact on secondary Norway spruce stands as exemplified by the Křtiny Training Forest Enterprise. J. For. Sci. 2004, 50, 256–262. [Google Scholar] [CrossRef]
- Lévesque, M.; Saurer, M.; Siegwolf, R.; Eilmann, B.; Brang, P.; Bugmann, H.; Rigling, A. Drought response of five conifer species under contrasting water availability suggests high vulnerability of Norway spruce and European larch. Glob. Chang. Biol. 2013, 19, 3184–3199. [Google Scholar] [CrossRef] [PubMed]
- Lindner, M.; Maroschek, M.; Netherer, S.; Kremer, A.; Barbati, A.; Garcia-Gonzalo, J.; Seidl, R.; Delzon, S.; Corona, P.; Kolström, M.; et al. Climate change impacts, adaptive capacity, and vulnerability of European forest ecosystems. For. Ecol. Manag. 2010, 259, 698–709. [Google Scholar] [CrossRef]
- Anderson, F.; Brække, F.H.; Hallbäcken, L. Nutrition and Growth of Norway Spruce Forests in a Nordic Climatic and Deposition Gradient; TemaNord, Nordic Council of Ministers: Copenhagen, Denmark, 1998; p. 255. [Google Scholar]
- Dobbertin, M. Tree growth as indicator of tree vitality and of tree reaction to environmental stress: A review. Eur. J. For. Res. 2005, 124, 319–333. [Google Scholar] [CrossRef]
- Eriksson, L. Single-tree competition models, predicting stand development after clearing, 1977. In FAO State of the World’s Forests-Enhancing the Socioeconomic Benefits from Forests; FAO: Rome, Italy, 2014; p. 119. Available online: http://www.fao.org/3/a-i3710e.pdf (accessed on 15 February 2016).
- Coomes, D.A.; Allen, R.A. Effects of size, competition, and altitude on tree growth. J. Ecol. 2007, 95, 1084–1097. [Google Scholar] [CrossRef]
- Franklin, J.F.; Spies, T.A.; Van Pelt, R.; Carey, A.B.; Thornburgh, D.A.; Berg, D.R.; Lindenmayer, D.B.; Harmon, M.E.; Keeton, W.S.; Shaw, D.C.; et al. Disturbances and structural development of natural forest ecosystems with silvicultural implications, using Douglas-fir forests as an example. For. Ecol. Manag. 2002, 155, 399–423. [Google Scholar] [CrossRef]
- Fraver, S.; Palik, B.J. Stand and cohort structures of old-growth Pinus resinosa-dominated forests of northern Minnesota, USA. J. Veg. Sci. 2012, 23, 249–259. [Google Scholar] [CrossRef]
- Bigelow, W.S.; Runkle, J.R.; Oswald, E.M. Competition, climate, and size effect on radial growth in an old-growth Hemlock forests. Forests 2020, 11, 52. [Google Scholar] [CrossRef]
- Kenkel, N.C. Patterns of self-thinning in jack pine: Testing the random mortality hypothesis. Ecology 1988, 69, 1017–1024. [Google Scholar] [CrossRef]
- Lorimer, C.G.; Dahir, S.E.; Nordheim, E.V. Tree mortality and longevity in mature and old-growth hemlock–hardwood forests. J. Ecol. 2001, 89, 960–971. [Google Scholar] [CrossRef]
- Briceňo-Elizondo, E.; Garcia-Gonzalo, J.; Peltola, H.; Matala, J.; Kellomäki, S. Sensitivity of growth of Scots pine, Norway spruce and silver birch to climate change and forest management in boreal conditions. For. Ecol. Manag. 2006, 232, 152–167. [Google Scholar] [CrossRef]
- Fraver, S.; D’Amato, A.W.; Bradford, J.B.; Jonsson, B.G.; Jönsson, M.; Esseen, P.A. Tree growth and competition in an old-growth Picea abies forest of boreal Sweden: Influence of tree spatial patterning. J. Veg. Sci. 2014, 25, 374–385. [Google Scholar] [CrossRef]
- D’Amato, A.W.; Puettmann, K.J. The relative dominance hypothesis explains interaction dynamics in mixed species Alnus rubra/Pseudotsuga menziesii stands. J. Ecol. 2004, 92, 450–463. [Google Scholar]
- Schweingruber, F.H. Tree Rings and Environment: Dendroecology; Paul Haupt AG Bern: Berne, Switzerland, 1996; p. 609. [Google Scholar]
- Kenkel, N.C.; Hendrie, M.L.; Bella, I.E. A long-term study of Pinus banksiana population dynamics. J. Veg. Sci. 1997, 8, 241–254. [Google Scholar] [CrossRef]
- Harper, K.A.; Bergeron, Y.; Drapeau, P.; Gauthier, S.; De Grandpré, L. Structural development following fire in black spruce boreal forest. For. Ecol. Manag. 2005, 206, 293–306. [Google Scholar] [CrossRef]
- Rossi, S.; Morin, H.; Gionest, F.; Laprise, D. Spatially explicit structure of natural stands dominated by black spruce. Silva Fennica 2013, 47, 14. [Google Scholar] [CrossRef]
- Liu, S.; Bond-Lamberty, B.; Hicke, J.A.; Vargas, R.; Zhao, S.; Chen, J.; Edburg, S.L.; Hu, Y.; Liu, J.; McGuire, A.D.; et al. Simulating the impacts of disturbances on forest carbon cycling in North America: Processes, data, models, and challenges. J. Geophys. Res. 2011, 117, G00K08. [Google Scholar] [CrossRef]
- Goetz, S.; Bond-Lamberty, B.; Law, B.; Hicke, J.; Huang, C.; Houghton, R.; McNulty, S.; O´Halloran, T.; Harmon, M.; Meddens, A. Observations and assessment of forest carbon dynamics following disturbance in North America. J. Geophys. Res. 2012, 117, 1–17. [Google Scholar] [CrossRef]
- Zhou, D.; Zhao, S.Q.; Liu, S.; Oeding, J. A meta-analysis on the impact of partial cutting on forest structure and carbon storage. Biogeosciences 2013, 10, 3691–3703. [Google Scholar] [CrossRef]
- Alemdag, I.S. Evaluation of some competition indices for the prediction of diameter increment in planned white spruce. For. Manag. Inst. Inf. Rep. 1978, FMR-X-108, 39. [Google Scholar]
- Bella, I.E. A new competition model for individual trees. For. Sci. 1971, 17, 364–372. [Google Scholar]
- De Luis, M.; Raventós, J.; Cortina, J.; Moro, M.J.; Bellot, J. Assessing components of a competition index to predict growth in an even-aged Pinus nigra stand. New For. 1998, 15, 223–242. [Google Scholar] [CrossRef]
- Ek, A.R.; Dudek, A. Development of Individual Tree Based Stand. Growth Simulators: Progress and Applications; University of Minnesota: Minneapolis, MN, USA, 1980; p. 25. [Google Scholar]
- Magnusen, S.; Brand, D.G. A Competition Process. Driven Growth Model for Red Pine. Information Report PI-X-89; Petawawa National Forestry Institute, Forestry Cananada: Chalk River, ON, Canada, 1989; pp. 1–44. [Google Scholar]
- Keddy, P.A. Competition; Chapman and Hall: London, UK, 1989. [Google Scholar]
- Doyle, T.W. Competition and Growth Relationship in a Mixed-Aged, Mixed-Species Forest Community. Ph.D. Thesis, University of Tennessee, Knoxville, TN, USA, 1983. [Google Scholar]
- Wichmann, L. Annual variation in competition symmetry in even-aged Sitka spruce. Ann. Bot. 2001, 88, 145–151. [Google Scholar] [CrossRef]
- Merganičová, K.; Merganič, J.; Lehtonen, A.; Vacchiano, G.; Sever, M.Z.O.; Augustynczik, A.L.D.; Reyer, C.P.O. Forest carbon allocation modelling under climate change. Tree Physiol. 2019, 39, 1937–1960. [Google Scholar] [CrossRef]
- Martin, G.L.; Ek, A.R. A comparison of competition measures and growth models for predicting plantation Red pine diameter and height growth. For. Sci. 1984, 30, 731–743. [Google Scholar]
- Miina, J.; Pukkala, T. Application of ecological field theory in distance-dependent growth modelling. For. Ecol. Manag. 2002, 161, 101–107. [Google Scholar] [CrossRef]
- Contreras, M.A.; Affleck, D.; Chung, W. Evaluating tree competition indices as predictors of basal area increment in western Montana forests. For. Ecol. Manag. 2011, 262, 1939–1949. [Google Scholar] [CrossRef]
- Ford, E.D. Competition and stand structure in some even aged plant monocultures. J. Ecol. 1975, 63, 311–333. [Google Scholar] [CrossRef]
- Čermák, J. Calculation of Operative Areas in Large Trees—A Manual; Mendel University of Agriculture and Forestry in Brno: Brno, Czech Republic, 1990; p. 160. [Google Scholar]
- Čermák, J.; Nadezhdina, N.; Trcala, M.; Simon, J. Open field-applicable instrumental methods for structural and functional assessment of whole trees and stands. Iforest Biogeosci. For. 2015, 8, 226. [Google Scholar] [CrossRef]
- Aurenhammer, F. Voronoi diagrams-A survey of a fundamental geometric data structure. ACM Comput. Surv. 1991, 23, 345–405. [Google Scholar] [CrossRef]
- García, O. Scale and spatial structure effects on tree size distributions: Implications for growth and yield modelling. Can. J. For. Res. 2006, 36, 2983–2993. [Google Scholar] [CrossRef]
- Krejza, J.; Světlík, J.; Pokorný, R. Spatially explicit basal area growth of Norway spruce. Trees Struct. Funct. 2015, 29, 1545–1558. [Google Scholar] [CrossRef]
- Teissier Du Cros, E.; Thiebaut, B.; Duval, H. Variability in beech: Budding, height growth and tree form. Ann. For. Sci. 1988, 45, 383–398. [Google Scholar] [CrossRef]
- Krejza, J.; Cienciala, E.; Světlík, J.; Bellan, M.; Noyer, E.; Horáček, P.; Marek, M.V. Evidence of climate-induced stress of Norway spruce along elevation gradient preceding the current dieback in Central Europe. Trees Struct. Funct. 2020. [Google Scholar] [CrossRef]
- Binkley, D.; Campoe, O.C.; Gspaltl, M.; Forrester, D.I. Light absorption and use efficiency in forests: Why patterns differ for trees and stands. For. Ecol. Manag. 2013, 288, 5–13. [Google Scholar] [CrossRef]
- Canham, C.H.D.; LePage, P.T.; Coates, K.D. A neighbourhood analysis of canopy tree competition: Effect of shading versus crowding. Can. J. For. Res. 2004, 34, 778–787. [Google Scholar] [CrossRef]
- Coates, K.D.; Canham, C.H.D.; LePage, P.T. Above- versus below-ground competitive effects and responses of a guild of temperate tree species. J. Ecol. 2009, 97, 118–130. [Google Scholar] [CrossRef]
- Gspaltl, M.; Bauerle, W.; Binkley, D.; Sterba, H. Leaf area and light use efficiency patterns of Norway spruce under different thinning regimes and age classes. For. Ecol. Manag. 2013, 288, 49–59. [Google Scholar] [CrossRef]
- EEA. European Forest Types—Categories and Types for Sustainable Forest Management Reporting and Policy; EEA Technical report No 9/2006; European Environment Agency: Copenhagen, Denmark, 2006. Available online: http://www.env-edu.gr/Documents/European%20forest%20types.pdf (accessed on 2 February 2014).
- Tolasz, R.; Kveton, V. Climate Atlas of Czechia; ČHMÚ and UP Olomouc: Praha, Czech Republic, 2007; p. 256. [Google Scholar]
- Reineke, L.H. Perfecting a stand-density index for even-aged forests. J. Agric. Res. 1933, 46, 627–638. [Google Scholar]
- Butler, A.J.; Barbier, N.; Čermák, J.; Koller, J.; Thornily, C.; McEvoy, C.; Nicoll, B.; Perks, M.P.; Grace, J.; Meir, P. Estimates and relationships between aboveground and belowground resource exchange surface areas in a Sitka spruce managed forest. Tree Physiol. 2010, 30, 705–714. [Google Scholar] [CrossRef] [PubMed]
- Čermák, J.; Ulrych, R.; Staněk, Z.; Koller, J.; Aubrecht, L. Electrical measurement of tree root absorbing surfaces by the earth impedance method: 2. Verification based on allometric relationships and root severing experiments. Tree Physiol. 2006, 26, 1113–1121. [Google Scholar] [CrossRef] [PubMed][Green Version]
- Xing, Z.; Bourque, C.P.; Swift, D.E.; Clowater, C.W.; Krasowski, M.; Meng, F.R. Carbon and biomass partitioning in balsam fir (Abies balsamea). Tree Physiol. 2005, 25, 1207–1217. [Google Scholar] [CrossRef] [PubMed]
- Trouvé, R.; Bontemps, J.D.; Seynave, I.; Collet, C.; Lebourgeois, F. Stand density, tree social status and water stress influence allocation in height and diameter growth of Quercus petraea (Liebl.). Tree Physiol. 2015, 35, 1035–1046. [Google Scholar] [CrossRef] [PubMed]
- StatSoft Inc. STATISTICA (Data Analysis Software System), Version 10, 2011. Available online: www.statsoft.com (accessed on 2 October 2011).
- Pelz, D.R. Estimating Individual Tree Growth with Tree Polygons; School of Forestry and Wildlife Research: Blacksburg, VA, USA, 1978; pp. 172–178. [Google Scholar]
- Boivin, F.; Paquette, A.; Papaik, M.; Thiffault, N.; Messier, C.H. Do position and species identity of neighbours matter in 8-15-years-old post-harvest mesic stands in the boreal mixed wood? For. Ecol. Manag. 2010, 260, 1124–1131. [Google Scholar] [CrossRef]
- Lorimer, C.G. Tests of age-independent competition indices for individual trees in natural hardwood stands. For. Ecol. Manag. 1983, 6, 343–360. [Google Scholar] [CrossRef]
- Duduman, G.; Roibu, C.C.; Duduman, M.L.; Miron-Onciul, M. The influence of competition and dimensional-spatial characteristics of trees on their radial growth in Old-Growth Slătioara forest, Romania. AES Bioflux. 2010, 2, 215–230. [Google Scholar]
- Green, D.S.; Hawkins, C.H.D.B. Competitive interactions in sub-boreal birch-spruce forests differ on opposing slope aspects. For. Ecol. Manag. 2005, 214, 1–10. [Google Scholar] [CrossRef]
- Kirchhefer, A.J. The influence of slope aspect on tree-ring growth of Pinus sylvestris L. in northern Norway and its implication for climate reconstruction. Dendrochronologia 2000, 18, 27–40. [Google Scholar]
- Pretzsch, H. Forest Dynamics, Growth and Yield: From Measurement to Model; Springer: Berlin, Germany, 2009; p. 617. [Google Scholar]
- Assmann, E. Náuka o výnose z lesa; Príroda, vydavatelstvo polnohospodárskej literatury: Bratislava, Slovakia, 1968; p. 488, (In Slovak language). [Google Scholar]
- Pulkkinen, P.; Pöykkö, T. Inherited narrow crown form, harvest index and stem biomass production in Norway spruce, Picea abies. Tree Physiol. 1990, 6, 381–391. [Google Scholar] [CrossRef] [PubMed]
- Špulák, O.; Souček, J. Differences of air temperature in the interior and around the crown of young Norway spruce tree. Opera Corcon. 2010, 47, 225–238. [Google Scholar]
- Grote, R.; Gessler, A.; Hommel, R.; Poschenrieder, W.; Priesack, E. Importance of tree height and social position for drought-related stress on tree growth and mortality. Trees 2016, 30, 1467–1482. [Google Scholar] [CrossRef]
- Nevo, E. Evolution in action across phylogeny caused by microclimate stresses at “Evolution Canyon”. Theor. Popul. Biol. 1997, 52, 231–243. [Google Scholar] [CrossRef] [PubMed]
- Nevo, E. Evolution of genome-phenome diversity under environmental stress. Proc. Natl. Acad. Sci. USA 2001, 98, 6233–6240. [Google Scholar] [CrossRef]
- Jones, J.R.; Kaufmann, M.R.; Richardson, E.A. Effects of water and temperature. In Aspen: Ecology and Management in the Western United States; DeByle, N.V., Winokur, R.P., Eds.; United States Forest Service General Technical Report RM-119; United States Forest Service: Fort Collins, CO, USA, 1985; pp. 71–76. [Google Scholar]
- Randuška, D.; Vorel, J.; Plíva, K. Fytocenológia a Lesnická Typológia; Príroda: Bratislava, Slovakia, 1986; p. 344, (In Czech language). [Google Scholar]
- Tjoelker, M.G.; Boratyński, A.; Bugała, W. Biology and Ecology of Norway Spruce; Springer: Dordrecht, The Netherlands, 2007; p. 469. ISBN 13978-90-481-7209-2. [Google Scholar]
- Roedick, M.L.; Farquhar, G.D.; Berry, S.L.; Noble, I.R. On the direct effect of clouds and atmospheric particles on the productivity and structure of vegetation. Oecologia 2001, 129, 21–30. [Google Scholar]
- Bednář, P. Secondary Monocultures of Norway Spruce (Picea abies L.): Transformation and Conversion Processes and the Subsequent Changes within the Forest Stand.; Mendel University in Brno: Brno, Czech Republic, 2016; p. 293. [Google Scholar]


| Locality | Site | Area | Age | n1 | n2 | DBH (cm) | Height (m) | N [ha−1] | SDI * | ||
|---|---|---|---|---|---|---|---|---|---|---|---|
| (ha) | (years) | Mean | ±SD | Mean | ±SD | ||||||
| Bílý Kříž | 1 | 0.05 | 35 | 64 | 41 | 17.6 | 2.83 | 14 | 1.02 | 1268 | 721.9 |
| 2 | 0.05 | 35 | 73 | 47 | 17.5 | 3.28 | 15.5 | 1.31 | 1184 | 667.9 | |
| Kněhyně | 3 | 0.24 | 79 | 51 | 20 | 28.9 | 4.46 | 19.1 | 1.33 | 639 | 806.5 |
| 4 | 0.21 | 89 | 39 | 16 | 42.5 | 7.62 | 23.7 | 3.51 | 325 | 761.6 | |
| 5 | 0.2 | 66 | 49 | 25 | 28.2 | 4.61 | 19.6 | 2.07 | 767 | 930.2 | |
| 6 | 0.19 | 66 | 44 | 18 | 23.9 | 6.30 | 19.2 | 1.91 | 1100 | 1023.4 | |
| 7 | 0.19 | 71 | 39 | 15 | 30.8 | 5.24 | 20.4 | 1.26 | 650 | 908.5 | |
| Rájec–Němčice | 8 | 0.05 | 39 | 69 | 41 | 15.3 | 3.55 | 16.1 | 2.31 | 2032 | 924.0 |
| 9 | 0.05 | 39 | 90 | 56 | 14.4 | 5.27 | 13.8 | 3.92 | 1808 | 745.9 | |
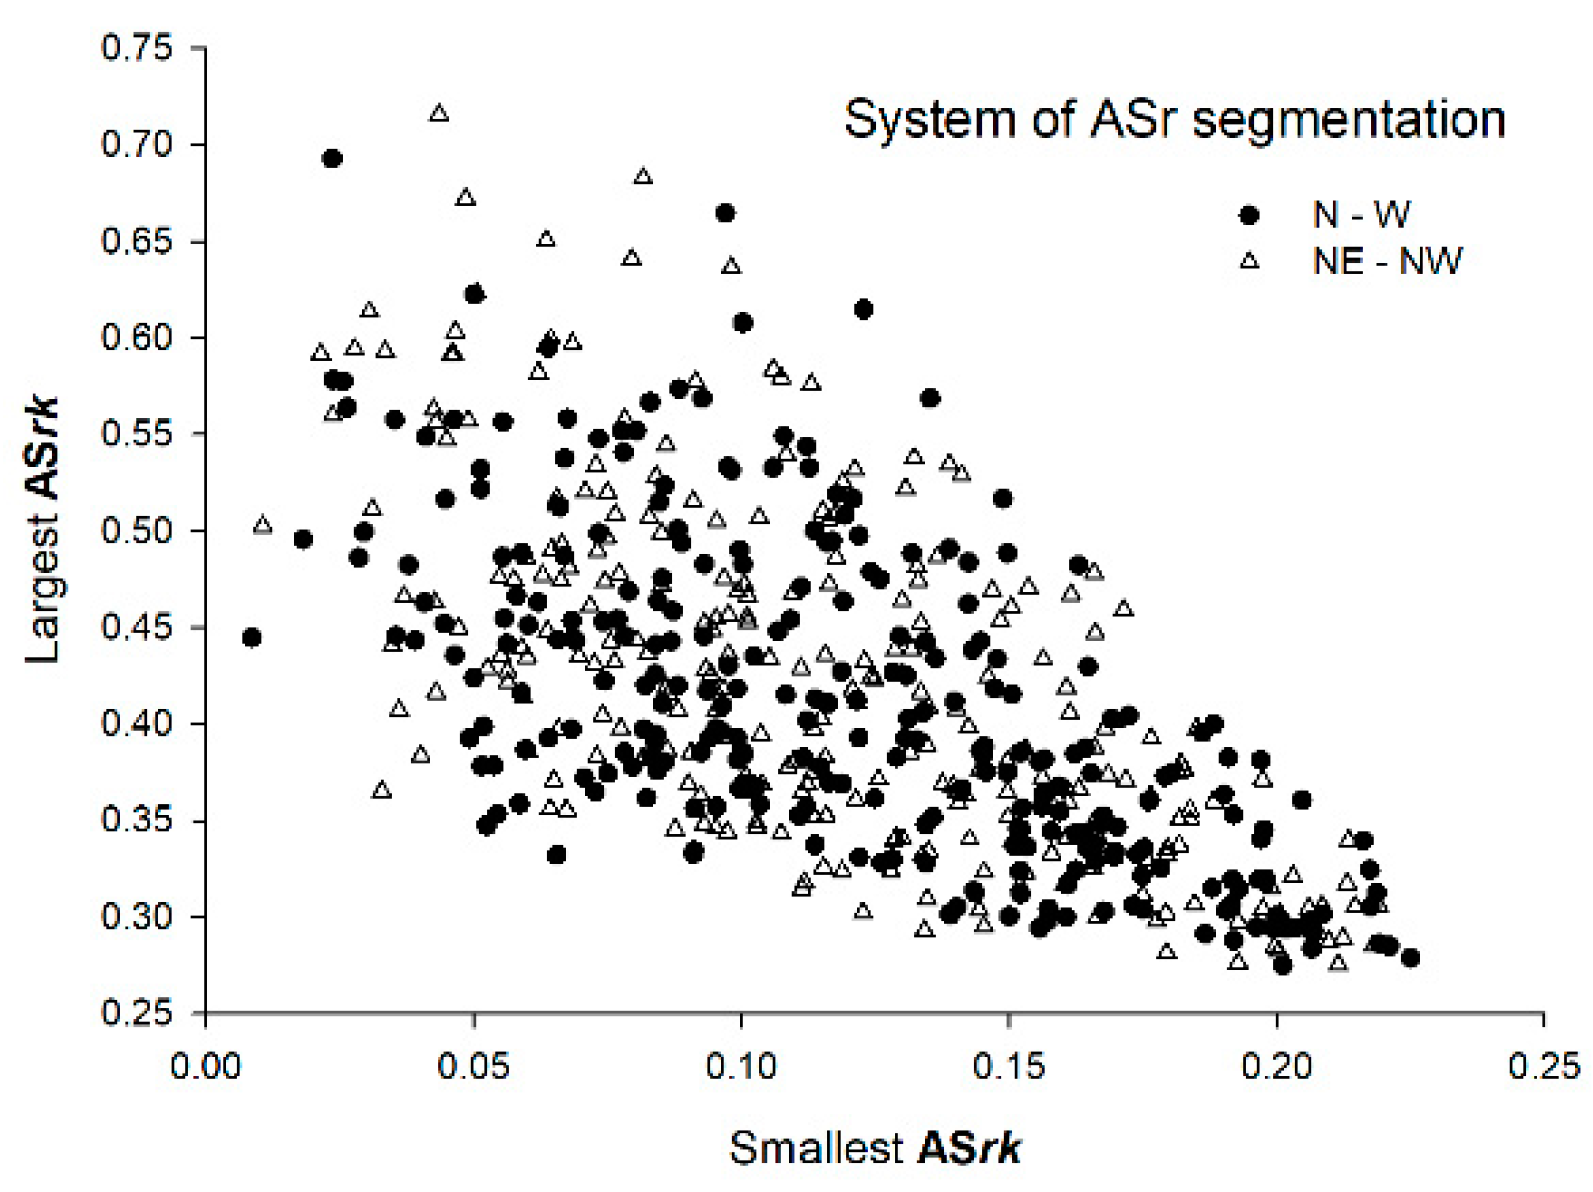
| ASrk | |||
|---|---|---|---|
| Parameter | Median | Smallest Value | Largest Value |
| Smallest ASrk of the tree (N-W segmentation) | 0.11 | 0.01 | 0.22 |
| Smallest ASrk of the tree (NE-NW segmentation) | 0.12 | 0.01 | 0.22 |
| Largest ASrk of the tree (N-W segmentation) | 0.41 | 0.28 | 0.69 |
| Largest ASrk of the tree (NE-NW segmentation) | 0.39 | 0.27 | 0.72 |
Publisher’s Note: MDPI stays neutral with regard to jurisdictional claims in published maps and institutional affiliations. |
© 2021 by the authors. Licensee MDPI, Basel, Switzerland. This article is an open access article distributed under the terms and conditions of the Creative Commons Attribution (CC BY) license (http://creativecommons.org/licenses/by/4.0/).
Share and Cite
Světlík, J.; Krejza, J.; Bednář, P. A Novel Approach to Evaluate the Effect of Neighboring Trees and the Orientation of Tree Social Area on Stem Radial Increment of Norway Spruce Trees. Forests 2021, 12, 163. https://doi.org/10.3390/f12020163
Světlík J, Krejza J, Bednář P. A Novel Approach to Evaluate the Effect of Neighboring Trees and the Orientation of Tree Social Area on Stem Radial Increment of Norway Spruce Trees. Forests. 2021; 12(2):163. https://doi.org/10.3390/f12020163
Chicago/Turabian StyleSvětlík, Jan, Jan Krejza, and Pavel Bednář. 2021. "A Novel Approach to Evaluate the Effect of Neighboring Trees and the Orientation of Tree Social Area on Stem Radial Increment of Norway Spruce Trees" Forests 12, no. 2: 163. https://doi.org/10.3390/f12020163
APA StyleSvětlík, J., Krejza, J., & Bednář, P. (2021). A Novel Approach to Evaluate the Effect of Neighboring Trees and the Orientation of Tree Social Area on Stem Radial Increment of Norway Spruce Trees. Forests, 12(2), 163. https://doi.org/10.3390/f12020163