Article

Precipitation Gradient Drives Divergent Relationship between Non-Structural Carbohydrates and Water Availability in Pinus tabulaeformis of Northern China

1
State Key Laboratory of Earth Surface Processes and Resource Ecology, Beijing Normal University, Beijing 100875, China
2
School of Natural Resources, Faculty of Geographical Science, Beijing Normal University, Beijing 100875, China
3
Department of Biogeochemical Processes, Max—Planck Institute for Biogeochemistry, 07745 Jena, Germany
4
College of Urban and Environmental Sciences and MOE Laboratory for Earth Surface Processes, Peking University, Beijing 100871, China
5
Department of Environmental Sciences, University of Virginia, Charlottesville, VG 22904, USA
6
State Key Laboratory of Urban and Regional Ecology, Research Center for Eco-Environmental Sciences, Chinese Academy of Sciences, Beijing 100085, China
7
Department of Geography & Environmental Studies, University of New Mexico, Albuquerque, NM 87131, USA
*
Author to whom correspondence should be addressed.
Forests 2021, 12(2), 133; https://doi.org/10.3390/f12020133
Submission received: 24 December 2020 / Revised: 19 January 2021 / Accepted: 19 January 2021 / Published: 25 January 2021
(This article belongs to the Section Forest Ecophysiology and Biology)

Abstract

:
Seasonal non-structural carbohydrate (NSC) dynamics in different organs can indicate the strategies trees use to cope with water stress; however, these dynamics remain poorly understood along a large precipitation gradient. In this study, we hypothesized that the correlation between water availability and NSC concentrations in different organs might be strengthened by decreasing precipitation in Pinus tabulaeformis Carr. forests in temperate China. Our results show that the concentrations of soluble sugars were lower in stems and coarse roots, and starch was higher in branches in the early growing season at drier sites. Throughout the growing season, the concentrations of soluble sugars increased in drier sites, especially for leaves, and remained stable in wetter sites, while starch concentrations were relatively stable in branches and stems at all sites. The NSC concentrations, mainly starch, decreased in coarse roots along the growing season at drier sites. Trees have a faster growth rate with an earlier cessation in active stem growth at drier sites. Interestingly, we also found a divergent relationship between NSCs in different organs and mean growing season water availability, and a stronger correlation was observed in drier sites. These results show that pine forests in arid and semi-arid regions of northern China exhibit different physiological responses to water availability, improving our understanding of the adaptive mechanisms of trees to water limitations in a warmer and drier climate.

1. Introduction

Widespread tree growth decline and mortality have been widely documented in almost all types of forest ecosystems globally [1,2], attributed mainly to rapid climate change. In particular, intensified tree mortality was closely associated with increases in both frequency, severity and duration of droughts and pest or pathogen attack in recent years [3,4]. Three interdependent mechanisms have been proposed to explain such drought-induced tree mortality, including (1) hydraulic failure, (2) carbon starvation due to depletion of stored non-structural carbohydrates (NSCs), and (3) the interactions between the inhibiting transport and use of stored NSCs, which are potentially amplified by insect and pathogen attack [5]. Despite a growing research interest, the physiological mechanisms underlying tree mortality, growth decline and drought adaptation remain poorly understood [6]. Drought-induced tree growth decline might be partially attributed to the imbalance of photosynthesis and plant respiration on non-structural carbohydrate storage, metabolism and allocation [3,5,7,8]. An increasing body of studies indicate that maintaining carbon assimilation and preventing the rapid depletion of NSCs below a certain critical level appears to be a major strategy for tree growth under stress [9], which suggests that NSC storage is a resource crucial for resistance or even survival for trees [3]. The concentrations of NSCs have been widely used to measure the response of trees to disturbance events, particularly the tree growth decline of arid and semi-arid regions [10].
NSCs in trees, consisting of soluble sugars and starch, are the product of photosynthesis, which are generally thought to provide resources to maintain the plant’s primary functions [11], and are normally species-specific and site-dependent [12]. Soluble sugars, as a mobile component of NSCs, can contribute to various plant physiological and metabolic functions, particularly those related to plant hydraulics, such as osmoregulation and repair of embolized xylem [13,14,15]. Starch, mainly stored in stem wood and coarse roots, appears to be less variable than soluble sugars and acts as a long-term storage form of NSCs. It can be used to support metabolism and growth in the future [14,15,16]. Trees usually use newly formed carbon but can access decade-old NSCs in a stressful environment for metabolism and growth [8,17].
NSCs play an important role in the resistance and resilience of trees and forests to climate-change induced drought [9,18]. However, we only have a patchy understanding of how changes in NSCs across tree organs promotes adaptation to different water conditions [19,20]. Previous studies of NSC responses to water stress have shown substantially different results, likely due to different stress durations and severities, which resulted in different temporal dynamics of NSCs among different species [19]. For instance, at the onset of water deficit, or during mild or short-term droughts, NSC pools even tended to increase in multiple tree species [13,18,21,22,23]. Under mild or short-term water stress, trees may down regulate carbon partitioning into metabolism or respiration and increase NSC storage [14,24,25]. However, a deficit of NSCs also seems to be a widespread phenomenon when water deficits become more adverse. In prolonged and severe water stress, trees may suffer from reductions in NSCs in whole-plant or in specific organs [5,26,27,28,29]. Empirical evidence often comes from short-term drought experiments on small trees, and observational studies in natural ecosystems that cover larger climate gradients are still very rare.
Many studies on seedlings have shown that plants grown under water deficit have lower NSC concentrations than those grown under normal conditions across different organs [30,31], and species with strong stomatal control of transpiration have significantly lower NSCs, especially the starch in stems [13,32,33]. However, coarse roots should also be considered as an important storage organ for NSCs. Water deficit in trees is caused by the mismatch of water uptake and water loss, and an increasing number of studies now suggest that atmospheric drying caused by the drier and warmer climate has an increasingly important effect in explaining growth reduction of trees [34,35]. Following disturbance, stored NSCs can be re-mobilized and used for supporting tree growth [24] or respiratory demands [9]. Despite intense research, the role of stored NSCs in the ability of mature trees to cope with a water deficit, particularly in regions suffering from long-term low precipitation, is still not well established. We also have insufficient understanding of the relationship between NSC concentrations in different organs and water availability along precipitation gradients at a regional scale.
In this study, we aimed to investigate the relationship between water availability and NSC concentrations among different organs and reveal radial growth fluctuation in Pinus tabulaeformis Carr. forests, along a significant precipitation gradient. Specifically, we attempted to (i) identify seasonal patterns of NSC concentrations in different organs as well as tree radial growth along the large precipitation gradient over northern China, and (ii) identify spatial patterns in the relationship between NSC concentrations in different organs and water availability. We hypothesized that the correlation between water availability and NSCs in different organs would be strengthened with decreasing precipitation during the growing season. A comprehensive understanding of the linkage of NSCs to the relationship between water availability and tree stem growth is critical for the prediction of forest dynamics in response to future climate change and for understanding forest resilience to water deficit at a regional scale [2,3,15,36], which provides a reference for further models or laboratory experiments.

2. Materials and Methods

2.1. Study Region

This study was performed in an approximately south-to-north transect over northern China (Figure 1), which consisted of four sampling sites that cover a large climate gradient. The four forest sites, including forestry stations in Shaanxi (HDT), Shanxi (QLY), and Inner Mongolia (GLB, WLS), were sampled and measured since 2016 (Figure 1). All sites are dominated by Pinus tabulaeformis Carr. plantations, with mean tree age of 60–70 years (mature forest, Table S1). Pinus tabulaeformis Carr. is commonly planted in northern China, and is an important pioneer and drought-resistant tree species distributed in arid and semi-arid regions. The four sampling sites cover a large precipitation gradient, with mean annual precipitation (MAP, derived from the meteorological station data) ranging from 185 mm (WLS) to 917 mm (HDT) and of mean growing season vapor pressure deficit (VPD) ranging from 1.46 (WLS) to 0.45 (HDT) (Table S1). Our study region is mainly characterized by typical temperate continental monsoon climate and the majority of annual precipitation occurs during the growing season (May to October, >85%). No insect attacks or pathogen infections were observed during our study at the four study sites.

2.2. Organ Sampling and NSC Concentration Analysis

Samples of different organs were systematically collected for NSC concentration analyses in early spring (May), mid-summer (July) and end of autumn (October) in 2016 and 2017 (only WLS and GLB were measured in 2016). At each site, two or three plots of 25 m × 25 m were set up, and three to five well-grown (dead branch ratio less than 10%, without pest or disease infections) trees of similar size and height were sampled in each plot. For each selected tree, leaves, branches, stems and coarse roots were sampled. Leaf and branch samples were collected at the sun-exposed canopy and two stem samples were taken with a hand increment corer of 5 mm diameter at breast height (1.3 m above the ground) for each tree. Coarse root samples were cut near the ground with scissors (diameter > 5 mm). All samples were collected in the morning (before 10:00 a.m.), placed in clean plastic bags, labeled, and transported to the laboratory with a small mobile freezer (keeping temperature below −10 °C).
Samples were dried to stop all enzymatic activity (30 min at 105 °C) and then dried to constant weight at 65–70 °C. The dried samples were ground to pass a 1-mm sieve, and then measured by the anthrone-concentrated sulfuric acid method for soluble sugars and the perchloric acid method for starch [12,37]. We used pure glucose as material to plot the standard curve to align the measured soluble sugar concentrations. The samples were weighed with a one-thousandth balance and placed into a 10 mL centrifuge tube, and then extracted three times with 80% ethanol at 80 °C (30 min; 25 min; 25 min). After each extraction, the supernatant was centrifuged and placed in a 25 mL volumetric flask. After distilling water to volume, a 0.1 mL test solution was boiled with anthrone-concentrated sulfuric acid for 10 min, then the optical density (OD) of soluble sugars was determined by ultraviolet–visible spectrophotometer (756 PC; Shanghai Jinghua, Shanghai, China) at 625 nm.
The extraction of starch was carried out after soluble sugars. The samples were extracted with distilled water and perchloric acid three times, 15 min for each time. After extraction, the centrifuge tube was fixed to volume and centrifuged, and the supernatant was placed in a 25 mL volumetric flask. Then, the optical density was measured by the same method as sugars, and the starch concentrations were further converted from sugars with the coefficient of 0.9. Both soluble sugar and starch concentrations were expressed on a dry matter basis (%).

2.3. Stem Growth and Leaf Water Potential (Ψleaf) Monitoring

Continuous in-situ stem radial growth measurements were undertaken at four sites, but the WLS data was missing due to dysfunction of the instruments and we did not further analyze the radial growth of this site. At each site, three to five healthy trees (not the same trees sampled for NSCs), of similar DBH and height, were selected and continuously monitored with point automatic dendrometers (Type: Radius Dendrometer, Ecomatic, Munich, Germany), which were installed at 1.3 m above the ground. Variations in stem diameter (including bark) were recorded every 30 min, and provided a time series of circadian variations of seasonal tree growth. Then, the mean daily value was used to indicate the daily diameter of the stem, and the net growth increment was estimated by subtracting the previous day’s diameter from the current day. Cumulative radial growth was the sum of daily net growth increment, and the cessation of active tree growth was defined as when 95% of total cumulative radial growth had occurred [38].
Daily curves in leaf water potential (Ψleaf) were measured on the same individuals in different phases of growing season in parallel with NSC samples collection. For each daily curve of Ψleaf, measurements were made every two hours from pre-dawn (about 6:00) to sunset (about 18:00). Ψleaf before sunrise (pre-dawn) and at mid-day (approximately 12:00) were regarded as estimations of soil and minimum daytime Ψleaf, respectively. The water potential of three to five healthy needles from each tree (in total three to five trees) was measured with a pressure chamber (PMS Instrument Company, OR, USA).

2.4. Statistical Analyses

We analyzed TNC (total non-structural carbohydrates) as the sum of all soluble sugars and starch concentrations for each organ of each tree. A linear mixed-effect model (LME) was used to analyze the effects of different factors on the concentrations of TNC. In LME analyses, we included sampling sites, time (i.e., season), organ (i.e., leaves, branches, stems, and coarse roots) and other predicting variables, including both leaf water potential and temperature, precipitation, VPD, and their interactions as fixed effect factors. We regarded the sampling ID (i.e., the ID of sampling trees) and sampling year as the random effect factors. The environmental factors for each site are derived from the nearby meteorological stations (precipitation, temperature, vapor pressure deficit) and a gridded soil moisture dataset (ERA-Interim re-analysis data with a spatial resolution of 0.25°, https://apps.ecmwf.int/datasets/data/interim-full-moda/levtype=sfc/) in 2016 and 2017. The precipitation gradient shown in Figure 1 is the multi-year average calculated from CRU (Climate Research Unit, http://www.cgiar-csi.org/).
In this study, the growing season for vegetation growth was defined as May to October. The four study sites were grouped into two subgroups according to MAP; either with MAP lower than 400 mm (WLS, GLB; VPD greater than 1), or higher than 400 mm (QLY, HDT; VPD less than 1). Statistical analyses were performed using SPSS 20.0 (SPSS Inc., Chicago, IL, USA) and R software (version 3.4.1., R Core Team, Vienna, Austria). Redundancy analysis (RDA), a direct gradient analysis, was applied to characterize the effects of different environmental factors on NSC concentrations, using Canoco 5.0 software (Microcomputer Power, Ithaca, NY, USA). Based on RDA analysis, correlations between environmental factors and NSCs components were approximated by a perpendicular projection of the environmental factor arrow-tips onto the line overlaying the NSC’s arrow, the further the projection point falls in the direction indicated by the arrow, the higher the correlation. If the projection point lies in the opposite direction, correlation is negative for predicted.

3. Results

3.1. Seasonal Variations in NSC Concentrations along the Precipitation Gradient

The linear mixed-effect model (LME) revealed the effects of different factors on influencing the concentrations of TNC (Table 1). The TNC concentrations significantly increased by decreasing precipitation and increasing VPD (both p < 0.0001), implying that drier conditions lead to higher TNC concentrations in trees. In contrast, the pre-dawn leaf water potential did not affect TNC significantly (p = 0.594). Sampling site, time and organ all had significant effects on TNC concentrations (p < 0.05). Considering the strong collinearity between temperature and VPD, we further performed an alternative LME model by leaving out temperature and consistent results were obtained (Table S2).
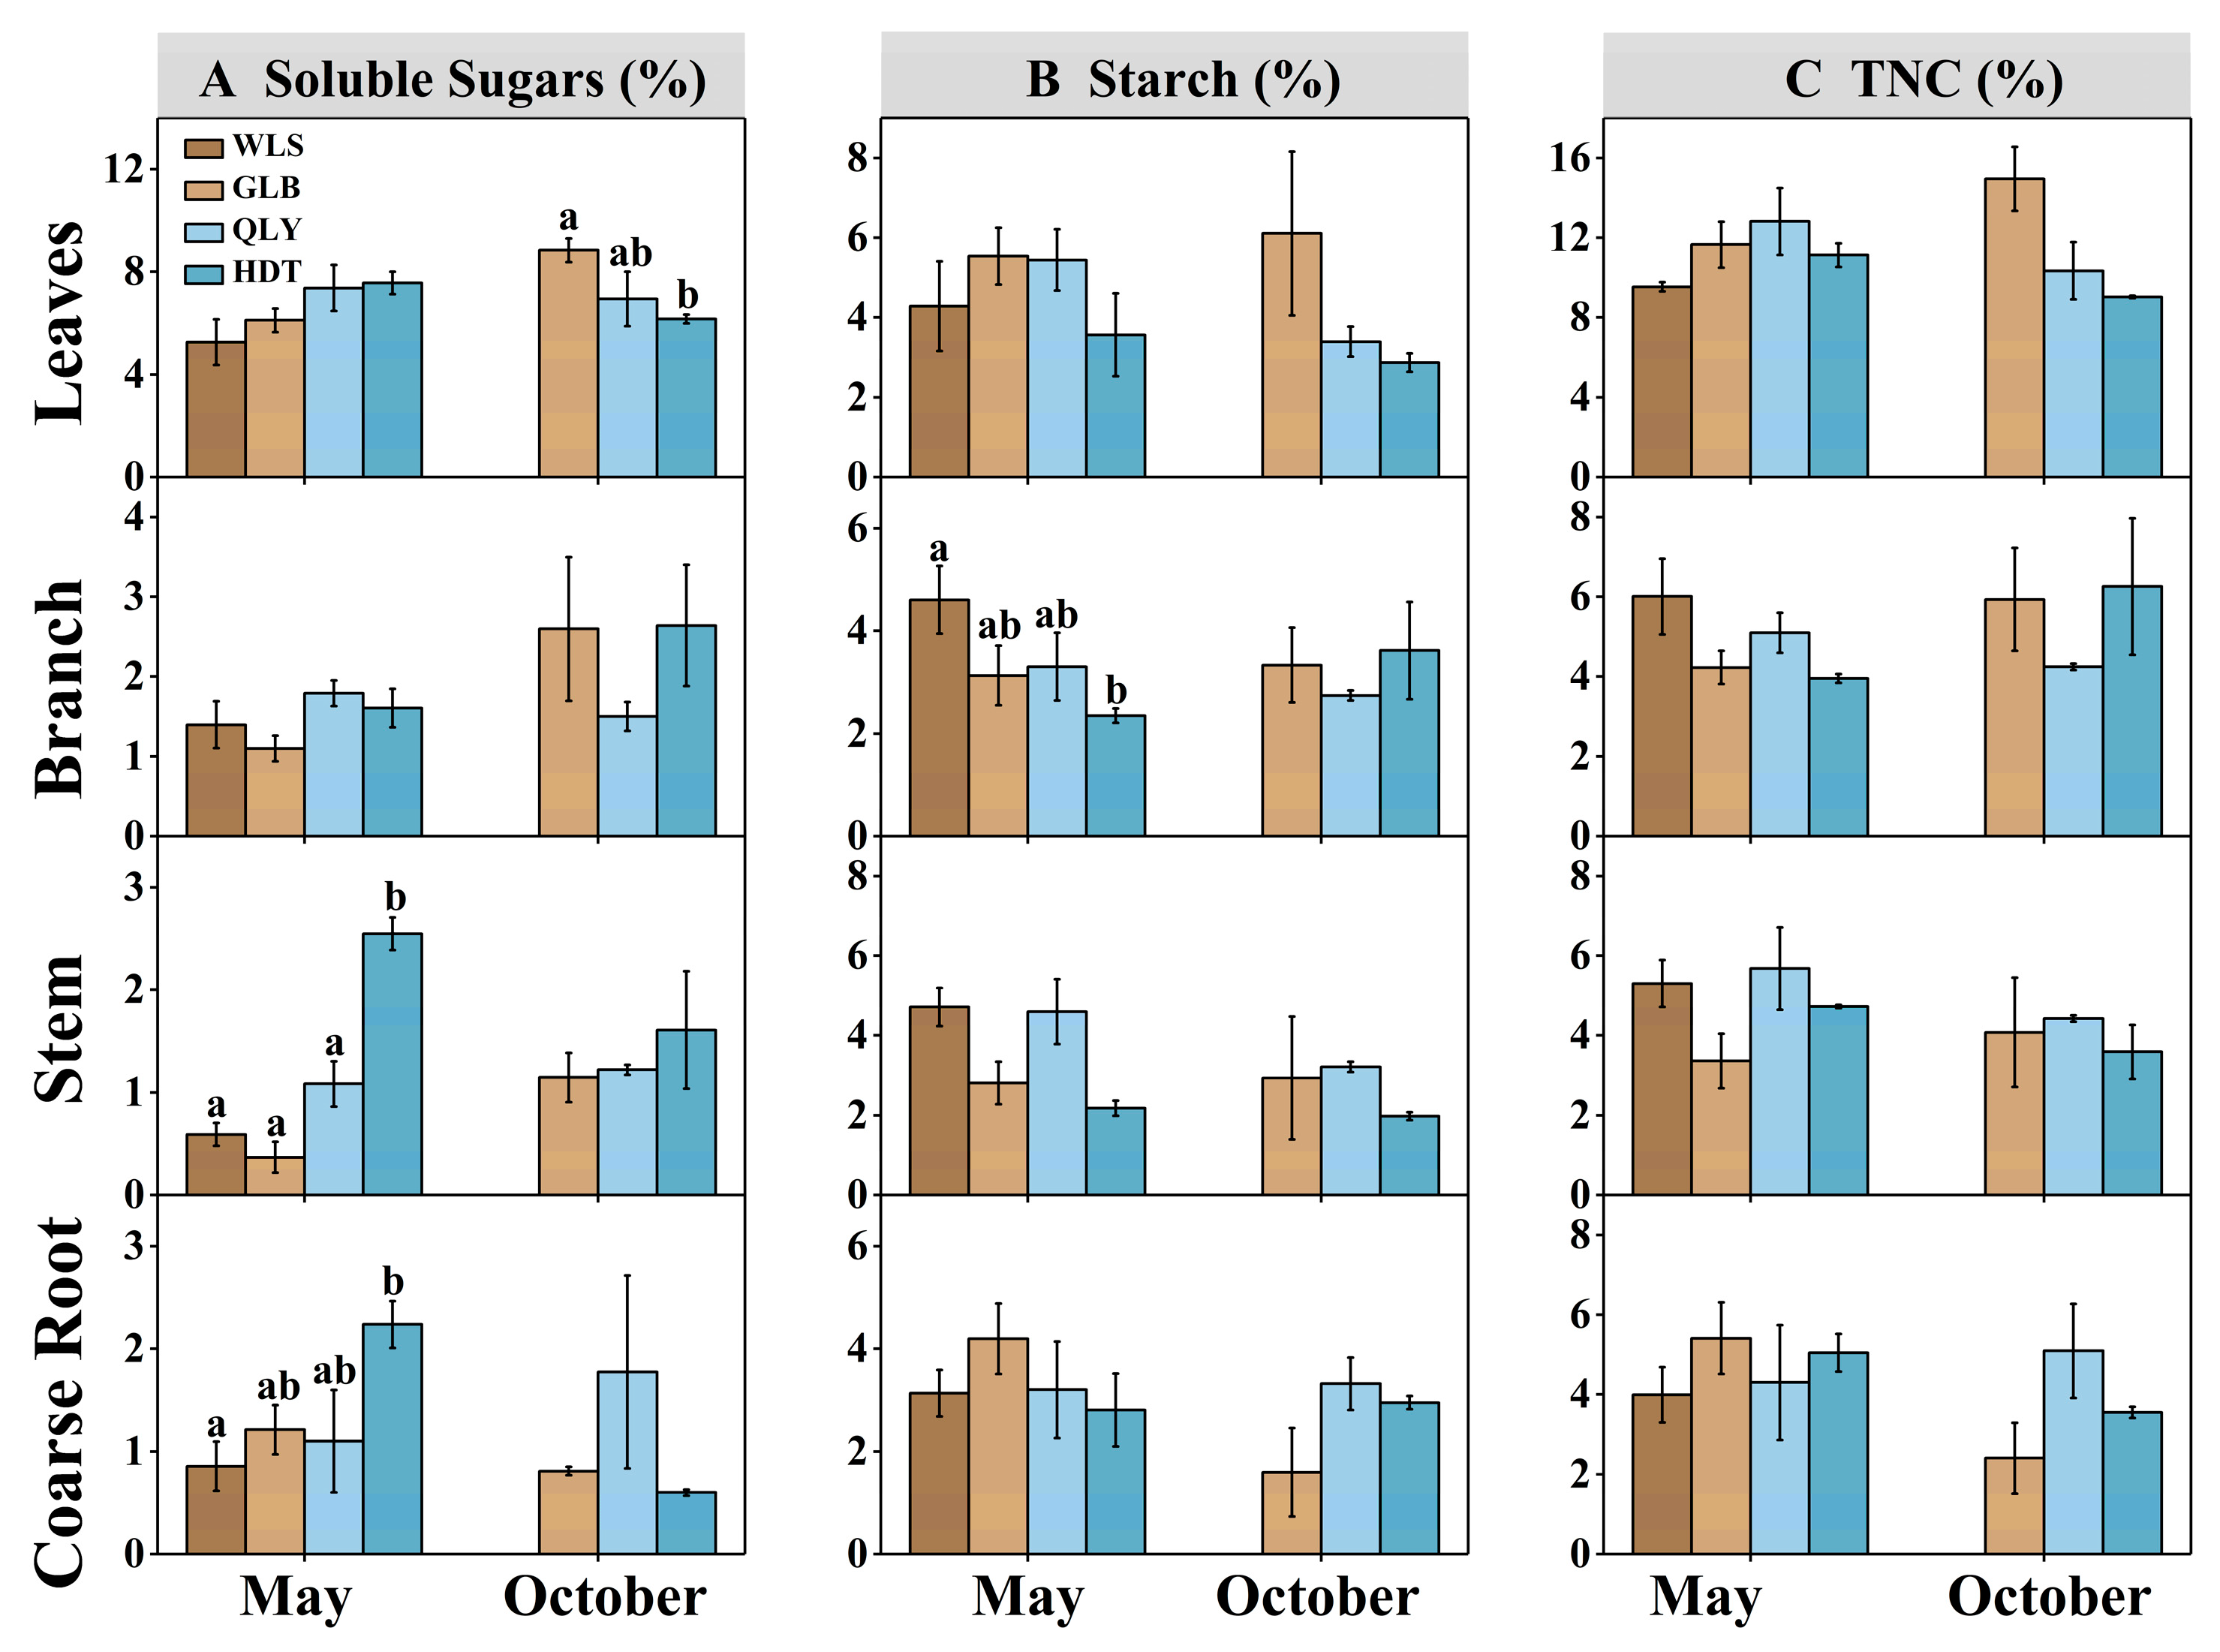
Concentrations of soluble sugars and starch varied markedly but differently in different growth phases and organs among the study sites. In the early growing season (i.e., May), wetter sites seemed to have more soluble sugars, with the concentrations in stems and coarse roots significantly higher in the wettest site (HDT; 2.55% ± 0.16% in stems, 2.24% ± 0.23% in coarse roots), while lowest concentrations were observed in the drier sites (GLB: 0.37% ± 0.15% in stems, WLS: 0.86% ± 0.24% in coarse roots; Figure 2A). The soluble sugar concentrations generally exhibited a consistent increase from early to late growing season (i.e., May to October) in drier sites (i.e., WLS and GLB), especially in leaves, in contrast to relatively constant concentrations throughout the growing season in wetter sites (Figure S1A). At the end of growing season (i.e., October), soluble sugar concentrations in leaves exhibited an opposite pattern to the early growing season; highest and lowest concentrations were observed in the driest (GLB) and wettest site (HDT), respectively (Figure 2A).
In contrast, starch concentrations showed an opposite pattern to soluble sugars in early growing season, and highest concentrations were observed in the driest site WLS and lowest concentrations in the wettest site HDT, especially in branches (Figure 2B). The temporal changes in starch concentrations were also relatively stable throughout the growing season in branches and stems for each of these sites, but increased in leaves and decreased in coarse roots at drier sites (Figure S1B). A similar pattern of soluble sugars was also observed in starch concentrations in leaves at the end of growing season, with slightly higher concentrations in drier sites.
The TNC was almost the same in these sites in the early growing season; however, at the end of the growing season, slightly higher values were observed in leaves in drier sites (Figure 2C). More TNC accumulated in the drier sites during the growing season (Figure 2C; S1C; i.e., GLB: 3.30% ± 1.51% in leaves, 1.70% ± 0.99% in branches, 1.84% ± 2.39% in stems; QLY: −2.47% ± 3.10% in leaves, −0.85% ± 0.58% in branches, −1.25% ± 1.11% in stems; HDT: −2.10% ± 0.65 % in leaves, 2.30% ± 1.61 in branches, −1.14% ± 0.64 in stems). The highest concentration of TNC was found in leaves (4.6%–6.1%), followed by branches (2.4%–2.8%), stems (2.1%–2.9%) and coarse roots (1.9%–2.5%) across all study sites (Figure S2). We further investigated the seasonal variations in the partitioning between soluble sugars and starch concentrations among different sites. The proportion of soluble sugars to TNC was significantly lower in the driest site WLS (32%) in the early growing season, and gradually converged to about 50%, like in other study sites, at the end of growing season (Figure S3).

3.2. Spatial Pattern of Stem Radial Growth in the Growing Season

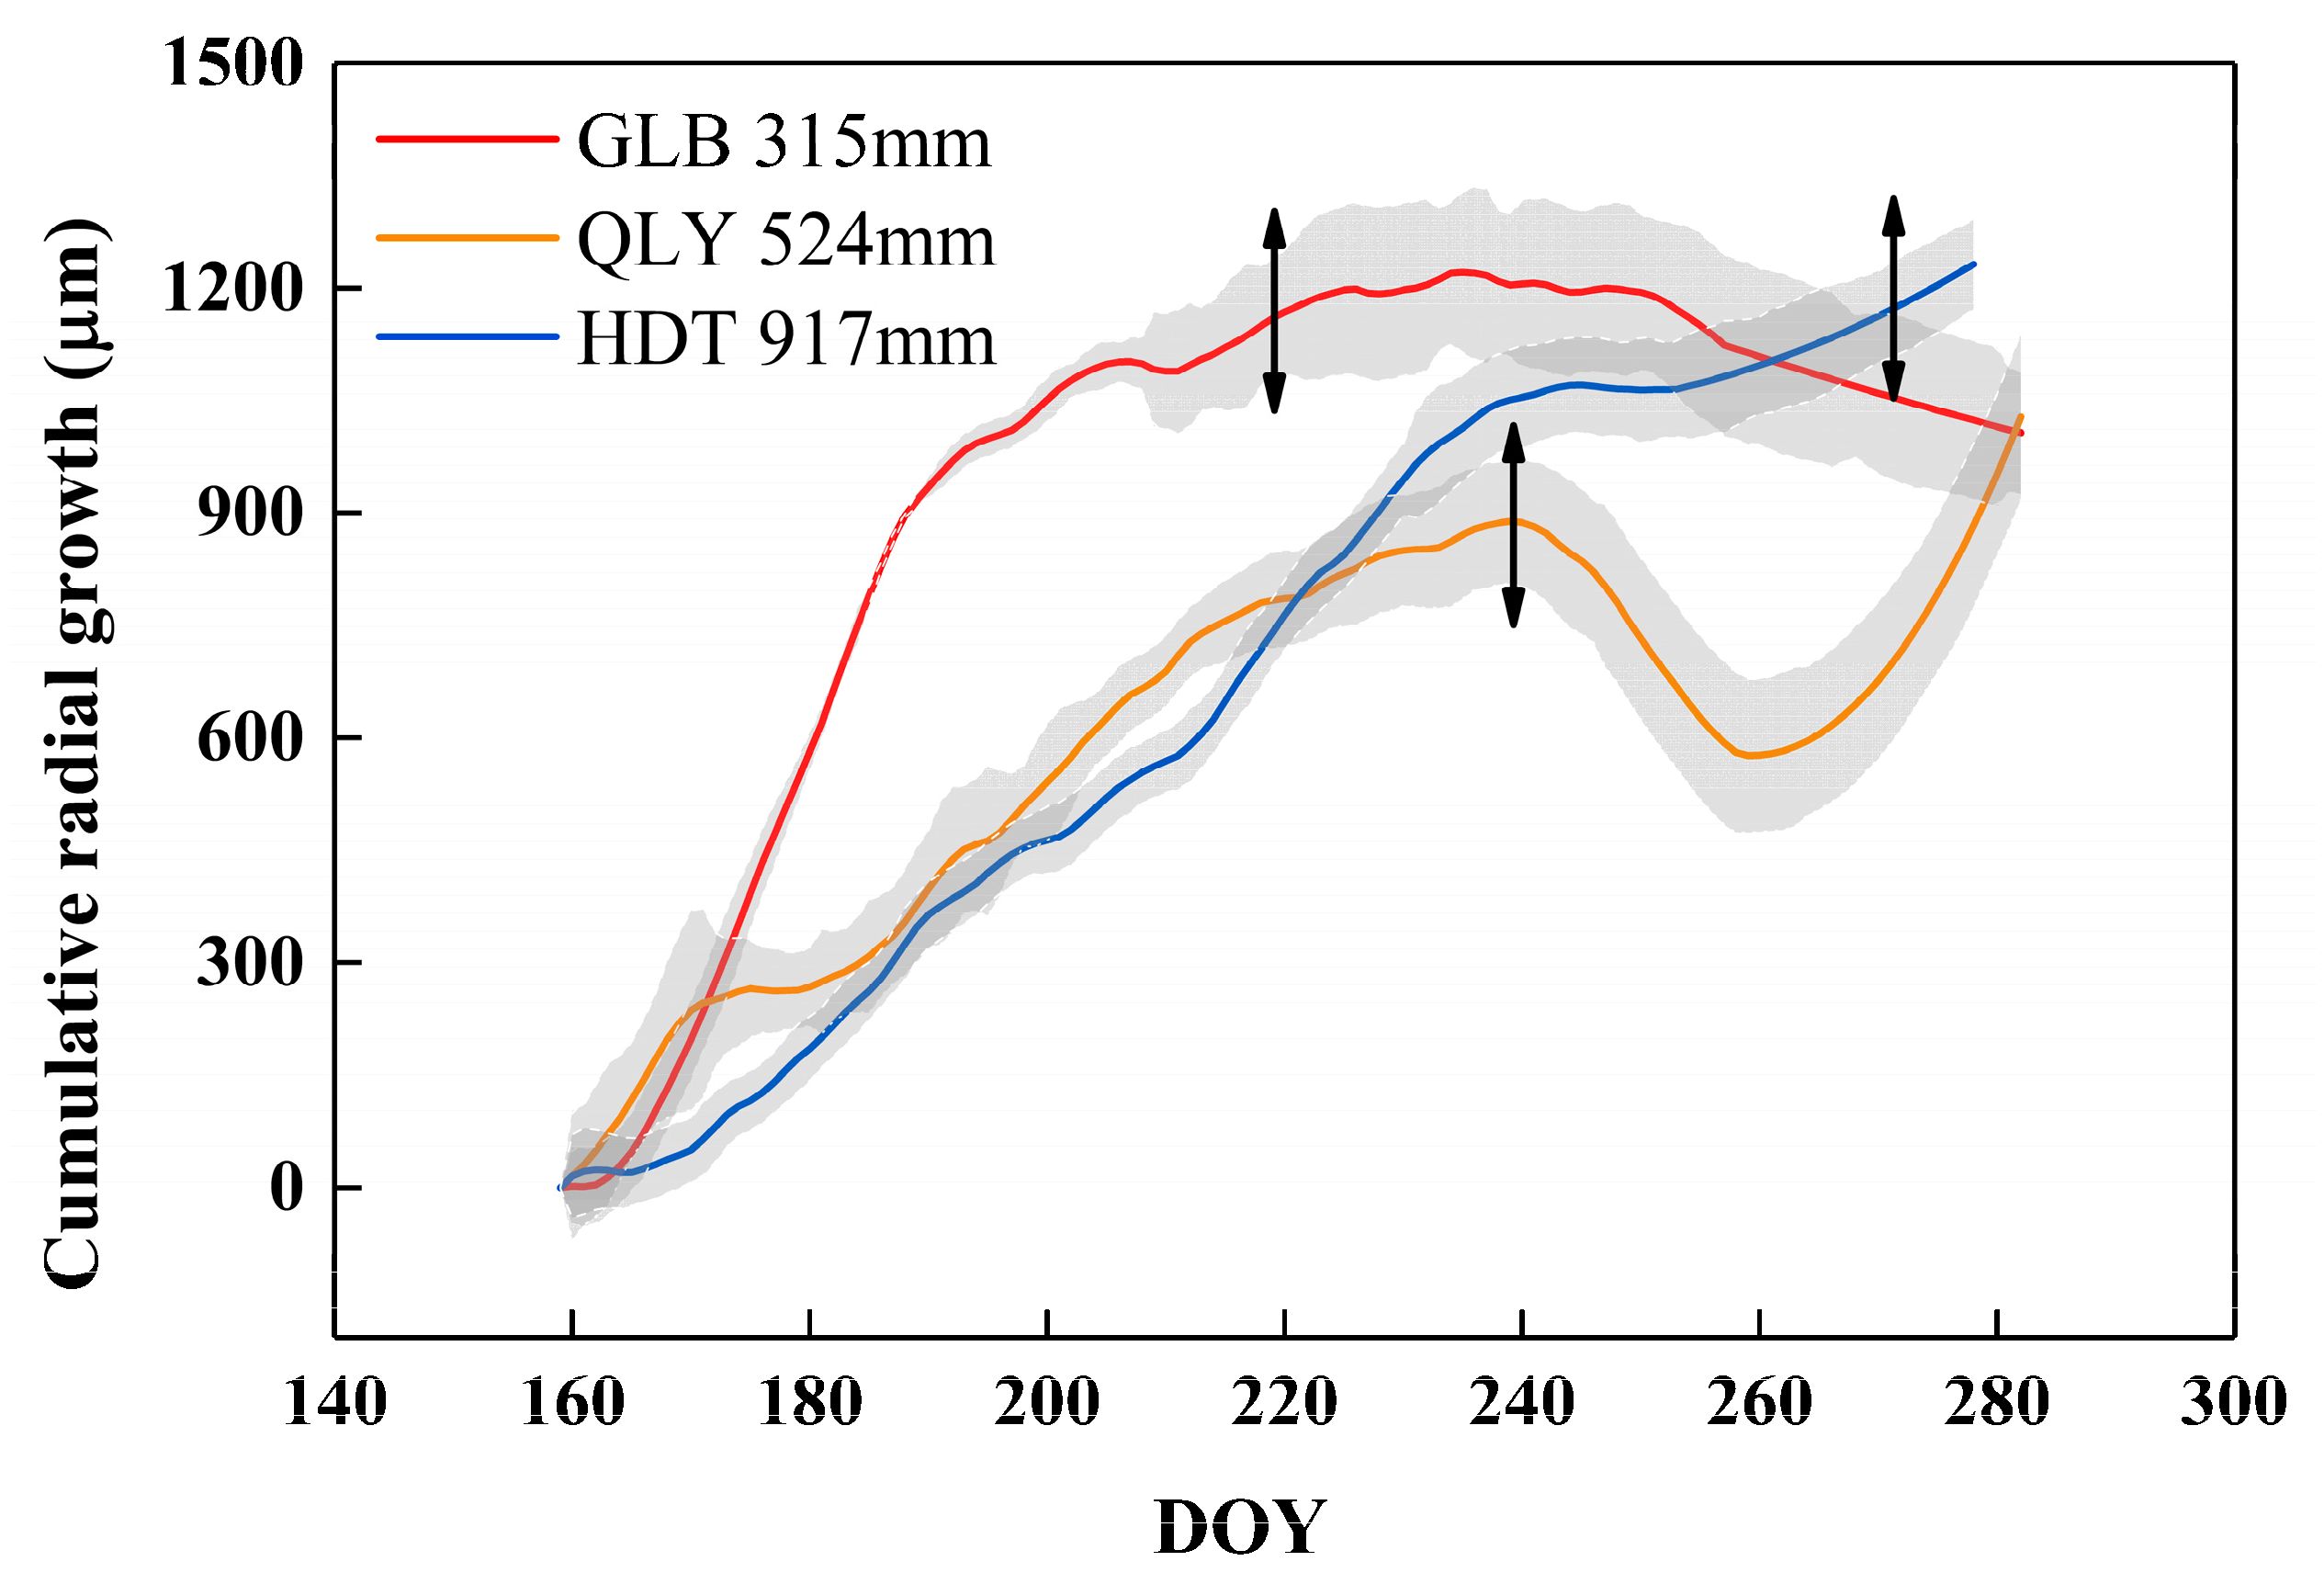
Daily stem radial growth measurements showed the seasonal dynamics of radial growth at three sites along the precipitation gradient (Figure 3, WLS was not analyzed). Daily stem radial growth observations were only available from June owing to the dysfunction of instruments. At the driest site GLB, Pinus tabulaeformis Carr. exhibited the fastest relative growth rate (43 μm/day; QLY: 29 μm/day; HDT: 17 μm/day) in the early growing season (i.e., June) (Figure 3). However, cessation in active tree growth in this driest site occurred (i.e., 95% of total cumulative radial growth had occurred) on 7 August 2017, much earlier than other sites, and was followed by seemingly random variations in tree growth. By contrast, the active tree growth reached a marked slowdown only on 27 August 2017 at the moderate drought site QLY, despite the great daily variations in tree growth afterward. Interestingly, stem radial growth continued until 28 September 2017 at the wettest site HDT (Figure 3).

3.3. Divergent Relationship between NSCs in Different Organs and Water Availability

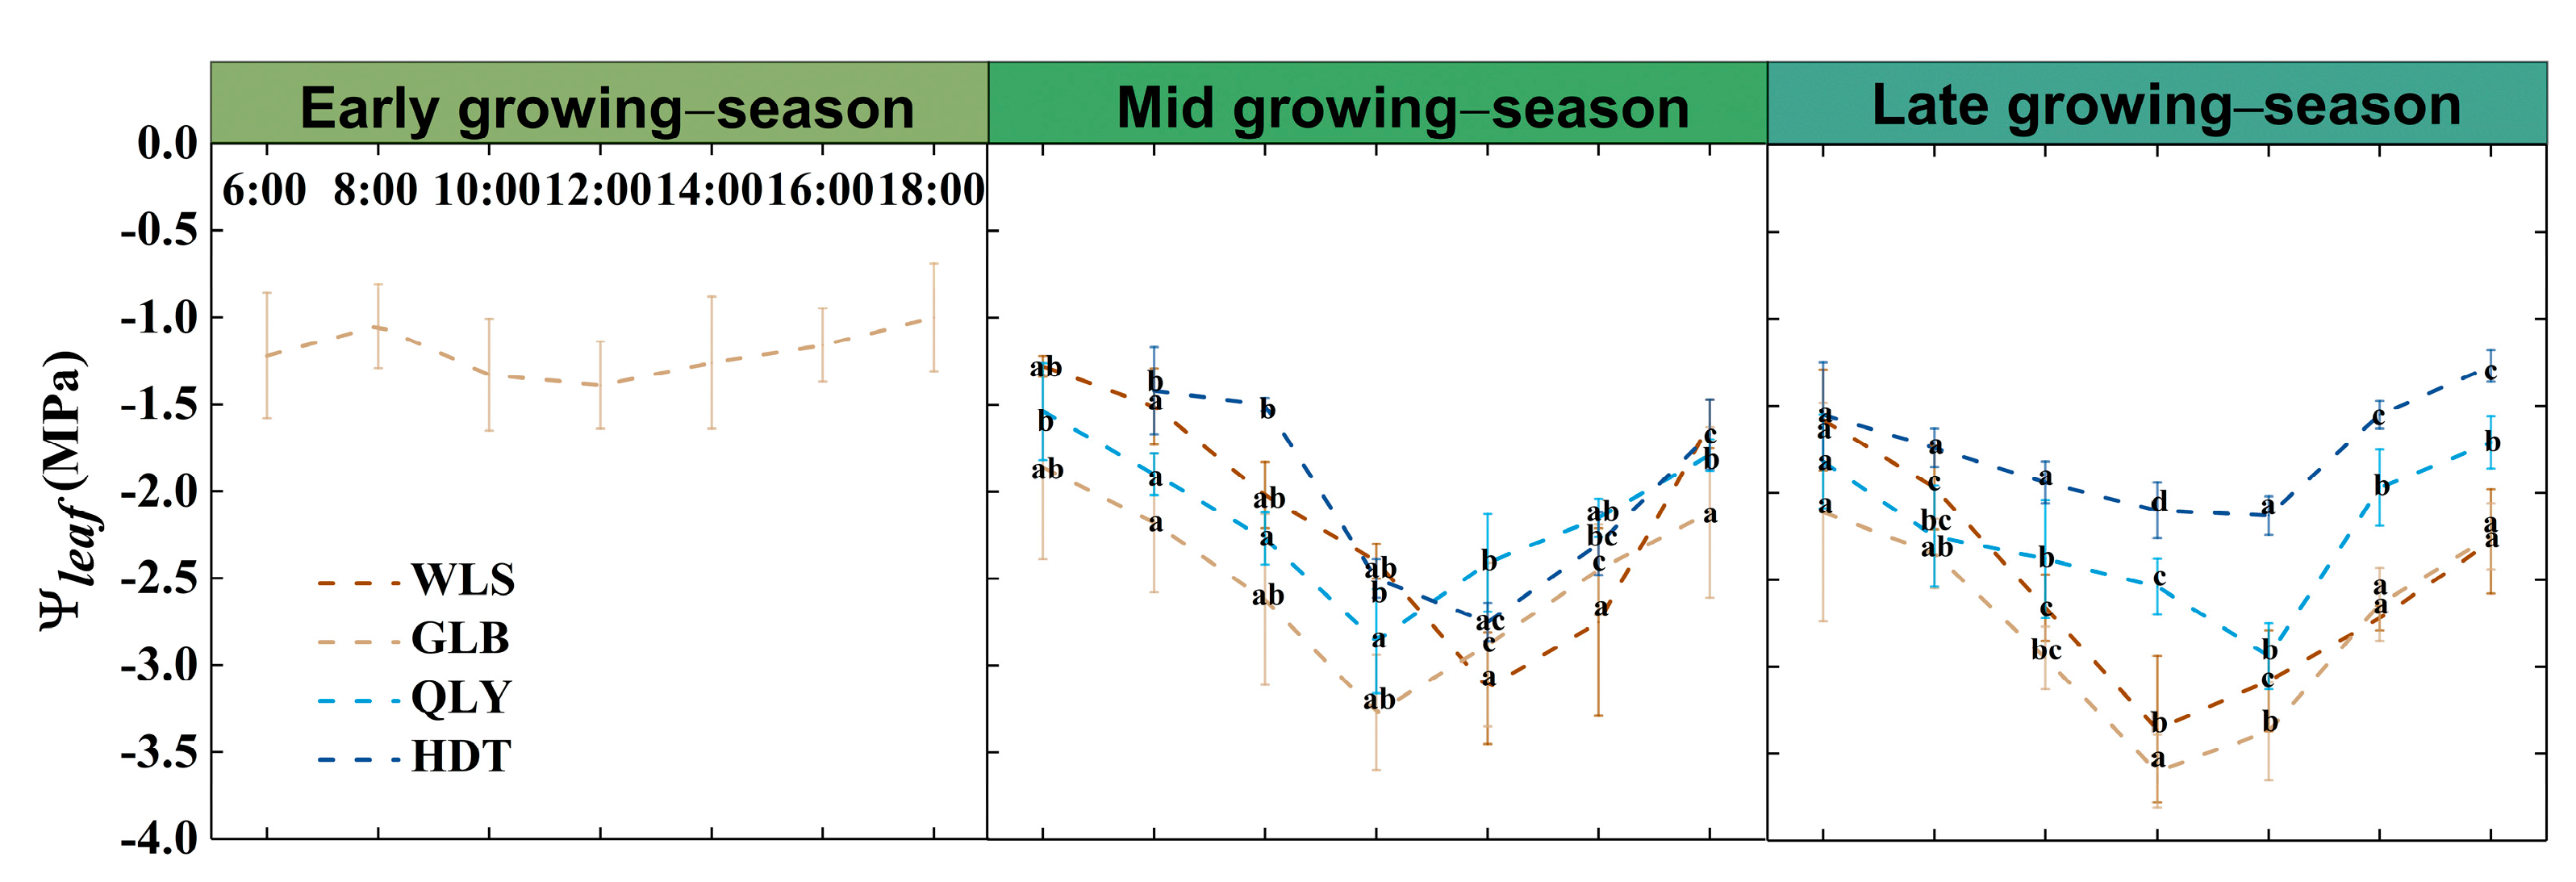
Diurnal patterns in Ψleaf were similar among the study sites during the growing season. Ψleaf declined from dawn onward, then increased from the lowest value at around noon, except for GLB, where the lowest value occurred during the mid growing season at c. 14:00 (Figure 4). Ψleaf in GLB was surprisingly high (−1.0 ± 0.31~−1.39 ± 0.25 MPa) during the early growing season, probably as the result of snowmelt supplement in spring, but gradually decreased during the mid and late growing season owing to increased water demands of trees (−1.86 ± 0.53~−3.60 ± 0.21 MPa). Leaf water potentials exhibited lowest values in drier sites (GLB) and highest values in the wettest site (HDT), and sometimes were significantly different (Figure 4).
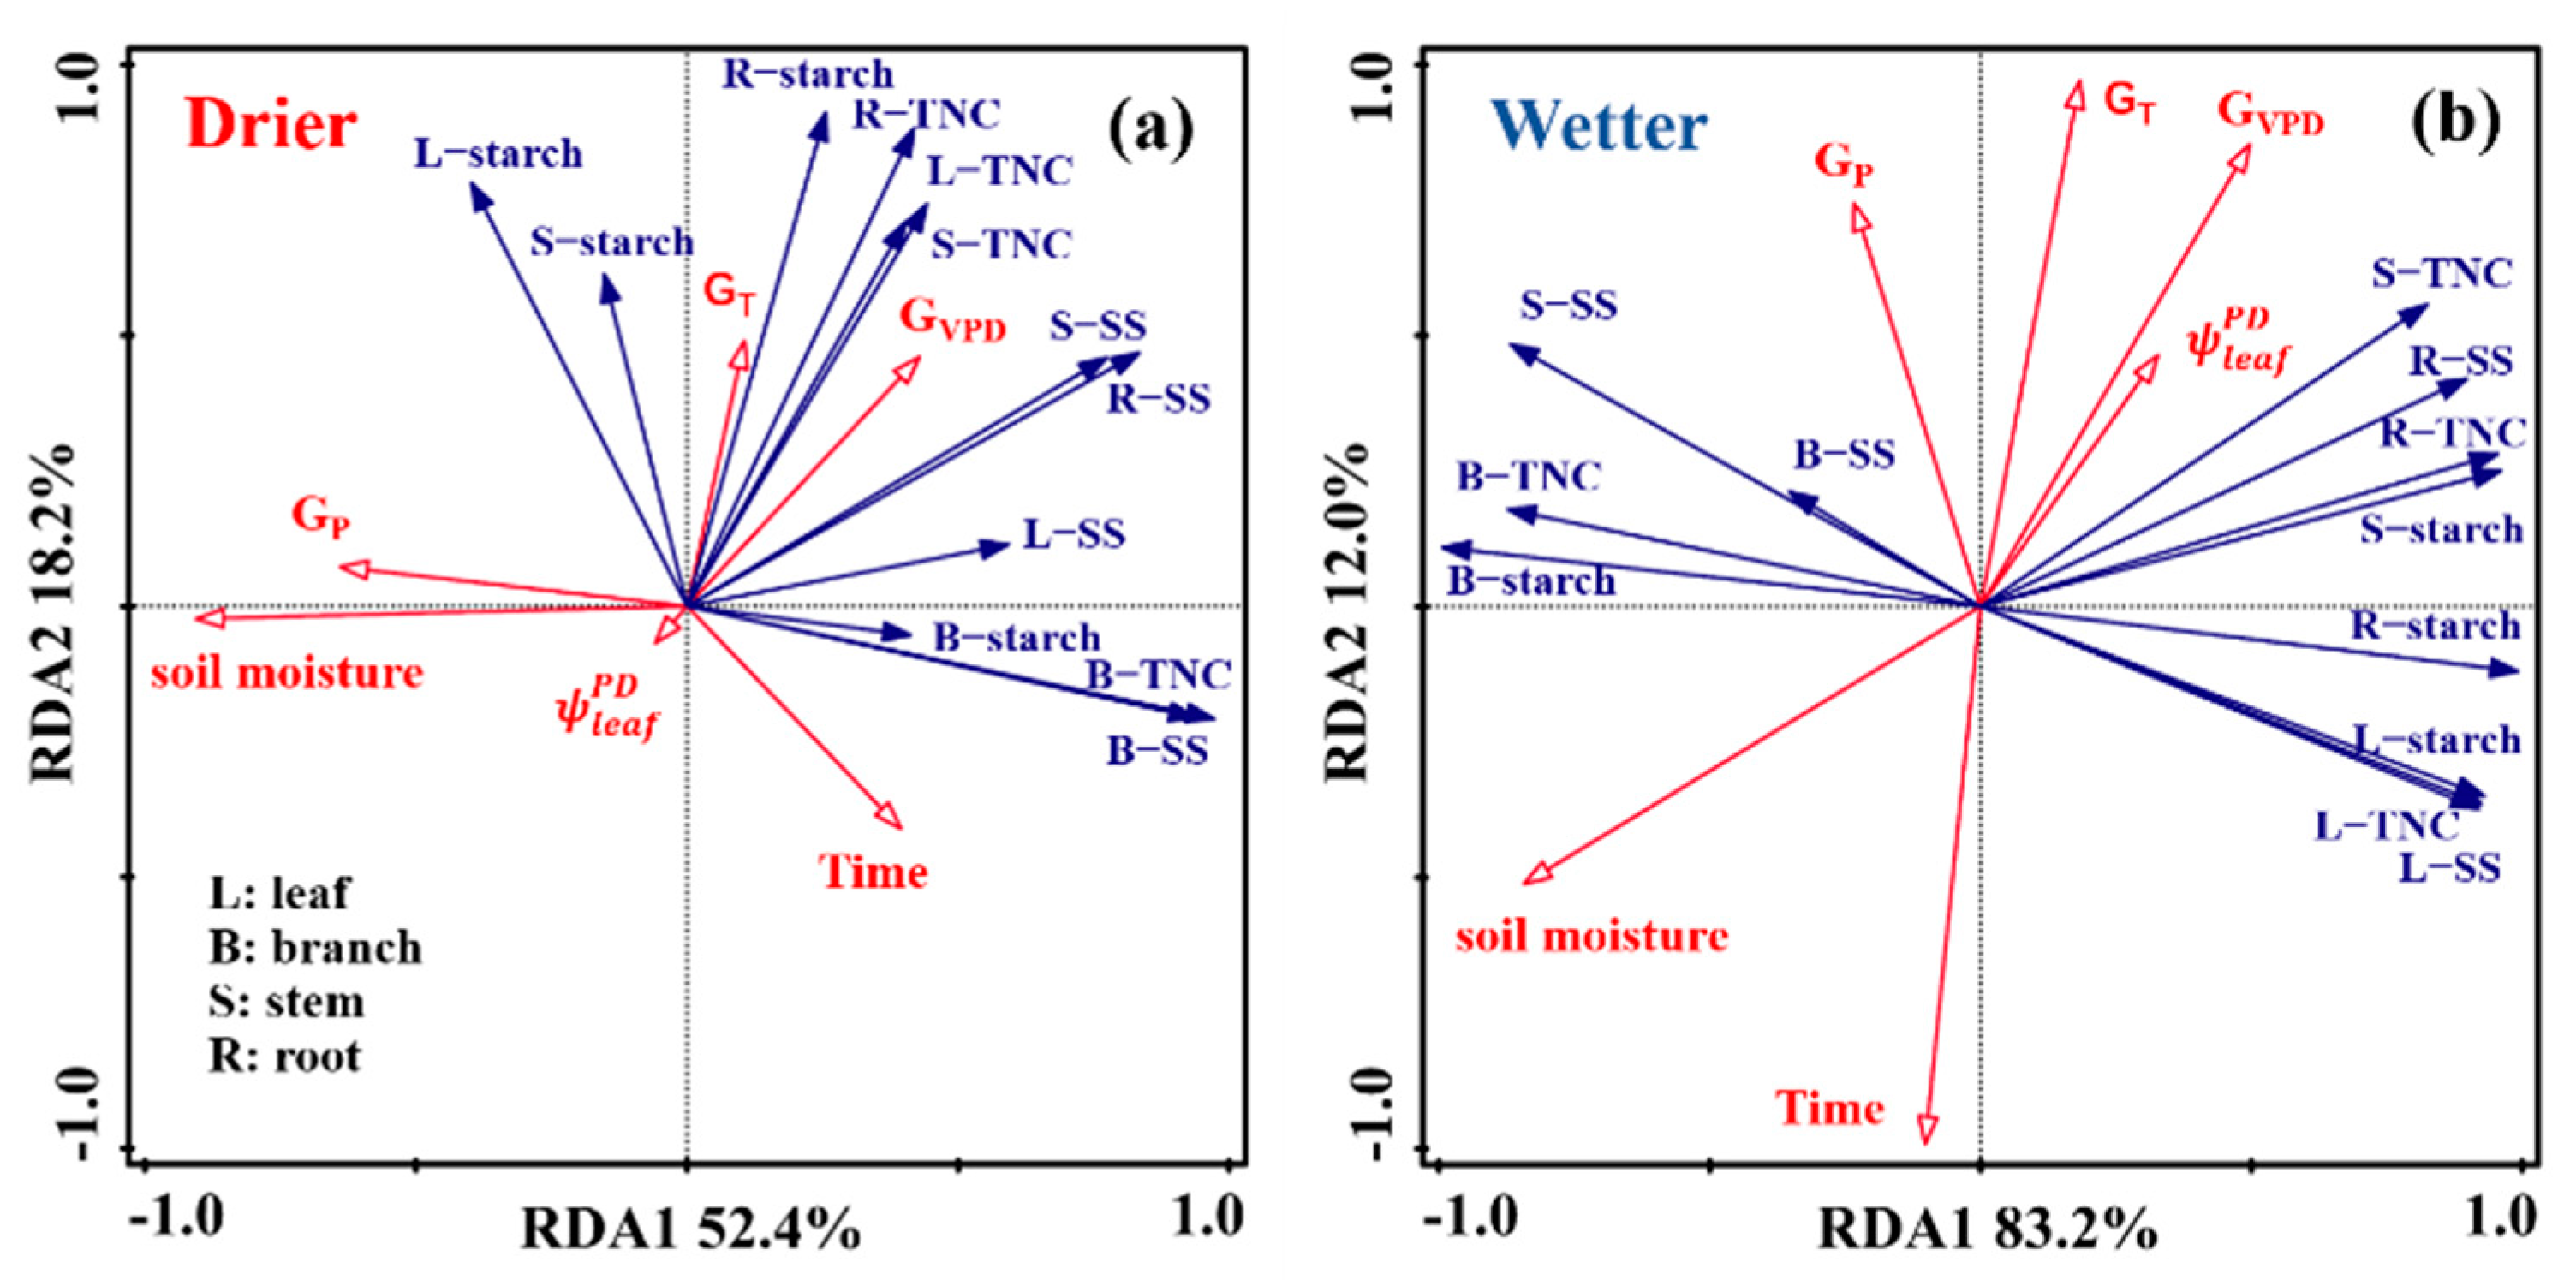
Constrained redundancy analysis (RDA) revealed that the effects of environmental factors on NSC concentrations in different organs are different between two groups of study sites. In drier sites (WLS and GLB), environmental variables accounted for 80.2% of the total variance in different components of NSCs, and the first two axes explained 70.6% of the total variance. Soluble sugars and TNC in leaves, stems and coarse roots were strongly and positively correlated to mean growing season VPD (GVPD), while starch in leaves, stems and coarse roots also showed positive correlations with mean growing season temperature (GT). Interestingly, both components of TNC were in general negatively correlated to total growing season precipitation (GP), soil moisture and predawn water potential ( Ψ l e a f P D ) in drier sites (Figure 5a). These findings indicate that NSC dynamics in drier sites were significantly controlled by variations in water availability.
In wetter sites (QLY and HDT), the first two axes explained 95.2% of the total variance in NSC dynamics among different organs. However, the relationship between NSCs and hydrothermal conditions (e.g., GVPD, GT, GP and soil moisture) in the wetter group is weaker than the drier group. NSCs in stems and coarse roots, except the soluble sugars in stems, generally exhibited positive correlation with predawn leaf water potential ( Ψ l e a f P D ). There was no significant correlation between NSC components and moisture (e.g., GVPD, GP and soil moisture) in the wetter group (Figure 5b). These findings imply that NSC dynamics in wetter sites are more closely correlated among soluble sugars, starch and TNC in leaves, branches and coarse roots, but were less influenced by hydrothermal conditions.

4. Discussion

4.1. Difference in Seasonal Dynamic of NSCs along the Precipitation Gradient

Tree TNC concentrations and the compositions exhibit marked seasonal changes [39]. The dynamics of TNCs were strongly influenced by environmental factors in addition to physiological strategies in our study, and TNC concentrations were affected significantly by environment water availability (Table 1). TNC concentrations were significantly increased by decreasing precipitation and increasing VPD, but showed no significant relationship with pre-dawn leaf water potential (Table 1), which means TNC concentrations were more constrained by the long-term environmental conditions than physiological factors during water limitations [21].
During the growing season, high variations of TNCs generally occurred in more metabolically active organs and low variations occurred in storage organs [40], demonstrating that significant effects of water deficit on TNCs were more common in leaves and coarse roots than in above-ground woody organs. At the late growing season, the driest and wettest sites had the highest and the lowest value of TNC and its components in leaves (Figure 2), respectively, indicating apparent positive effects of a water deficit on NSC accumulation in leaves, which is consistent with previous studies [18,21,40,41,42,43,44,45]. At drier sites, leaves tend to accumulate more soluble sugars and starch during the growing season (Figure 2; Figure S1), a common phenomenon found in previous studies [9,46,47], especially in evergreen species [40]. The drought increased soluble sugars in leaves, which might be consistent with their function of maintenance of osmotic potential in stressed conditions or obstructed transport to other organs as the result of drought-induced phloem transport impediment, and soluble sugars seemed to be more important in response to water stress than starch [3,20,48,49].
Water deficit had no significant effects on starch or TNC in above-ground woody organs (i.e., stems), while it decreased starch and TNC in coarse roots (Figure 2; Figure S1). The starch of coarse roots decreased from 4.20% to 3.07% and 1.60% in early, mid and late growing seasons, respectively, at the drier site (Figure S1B). Along with the growing season, TNC decreased from 5.41% to 3.96% and 2.40%, indicating that coarse roots are separated from the trans-allocation of TNC and can only be metabolized by using its own storage, a finding supported by the theory of transport impediment in leaves [48,49]. It seems to prove that roots first reach the threshold of carbon starvation and affect the absorption and transportation of water in plants [9].
Across all sampled sites, the highest TNC levels were found in leaves, followed by branches, stems and coarse roots, and the concentrations between organs were significantly different (Figure S2; Table 1, p = 0.015). However, the largest TNC pools are in stems or roots in most studies [6,50]. Leaves may represent a larger TNC pool in evergreen species, especially in conifers [6]. Considered as the “source” of TNCs, leaves can export photosynthetic products to other organs to support metabolism and production [51,52], and such allocation to organs seems to follow the distance priority. Some previous studies had illustrated that long distances from source (leaves) to sink organs may imply higher pathway resistance and hinder TNC transport, which could result in the same allocation pattern of TNCs across organs as our result [33,40,53].
The ratio of soluble sugars to starch showed a progressive increase in drier sites during the growing season, which was mainly caused by an increase in soluble sugars (Figures S1 and S3). Dynamics in the relative fractions of soluble sugars and starch in trees indicated temporal changes in priorities of the functions of TNC. In May, starch accounted for almost 70% in drier sites, and fell to 50% by the end of the growing season (Figure S3). It is a common response for trees growing in arid environments to convert starch into soluble sugars during the growing season [15,54,55,56]. This transformation allows trees to maintain hydraulic function, thereby increasing the resistance to water-deficit stress. As an active substance, soluble sugars derived from starch appear to be important for maintaining cell expansion and vascular integrity under drought [13,57], and they decrease osmotic potential by improving leaf water relations. This helps to maintain a water potential gradient between leaf, xylem and soil or even contributes to partial repair of xylem embolic [54]. Thus, the balance of TNCs between soluble sugars and starch has been considered as the coordination of hydraulic function or long-term storage in trees [27].

4.2. Spatial Pattern of Radial Growth and Limited by Precipitation Gradient

Stem radial growth is primarily driven by water availability, particularly in water-limited regions, in interplay with use and allocation of NSC reserves. Along the precipitation gradient, marked differences in the cessation timing of stem active growth appear. Trees in drier regions suffered earlier active growth cessation compared with trees in wetter regions (Figure 3; GLB: 7 August 2017, QLY: 27 August 2017; HDT: 28 September 2017). This pattern has been observed in dry conditions for many different tree species [57,58,59,60,61], that is, active growth ceased earlier, and carbon may distribute to other organs before the growing season finishes. This phenomenon was attributed partially to a seasonal trade-off between carbon storage and growth. For trees, the initial cessation of stem active growth may help reduce the decline of the carbon balance when carbohydrate supply is restricted by water limitation, and cause a carbon accumulation in leaves and other organs due to a faster decrease of growth than photosynthesis [3,6,24,49,58,62,63].
Some studies have identified three phases of drought based on the leaf water potential thresholds. In the first phase, radial growth ceases [31,61] as a consequence of high air temperature in combination with low soil moisture or less precipitation [13,57,64,65], secondly, photosynthesis ceases, and thirdly, hydraulic conductance becomes zero with mortality occurring subsequently [22]. Long-term water stress can lead to physiological acclimation; NSC reserves in trees can be transported to organs to build-up structural biomass and allow trees to cope with sudden stressful events, such as droughts, which are frequent in semi-arid forests. Thus, allocation to growth versus storage might underlie the trade-off between growth and survival in plants [66]. This is a strategy for trees to coordinate short-term growth and long-term survival. In drier conditions, photosynthetic products might be allocated to NSC storage at the mid to end of the growing season (i.e., August–October), and the early growing season has become an important phase for active radial growth of water stressed trees (Figure 3 and Figure S1) [13,67,68,69,70].

4.3. The Precipitation Gradient Drives a Divergent Relationship between NSCs and Water Availability

Water deficit affects the water potential of plants and the related processes, such as hydraulic water transport [40]. Leaf water potential is the most common physiological index used to measure the intensity of drought stress and drought resistance of plants. Daily dynamics of leaf water potential between different sites were consistent with previous studies (Figure 4), declined from dawn, and reached the lowest values at about noon [71]. At the early growing season, leaf water potential of the drier site GLB was relatively high, likely owing to the supplement of snowmelt caused by the rising temperature in spring [72,73], which alleviated the spring drought stress for trees growing in arid and semi-arid regions. With increased VPD caused by higher temperature and water demand for tree growth, leaf water potential gradually decreased in the mid and late growing season (Figure 4).
RDA analyses revealed a strong relationship between mean growing season VPD (GVPD) and temperature (GT) and different components of TNC at drier sites, whereas such a strong relationship disappeared in wetter sites (Figure 5). Many other factors, such as local environmental conditions (i.e., gradient and position of slope) and stand properties (e.g., stand density, health status of trees) could also affect the amount and allocation of TNC. However, it is still difficult to separate these effects since they often closely interplay [21,65]. The water demand of plants is largely influenced by the atmosphere dryness, which is closely associated with temperature and VPD. In drier sites, the correlation of TNC concentrations and GVPD is much stronger than predawn water potential or precipitation or soil moisture. This finding implies that the atmospheric water deficit seems to act as a more important factor in mediating TNC allocation than soil moisture as reported in previous studies [23,74,75].
Although the evidence for the coupling of NSCs and growth in this study is still limited, the hypothesis can be confirmed that NSC dynamics of trees growing in drier regions were more strongly influenced by water availability and appeared to be sensitive to atmospheric water deficit, as shown in the variations in soluble sugars and starch concentrations among different organs (Table 1; Figure 5). The divergent correlation between NSCs and water availability along the precipitation gradient cannot effectively reflect the potential adaption strategy of trees, which remains an open question. Therefore, it is urgent to understand the impacts of water deficit in the growing season together with increasing temperature on forest functioning in arid and semi-arid regions (i.e., hydraulic functions, traits, etc.), especially in future climate regimes (drier, warmer and more extreme) [5,66]. Further empirical research should address the potential divergent effects of water deficit on the physiological and functional processes underlying tree growth among different species, which could provide critical insight into the adaptability of different tree species to a warmer and drier climate regime.

5. Conclusions

By examining the relationships between NSCs and environmental factors, and spatial pattern of tree radial growth across pine forests along a large precipitation gradient, we found that active stem radial growth ceased much earlier under drier conditions. Whereas, water limitations could increase soluble sugars in leaves and decrease starch in coarse roots during the growing season. We further revealed that NSCs show a strong coupling with mean growing season temperature and VPD in drier sites, but such correlation disappeared in wetter sites. These results showed that a higher temperature induced increase in VPD may be an important factor for regulating the NSC allocations and the consequent tree radial growth in semi-arid regions of northern China.
This study provides a unique experimental design, showing the dynamics of NSC concentrations, allocations, stem radial growth and leaf water potential under different precipitation conditions in arid and semi-arid regions of northern China. However, our evidence only stemmed from single coniferous species. To understanding the mechanism of tree’s response to long-term water deficit better, further empirical research should address the potential divergent effects of water deficit on the physiological and functional processes underlying tree growth among different species, which could provide critical insight into the adaptability of different tree species to a warmer and drier climate regime.

Supplementary Materials

The following are available online at https://www.mdpi.com/1999-4907/12/2/133/s1, Figure S1: The dynamics of soluble sugars, starch and TNC at different organs in two group sites, Figure S2: Concentrations of TNC among different organs, Figure S3: Proportion of different components of TNC, Table S1: Basic information for four sampling sites, Table S2: The linear mixed-effect model (LME) results explaining the effects of different variables on influencing the TNC concentrations.

Author Contributions

Conceptualization, X.W.; Data curation, B.H.; Formal analysis, B.H.; Funding acquisition, H.L. and X.L.; Investigation, Y.L. and F.S.; Project administration, X.W.; Writing—original draft, B.H.; Writing—review & editing, H.H., H.L., F.S., K.Y., Z.L., P.W., C.D.A. and X.W. All authors have read and agreed to the published version of the manuscript.

Funding

This study is financially supported by National Natural Science Foundation of China (No. 41530747, 41571038, 41390462, 41922001) and the National Key Research and Development Program of the Ministry of Science and Technology of China (No. 2016YFD060020603).

Institutional Review Board Statement

Not applicable.

Informed Consent Statement

Not applicable.

Data Availability Statement

This study did not report any data.

Acknowledgments

Many thanks to Biao Wang and Zihe Zhang for helping the NSC experiments and Taoran Xu for her assistance in statistical methods.

Conflicts of Interest

The authors declare no conflict of interest.

References

  1. Adams, H.D.; Guardiola-Claramonte, M.; Barron-Gafford, G.A.; Villegas, J.C.; Breshears, D.D.; Zou, C.B.; Troch, P.A.; Huxman, T.E. Temperature sensitivity of drought-induced tree mortality portends increased regional die-off under global-change-type drought. Proc. Natl. Acad. Sci. USA 2009, 106, 7063–7066. [Google Scholar] [CrossRef] [PubMed] [Green Version]
  2. Allen, C.D.; Macalady, A.K.; Chenchouni, H.; Bachelet, D.; McDowell, N.; Vennetier, M.; Kitzberger, T.; Rigling, A.; Breshears, D.D.; Hogg, E.H.; et al. A global overview of drought and heat-induced tree mortality reveals emerging climate change risks for forests. For. Ecol. Manag. 2010, 259, 660–684. [Google Scholar] [CrossRef] [Green Version]
  3. McDowell, N.G. Mechanisms linking drought, hydraulics, carbon metabolism, and vegetation mortality. Plant Physiol. 2011, 155, 1051–1059. [Google Scholar] [CrossRef] [PubMed] [Green Version]
  4. Greenwood, S.; Ruiz-Benito, P.; Martinez-Vilalta, J.; Lloret, F.; Kitzberger, T.; Allen, C.D.; Fensham, R.; Laughlin, D.C.; Kattge, J.; Bonisch, G.; et al. Tree mortality across biomes is promoted by drought intensity, lower wood density and higher specific leaf area. Ecol. Lett. 2017, 20, 539–553. [Google Scholar] [CrossRef] [PubMed]
  5. McDowell, N.; Pockman, W.T.; Allen, C.D.; Breshears, D.D.; Cobb, N.; Kolb, T.; Plaut, J.; Sperry, J.; West, A.; Williams, D.G.; et al. Mechanisms of plant survival and mortality during drought: Why do some plants survive while others succumb to drought? New Phytol. 2008, 178, 719–739. [Google Scholar] [CrossRef]
  6. Hartmann, H.; Adams, H.D.; Hammond, W.M.; Hoch, G.; Landhausser, S.M.; Wiley, E.; Zaehle, S. Identifying differences in carbohydrate dynamics of seedlings and mature trees to improve carbon allocation in models for trees and forests. Environ. Exp. Bot. 2018, 152, 7–18. [Google Scholar] [CrossRef]
  7. Sala, A.; Piper, F.; Hoch, G. Physiological mechanisms of drought-induced tree mortality are far from being resolved. New Phytol. 2010, 186, 274–281. [Google Scholar] [CrossRef]
  8. Hartmann, H.; Bahn, M.; Carbone, M.; Richardson, A.D. Plant carbon allocation in a changing world—Challenges and progress: Introduction to a Virtual Issue on carbon allocation. New Phytol. 2020, 227, 981–988. [Google Scholar] [CrossRef]
  9. Garcia-Forner, N.; Sala, A.; Biel, C.; Save, R.; Martinez-Vilalta, J. Individual traits as determinants of time to death under extreme drought in Pinus sylvestris L. Tree Physiol. 2016, 36, 1196–1209. [Google Scholar] [CrossRef] [Green Version]
  10. Anderegg, W.R.; Hicke, J.A.; Fisher, R.A.; Allen, C.D.; Aukema, J.; Bentz, B.; Hood, S.; Lichstein, J.W.; Macalady, A.K.; McDowell, N.; et al. Tree mortality from drought, insects, and their interactions in a changing climate. New Phytol. 2015, 208, 674–683. [Google Scholar] [CrossRef]
  11. Xie, H.; Yu, M.; Cheng, X. Leaf non-structural carbohydrate allocation and C:N:P stoichiometry in response to light acclimation in seedlings of two subtropical shade-tolerant tree species. Plant Physiol. Biochem. 2018, 124, 146–154. [Google Scholar] [CrossRef] [PubMed]
  12. Li, M.H.; Xiao, W.F.; Shi, P.; Wang, S.G.; Zhong, Y.D.; Liu, X.L.; Wang, X.D.; Cai, X.H.; Shi, Z.M. Nitrogen and carbon source-sink relationships in trees at the Himalayan treelines compared with lower elevations. Plant Cell Environ. 2008, 31, 1377–1387. [Google Scholar] [CrossRef] [PubMed]
  13. Sala, A.; Woodruff, D.R.; Meinzer, F.C. Carbon dynamics in trees: Feast or famine? Tree Physiol. 2012, 32, 764–775. [Google Scholar] [CrossRef] [PubMed] [Green Version]
  14. Hummel, I.; Pantin, F.; Sulpice, R.; Piques, M.; Rolland, G.; Dauzat, M.; Christophe, A.; Pervent, M.; Bouteille, M.; Stitt, M.; et al. Arabidopsis plants acclimate to water deficit at low cost through changes of carbon usage: An integrated perspective using growth, metabolite, enzyme, and gene expression analysis. Plant Physiol. 2010, 154, 357–372. [Google Scholar] [CrossRef] [PubMed] [Green Version]
  15. Richardson, A.D.; Carbone, M.S.; Keenan, T.F.; Czimczik, C.I.; Hollinger, D.Y.; Murakami, P.; Schaberg, P.G.; Xu, X. Seasonal dynamics and age of stemwood nonstructural carbohydrates in temperate forest trees. New Phytol. 2013, 197, 850–861. [Google Scholar] [CrossRef] [PubMed] [Green Version]
  16. Chantuma, P.; Lacointe, A.; Kasemsap, P.; Thanisawanyangkura, S.; Gohet, E.; Clement, A.; Guilliot, A.; Ameglio, T.; Thaler, P. Carbohydrate storage in wood and bark of rubber trees submitted to different level of C demand induced by latex tapping. Tree Physiol. 2009, 29, 1021–1031. [Google Scholar] [CrossRef] [Green Version]
  17. Herrera-Ramirez, D.; Muhr, J.; Hartmann, H.; Romermann, C.; Trumbore, S.; Sierra, C.A. Probability distributions of nonstructural carbon ages and transit times provide insights into carbon allocation dynamics of mature trees. New Phytol. 2020, 226, 1299–1311. [Google Scholar] [CrossRef] [Green Version]
  18. Körner, C. Carbon limitation in trees. J. Ecol. 2003, 91, 4–17. [Google Scholar] [CrossRef] [Green Version]
  19. Woodruff, D.R.; Meinzer, F.C.; Marias, D.E.; Sevanto, S.; Jenkins, M.W.; McDowell, N.G. Linking nonstructural carbohydrate dynamics to gas exchange and leaf hydraulic behavior in Pinus edulis and Juniperus monosperma. New Phytol. 2015, 206, 411–421. [Google Scholar] [CrossRef]
  20. Yang, B.; Peng, C.; Harrison, S.P.; Wei, H.; Wang, H.; Zhu, Q.; Wang, M. Allocation Mechanisms of Non-Structural Carbohydrates of Robinia pseudoacacia L. Seedlings in Response to Drought and Waterlogging. Forests 2018, 9, 754. [Google Scholar] [CrossRef] [Green Version]
  21. Wurth, M.K.R.; Pelaez-Riedl, S.; Wright, S.J.; Korner, C. Non-structural carbohydrate pools in a tropical forest. Oecologia 2005, 143, 11–24. [Google Scholar] [CrossRef] [PubMed]
  22. Mitchell, P.J.; O’Grady, A.P.; Tissue, D.T.; White, D.A.; Ottenschlaeger, M.L.; Pinkard, E.A. Drought response strategies define the relative contributions of hydraulic dysfunction and carbohydrate depletion during tree mortality. New Phytol. 2013, 197, 862–872. [Google Scholar] [CrossRef] [PubMed]
  23. Adams, H.D.; Zeppel, M.J.B.; Anderegg, W.R.L.; Hartmann, H.; Landhausser, S.M.; Tissue, D.T.; Huxman, T.E.; Hudson, P.J.; Franz, T.E.; Allen, C.D.; et al. A multi-species synthesis of physiological mechanisms in drought-induced tree mortality. Nat. Ecol. Evol. 2017, 1, 1285–1291. [Google Scholar] [CrossRef] [PubMed]
  24. Muller, B.; Pantin, F.; Genard, M.; Turc, O.; Freixes, S.; Piques, M.; Gibon, Y. Water deficits uncouple growth from photosynthesis, increase C content, and modify the relationships between C and growth in sink organs. J. Exp. Bot. 2011, 62, 1715–1729. [Google Scholar] [CrossRef] [PubMed] [Green Version]
  25. Bacelar, E.A.; Santos, D.L.; Moutinho-Pereira, J.M.; Gonçalves, B.C.; Ferreira, H.F.; Correia, C.M. Immediate responses and adaptative strategies of three olive cultivars under contrasting water availability regimes: Changes on structure and chemical composition of foliage and oxidative damage. Plant Sci. 2006, 170, 596–605. [Google Scholar] [CrossRef]
  26. Hartmann, H.; Ziegler, W.; Kolle, O.; Trumbore, S. Thirst beats hunger—declining hydration during drought prevents carbon starvation in Norway spruce saplings. New Phytol. 2013, 200, 340–349. [Google Scholar] [CrossRef]
  27. Dietze, M.C.; Sala, A.; Carbone, M.S.; Czimczik, C.I.; Mantooth, J.A.; Richardson, A.D.; Vargas, R. Nonstructural Carbon in Woody Plants. Annu. Rev. Plant Biol. 2014, 65, 667–687. [Google Scholar] [CrossRef] [Green Version]
  28. O’Brien, M.J.; Leuzinger, S.; Philipson, C.D.; Tay, J.; Hector, A. Drought survival of tropical tree seedlings enhanced by non-structural carbohydrate levels. Nat. Clim. Chang. 2014, 4, 710–714. [Google Scholar] [CrossRef]
  29. Sala, A.; Mencuccini, M. Plump trees win under drought. Nat. Clim. Chang. 2014, 4, 666–667. [Google Scholar] [CrossRef]
  30. Sayer, M.A.S.; Haywood, J.D. Fine N production and carbohydrate concentrations of mature longleaf pine (Pinus palustris P. Mill.) as affected by season of prescribed fire and drought. Trees 2006, 20, 165–175. [Google Scholar] [CrossRef]
  31. Anderegg, W.R.L.; Anderegg, L.D.L. Hydraulic and carbohydrate changes in experimental drought-induced mortality of saplings in two conifer species. Tree Physiol. 2013, 33, 252–260. [Google Scholar] [CrossRef] [PubMed] [Green Version]
  32. Galiano, L.; Martinez-Vilalta, J.; Lloret, F. Carbon reserves and canopy defoliation determine the recovery of Scots pine 4 yr after a drought episode. New Phytol. 2011, 190, 750–759. [Google Scholar] [CrossRef] [PubMed]
  33. Piper, F.I. Drought induces opposite changes in the concentration of non-structural carbohydrates of two evergreen Nothofagus species of differential drought resistance. Ann. For. Sci. 2011, 68, 415–424. [Google Scholar] [CrossRef] [Green Version]
  34. Eamus, D.; Boulain, N.; Cleverly, J.; Breshears, D.D. Global change-type drought-induced tree mortality: Vapor pressure deficit is more important than temperature per se in causing decline in tree health. Ecol. Evol. 2013, 3, 2711–2729. [Google Scholar] [CrossRef] [PubMed]
  35. Aguade, D.; Poyatos, R.; Rosas, T.; Martinez-Vilalta, J. Comparative Drought Responses of Quercus ilex L. and Pinus sylvestris L. in a Montane Forest Undergoing a Vegetation Shift. Forests 2015, 6, 2505–2529. [Google Scholar] [CrossRef] [Green Version]
  36. He, W.; Liu, H.; Qi, Y.; Liu, F.; Zhu, X. Patterns in Nonstructural Carbohydrate Contents at the Tree Organ Level in Response to Drought Duration. Glob. Chang. Biol. 2020, 26, 3627–3638. [Google Scholar] [CrossRef]
  37. Dickman, L.T.; McDowell, N.G.; Sevanto, S.; Pangle, R.E.; Pockman, W.T. Carbohydrate dynamics and mortality in a pinon-juniper woodland under three future precipitation scenarios. Plant Cell Environ. 2015, 38, 729–739. [Google Scholar] [CrossRef]
  38. Gutiérrez, E.; Campelo, F.; Camarero, J.J.; Ribas, M.; Muntán, E.; Nabais, C.; Freitas, H. Climate Controls Act at Different Scales on the Seasonal Pattern of Quercus ilex L. Stem Radial Increments in NE Spain. Trees 2011, 25, 637–646. [Google Scholar] [CrossRef]
  39. Sevanto, S.; McDowell, N.G.; Dickman, L.T.; Pangle, R.; Pockman, W.T. How do trees die? A test of the hydraulic failure and carbon starvation hypotheses. Plant Cell Environ. 2014, 37, 153–161. [Google Scholar] [CrossRef]
  40. Cao, Y.; Li, Y.; Chen, Y. Non-structural carbon, nitrogen, and phosphorus between black locust and chinese pine plantations along a precipitation gradient on the Loess Plateau, China. Trees Struct. Funct. 2018, 32, 835–846. [Google Scholar] [CrossRef]
  41. Jyske, T.M.; Suuronen, J.-P.; Pranovich, A.V.; Laakso, T.; Watanabe, U.; Kuroda, K.; Abe, H. Seasonal variation in formation, structure, and chemical properties of phloem in Picea abies as studied by novel microtechniques. Planta 2015, 242, 613–629. [Google Scholar] [CrossRef] [PubMed]
  42. Kozlowski, T.T.; Pallardy, S.G. Acclimation and adaptive responses of woody plants to environmental stresses. Bot. Rev. 2002, 68, 270–334. [Google Scholar] [CrossRef]
  43. West, A.G.; Hultine, K.R.; Sperry, J.S.; Bush, S.E.; Ehleringer, J.R. Transpiration and hydraulic strategies in a pinon-juniper woodland. Ecol. Appl. 2008, 18, 911–927. [Google Scholar] [CrossRef] [Green Version]
  44. Sala, A.; Hoch, G. Height-related growth declines in ponderosa pine are not due to carbon limitation. Plant Cell Environ. 2009, 32, 22–30. [Google Scholar] [CrossRef] [PubMed]
  45. Galvez, D.A.; Landhaeusser, S.M.; Tyree, M.T. Root carbon reserve dynamics in aspen seedlings: Does simulated drought induce reserve limitation? Tree Physiol. 2011, 31, 250–257. [Google Scholar] [CrossRef]
  46. Landhäusser, S.M.; Lieffers, V.J. Defoliation increases risk of carbon starvation in root systems of mature aspen. Trees 2011, 26, 653–661. [Google Scholar] [CrossRef]
  47. Salleo, S.; Trifilò, P.; Esposito, S.; Nardini, A.; Lo Gullo, M.A. Starch-to-sugar conversion in wood parenchyma of field-growing Laurus nobilis plants: A component of the signal pathway for embolism repair? Funct. Plant Biol. 2009, 36, 815–825. [Google Scholar] [CrossRef]
  48. Zhang, H.; Wang, C.; Wang, X. Spatial variations in non-structural carbohydrates in stems of twelve temperate tree species. Trees 2013, 28, 77–89. [Google Scholar] [CrossRef]
  49. Kannenberg, S.A.; Phillips, R.P. Non-structural carbohydrate pools not linked to hydraulic strategies or carbon supply in tree saplings during severe drought and subsequent recovery. Tree Physiol. 2020, 40, 259–271. [Google Scholar] [CrossRef]
  50. Li, W.; Hartmann, H.; Adams, H.D.; Zhang, H.; Jin, C.; Zhao, C.; Guan, D.; Wang, A.; Yuan, F.; Wu, J. The sweet side of global change-dynamic responses of non-structural carbohydrates to drought, elevated CO2 and nitrogen fertilization in tree species. Tree Physiol. 2018, 38, 1706–1723. [Google Scholar] [CrossRef]
  51. Hoch, G.; Korner, C. The carbon charging of pines at the climatic treeline: A global comparison. Oecologia 2003, 135, 10–21. [Google Scholar] [CrossRef] [PubMed]
  52. Rennie, E.A.; Turgeon, R. A comprehensive picture of phloem loading strategies. Proc. Natl. Acad. Sci. USA 2009, 106, 14162–14167. [Google Scholar] [CrossRef] [PubMed] [Green Version]
  53. De Schepper, V.; De Swaef, T.; Bauweraerts, I.; Steppe, K. Phloem transport: A review of mechanisms and controls. J. Exp. Bot. 2013, 64, 4839–4850. [Google Scholar] [CrossRef] [PubMed] [Green Version]
  54. Piper, F.I.; Tjoelker, M. Decoupling between growth rate and storage remobilization in broadleaf temperate tree species. Funct. Ecol. 2020, 34, 1180–1192. [Google Scholar] [CrossRef]
  55. Nardini, A.; Salleo, S.; Jansen, S. More than just a vulnerable pipeline: Xylem physiology in the light of ion-mediated regulation of plant water transport. J. Exp. Bot. 2011, 62, 4701–4718. [Google Scholar] [CrossRef]
  56. Lemoine, R.; La Camera, S.; Atanassova, R.; Dedaldechamp, F.; Allario, T.; Pourtau, N.; Bonnemain, J.L.; Laloi, M.; Coutos-Thevenot, P.; Maurousset, L.; et al. Source-to-sink transport of sugar and regulation by environmental factors. Front. Plant. Sci. 2013, 4, 272. [Google Scholar] [CrossRef] [Green Version]
  57. Hartmann, H.; Ziegler, W.; Trumbore, S.; Knapp, A. Lethal drought leads to reduction in nonstructural carbohydrates in Norway spruce tree roots but not in the canopy. Funct. Ecol. 2013, 27, 413–427. [Google Scholar] [CrossRef]
  58. Zweifel, R.; Zimmermann, L.; Zeugin, F.; Newbery, D.M. Intra-annual radial growth and water relations of trees: Implications towards a growth mechanism. J. Exp. Bot. 2006, 57, 1445–1459. [Google Scholar] [CrossRef] [Green Version]
  59. Palacio, S.; Maestro, M.; Montserrat-Marti, G. Seasonal dynamics of non-structural carbohydrates in two species of Mediterranean sub-shrubs with different leaf phenology. Environ. Exp. Bot. 2007, 59, 34–42. [Google Scholar] [CrossRef]
  60. Delaporte, A.; Bazot, S.; Damesin, C. Reduced stem growth, but no reserve depletion or hydraulic impairment in beech suffering from long-term decline. Trees 2015, 30, 265–279. [Google Scholar] [CrossRef]
  61. Perez-de-Lis, G.; Olano, J.M.; Rozas, V.; Rossi, S.; Vazquez-Ruiz, R.A.; Garcia-Gonzalez, I. Environmental conditions and vascular cambium regulate carbon allocation to xylem growth in deciduous oaks. Funct. Ecol. 2017, 31, 592–603. [Google Scholar] [CrossRef] [Green Version]
  62. Gricar, J.; Zavadlav, S.; Jyske, T.; Lavric, M.; Laakso, T.; Hafner, P.; Eler, K.; Vodnik, D. Effect of soil water availability on intra-annual xylem and phloem formation and non-structural carbohydrate pools in stem of Quercus pubescens. Tree Physiol. 2019, 39, 222–233. [Google Scholar] [CrossRef] [PubMed]
  63. Ayub, G.; Smith, R.A.; Tissue, D.T.; Atkin, O.K. Impacts of drought on leaf respiration in darkness and light in Eucalyptus saligna exposed to industrial-age atmospheric Co2 and growth temperature. New Phytol. 2011, 190, 1003–1018. [Google Scholar] [CrossRef] [PubMed]
  64. Michelot-Antalik, A.; Granda, E.; Fresneau, C.; Damesin, C. Evidence of a seasonal trade-off between growth and starch storage in declining beeches: Assessment through stem radial increment, non-structural carbohydrate and intra-ring δ13C. Tree Physiol. 2019, 39, 831–844. [Google Scholar] [CrossRef] [PubMed]
  65. Steppe, K.; Sterck, F.; Deslauriers, A. Diel growth dynamics in tree stems: Linking anatomy and ecophysiology. Trends Plant Sci. 2015, 20, 335–343. [Google Scholar] [CrossRef] [Green Version]
  66. McDowell, N.G.; Allen, C.D.; Marshall, L. Growth, carbon-isotope discrimination, and drought-associated mortality across a Pinus ponderosa elevational transect. Glob. Chang. Biol. 2010, 16, 399–415. [Google Scholar] [CrossRef]
  67. Poorter, L.; Kitajima, K. Carbohydrate storage and light requirements of moist and dry forest tree species. Ecology 2007, 88, 1000–1011. [Google Scholar] [CrossRef]
  68. Barbaroux, C.; Bréda, N. Contrasting distribution and seasonal dynamics of carbohydrate reserves in stem wood of adult ring-porous sessile oak and diffuse-porous beech trees. Tree Physiol. 2002, 22, 1201–1210. [Google Scholar] [CrossRef]
  69. Palacio, S.; Hoch, G.; Sala, A.; Körner, C.; Millard, P. Does carbon storage limit tree growth? New Phytol. 2014, 201, 1096–1100. [Google Scholar] [CrossRef] [Green Version]
  70. Huang, J.; Hammerbacher, A.; Weinhold, A.; Reichelt, M.; Gleixner, G.; Behrendt, T.; van Dam, N.M.; Sala, A.; Gershenzon, J.; Trumbore, S.; et al. Eyes on the future—Evidence for trade-offs between growth, storage and defense in Norway spruce. New Phytol. 2019, 222, 144–158. [Google Scholar] [CrossRef]
  71. Janssen, T.; Fleischer, K.; Luyssaert, S.; Naudts, K.; Dolman, H. Drought resistance increases from the individual to the ecosystem level in highly diverse Neotropical rainforest: A meta-analysis of leaf, tree and ecosystem responses to drought. Biogeosciences 2020, 17, 2621–2645. [Google Scholar] [CrossRef]
  72. Francon, L.; Corona, C.; Till-Bottraud, I.; Choler, P.; Carlson, B.Z.; Charrier, G.; Améglio, T.; Morin, S.; Eckert, N.; Roussel, E.; et al. Assessing the Effects of Earlier Snow Melt-out on Alpine Shrub Growth: The Sooner the Better? Ecol. Indic. 2020, 115, 106455. [Google Scholar] [CrossRef]
  73. Wu, X.C.; Li, X.Y.; Liu, H.Y.; Ciais, P.; Li, Y.Q.; Xu, C.Y.; Babst, F.; Guo, W.C.; Hao, B.Y.; Wang, P.; et al. Uneven Winter Snow Influence on Tree Growth across Temperate China. Glob. Chang. Biol. 2018, 25, 144–154. [Google Scholar] [CrossRef] [Green Version]
  74. Rosas, T.; Galiano, L.; Ogaya, R.; Penuelas, J.; Martinez-Vilalta, J. Dynamics of non-structural carbohydrates in three Mediterranean woody species following long-term experimental drought. Front. Plant Sci. 2013, 4, 400. [Google Scholar] [CrossRef] [Green Version]
  75. Park Williams, A.; Allen, C.D.; Macalady, A.K.; Griffin, D.; Woodhouse, C.A.; Meko, D.M.; Swetnam, T.W.; Rauscher, S.A.; Seager, R.; Grissino-Mayer, H.D.; et al. Temperature as a potent driver of regional forest drought stress and tree mortality. Nat. Clim. Chang. 2012, 3, 292–297. [Google Scholar] [CrossRef]
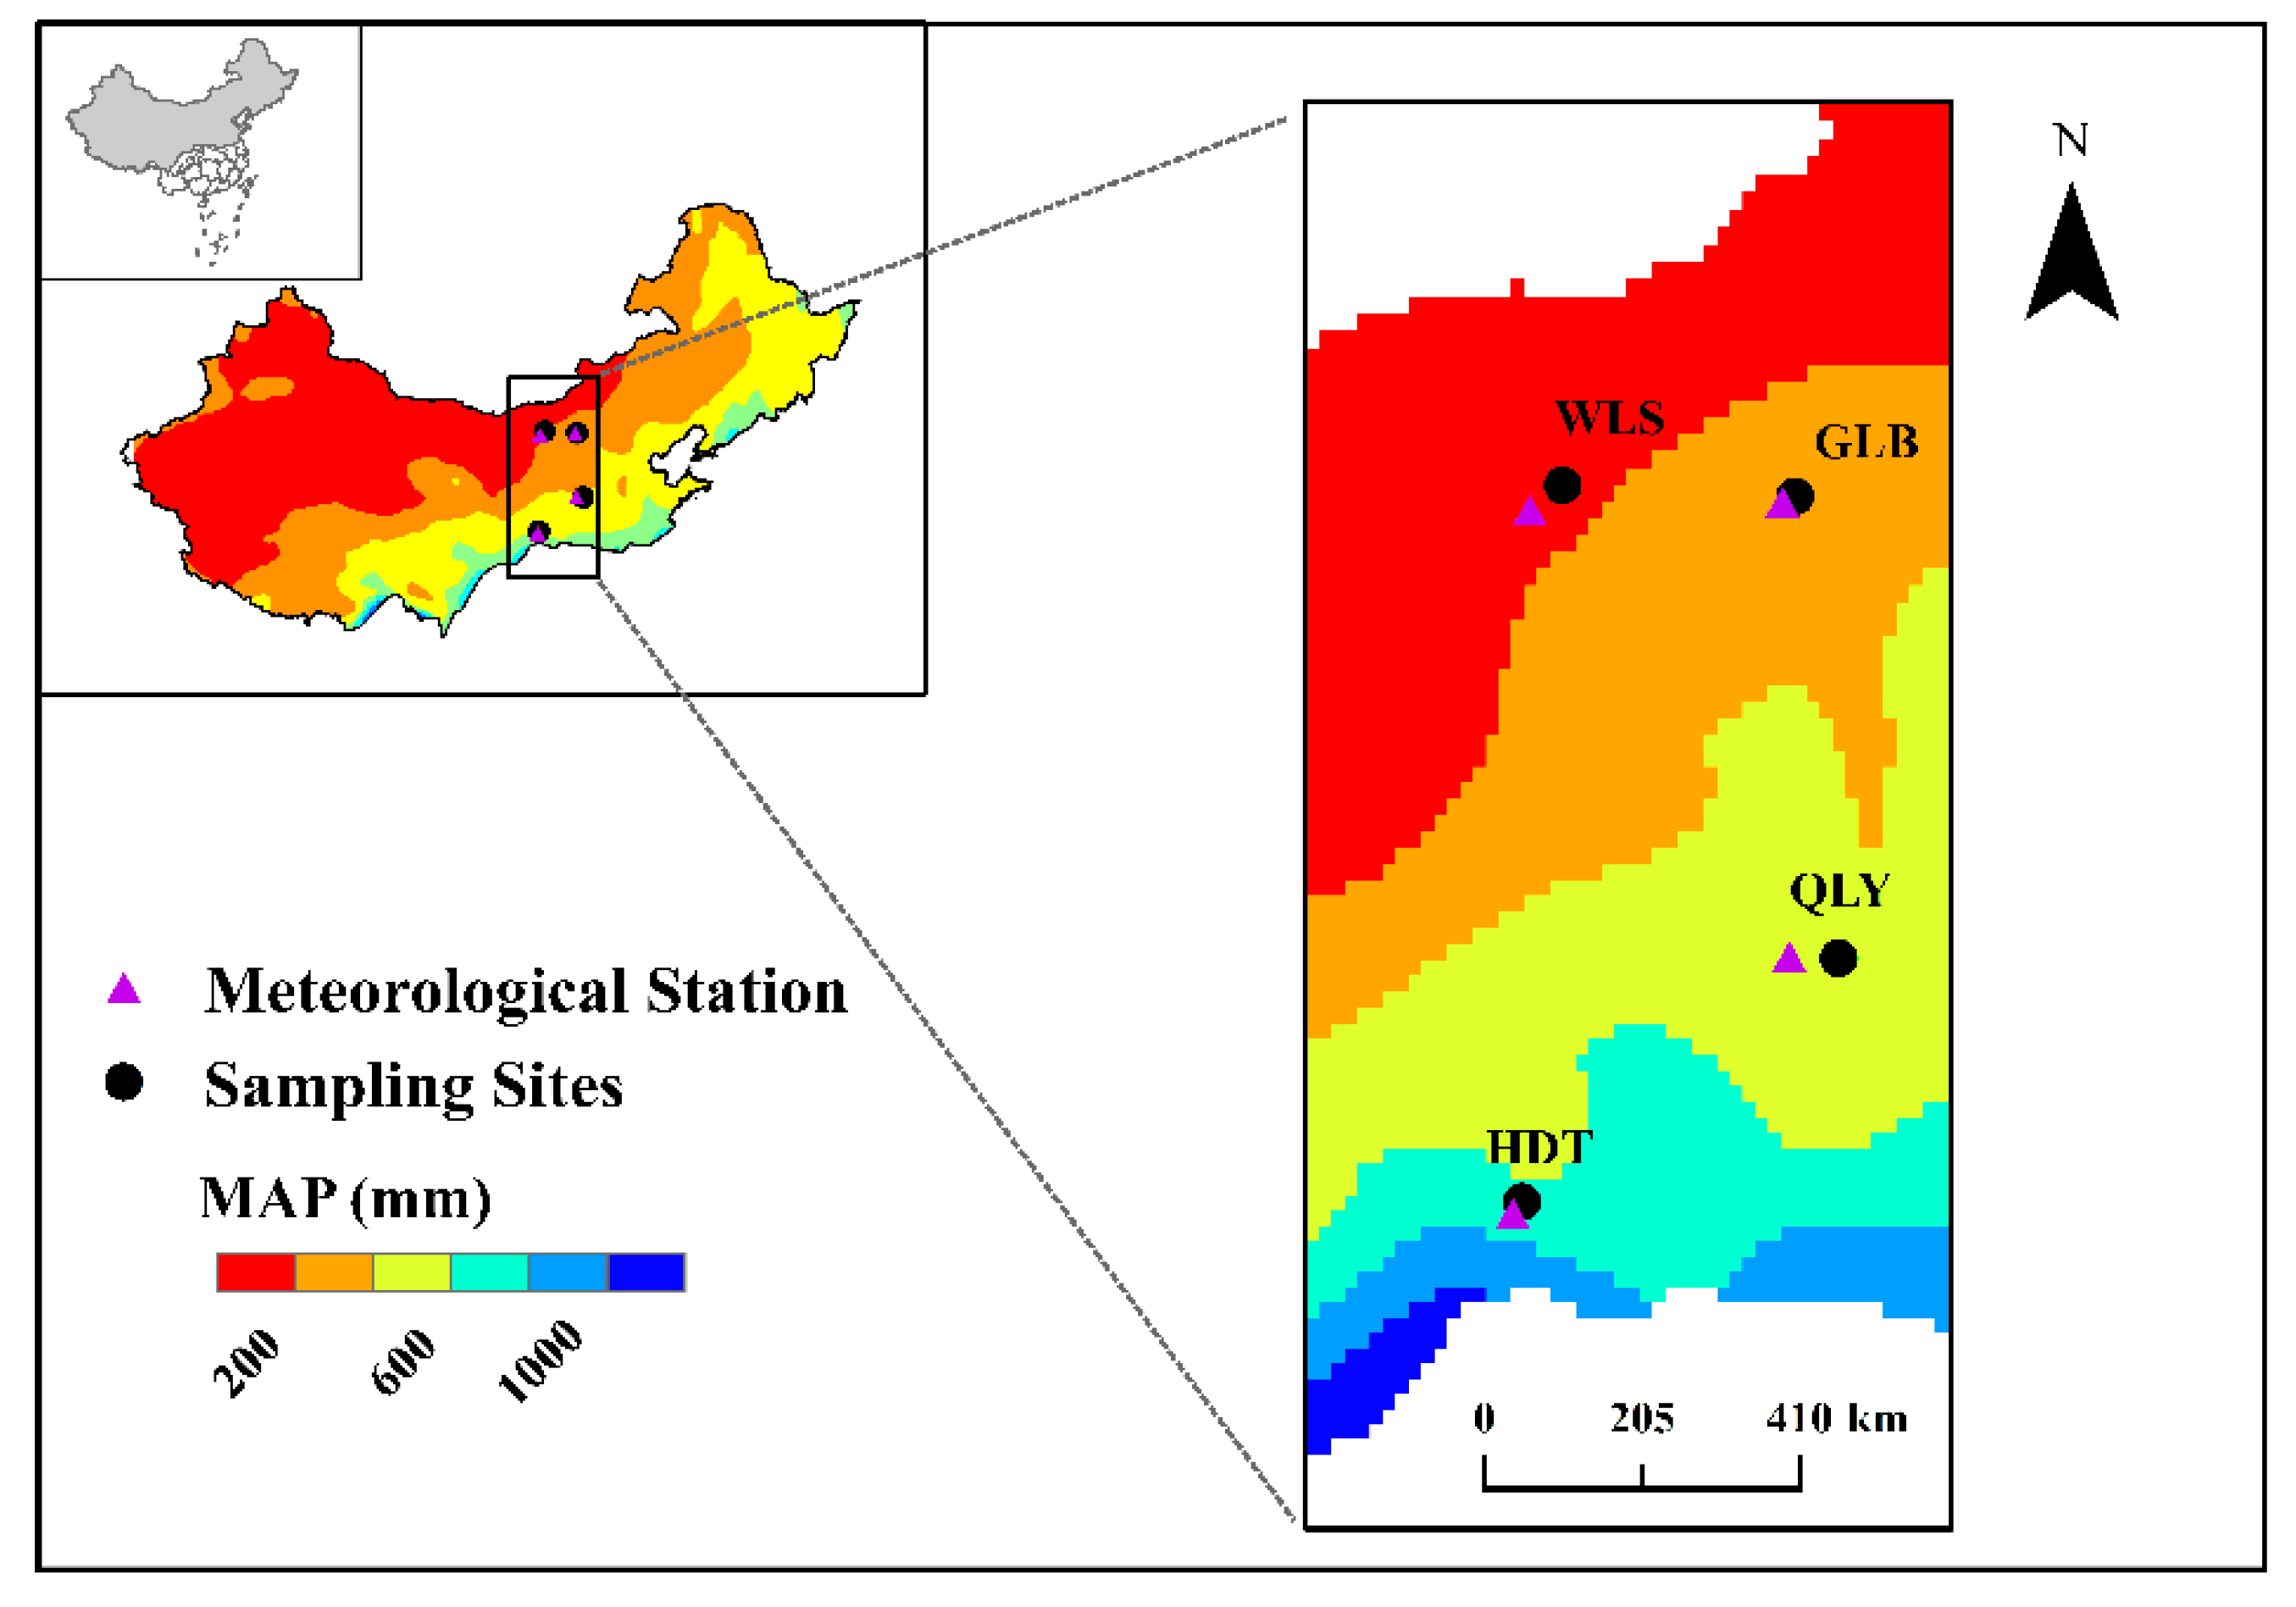
Figure 1. Locations of four sampling sites in northern China. Different colors indicate the differences in mean annual precipitation (MAP, multi-year average based on Climate Research Unit. http://www.cgiar-csi.org/).
Forests 12 00133 g001
Figure 2. Seasonal variations in NSC concentrations among different organs across study sites in 2017 (WLS was not sampled in October). Results are shown for (A) Soluble Sugars, (B) Starch and (C) TNC. The error bars represent ± SD (n = 6 per organ). Letters represent the results of ANOVA between different sites (α = 0.05, only marked for significant differences, and not marked for no difference).
Forests 12 00133 g002
Figure 3. Cumulative stem radial growth of Pinus tabulaeformis Carr. in 2017 (9 June–10 October 2017) at three study sites (WLS was not analyzed). Short arrow represents the most likely period of active growth cessation in the growing season calculated by Gutierrez [38]. The grey areas are the 95% confidence limits. DOY: day of the year. Annual precipitation is also shown in the figure.
Forests 12 00133 g003
Figure 4. Diurnal patterns of leaf water potential during the growing season in 2017 (GLB measured in May only). N = three leaves per tree in WLS and GLB, five leaves per tree in QLY and HDT. Means ± SD are presented. Different letters represent significant differences in Ψleaf among different sites in each measuring time according to Duncan’s test (α = 0.05).
Forests 12 00133 g004
Figure 5. Effects of environmental factors (red vectors) on NSC components (blue vectors) based on redundancy analysis (RDA) in drier (a) and wetter sites (b). GT: mean growing season temperature; GP: total growing season precipitation;   Ψ l e a f P D : predawn leaf water potential; GVPD: mean growing season VPD; SS: soluble sugars. All climate data were calculated based on monthly observations at relevant meteorological stations or remote sensing.
Forests 12 00133 g005
Table 1. The linear mixed-effect model (LME) results explaining the effects of different variables on influencing the TNC concentrations TNC: total non-structural carbohydrate.
Fixed EffectsEstimatesSEpRandomSD
Intercept1.7890.180<0.0001Sampling year0.220
Site0.0250.0340.041Sampling ID<0.0001
Time0.1030.0630.036
Organ−0.0150.0160.015
Pre−1.3590.027<0.0001
VPD1.4580.064<0.0001
Tem−0.4500.031<0.0001
Ψ l e a f P D −0.0530.0300.594
Pre × VPD0.5060.031<0.0001
Pre × Tem−0.3770.043<0.0001
VPD × Tem−0.3570.040<0.0001
Pre × VPD × Tem−0.2970.040<0.0001
Model: TNC~Site + Time + Organ + Pre × VPD × Tem + Ψ l e a f P D . Random = Sampling year, Sampling ID. Note: Organ (sampling organs of NSCs), Pre (monthly precipitation), VPD (monthly VPD), Tem (monthly temperature), based on the data of sampled month derived from the meteorological station; Ψ l e a f P D (pre-dawn leaf water potential). SE: Standard Error, SD: Standard Deviation.
Publisher’s Note: MDPI stays neutral with regard to jurisdictional claims in published maps and institutional affiliations.