Article

Remarkable Effects of Urbanization on Forest Landscape Multifunctionality in Urban Peripheries: Evidence from Liaoyuan City in Northeast China

1
College of Geography and Environmental Science, Hainan Normal University, Haikou 571158, China
2
Office of Academic Affairs, Yanbian University, Yanji 133002, China
3
Key Laboratory of Wetland Ecology and Management, Northeast Institute of Geography and Agroecology, Chinese Academy of Sciences, Changchun 130102, China
4
Key Laboratory of Forest Ecology and Management, Institute of Applied Ecology, Chinese Academy of Sciences, Shenyang 110016, China
5
University of Chinese Academy of Sciences, Beijing 100049, China
*
Author to whom correspondence should be addressed.
Forests 2021, 12(12), 1779; https://doi.org/10.3390/f12121779
Submission received: 26 November 2021 / Revised: 7 December 2021 / Accepted: 10 December 2021 / Published: 15 December 2021
(This article belongs to the Special Issue Forest Biodiversity and Ecosystem Stability)

Abstract

:
Forest landscape multifunctionality (FLM) provides multiple benefits, such as climate regulation, water storage, and biodiversity maintenance. However, the external factors limiting FLM have not been fully identified, although addressing them could contribute to sustainable development. The present study aimed to identify and quantify the role of urbanization as an external factor that affects FLM. To this end, impervious area changes in Liaoyuan, China, were observed from 2000 to 2018, and 10 buffer zones at 500 m intervals were established outside the city. Within each buffer zone, we analyzed changes in forest landscape functions, including habitat maintenance, carbon sequestration, and water yield, as well as changes in the multifunctionality of their composition. The urbanization of Liaoyuan was significant in 2000–2018. The functions of the forest landscape became stronger and more stable as they were located further away from the urban edge. We refer to this pattern as the gradient effect of urbanization. Specifically, urbanization affected the investigated functions at a distance of 1000–2500 m. The FLM showed a more significant gradient effect of urbanization. The impact distance of urbanization on the FLM increased from 3000 m in 2000 to over 5000 m in 2018. This impact distance increased significantly whenever urbanization strengthened significantly (i.e., in 2005–2010 and 2015–2018). These findings are instructive for forest and urban managers working to achieve multiple Sustainable Development Goals.

1. Introduction

Forest landscapes cover approximately one-third of the planet’s terrestrial area and have become an important vehicle for human living and sustainable development with their rich functions [1,2,3,4]. Forest landscapes play an irreplaceable role in preserving soil and water resources, maintaining a healthy atmosphere, and preserving plant and animal biodiversity [2,5,6,7,8]. Additionally, forest landscapes contribute significantly to the economy, as approximately 410 million people depend on forestry-relevant jobs, such as logging and wood processing, for their livelihoods and income [9]. These benefits are functions of forest landscapes that advance multiple Sustainable Development Goals (SDGs), such as No Poverty, Climate Action, and Life on Land.
Forests are typically managed for a specific subset of landscape functions that are prioritized by specific stakeholder groups. To achieve a “win–win” scenario in forest management, it is crucial to enhance forest landscape multifunctionality, through which multiple ecological and economic benefits (e.g., regulating air quality, storing water, preserving biodiversity, collecting timber) accrue to stakeholders [10]. Moreover, by enhancing the multifunctionality of the forest landscape, more synergistic forest landscape functions are preserved [11], which advance the comprehensive achievement of SDGs, such as preserving biodiversity, regulating air quality, and improving livelihood. To this end, several studies have assessed the multifunctionality of forest landscapes and have given insights in terms of research frameworks, cross-national comparisons, and influencing factors [10,12,13]. Additionally, they have made greater use of inventory data, thus explaining the factors influencing forest land multifunctionality (e.g., biodiversity, climate, stand age) [13,14,15]. However, urbanization as a potential influencing factor of forest landscape multifunctionality has not yet been considered in relevant practices and studies.
Urbanization is the most visible change that the land surface is undergoing and it has already affected the management, activity, and pattern of forest landscapes far from cities [16,17,18,19,20,21,22,23]. A recent study showed that urbanization has prolonged the period of vegetation activity in the urban periphery [16]. Accordingly, it can be predicted that forest landscape functions outside the city have also suffered the effects of urbanization. For example, the prolonged activity period of a forest landscape may have increased its annual carbon fixations, thus enhancing the carbon sequestration function of the forest landscape [24]. However, the water yield function of forest landscapes may decline because of the trade-off between it and the carbon sequestration function [25]. A decline in water yield functions may lead to a shortage of regional water resources. As a natural property, landscape multifunctionality is bound to change because of variations between single functions and their trade-offs with other functions [10]. Therefore, we urgently need to assess the impact of urbanization on the multifunctionality of forest landscapes, which is of importance to strengthen forest management and guarantee sustainable cities and communities.
In this study, we quantified the impact of urbanization on the multifunctionality of forest landscapes in the urban periphery. The area assessed is Liaoyuan, a city in northeastern China surrounded by temperate forest landscapes [26]. As the indicator of urbanization, we quantified the spatiotemporal changes of impervious surfaces in Liaoyuan city from 2000 to 2018. Additionally, we used robust methodologies to quantify the spatiotemporal variation of habitat maintenance, carbon sequestration, and water yield functions in forest landscapes within 5 km of the urban periphery. By combining these three functions, we found a gradient effect in the urbanization impact on the multifunctionality of the forest landscape. Our practice builds on research that focused on forest multifunctionality and the impact of urbanization on the land’s surface [16,27]. Additionally, our findings are instructive for managing forest landscapes and delineating the limiting boundaries of urban sprawl. Section 2 describes the method of this study; Section 3 declares the quantitative results; Section 4 records the contributions and limitations of this study; Section 5 summarizes the key points and findings of this study.

2. Materials and Methods
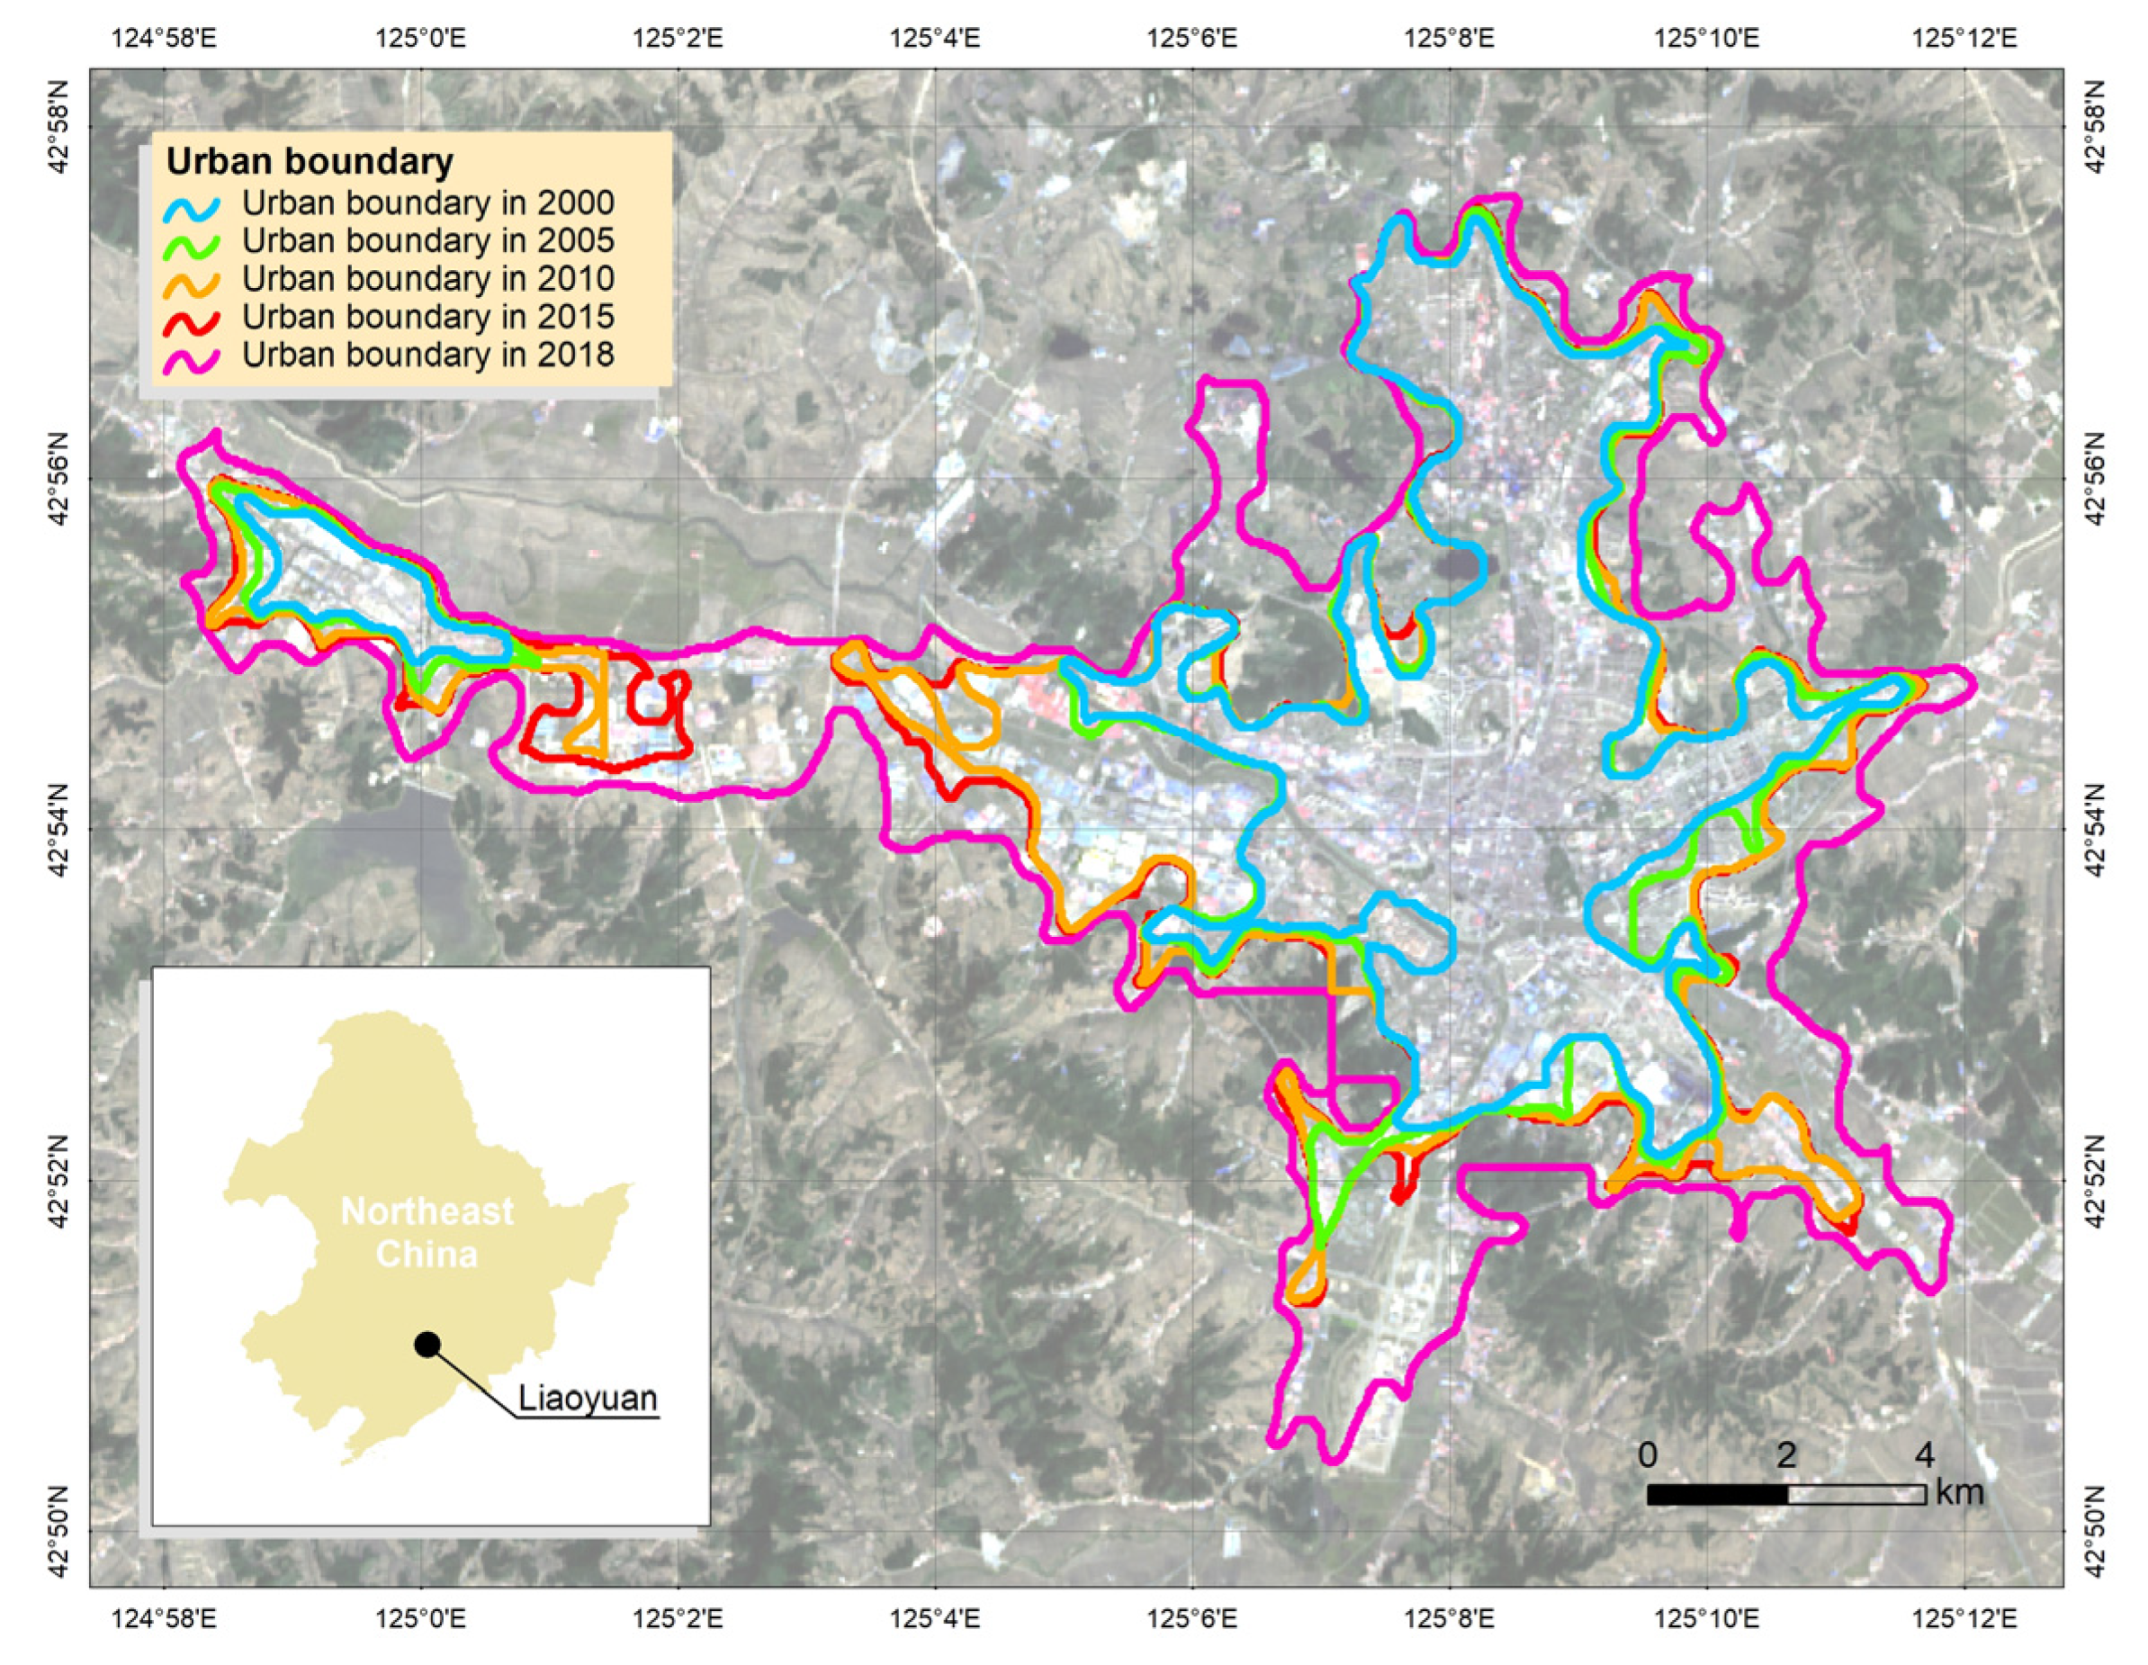
2.1. Study Area

Liaoyuan is a prefecture-level city in Northeast China. In this study, in order to accurately quantify the urbanization process, we specify that Liaoyuan City refers to the urban area where urban land expansion is most clear (Figure 1). To this end, global urban boundaries (GUB) data are used as the city boundaries from 2000 to 2018 [28]. Based on the GUB data, it is found that Liaoyuan urban area expanded in the form of outward expansion from 2000 to 2018. Especially in the western part of the city, the outward expansion of the city is spatially obvious. Specifically, the urban area of Liaoyuan City increased about 2.6 times from 2925 ha to 7732 ha during 2000–2018. Since Liaoyuan is located in the forest–agriculture ecotone of northeast China, urban expansion has encroached on the surrounding forest and agricultural landscapes [26]. In terms of forest landscapes, their landscape function has continued to decline in recent years, which raises the issues of insufficient water resources, deteriorating water quality, and loss of biodiversity. In addition, agricultural activities are frequent in Liaoyuan, which further exacerbates local environmental issues, such as point and surface pollutions. Besides water and biodiversity issues, the carbon sequestration function as a major element to guarantee the national carbon balance is also an important forest landscape function of local concerns. Therefore, it is important to assess the impact of urbanization on the multifunctionality of forest landscape to guide land use planning in Liaoyuan, which contributes to the ecological security and sustainable development of northeast China.

2.2. Data Collection

To achieve the assessment purpose, this study used a variety of data, including boundary data, land cover data, meteorological data, vegetation data, and soil data (Table 1). Except for the soil data and digital elevation model (DEM), the remaining data cover five years: 2000, 2005, 2010, 2015, and 2018.
The GUB data provides the spatial extent of urban areas, used for quantifying urbanization during the period considered [28]. The urbanization indicator is the change in impervious areas in the urban areas, where impervious area data are available in the China Land Cover Dataset (CLCD) [29]. In addition, we developed ten buffer zones at 500 m intervals outside the urban boundary for each year to assess the influencing range of urbanization on forest landscape functions. The distribution of forest landscapes within these buffer zones is available in the CLCD data.
Meteorological data are used to simulate landscape functions, where precipitation, temperature, and potential evapotranspiration data are available in the National Earth System Science Data Center, National Science & Technology Infrastructure of China. The solar radiation data are developed by interpolating from weather station data [30].
The soil depth, digital elevation, and vegetation index data are used to simulate landscape functions. The normalized vegetation index (NDVI) data are developed by calculating multispectral bands of Landsat images [27].
NDVI = ( b n b r ) / ( b n + b r )
where bn and br are the near-infrared band and red band of Landsat images, respectively. Finally, since the data are not consistent in terms of their spatial resolution, we re-sampled all the mentioned data into 100 m resolution to observe landscape changes and simulate landscape functions.

2.3. Quantification of Urbanization

As the preset influencing factor, the quantification of the spatiotemporal characteristic of urbanization in Liaoyuan is the research basis of this work (Figure 2). The assessment of urbanization can be achieved by quantifying the changes in impervious surface area, built-up area, and residential area [18,26,27,31]. In this study, as an indicator to assess urbanization, we quantified the change in the total area of urban impervious surfaces from 2000 to 2018 based on the CLCD data. In addition, to assess the change in the speed of urbanization over time, we defined four time periods, including 2000–2005, 2005–2010, 2010–2015, and 2015–2018 [1,26]. The speed of urbanization is equal to the difference in the total impervious surface area within each period.
U s = I n + 1 I n
where Us refers to the urbanization speed during a period. n is the base year, and n + 1 is the next investigating year. In+1 and In are the total area of urban impervious surfaces for the base year and the next investigating year, respectively.

2.4. Simulation of Forest Landscape Functions

Forest landscape is of significance for maintaining regional ecological security, timber security, and sustainable development [1,32,33]. In this study, we considered three forest landscape functions that are critically important for maintaining ecological security and sustainability in the study area, including habitat maintenance, carbon sequestration, and water yield (Figure 2). Furthermore, the methodologies for assessing these three functions are robust and have been applied in many relevant studies [34,35,36].
The habitat maintenance (HM) function refers to the ability of local forest landscape systems to maintain biodiversity. The present study assessed changes in HM functions between 2000–2018 using the Habitat Quality module of the Integrated Valuation of Ecosystem Services and Trade-offs (InVEST) model [35]. In this module, the mandatory input data include three categories: landscape type maps, threat data for maintaining habitat, and landscape sensitivity to threats. Maps of landscape types are available in the CLCD data. Threat data and sensitive data are determined by referring to the user manual of InVEST and related studies [35,37,38,39]. By investigating the landscape composition of the study area, we determined that the threat factors included cropland, impervious areas, and bare land. Table A1 shows the threat data and sensitive data used in this study. Equation (3) shows the basic formula for assessing HM function by InVEST.
HM = H j [ 1   ( D xj z D xj z + K z ) ]
where HM is the habitat maintenance function at pixel x of landscape type j. Dxj is the total threat level, and Hj is the habitat suitability. z is set as 2.5, and k is the half-saturation constant, which has been set as 0.5 in this study. The value of the output data ranges from 0 to 1, which shows the HM function from poor to good.
The carbon sequestration (CS) function of forest landscapes is important for maintaining regional climate security [6,26]. In northeast China in particular, where forest resources are abundant, forest CS function is a major component of achieving the national goal of carbon balance. To approximately represent the CS function, we simulated the net primary productivity (NPP) of the forest landscape based on the NPP module developed by [40]. In this module, the input data include NDVI, temperature, precipitation, solar radiation, landscape type, and auxiliary parameter data. The output data is of raster type in gC/m2, which represents the cumulative biomass of the forest landscape within the investigating year. NPP data are used to represent the CS function of the forest landscape [41].
The water yield (WY) function assesses the ability of the forest landscape to retain precipitation and supply water to the area of interest. We used the water yield module of InVEST to simulate the WY function of the forest landscape [7]. In this module, input data include precipitation, potential evapotranspiration, root depth, plant water content, landscape type maps, sub-watershed boundaries, and ancillary parameter data. Based on the water-heat balance theory, Equation (4) shows the basic formula for assessing WY function by InVEST.
Y ( x ) = [ 1   ( AET ( x ) P ( x ) ) ]   ×   P ( x )
where Y(x) refers to the water yield (mm) in pixel x. AET(x) and P(x) are actual evapotranspiration and precipitation in the investigating year, respectively. As one of the output data, AET(x) can be obtained by running the module. The output WY data is of raster type.

2.5. Quantification of Forest Landscape Multifunctionality

For this study, multifunctionality refers to the quantity and quality of functions that are simultaneously present in the forest landscape [34,35,37]. To quantify the simultaneous occurrence of the different landscape functions, we normalized the investigating functions (i.e., HM, CS, and WY) into a domain of values from 0 to 1. In addition, we divide each normalized function into five qualities into 20% intervals from low to high and assigned a value of 1 to 5, respectively [34]. By spatially overlaying these quality data, we obtained a multifunctionality map of the forest landscape for each year.
MF x = n = 1 k f kx
where MFx refers to the multifunctionality of forest pixel x and the value range of MFx is from 1 to 15, k is the number of investigation functions, and fkx refers to the value of reclassified function k in pixel x. The output MF data are of raster type, which are used to assess the quality of the multifunctionality of the forest landscape in each year.
In addition, we assume that the distance of urbanization effects on the multifunctionality of urban peripheral forest landscape varies over time. A robust method to verify this hypothesis is the buffer analysis that has been applied in related studies [16,21]. Through buffer analysis, we quantified the distance of the impact of urbanization on forest multifunctionality for each year (Figure 2). To ensure that sufficient forest landscapes were included in each distance for analysis, we established 10 buffer zones at 500 m intervals around the city. In each buffer zone, the mean values (i.e., multifunctionality index) of forest landscape multifunctionality are counted and mapped to a two-dimensional scatter plot (Figure 3a). Since the multifunctional index (MFI) first grows and then stabilizes with distance, we fitted this scatter plot using an exponential function (Equation (6), Figure 3a).
y = y 0 + A e R 0 x
where e is the natural constant. In addition, y0, A, and R0 are correction parameters. Each fitting process is iterative, and its stopping condition is that it reached the significance level (i.e., p < 0.001).
To find the transition point of the MFI from increase to stable, the derivatives of each MFI point are computed and mapped into a two-dimensional scatter plot (Figure 3b). When the derivative is very close to 0 for the first time, we define this MFI point as the transition point. Accordingly, the x-axis coordinate of the MFI transition point is the influencing range (in meters) of urbanization on the forest landscape multifunctionality in the urban periphery (Figure 3b).

3. Results

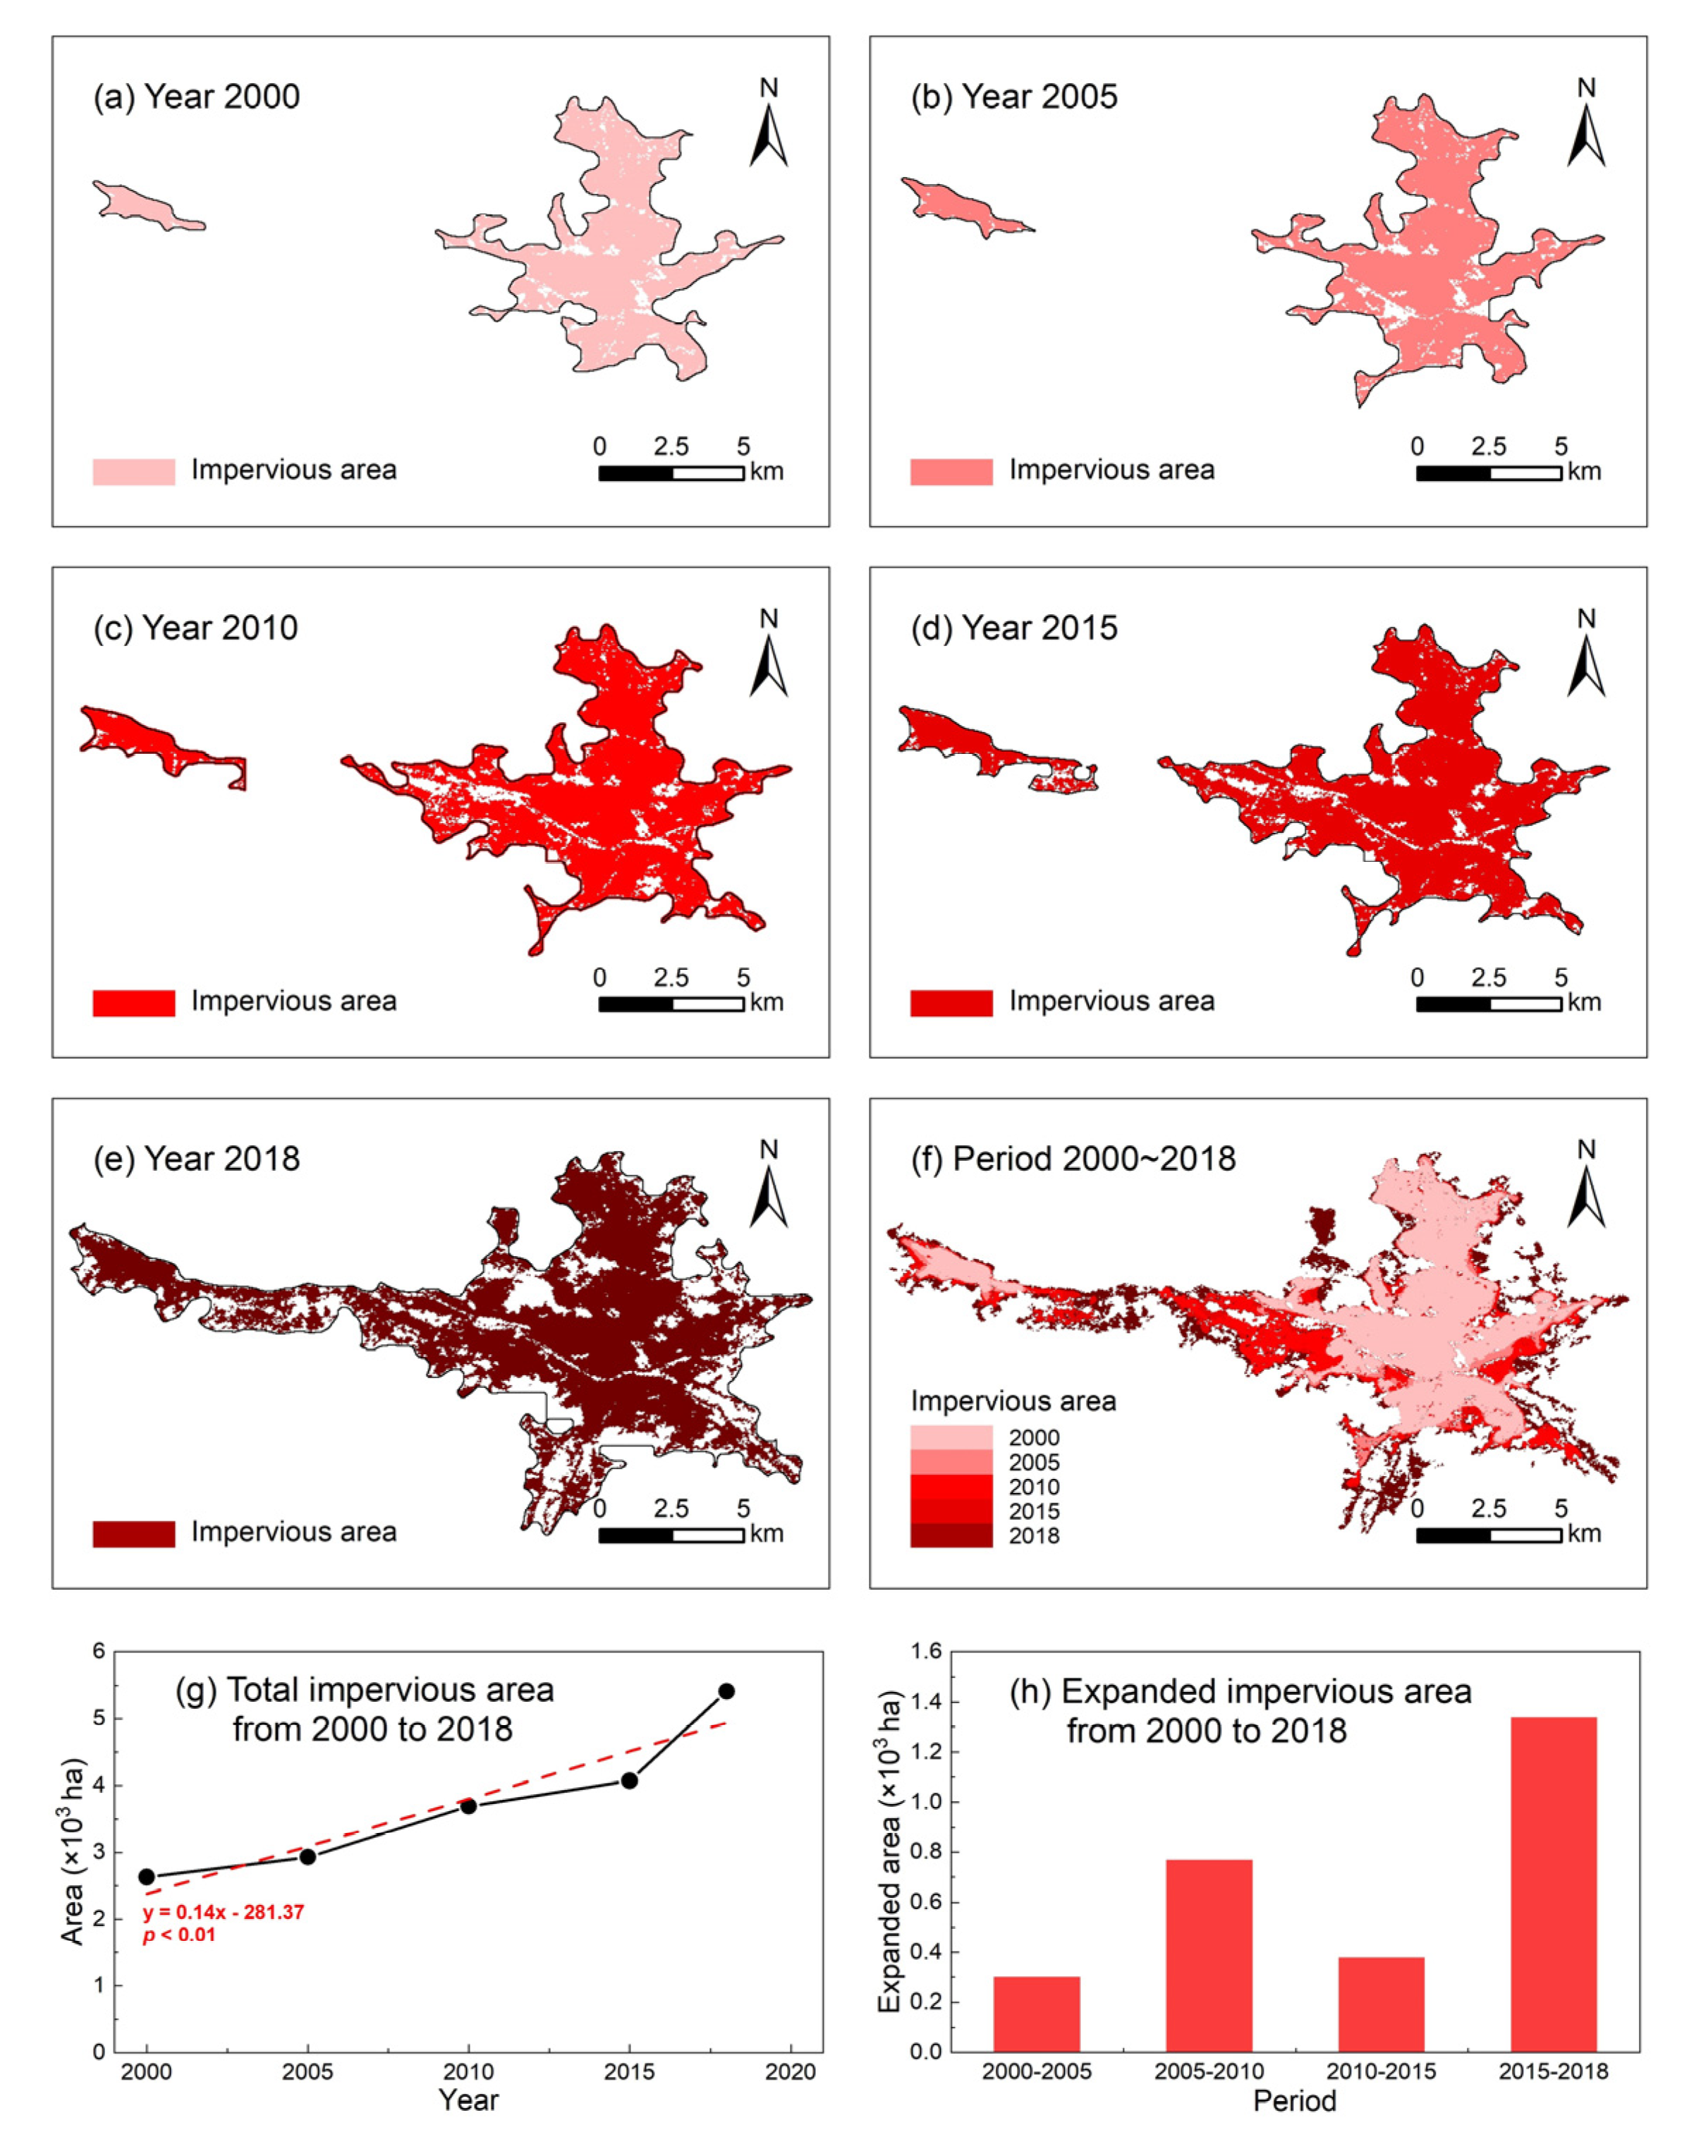
3.1. Urbanization of Liaoyuan City from 2000 to 2018

With the expansion of the urban boundary, the urbanization of Liaoyuan city was significant during 2000–2018 (Figure 4). From 2000 to 2015, urbanization grew only in the eastern and western sides of Liaoyuan, with the eastern side having a larger impervious area (Figure 4a,b,d). However, by 2018, the east and west sides were connected as one entity (Figure 4e). By overlying the impervious area per year, it is found that the urbanization characteristic of Liaoyuan city is an outward expansion, of which the expansion center is the midrange between the east and west sides (Figure 4f).
The total impervious areas in Liaoyuan were 2625 ha, 2925 ha, 3693 ha, 4071 ha, and 5410 ha in 2000, 2005, 2010, 2015, and 2018, respectively. The fitting line shows that the impervious area increased by approximately 140 ha per year (Figure 4g). Despite the significant urbanization (p < 0.01), the speed of urbanization has changed across periods in Liaoyuan (Figure 4g,h). The impervious area increased the most during 2005–2010 and 2015–2018, by 154 ha and 446 ha, respectively (Figure 4h). In contrast, the growth of the impervious area was 60 ha and 76 ha during 2000–2005 and 2010–2015, respectively. Together, the urbanization speed of Liaoyuan city switched frequently between slow and fast from 2000 to 2018, with the interval being 3 to 5 years.

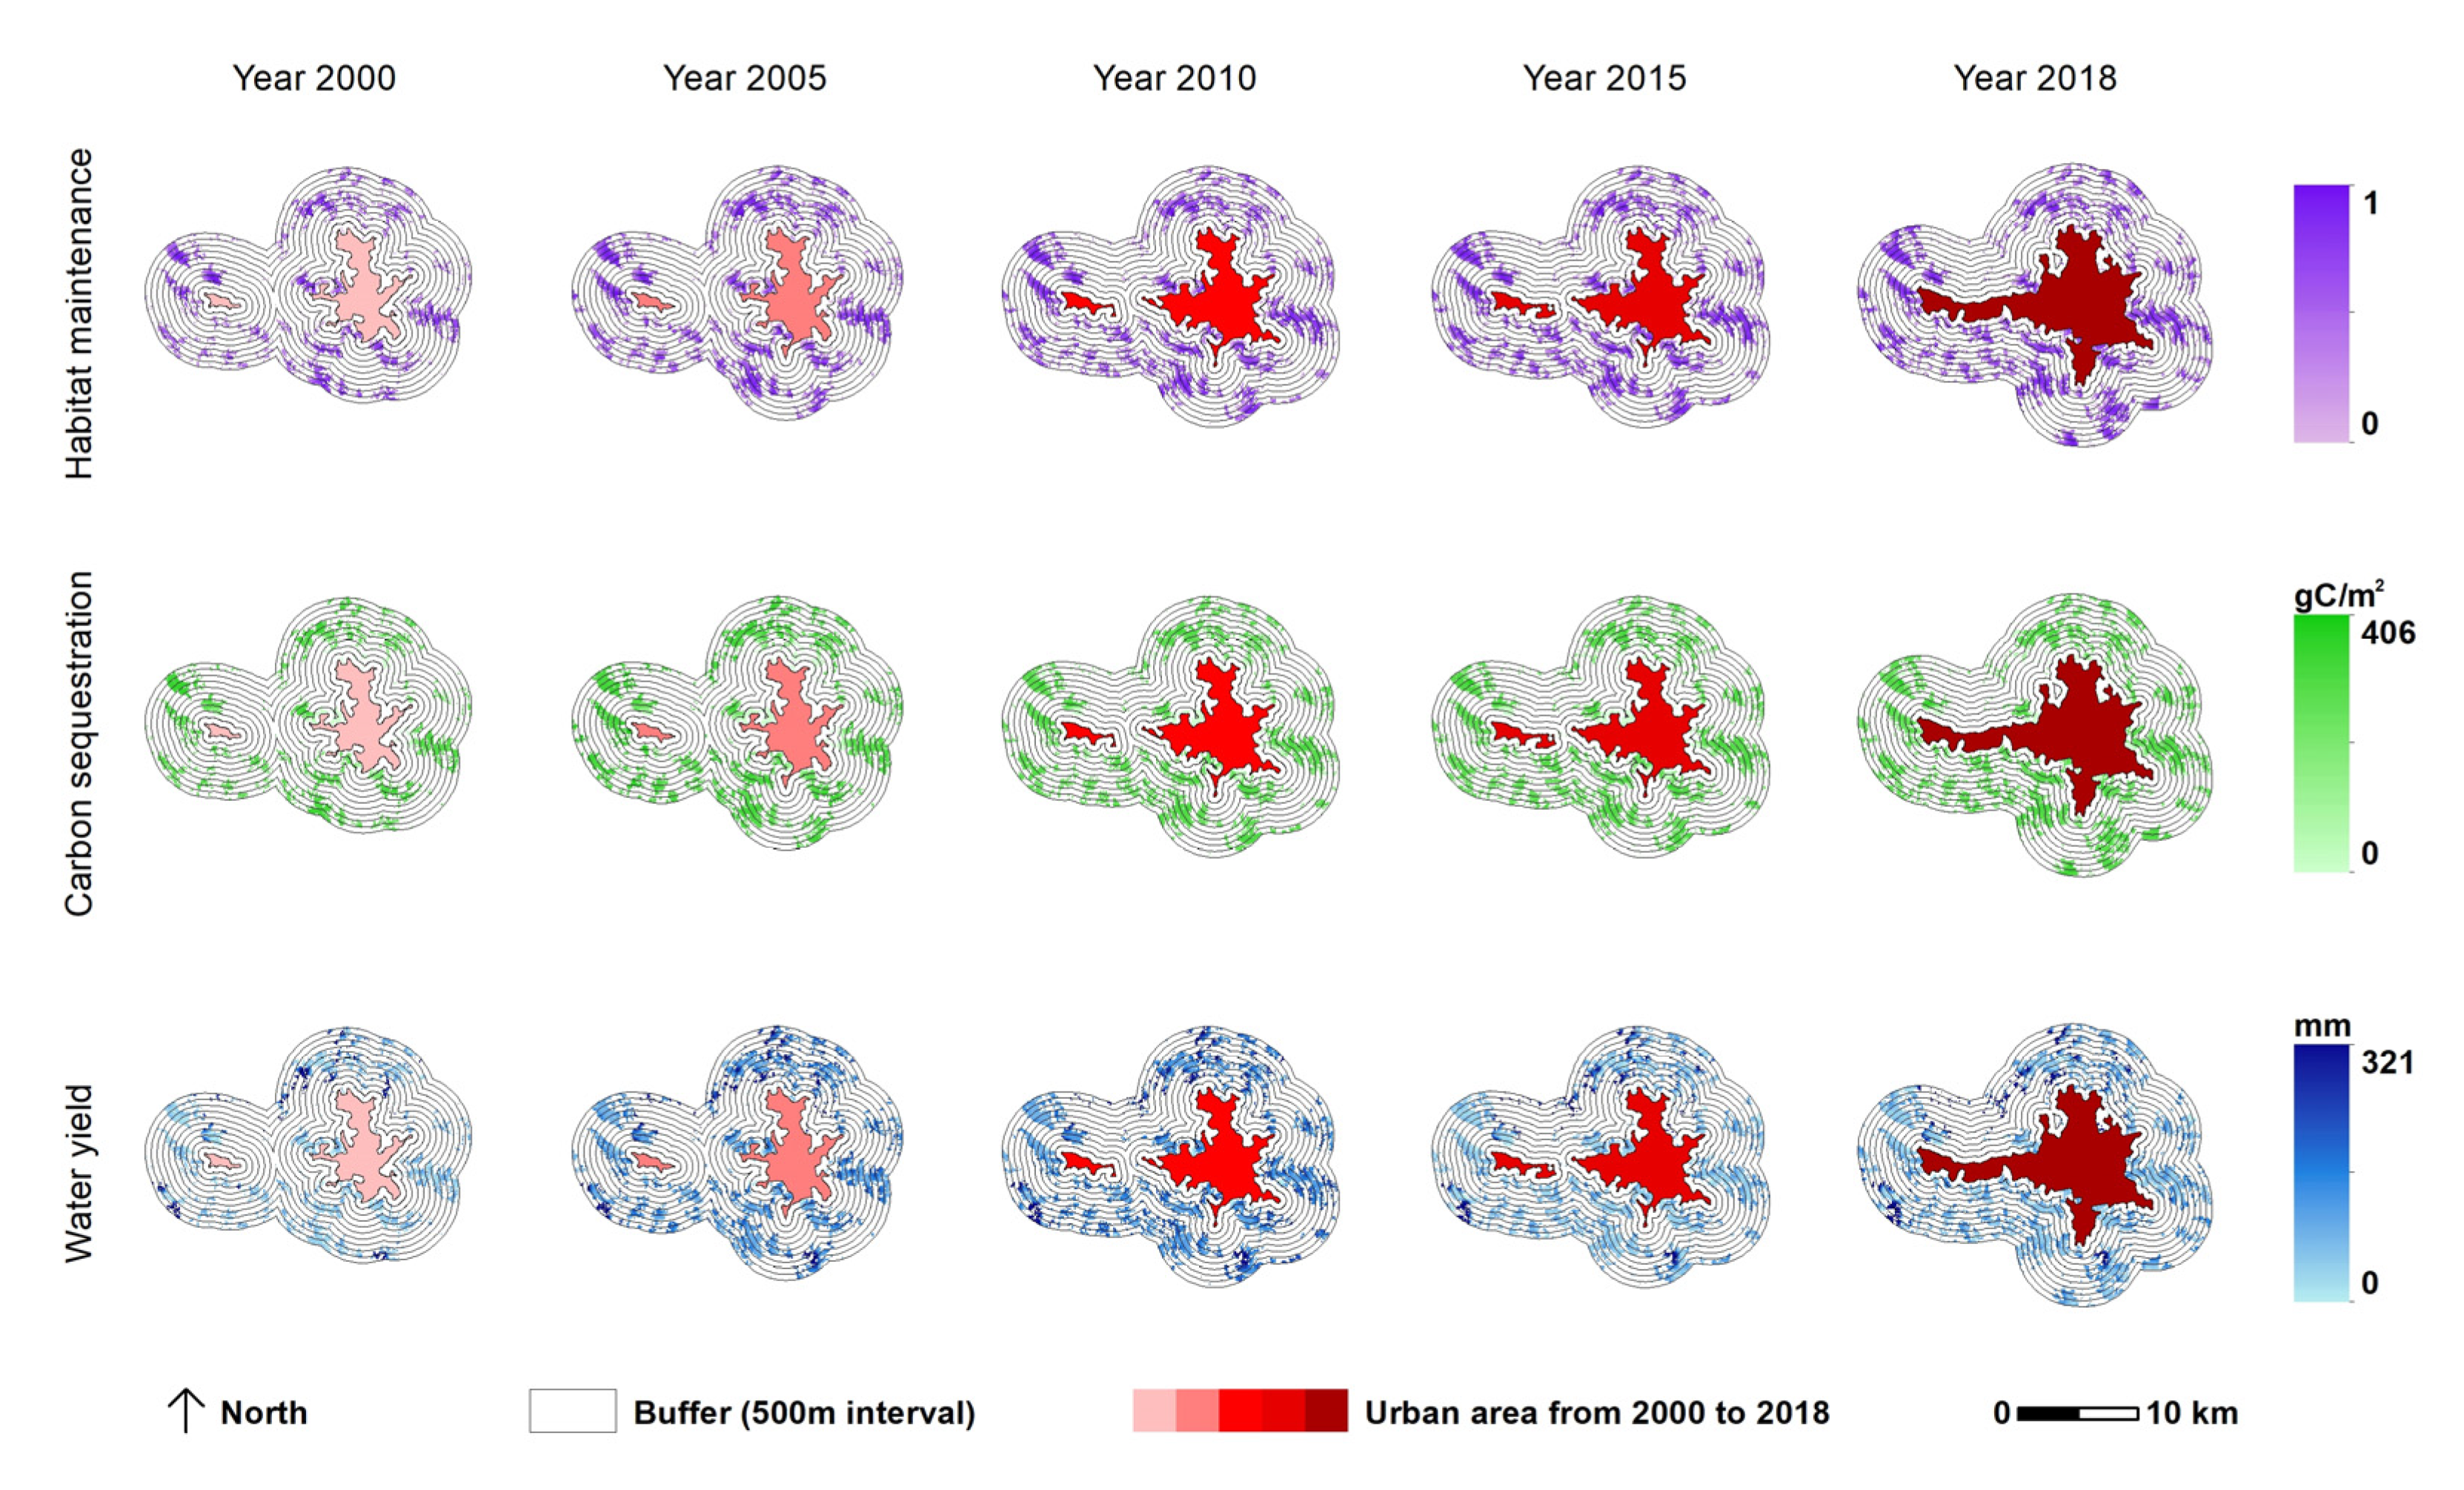
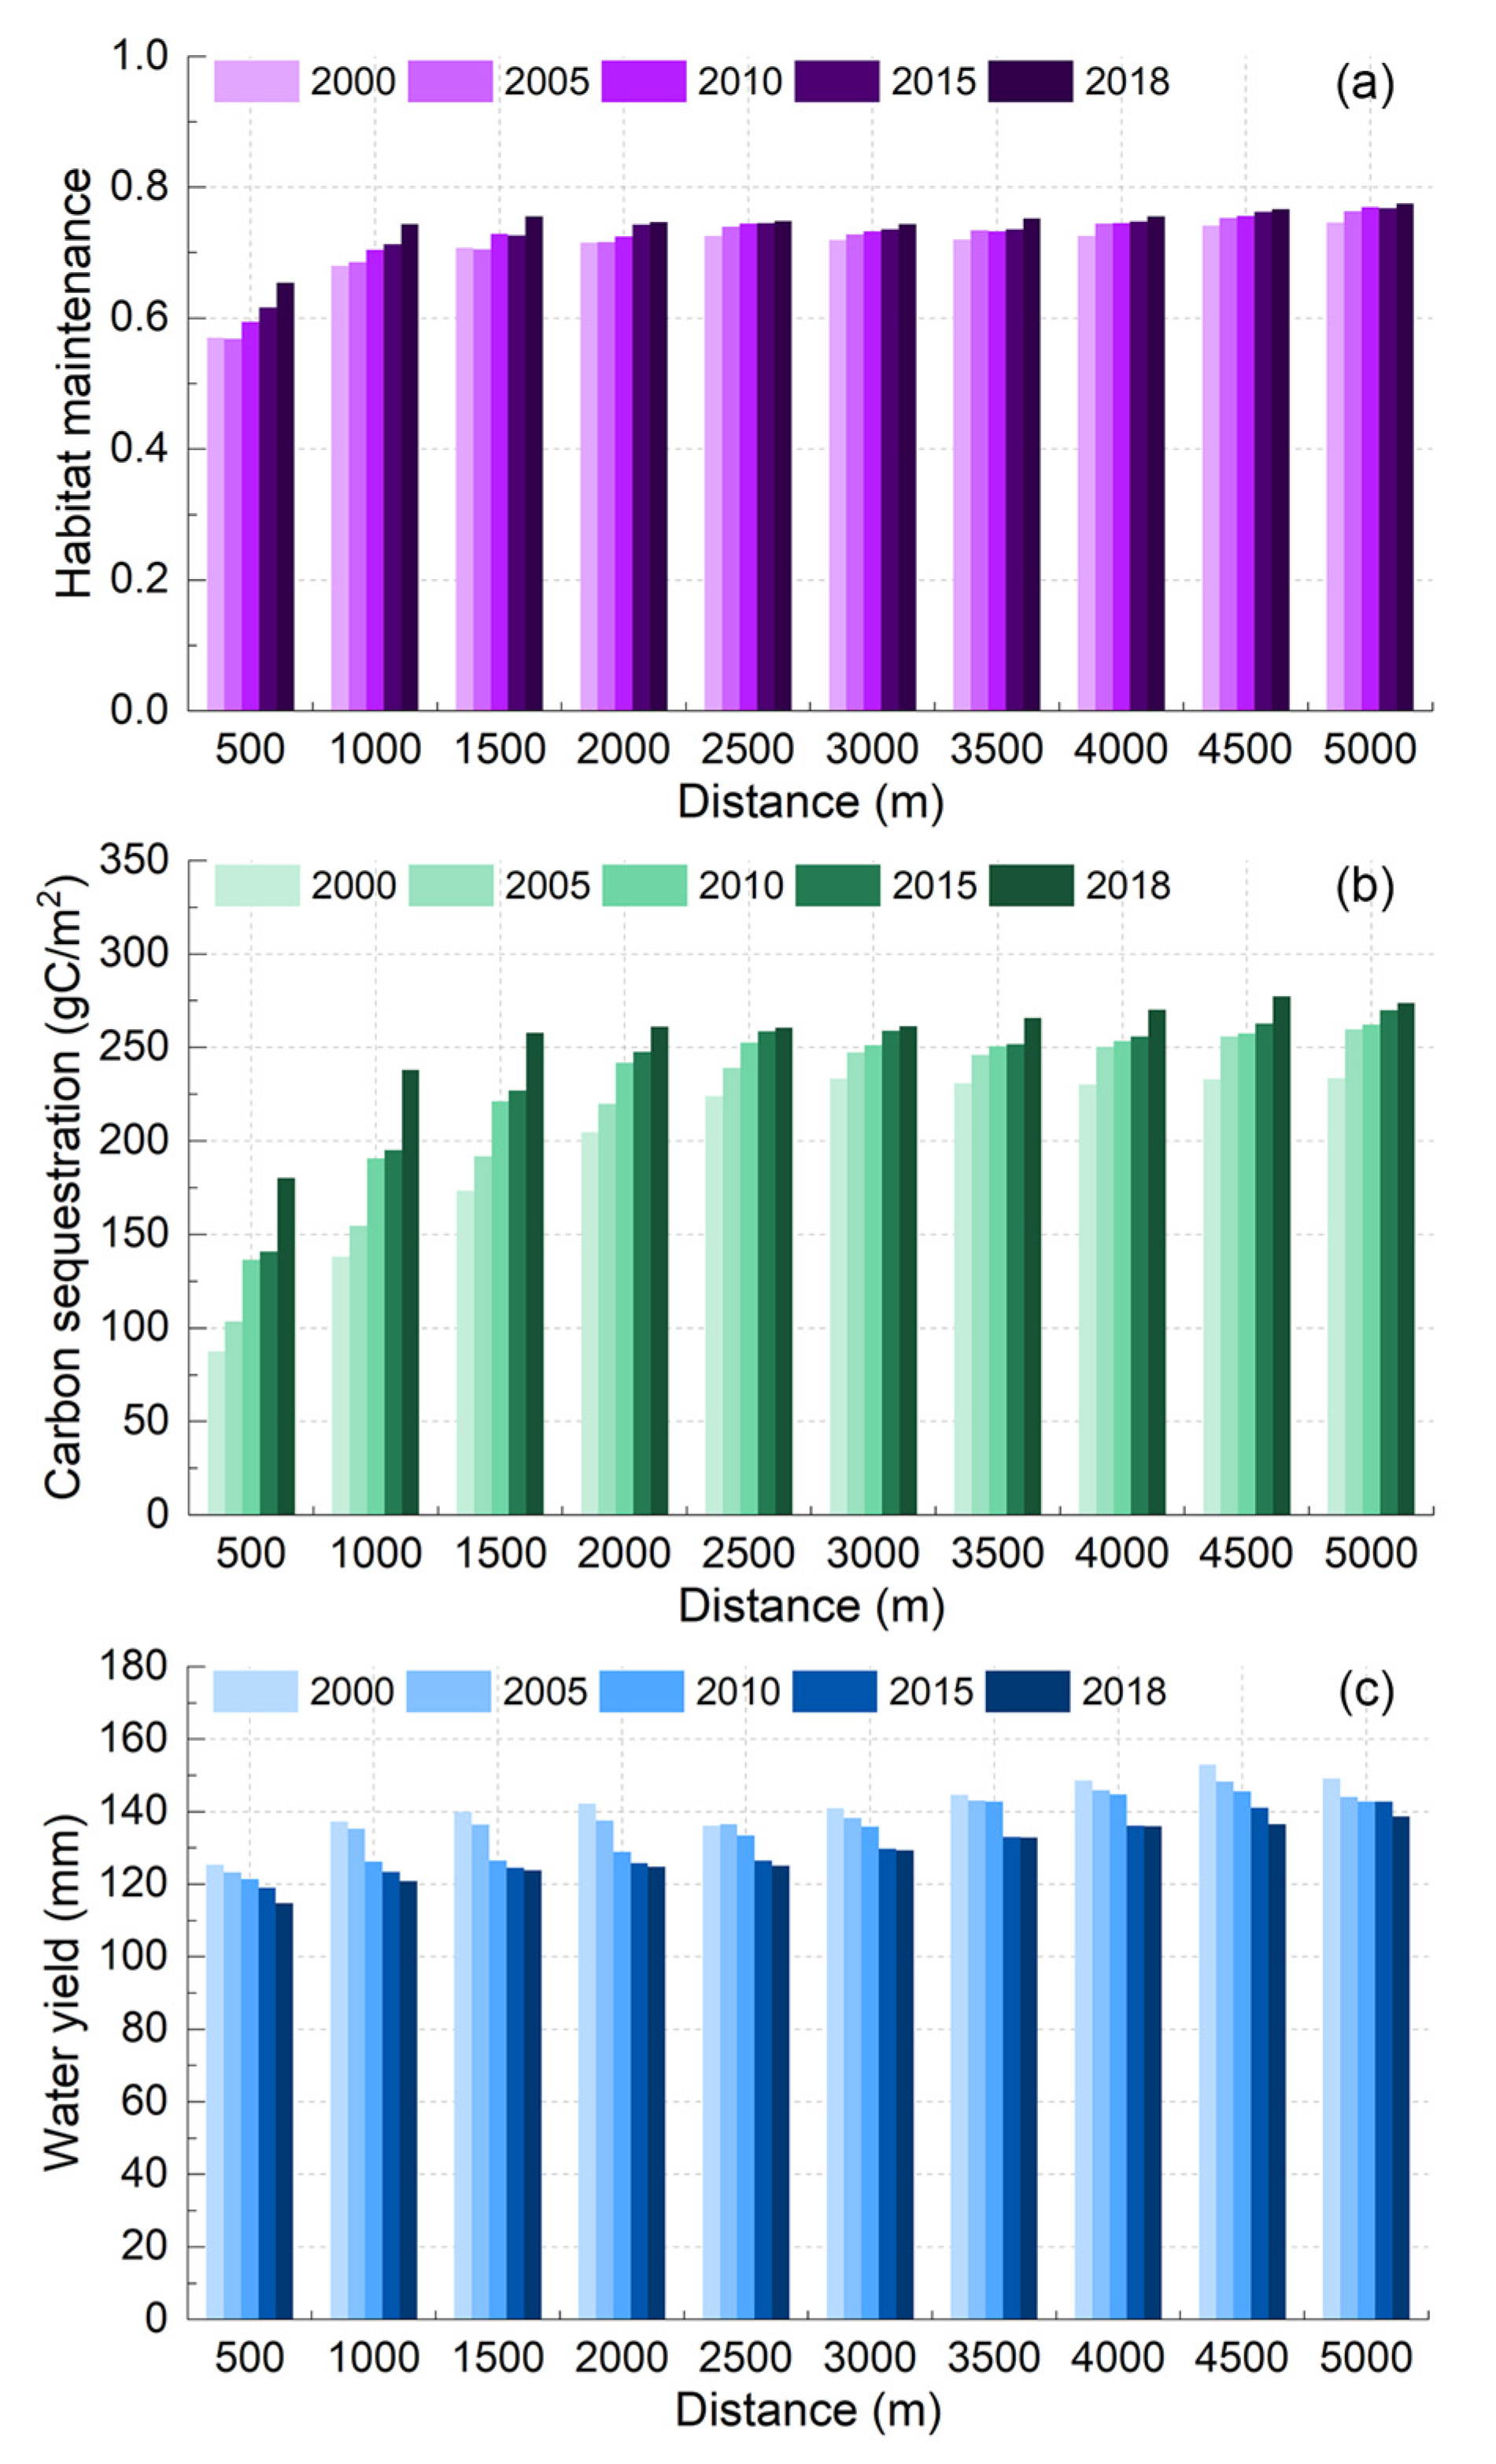
3.2. Change of Forest Landscape Functions from 2000 to 2018

From 2000 to 2018, the forest landscape functions changed significantly in the urban periphery. Within 5 km of the urban periphery, the habitat maintenance (HM) function increased overall, with mean values of 0.71, 0.71, 0.72, 0.73, and 0.74 in 2000, 2005, 2010, 2015, and 2018, respectively (Figure 5). The HM in 2018 increased by approximately 5.53% compared to 2000. By comparison, the growth of HM is especially noticeable in buffer zones further away from the urban edge (Figure 5).
Similar to HM, the carbon sequestration (CS) function of forest landscape has increased, with its mean value being within 5 km of the urban periphery increasing by 28.0% from 2000 to 2018. Specifically, the CS of urban peripheral forest landscape in 2000, 2005, 2010, 2015, and 2018 were 198.92 gC/m2, 216.84 gC/m2, 231.74 gC/m2, 236.82 gC/m2, and 254.63 gC/m2, respectively (Figure 5). Additionally, the growth of CS is obvious in buffer zones further away from the urban edge.
In contrast, the water yield (WY) function shows a decreasing trend during 2000–2018. Within 5 km of the urban periphery, the WY in 2018 decreased by approximately 9.48% compared to 2000. Specifically, the mean value of WY was 141.70 mm, 138.84 mm, 134.82 mm, 130.19 mm, and 128.26 mm in 2000, 2005, 2010, 2015, and 2018, respectively (Figure 5).
Comparing these three functions reveals a synergistic relationship between the HM and CS functions of urban peripheral forest landscapes under the influence of urbanization. However, there was a trade-off between the WY function and the HM and CS functions for extra-urban forest landscapes.
Furthermore, it was found that the investigating functions increased with an increase in buffer distance regardless of the year (Figure 6). Nevertheless, the WY function is reduced in all buffers (Figure 6c), while the opposite is true for the HM and CS functions (Figure 6a,b). Additionally, the growth of CS function is significantly higher than that of HM, indicating that the CS function of the urban peripheral forest landscape has been enhanced more in the context of urbanization.
However, the impact of urbanization on these functions is spatially variable. We found that the magnitude of change in both the increase in CS and HM functions and the decrease in WY functions is more pronounced in the buffer zone at the edge of the city (Figure 6). For example, in the 500 m buffer (i.e., in the area 0–500 m from the urban edge), the HM and CS functions increased by 14.79% and 105.57%, respectively, while the WY function decreased by 8.42% during 2000–2018 (Figure 6). In contrast, in the 5000 m buffer zone (i.e., in the area 4500–5000 m from the urban edge), the HM and CS functions increased by 3.87% and 17.19%, respectively, while the WY function decreased by 7.06% during 2000–2018 (Figure 6). In fact, the magnitude of change in HM function is already relatively similar in the buffer zone beyond 1000 m from the urban edge (Figure 6a). By comparison, it is beyond 2500 meters that the CS function grows at a progressively similar magnitude (Figure 6b).
Thus, the response of forest landscape functions to urbanization is inconsistent in terms of both magnitude of change and distance. Within distance gradients of the urban periphery, forest landscape multifunctionality is predicted to respond differently to urbanization.

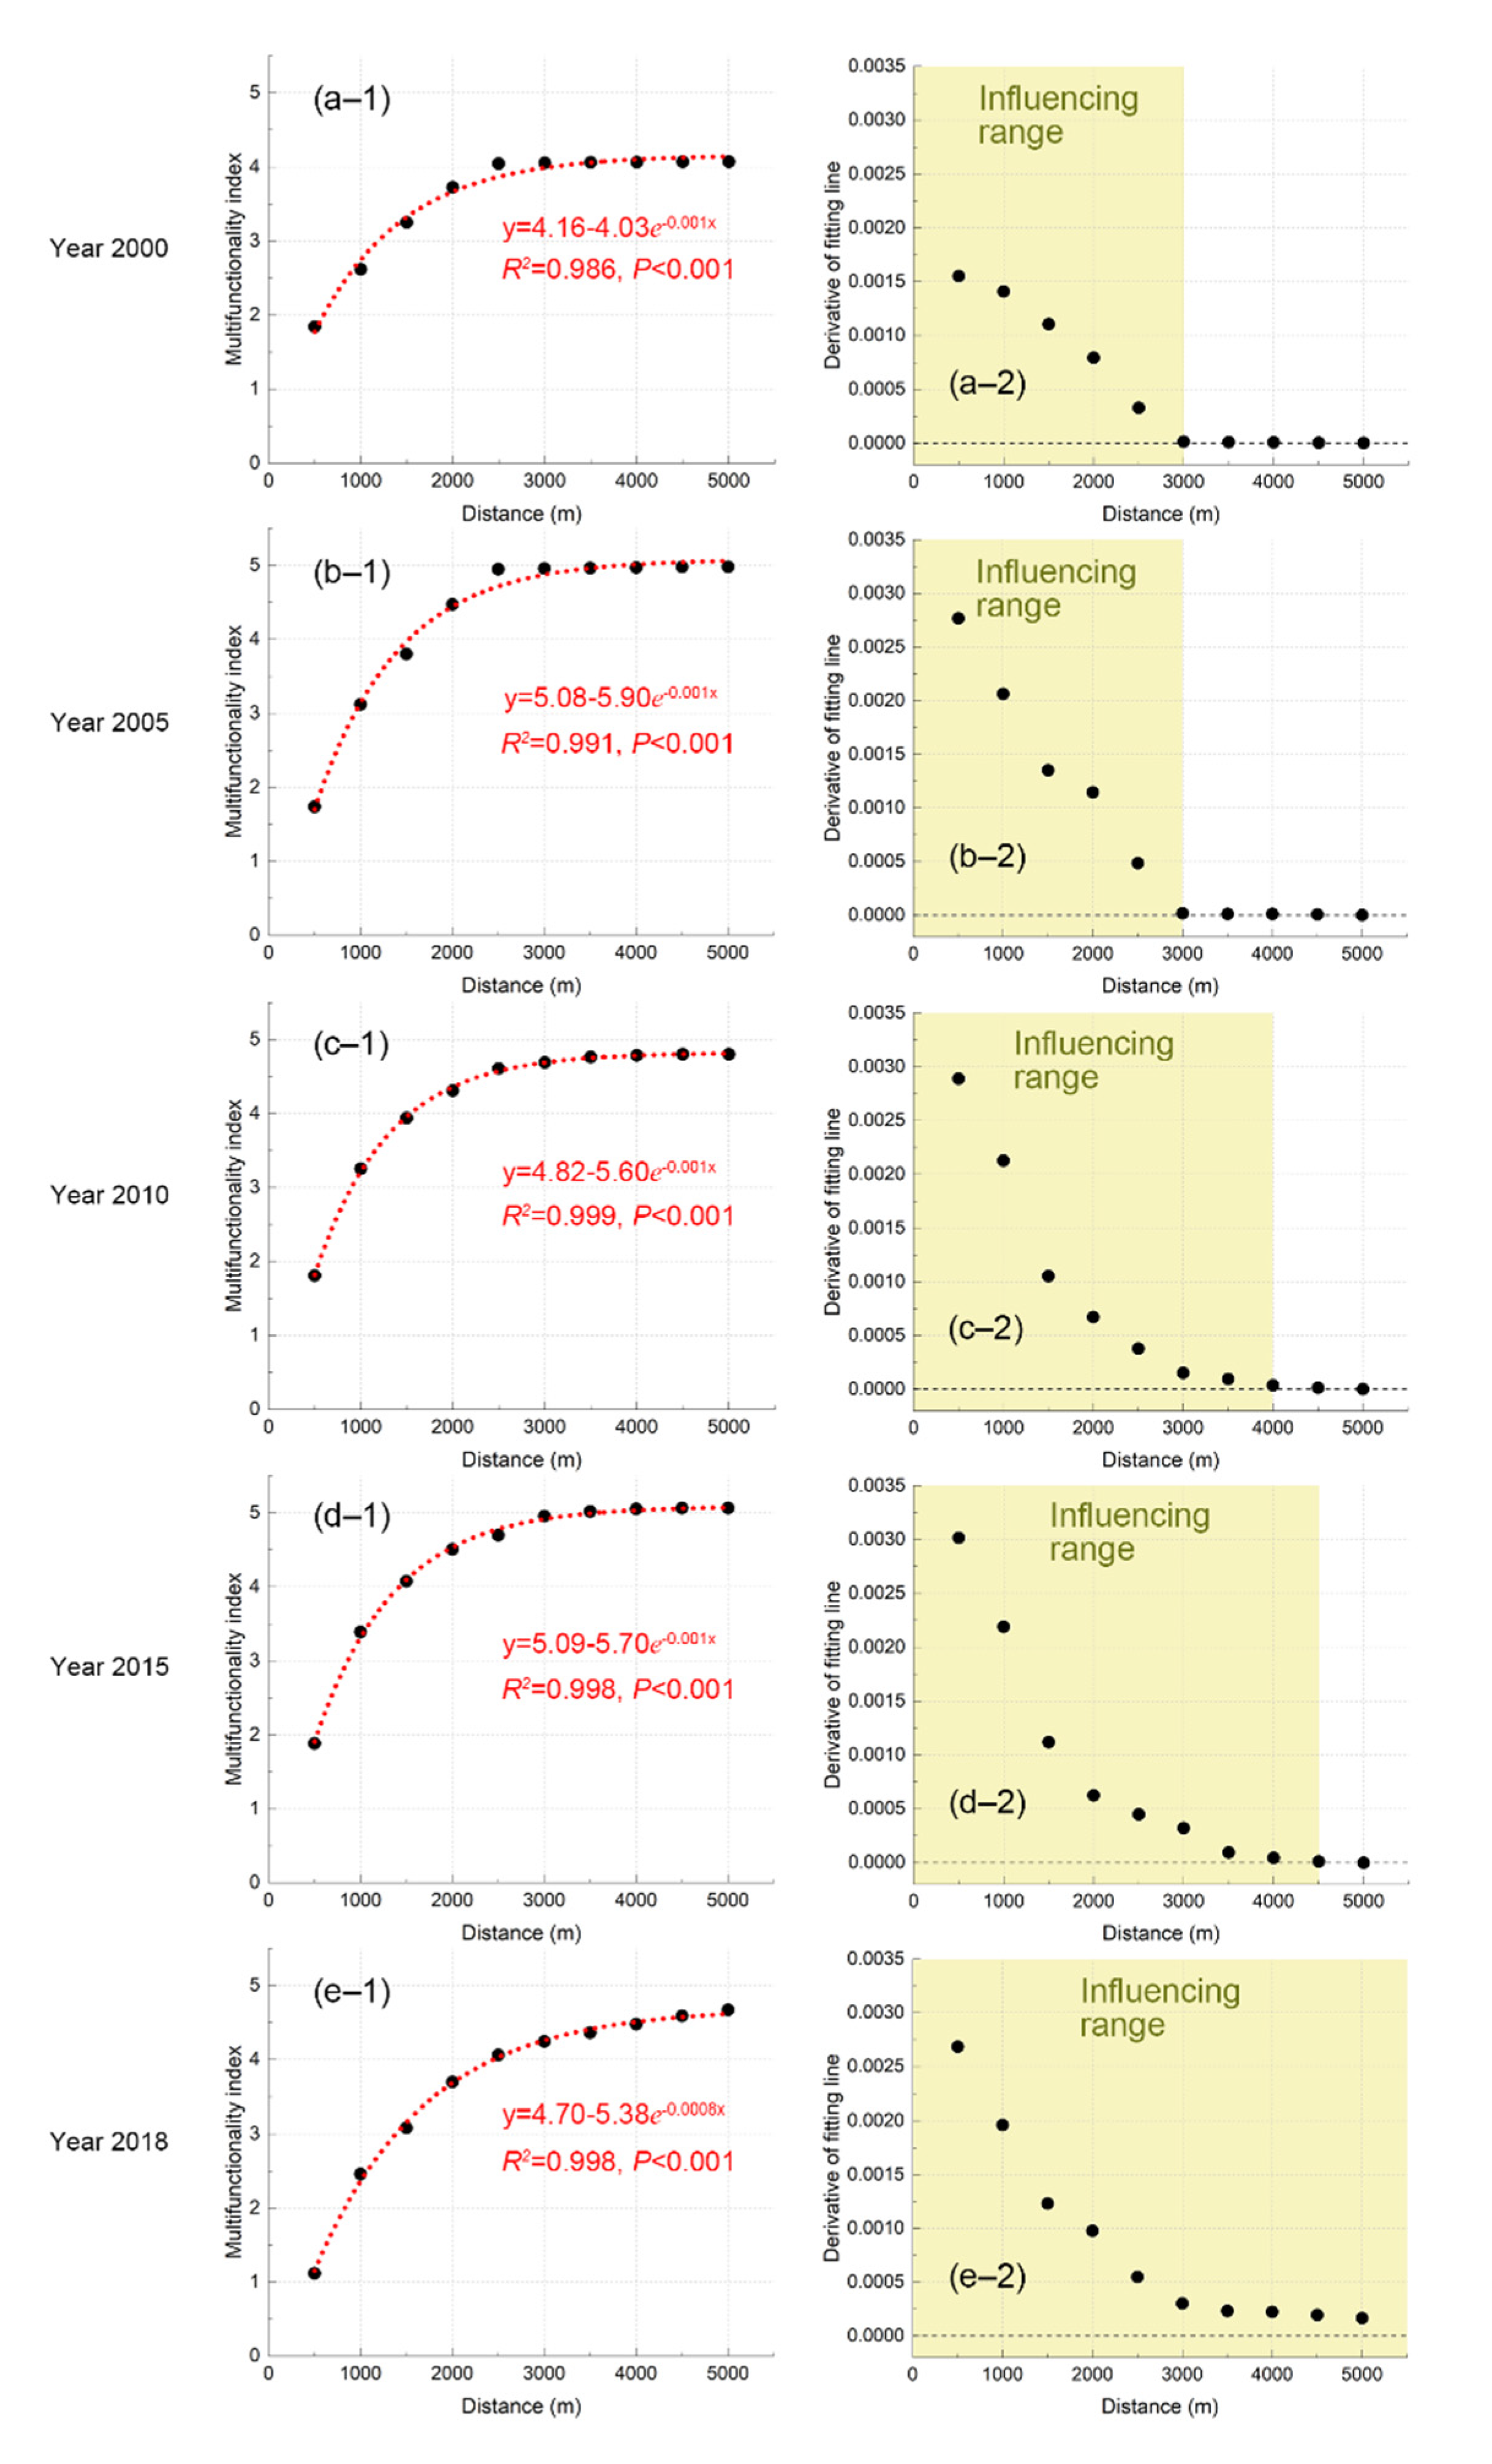
3.3. Effects of Urbanization on Forest Landscape Multifunctionality

As predicted, there is a gradient effect in the response of urban peripheral forest landscape multifunctionality (UPFM) to urbanization (Figure 7). From 2000 to 2018, the UPFM in the 500 m, 1000 m, 1500 m, and 2000 m buffer zones decreased by 39.24%, 5.99%, 5.20%, and 0.78%, respectively. However, UPFM increased by 0.36%, 4.69%, 7.44%, 10.15%, 12.76%, and 14.78% in the buffer zones of 2500 m, 3000 m, 3500 m, 4000 m, 4500 m, and 5000 m, respectively. Hence, the UPFM at 2000 m to 2500 m around the city may change from decreasing to increasing under the influence of urbanization.
In addition, the UPFM increased exponentially with the distance gradient (p < 0.001, Figure 7). With this growth, there is a turning point from growth to flatness. We quantified these turning points by calculating the derivatives of each UPFM point for each year (e.g., Figure 7(a-2)). In 2000, 2005, 2010, and 2015, the turning points of UPFM growth were 3000 m, 3000 m, 4000 m, and 4500 m, respectively (Figure 7(a-2–d-2)). However, in 2018, the turning point seems to be beyond the 5000 m range because the derivative of UPFM is greater than 0 at all ranges (Figure 7(e-2)).
Thus, the influencing range of urbanization on UPFM has been getting farther from 2000 to 2018. This influencing range has grown from 3000 m in 2000 to over 5000 m in 2018. However, it is found that the influencing range did not change in 2000–2005. In 2010–2015, the influencing range increased by only 500 m. In contrast, the increase in influencing range reached 1000 m in 2005–2010 and exceeded at least 1000 m in 2015–2018. This difference coincides with the increase in impervious areas (Figure 4h). For example, the magnitude of impervious area growth increased from 59.94 ha in 2000–2005 to 153.68 ha in 2005–2010 (Figure 4h). Accordingly, the influencing range of urbanization on UPFM increased from unchanged to 1000 m from 2000–2005 to 2005–2010 (Figure 7(a-2–c-2)). During 2015–2018, the impervious area of the urban area increased the most, reaching 446.19 ha (Figure 4h). As a result, the influencing range of urbanization on UPFM increased by at least 1000 m from 2010–2015 to 2015–2018 (Figure 7(c-2–e-2)). Ultimately, the stability interval of the UPFM becomes farther from the urban edge whenever the city expands significantly.

4. Discussion

Previous studies using inventory data found that trade-offs between landscape functions in European forests are weak and that the diversity of tree species constrains their multifunctionality [10,13]. Although the implications of these studies for forest management and related practitioners are significant, the external factors affecting multifunctionality remain unclear. Unfamiliar landscapes are usually connected and mosaiced together [42], which means that other landscapes and their changes can influence the multifunctionality of the forest landscape.
The findings of this study confirm that urbanization as an external factor exerts a gradient effect on both the function and multifunctionality of forest landscapes in the urban periphery. These findings are instructive for both urban management and forest management. Urbanization has led to weak habitat maintenance and carbon sequestration functions in forest landscapes adjacent to cities (Figure 6a,b), which may slow down biodiversity conservation and climate change mitigation. On the other hand, the water yield function of forest landscapes in the urban periphery decreased (Figure 6c), which may threaten the urban water supply and the daily needs of urban residents. All these negative impacts may slow down the achievement of SDGs, such as climate change mitigation, biodiversity conservation, and improving the wellbeing of urban residents. Therefore, to enhance the function of the forest landscape, it is not enough to manage the forest alone; we must also control the extent of urban expansion.
Our approach to simulating landscape multifunctionality has previously been used in agriculture landscapes [35,36]. The advantage of this approach is that it allows us to model the landscape multifunctionality at the pixel scale, thus allowing us to quantify the influencing range of urbanization. The analysis of the influencing range of urbanization on landscape multifunctionality extends previous studies aimed at identifying factors associated with multifunctional landscapes in larger regions (e.g., Beijing–Tianjin–Hebei region [34]). Since urbanization has been speeding up in China [4,22,23], our approach of quantifying the influencing range can also be extended to a larger study area. In particular, this approach can be used to analyze the impact of urbanization on the multifunctionality of multiple landscapes, which can provide decision-makers with a “win–win” solution for optimizing urbanization and enhancing the landscape functions in stakeholders’ interests.
Accordingly, we found a gradient effect of urbanization on the function and multifunctionality of the extra-urban forest landscape (Figure 6 and Figure 7). With increasing distance from the urban edge, the forest landscape function shows an exponential increase and reaches stability after a certain distance (i.e., the turning point in this study). This exponential change suggests that the impact of urbanization on forest landscape function is limited to roughly 1000–2500 m (Figure 6). However, the influencing range of urbanization on the multifunctionality of forest landscapes is much longer. With urbanization, this influencing range increased from 3000 m in 2000 to over 5000 m in 2018 (Figure 7). We find that whenever urbanization accelerates (e.g., from 2000–2005 to 2005–2010), the influencing range increases significantly (Figure 1 and Figure 7). Therefore, it should be noted in future studies that the gradient effects of urbanization on the function and multifunctionality of forest landscape are different.
Besides direct effects, urbanization may also indirectly lead to changes in multifunctionality by affecting the trade-offs between forest functions. We found that the water yield function showed a trade-off between habitat maintenance and carbon sequestration functions at each buffer (Figure 6), which is similar to the previous findings [10,43]. Although not quantified, we infer from the magnitude of change in a single function (i.e., Figure 6) that the trade-off between water yield and carbon sequestration functions weakens as distance from the urban edge increases. In this regard, the impact of urbanization on the trade-offs and synergistic relationships between external forest landscape functions is worth investigating in future work. This would be helpful to explain the direct and indirect effects of urbanization on the multifunctionality of forest landscapes.
The limitations of this study should be acknowledged in anticipation of improvement in future work. First, our study could show the impact of urbanization on the multifunctionality of temperate forest landscapes, which cannot necessarily be generalized to other climatic zones. Second, the definition of landscape function can be broad, such as ecological function, economic function, and social function [36]. Our work focuses on the ecological functions of forest landscapes (i.e., water yield, carbon sequestration, habitat maintenance) without considering their economic and social functions. This is a precise application of the definition of landscape function, which applies to interpreting certain landscape benefits and their associated factors [34,35]. The proven economic and social functions of forests (e.g., timber production, work provision, recreation) are what we suggest should be considered in future work [9]. In addition, other urbanization factors (e.g., heat sources, pollution, human activities) should also be considered, which can help to further reveal the impact of urbanization on the multifunctionality of forest landscapes. To this end, future work will require a combination of inventory data, satellite data, and socioeconomic data. Additionally, attempts to create more distant and finely spaced buffers may help to quantify the precise range of urbanization’s influence. The development and application of an effective analytical framework are necessary, which will be helpful to standardize and accelerate the study of landscape multifunctionality [12].

5. Conclusions

The present work is an extension of studies that focus on forest multifunctionality and the effects of urbanization on forests. Urbanization is found to have a significant impact on both the function and multifunctionality of the extra-urban forest landscape. With this finding, it can be predicted that the multifunctionality of forest landscapes may be further diminished in the urban periphery, especially in developing countries where urbanization is accelerating. However, the multifunctionality of a forest landscape with multiple benefits is the main guarantor of regional ecological security and the achievement of sustainable development. It is important to note that with less than a decade to go before the promise of the SDGs, reconciling the relationship between urbanization and forest landscape multifunctionality may be difficult. Nevertheless, urban and forest managers need to work together to minimize the negative effects of urbanization on the multifunctionality of forest landscapes. Our method can be used to assess the impact of other cities and the impact on other landscape types. Together, this study and the method used are instructive for forest and urban managers and for the practitioners who provide management recommendations.

Author Contributions

Conceptualization, Y.D. (Yulin Dong) and Z.R.; methodology, J.H.; software, C.W. and G.J.; validation, P.Z. and Y.G.; formal analysis, J.H. and Y.D. (Yunxia Du); investigation, C.W.; resources, Y.D. (Yulin Dong); data curation, Y.D. (Yulin Dong); writing—original draft preparation, J.H.; writing—review and editing, J.H.; visualization, J.H.; supervision, Y.D. (Yunxia Du); project administration, Z.R.; funding acquisition, Z.R. All authors have read and agreed to the published version of the manuscript.

Funding

This research was funded by the Youth Innovation Promotion Association of the Chinese Academy of Sciences [grant number 2020237] and the National Natural Science Foundation of China [grant number 42171109, 32130068].

Acknowledgments

We would like to acknowledge the data support from the “National Earth System Science Data Center, National Science & Technology Infrastructure of China. (http://www.geodata.cn)”. The authors would like to thank the three anonymous reviewers for their constructive suggestions and comments.

Conflicts of Interest

The authors declare no conflict of interest.

Appendix A

Table A1. Sensitivity of different landscape types to different threat factors.
Landscape TypeHabitat 1Threat Factors 1,2
CroplandImpervious AreaBare Land
Cropland0.300.50.4
Forest0.90.30.60.6
Grass0.60.50.30.2
Water0.90.10.80.4
Wetland0.90.10.80.4
Bare land0.010.10.10
Impervious area0000
1 These factors were determined with reference to published studies [38,39]. 2 We assume that the impact of these threat factors is exponentially decaying. The maximum influencing distance of cropland, impervious area, and bare land are 0.5 km, 3 km, and 10 km, respectively [38]. The weight of cropland, impervious area, and bare land are 0.5, 0.7, and 0.1, respectively [38].

References

  1. Dong, Y.; Ren, Z.; Wang, Z.; Yu, Q.; Zhu, L.; Yu, H.; Bao, G. Spatiotemporal Patterns of Forest Changes in Korean Peninsula Using Landsat Images During 1990–2015: A Comparative Study of Two Neighboring Countries. IEEE Access 2020, 8, 73623–73633. [Google Scholar] [CrossRef]
  2. Ren, Z.; Zheng, H.; He, X.; Zhang, D.; Shen, G.; Zhai, C. Changes in spatio-temporal patterns of urban forest and its above-ground carbon storage: Implication for urban CO2 emissions mitigation under China’s rapid urban expansion and greening. Environ. Int. 2019, 129, 438–450. [Google Scholar] [CrossRef]
  3. MacDicken, K.; Reams, G.; de Freitas, J. Introduction to the Changes in Global Forest Resources from 1990 to 2015. For. Ecol. Manag. 2015, 352, 1–2. [Google Scholar] [CrossRef]
  4. Dong, Y.; Ren, Z.; Fu, Y.; Hu, N.; Guo, Y.; Jia, G.; He, X. Decrease in the residents’ accessibility of summer cooling services due to green space loss in Chinese cities. Environ. Int. 2022, 158, 107002. [Google Scholar] [CrossRef]
  5. Miura, S.; Amacher, M.; Hofer, T.; San-Miguel-Ayanz, J.; Ernawati; Thackway, R. Protective functions and ecosystem services of global forests in the past quarter-century. For. Ecol. Manag. 2015, 352, 35–46. [Google Scholar] [CrossRef] [Green Version]
  6. Fang, J.; Guo, Z.; Hu, H.; Kato, T.; Muraoka, H.; Son, Y. Forest biomass carbon sinks in East Asia, with special reference to the relative contributions of forest expansion and forest growth. Glob. Chang. Biol. 2014, 20, 2019–2030. [Google Scholar] [CrossRef]
  7. Lim, C.-H.; Song, C.; Choi, Y.; Jeon, S.W.; Lee, W.-K. Decoupling of forest water supply and agricultural water demand attributable to deforestation in North Korea. J. Environ. Manag. 2019, 248, 109256. [Google Scholar] [CrossRef] [PubMed]
  8. Ren, Z.; Zhao, H.; Fu, Y.; Xiao, L.; Dong, Y. Effects of urban street trees on human thermal comfort and physiological indices: A case study in Changchun city, China. J. For. Res. 2021, 1–12. [Google Scholar] [CrossRef]
  9. Koehl, M.; Lasco, R.; Cifuentes, M.; Jonsson, O.; Korhonen, K.T.; Mundhenk, P.; de Jesus Navar, J.; Stinson, G. Changes in forest production, biomass and carbon: Results from the 2015 UN FAO Global Forest Resource Assessment. For. Ecol. Manag. 2015, 352, 21–34. [Google Scholar] [CrossRef] [Green Version]
  10. van der Plas, F.; Ratcliffe, S.; Ruiz-Benito, P.; Scherer-Lorenzen, M.; Verheyen, K.; Wirth, C.; Zavala, M.A.; Ampoorter, E.; Baeten, L.; Barbaro, L.; et al. Continental mapping of forest ecosystem functions reveals a high but unrealised potential for forest multifunctionality. Ecol. Lett. 2018, 21, 31–42. [Google Scholar] [CrossRef] [PubMed] [Green Version]
  11. Gustafsson, L.; Baker, S.C.; Bauhus, J.; Beese, W.J.; Brodie, A.; Kouki, J.; Lindenmayer, D.B.; Lõhmus, A.; Pastur, G.M.; Messier, C.; et al. Retention Forestry to Maintain Multifunctional Forests: A World Perspective. Bioscience 2012, 62, 633–645. [Google Scholar] [CrossRef] [Green Version]
  12. Trogisch, S.; Schuldt, A.; Bauhus, J.; Blum, J.A.; Both, S.; Buscot, F.; Castro-Izaguirre, N.; Chesters, D.; Durka, W.; Eichenberg, D.; et al. Toward a methodical framework for comprehensively assessing forest multifunctionality. Ecol. Evol. 2017, 7, 10652–10674. [Google Scholar] [CrossRef] [Green Version]
  13. van der Plas, F.; Manning, P.; Soliveres, S.; Allan, E.; Scherer-Lorenzen, M.; Verheyen, K.; Wirth, C.; Zavala, M.A.; Ampoorter, E.; Baeten, L.; et al. Biotic homogenization can decrease landscape-scale forest multifunctionality. Proc. Natl. Acad. Sci. USA 2016, 113, 3557. [Google Scholar] [CrossRef] [PubMed] [Green Version]
  14. Yuan, Z.; Ali, A.; Ruiz-Benito, P.; Jucker, T.; Mori, A.S.; Wang, S.; Zhang, X.; Li, H.; Hao, Z.; Wang, X.; et al. Above- and below-ground biodiversity jointly regulate temperate forest multifunctionality along a local-scale environmental gradient. J. Ecol. 2020, 108, 2012–2024. [Google Scholar] [CrossRef]
  15. Jonsson, M.; Bengtsson, J.; Moen, J.; Gamfeldt, L.; Snäll, T. Stand age and climate influence forest ecosystem service delivery and multifunctionality. Environ. Res. Lett. 2020, 15, 0940a0948. [Google Scholar] [CrossRef]
  16. Jia, W.; Zhao, S.; Zhang, X.; Liu, S.; Henebry, G.M.; Liu, L. Urbanization imprint on land surface phenology: The urban–rural gradient analysis for Chinese cities. Glob. Chang. Biol. 2021, 27, 2895–2904. [Google Scholar] [CrossRef]
  17. Sun, L.; Chen, J.; Li, Q.; Huang, D. Dramatic uneven urbanization of large cities throughout the world in recent decades. Nat. Commun. 2020, 11, 5366. [Google Scholar] [CrossRef]
  18. Zhou, W.; Yu, W.; Qian, Y.; Han, L.; Pickett, S.T.A.; Wang, J.; Li, W.; Ouyang, Z. Beyond city expansion: Multi-scale environmental impacts of urban megaregion formation in China. Natl. Sci. Rev. 2021, nwab107. [Google Scholar] [CrossRef]
  19. Lv, H.; Yang, Y.; Zhang, D.; Du, H.; Zhang, J.; Wang, W.; He, X. Perimeter-area ratio effects of urbanization intensity on forest characteristics, landscape patterns and their associations in Harbin City, Northeast China. Urban Ecosyst. 2019, 22, 631–642. [Google Scholar] [CrossRef]
  20. Song, X.; Hansen, M.C.; Stehman, S.V.; Potapov, P.V.; Tyukavina, A.; Vermote, E.F.; Townshend, J.R. Global land change from 1982 to 2016. Nature 2018, 560, 639–643. [Google Scholar] [CrossRef]
  21. Lyu, Y.; Wang, M.; Zou, Y.; Wu, C. Mapping trade-offs among urban fringe land use functions to accurately support spatial planning. Sci. Total Environ. 2022, 802, 149915. [Google Scholar] [CrossRef]
  22. Kuang, W.H. National urban land-use/cover change since the beginning of the 21st century and its policy implications in China. Land Use Policy 2020, 97, 104747. [Google Scholar] [CrossRef]
  23. Kuang, W.H. 70 years of urban expansion across China: Trajectory, pattern, and national policies. Sci. Bull. 2020, 65, 1970–1974. [Google Scholar] [CrossRef]
  24. Li, X.; Du, H.; Zhou, G.; Mao, F.; Zheng, J.; Liu, H.; Huang, Z.; He, S. Spatiotemporal dynamics in assimilated-LAI phenology and its impact on subtropical bamboo forest productivity. Int. J. Appl. Earth Obs. 2021, 96, 102267. [Google Scholar] [CrossRef]
  25. Yu, Z.; Liu, S.; Wang, J.; Wei, X.; Schuler, J.; Sun, P.; Harper, R.; Zegre, N. Natural forests exhibit higher carbon sequestration and lower water consumption than planted forests in China. Glob. Chang. Biol. 2019, 25, 68–77. [Google Scholar] [CrossRef] [PubMed] [Green Version]
  26. Dong, Y.; Ren, Z.; Fu, Y.; Yang, R.; Sun, H.; He, X. Land Use/Cover Change and Its Policy Implications in Typical Agriculture-forest Ecotone of Central Jilin Province, China. Chin. Geogr. Sci. 2021, 31, 261–275. [Google Scholar] [CrossRef]
  27. Dong, Y.; Ren, Z.; Fu, Y.; Miao, Z.; Yang, R.; Sun, Y.; He, X. Recording urban land dynamic and its effects during 2000–2019 at 15-m resolution by cloud computing with Landsat series. Remote Sens. 2020, 12, 2451. [Google Scholar] [CrossRef]
  28. Li, X.C.; Gong, P.; Zhou, Y.Y.; Wang, J.; Bai, Y.; Chen, B.; Hu, T.; Xiao, Y.; Xu, B.; Yang, J.; et al. Mapping global urban boundaries from the global artificial impervious area (GAIA) data. Environ. Res. Lett. 2020, 15, 094044. [Google Scholar] [CrossRef]
  29. Yang, J.; Huang, X. The 30m annual land cover dataset and its dynamics in China from 1990 to 2019. Earth Syst. Sci. Data 2021, 13, 3907–3925. [Google Scholar] [CrossRef]
  30. Yang, R.; Li, X.Y.; Mao, D.H.; Wang, Z.; Tian, Y.; Dong, Y. Examining fractional vegetation cover dynamics in response to climate from 1982 to 2015 in the Amur river basin for SDG 13. Sustainability 2020, 12, 5866. [Google Scholar] [CrossRef]
  31. Zhou, W.; Wang, J.; Qian, Y.; Pickett, S.T.A.; Li, W.F.; Han, L. The rapid but “invisible” changes in urban greenspace: A comparative study of nine Chinese cities. Sci. Total Environ. 2018, 627, 1572–1584. [Google Scholar] [CrossRef]
  32. Zhou, W.; Huang, G.; Pickett, S.T.A.; Cadenasso, M.L. 90 years of forest cover change in an urbanizing watershed: Spatial and temporal dynamics. Landsc. Ecol. 2011, 26, 645–659. [Google Scholar] [CrossRef]
  33. Endreny, T.A. Strategically growing the urban forest will improve our world. Nat. Commun. 2018, 9, 1160. [Google Scholar] [CrossRef] [Green Version]
  34. Peng, J.; Chen, X.; Liu, Y.; Lu, H.; Hu, X. Spatial identification of multifunctional landscapes and associated influencing factors in the Beijing-Tianjin-Hebei region, China. Appl. Geogr. 2016, 74, 170–181. [Google Scholar] [CrossRef]
  35. Peng, J.; Liu, Y.; Liu, Z.; Yang, Y. Mapping spatial non-stationarity of human-natural factors associated with agricultural landscape multifunctionality in Beijing-Tianjin-Hebei region, China. Agric. Ecosyst. Environ. 2017, 246, 221–233. [Google Scholar] [CrossRef]
  36. Peng, J.; Liu, Z.; Liu, Y.; Hu, X.; Wang, A. Multifunctionality assessment of urban agriculture in Beijing City, China. Sci. Total Environ. 2015, 537, 343–351. [Google Scholar] [CrossRef] [PubMed]
  37. Wu, J.; Feng, Z.; Gao, Y.; Peng, J. Hotspot and relationship identification in multiple landscape services: A case study on an area with intensive human activities. Ecol. Indic. 2013, 29, 529–537. [Google Scholar] [CrossRef]
  38. Chu, L.; Sun, T.; Wang, T.; Li, Z.; Cai, C. Evolution and Prediction of Landscape Pattern and Habitat Quality Based on CA-Markov and InVEST Model in Hubei Section of Three Gorges Reservoir Area (TGRA). Sustainability 2018, 10, 3854. [Google Scholar] [CrossRef] [Green Version]
  39. Gong, J.; Xie, Y.; Cao, E.; Huang, Q.; Li, H. Integration of InVEST-habitat quality model with landscape pattern indexes to assess mountain plant biodiversity change: A case study of Bailongjiang watershed in Gansu Province. J. Geogr. Sci. 2019, 29, 1193–1210. [Google Scholar] [CrossRef] [Green Version]
  40. Zhu, W.; Pan, Y.; He, H.; Yu, D.; Hu, H. Simulation of maximum light use efficiency for some typical vegetation types in China. Chin. Sci. Bull. 2006, 51, 457–463. [Google Scholar] [CrossRef]
  41. Feng, X.; Fu, B.; Lu, N.; Zeng, Y.; Wu, B. How ecological restoration alters ecosystem services: An analysis of carbon sequestration in China’s Loess Plateau. Sci. Rep. 2013, 3, 2846. [Google Scholar] [CrossRef] [PubMed]
  42. Riitters, K.; Schleeweis, K.; Costanza, J. Forest Area Change in the Shifting Landscape Mosaic of the Continental United States from 2001 to 2016. Land 2020, 9, 417. [Google Scholar] [CrossRef]
  43. Filoso, S.; Bezerra, M.O.; Weiss, K.C.B.; Palmer, M.A. Impacts of forest restoration on water yield: A systematic review. PLoS ONE 2017, 12, e0183210. [Google Scholar] [CrossRef] [PubMed] [Green Version]
Figure 1. The location and areal extent of Liaoyuan city. The urban boundary data are published by [28].
Forests 12 01779 g001
Figure 2. The flowchart shows the research framework and technical route of this study.
Forests 12 01779 g002
Figure 3. Scatterplots show a method for quantifying the range of the impact of urbanization on landscape multifunctionality. (a) The conceptual change of multifunctionality index with the distance. (b) The derivative of the multifunctionality index.
Forests 12 01779 g003
Figure 4. The spatiotemporal change in urban areas in Liaoyuan from 2000 to 2018. Panels (af) show the spatiotemporal change of impervious areas from 2000 to 2018. Panels (g,h) show the numerical change of impervious areas from 2000 to 2018.
Forests 12 01779 g004
Figure 5. The spatiotemporal change of considered landscape functions in the urban periphery of Liaoyuan city from 2000 to 2015.
Forests 12 01779 g005
Figure 6. The change in considered landscape functions in buffers of the urban periphery of Liaoyuan city from 2000 to 2018. (a) Habitat maintenance; (b) Carbon sequestration; (c) Water yield.
Forests 12 01779 g006
Figure 7. The change of forest landscape multifunctionality in the urban periphery of Liaoyuan city from 2000 to 2018. Panels (a-1,b-1,c-1,d-1,e-1) show the change of multifunctionality index with the distance. Panels (a-2,b-2,c-2,d-2,e-2) show changes in the derivative of multifunctionality index with the distance.
Forests 12 01779 g007
Table 1. Data used in this study.
DataPurpose of UseResolutionPublisher
Global urban boundariesUrban boundary [28]
China land cover datasetQuantify landscape change;
Simulate functions
30 m[29]
PrecipitationSimulate water yield;
Simulate carbon sequestration
1000 mNESSDC 1
TemperatureSimulate carbon sequestration1000 mNESSDC 1
EvapotranspirationSimulate water yield1000 mNESSDC 1
Solar radiationSimulate carbon sequestration100 mTeam-made 2
Digital elevation modelSimulate water yield30 mNESSDC 1
Soil depthSimulate water yield100 mTeam-made 3
Normalized vegetation indexSimulate water yield
Simulate carbon sequestration
100 mTeam-made 4
1 National Earth System Science Data Center. 2 Developed by interpolating meteorological data. 3 Developed by digitalizing soil map. 4 Developed by spatially calculating multispectral bands of Landsat images.
Publisher’s Note: MDPI stays neutral with regard to jurisdictional claims in published maps and institutional affiliations.

