Article

Budget of Plant Litter and Litter Carbon in the Subalpine Forest Streams

School of Life Science, Taizhou University, Taizhou 318000, China
*
Author to whom correspondence should be addressed.
Forests 2021, 12(12), 1764; https://doi.org/10.3390/f12121764
Submission received: 23 November 2021 / Revised: 8 December 2021 / Accepted: 12 December 2021 / Published: 13 December 2021

Abstract

:
Investigations on the budget of plant litter and litter carbon in forest streams can provide a key scientific basis for understanding the biogeochemical linkages of terrestrial–aquatic ecosystems and managing forest catchments. To understand the biogeochemical linkages among mountain forests, riparian vegetation, and aquatic ecosystems, the changes in litter input and output from the subalpine streams with stream characteristics and critical periods were investigated in an ecologically important subalpine coniferous forest catchment in the upper reaches of the Yangtze River. The annual litter input to the stream was 20.14 g m−2 and ranged from 2.47 to 103.13 g m−2 for 15 streams during the one-year investigation. Simultaneously, the litter carbon input to the stream was 8.61 mg m−2 and ranged from 0.11 to 40.57 mg m−2. Meanwhile, the annual litter output varied from 0.02 to 22.30 g m−2, and the average value was 0.56 g m−2. Correspondingly, the litter carbon output varied from 0.01 to 1.51 mg m−2, and the average value was 0.16 mg m−2. Furthermore, the average ratio of litter carbon input to output was 270.01. The maximum and minimum values were observed in the late growing season and the snowmelt season, respectively. Additionally, seasonal variations in temperature, together with the stream length, dominated the input of litter and litter carbon to the stream, while the precipitation, temperature, water level, and sediment depth largely determined their output. Briefly, the seasonal dynamics of litter and litter carbon were dominated by stream characteristics and precipitation as well as temperature patterns.

1. Introduction

In the geosphere, streams cover less than 3% of the forest catchment area, but function as the bridges linking terrestrial–aquatic biogeochemical cycles [1]. In particular, plant litter from neighboring forests and riparian zones is the major source and carrier of carbon in forest streams and plays crucial roles not only in maintaining stream ecosystem productivity, but also in maintaining the structure and function of the butted aquatic ecosystem [2,3]. Additionally, litter decomposition in the forest stream ecosystem can contribute significantly to the global carbon cycle [4,5,6]. Therefore, understanding the budget of litter and litter carbon in forest streams can provide a key scientific basis for managing forest catchments and predicting the global carbon cycle.
The forest stream might act as a sink of plant litter and bioelements in the forest catchment. Theoretically, litter input to the stream is hierarchically regulated by three interactive factors: climate, forest type, and stream characteristics [7]. First, the climate has been considered the primary factor influencing litter production [8]. Generally, average litter production decreases gradually from tropical zones to boreal alpine zones along the climate gradient [9,10]. Compared to cold temperate zones, evergreen broadleaved forests in tropical regions often have larger amounts of litter production due to the higher temperature and moisture [11,12], implying that more litter can enter the stream. Second, the dynamics of litter input vary greatly with forest types, as different tree species have different phenological phases [7,13], which in turn determine the quantity and dynamics of litter input to the forest stream [13,14]. For instance, on a local scale, evergreen and deciduous forests usually show higher litter production than dark coniferous forests in the subalpine forest region [15,16]. Plant species composition in the riparian zone differs greatly from that in the mountain forest, and the litter production of shrub and herb species in the riparian zone is lower than that in the mountain forest [7,14], implying that the litter input to the stream in the riparian zone might be lower than that directly in the forest. Third, litter input is also modulated by the stream length and width [17], and longer and wider streams can receive more litter along the stream [18,19]. Although litter input to the stream has been systematically investigated in northern America [20,21,22], litter input to streams has not been fully investigated around the world, limiting our understanding of the biogeochemical linkages of mountain forest and riparian zones with streams and rivers.
The litter and litter carbon output from streams are known as the major carbon sources of butted rivers. That is to say, the forest stream also acts as the source of litter and litter carbon [23,24]. In theory, the litter output from forest streams is usually regulated by the stream litter quality and quantity, stream biological community, stream characteristics, and climate [8,25]. To begin with, the magnitude of litter input to the stream determines the size of the litter source of a butted river [4,5]. Meanwhile, the scouring action of stream water on litter can directly accelerate litter fragmentation [26], which may lead to the output and confluence characteristics of litter varying with the seasons [27,28,29]. For example, streams with lower flow rates and slower velocities always accompany faster litter decomposition and litter deposition, leading to smaller amounts of output, and vice versa [30]. In addition, the length and width of the streams, together with their microtopography, might significantly influence litter output [29]. Finally, forest stream characteristics, such as discharge and velocity, are always regulated by seasonal precipitation (rainfall, snowfall, and snowmelt), theoretically modulating the output of litter and litter carbon from the streams. In particular, the plant rhythm with seasonal changes accompanies the seasonal dynamics of precipitation and temperature, which play important roles in controlling the output of litter from a forest stream [7,31]. Therefore, investigations into the litter output from forest streams could facilitate a better understanding of the biogeochemical linkages of mountain forests and riparian zones with aquatic ecosystems.
Carbon is the basic component in both terrestrial and aquatic ecosystems. The dynamic pattern of litter carbon in forest stream ecosystems can reveal terrestrial–aquatic carbon biogeochemical linkages [30,32]. Past investigations have found that the carbon fractions derived from upstream and neighboring ecosystems are the two major sources of dissolved carbon (DC) in forest stream ecosystems [33,34]. Most investigations of carbon biogeochemical linkages between mountain forests and butted aquatic ecosystems have employed the small-scale runoff field method [35]. However, this method has difficulty revealing the roles of forest streams in terrestrial–aquatic carbon biogeochemical linkages, especially in geographically fragile mountainous regions [36]. First, due to geological fragmentation and serious soil percolation [37], surface runoff is rarely observed in most rainfall and snowfall events, while percolating water becomes an important biogeochemical link between mountain forest ecosystems and aquatic ecosystems in fragile mountainous regions. Second, forest streams can be directly involved in the biological carbon cycle rather than indirectly involved through surface runoff, since litter from forest and riparian vegetation is a major source of carbon input to the butted aquatic ecosystem [38]. Third, the riparian zone is an important domain in the forest stream ecosystem. The decomposition of allochthonous organic materials (e.g., foliar litter) in riparian zones is often a critical factor affecting the continued availability of carbon resources in these ecosystems [39]. Hence, the systematic investigation of litter carbon dynamics in streams and riparian zones will provide baseline data for further understanding of the biogeochemical linkages of terrestrial–aquatic ecosystems.
As the second largest forest region in China, the subalpine forest region in the eastern Qinghai-Tibet Plateau is the most important freshwater conservation area and headwater region of the Yangtze River, and plays paramount and irreplaceable roles in holding water, conserving soil, and maintaining the safety of water resources and downstream aquatic ecosystems [40,41]. These forest stream ecosystems are typically cold ecosystems that experience considerable seasonal freezing and thawing events, and seasonal changes are associated with distinct changes in environmental conditions [42,43]. Therefore, a deep investigation of the budget of litter and litter carbon in these forest stream ecosystems is key to revealing the carbon biogeochemical linkages between subalpine forests and aquatic ecosystems.
Although the concentration and storage of carbon in woody and nonwoody debris have been investigated in subalpine forest streams [38,44], little information is available on estimating the budget of litter and litter carbon in these subalpine forest streams. Therefore, we hypothesized that (1) the seasonal input and output of litter and litter carbon might have different dynamic patterns; (2) the maximum and minimum values of the indices mentioned above would appear in the litterfall and snowmelt periods, respectively; and (3) the litter and litter carbon input to the streams would be higher than the outputs from the streams in forest stream ecosystems.

2. Material and Methods

2.1. Site Description

This study was conducted at the Long-Term Research Station of Alpine Forest Ecosystem in the Bipenggou Valley (31°14′~31°19′ N, 102°53′~102°57′ E, 2458~4619 m above sea level (masl)), Li County, Southwest China, which is located in the alpine gorge area with frequent geological breaks, clear seasonal snow cover (the maximum snow depth was about 35 cm), and frequent freeze/thaw cycles [7] (Figure 1). The mean annual precipitation is approximately 850 mm, and the annual mean air temperature is approximately 3 °C, with maximum and minimum temperatures of 23 °C (July) and −18 °C (January), respectively. The frozen season lasts from November to April, and thaw begins in late April. This subalpine forest is dominated by Minjiang fir (Abies faxoniana Rehder & E.H.Wilson), larch (Larix mastersiana Rehder & E.H.Wilson), and cypress (Sabina saltuaria Rehder & E.H.Wilson), and is interspersed with shrubs of azaleas (Rhododendron spp.), willow (Salix spp.), and barberry (Berberis sargentiana C.K.Schneid). The herbaceous plants consist mainly of ferns (Cystopteris montana (Lam.) Bernh. ex Desv) [7]. The concentrations of carbon (C), nitrogen (N), and phosphorus (P) in the surface soil (5 cm depth) was 126.0, 5.8, and 1.2 g kg−1, respectively.

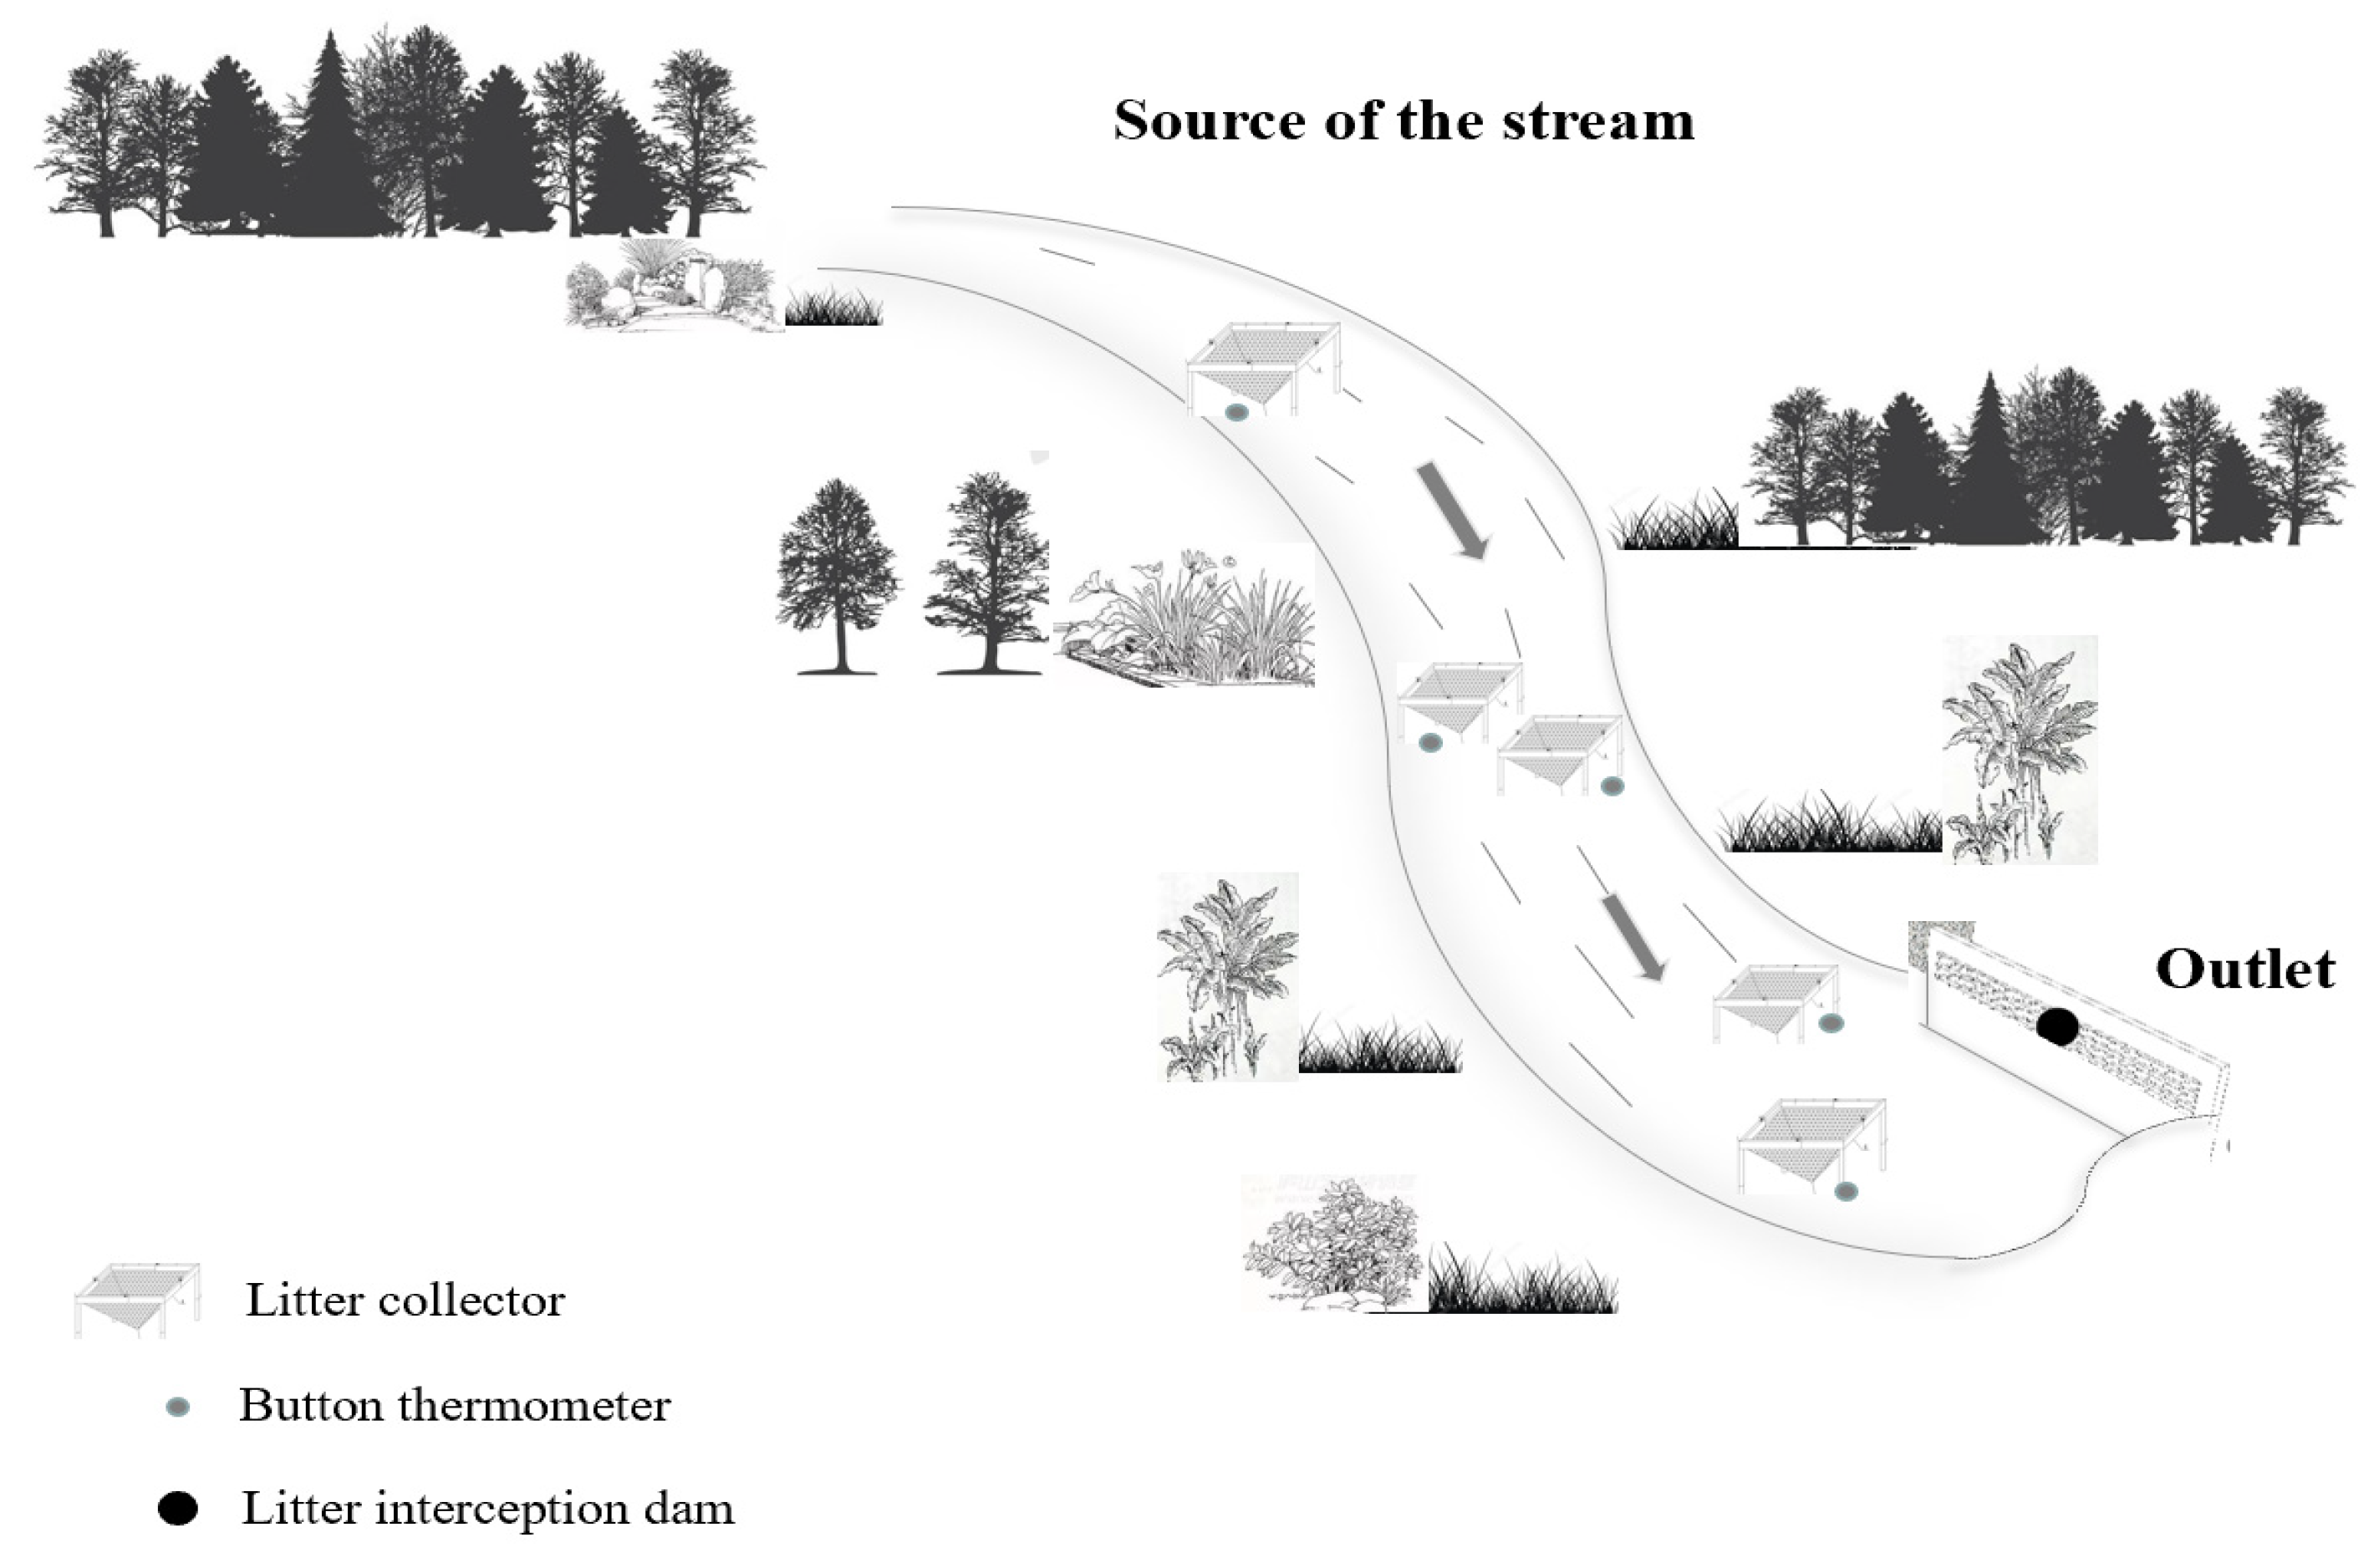
2.2. Experimental Design

Based on previous investigations [7,38], the input and output of litter and litter carbon in 15 representative permanent streams in the forest catchment were investigated. Three sampling sites for collecting litter were set up in the upper, middle, and end of every stream, and the streams’ characters (length, width, sediment depth, and flow velocity) were also measured at every sampling time. The length was measured from the source to the estuary using a flexible rule along the banks of the streams. Meanwhile, the width was measured horizontally from one bank to another at every sampling site, the depth was measured vertically using a rule, and the flow velocity was measured using a flowmeter (Martin Marten Z30, Current-meter, Barcelona, Spain) every 30 min. Every index mentioned above was measured three times, then the mean was taken at every sampling time for every sampling site. These streams are in a typical subalpine forest catchment at elevations of 3600~3700 m, and the total area of the investigated forest catchment was 4.3 km2. At every site, a button thermometer (iButton DS1923-F5, Maxim/Dallas Semiconductor, Sunnyvale, CA, USA) was set to record the temperature every 2 h, and the precipitation was measured using a rainfall monitor (ZXCAWS600, Zxweather, Beijing, China) for real-time monitoring.

2.3. Monitoring the Input and Output of Litter and Litter Carbon

In order to collect litter, according to the stream length, a quadratic litter collector (0.8 m × 0.8 m) was randomly installed at the source, middle, and end of the stream (when the stream width < 0.8 m, one litter collector was positioned; when the stream width > 0.8 m and <1.6 m, two litter collectors were positioned; the stream widths are shown in Table 1), and each was installed 0.5 m above the water or ground surface (Figure 2). To avoid litter decay in the litter collectors caused by rainfall, the litter samples were collected every 15 days, but the litter was collected only once in the cold winter since litterfall in winter was rare. All of the collected litter samples were put into precleaned polyethylene bags and transported to the lab. The samples were dried to a constant weight and stored at 65 °C for less than one week until analysis.
To make sure the amount of litter collected was accurate, a litter collector (0.8 m × 0.8 m) was installed at the start of every stream (the width of all stream sources were less than 0.8 m). Two litter interception dams with different mesh specifications were set at the outlet of each stream, and the total amount of litter intercepted by the two interception dams was the output amount of litter (Figure 2). The interception dam with 3 cm × 3 cm apertures was in front, which mainly collected litter with a larger diameter, and the 100-mesh interception dam was installed behind, which was mainly used to collect litter of a smaller diameter. The cycles of measuring the litter output were consistent with the litter input measurement. During the sampling time, all litter collected from the interceptor was quickly brought back to the laboratory, dried to a constant weight at 65 °C, then weighed and recorded as the litter output.
We divided one year into five different periods, i.e., the snowmelt season (SMS: April to May), early growing season (EGS: May to June), growing season (GS: July to August), later growing season (LGS: September to October), and seasonal snow cover (SSC: November to April the following year) based on phenological changes, seasonal precipitation, and temperature dynamics [40]. Litter was collected nine times in the growing seasons and four times in the non-growing seasons. Specifically, litter in the collectors was collected during the LGS at approximately 15-day intervals. The quantity of inputted and outputted litter and litter carbon at each period was calculated as the cumulant values of this stream, and the 15 streams were treated as 15 repeats during data analysis.
The temperatures in the in-stream and riparian zones varied considerably with the ecosystem type during the two years of the experiment [7]. The temperature fluctuated sharply with critical periods, with the average daily temperatures ranging from 0 °C to 10.7 °C. However, the in-stream and riparian zone temperatures were almost always above 0 °C throughout the investigation period. Similarly, the water varied substantially between the stream and riparian zones for a comparable period, and varied significantly within the stream or riparian zone among different periods (Table 1).

2.4. Analytical Methods and Calculations

The concentration of litter carbon was determined using the potassium dichromate oxidation–external heating method [45]. Following this, 0.01 g of the dried litter that had been sieved through a 0.15-mm sifter was placed in the bottom of a 100-mL Erlenmeyer flask. The required amount of H2SO4 (5 mL) and 10 mL of potassium dichromate solution were added. After attaching a reflux condenser, the mixture was boiled at 220–230 °C for 15 min on an electric stove. After cooling and rinsing the condenser with water, 3 to 5 drops of N-phenylanthranilic acid were added. The titration was performed with a 0.2 M solution of ferrous sulfate salt at room temperature. With the addition of one drop, the color shifted from violet to bright green:
CS = (CC × ML)/SS
where CS is the litter carbon stock; CC is the carbon concentration, g kg −1; ML is the litter stock, g; and SS is the area of the stream, m2.
Linear mixed effect models were used to analyze the relationships of the input and output of litter and litter carbon with climate and stream characteristics in the subalpine forest stream among different sampling periods. First, we tested the normality of residuals, homoscedasticity of errors, and independence of errors to determine whether our data met the assumptions of the analyses. Second, the sampling period was treated as a fixed effect, and then we conducted a repeated measures analysis of variance (ANOVA) to examine the variability of the different variables (litter input, litter carbon input, litter output, and litter carbon output) at different critical periods. Third, to better illustrate the correlations of the input and output of litter and litter carbon with the explanatory variables, these variables were treated as fixed factors and the stream was included as a random factor. We used linear and quadratic models to fit the relationships of four indices of litter with the changes in the various explanatory variables. The relationships between the ratios of input to output of litter and litter carbon vs. stream characteristics were also tested by the linear mixed effect models. All analyses were conducted in R using the LME4 package [46].

3. Results

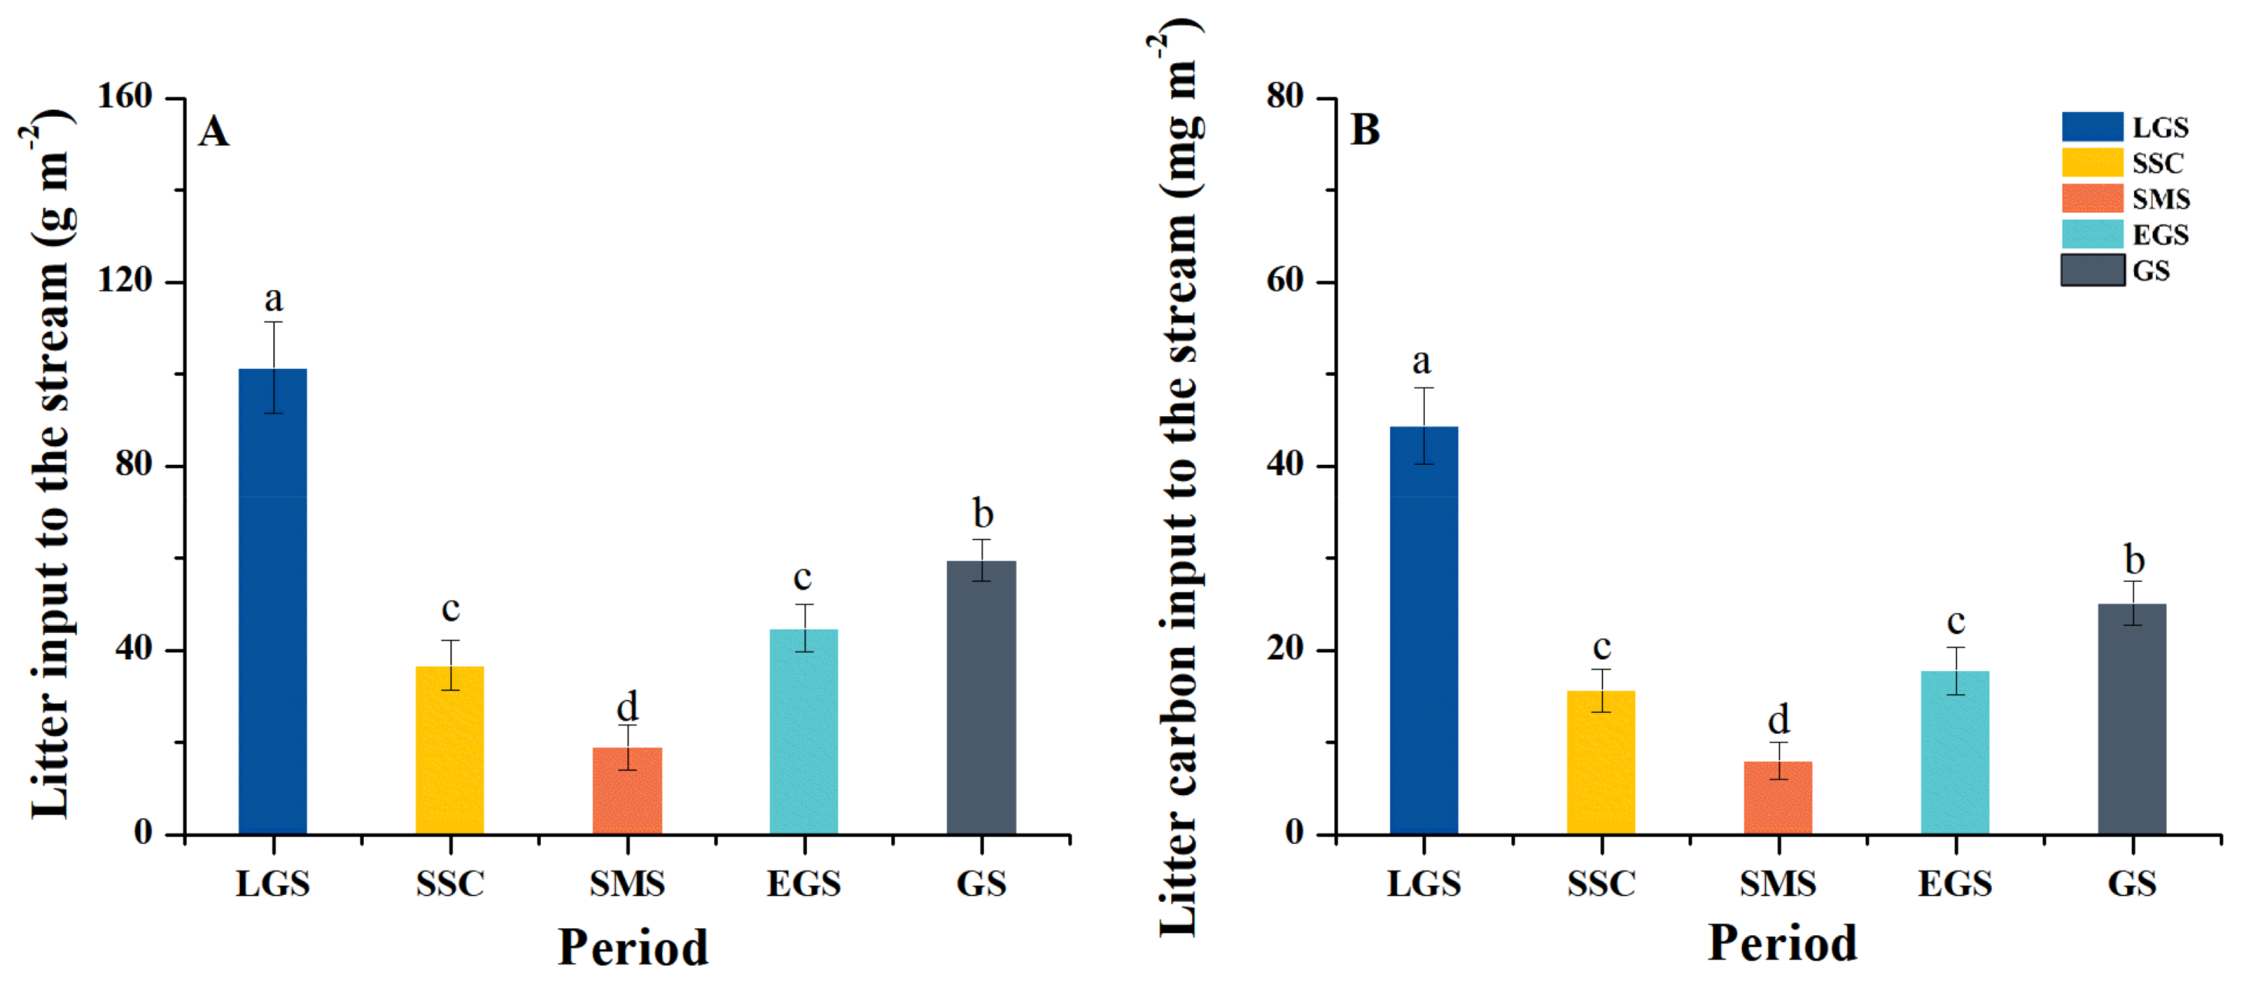
3.1. Litter and Litter Carbon Input to the Stream

The litter input to the stream showed two peaks (Figure 3A). The maximum peak (101.40 g m−2) was observed in the LGS and then decreased gradually, reaching the minimum value (18.91 g m−2) in the SMS. The second peak (59.44 g m−2) was found in the GS (Figure 3A), and these values were all averages per period. Meanwhile, the litter input to the stream ranged from 2.47 to 103.13 g m−2, and the annual value was 20.14 g m−2 for the 15 investigated streams during this one-year investigation.
Like litter input, the dynamic pattern of litter carbon in the streams increased gradually from September to November (LGS), reached its maximum value (44.39 mg m−2), and then decreased gradually from April to June (SMS) to reach its minimum value (7.98 mg m−2) in SMS (Figure 3B). The second peak (25.12 mg m−2) of litter carbon input to the stream was observed in the GS (Figure 3B), and these values were all average of per period. For all streams, the litter carbon input to the streams ranged from 0.11 to 40.57 mg m−2, and the annual value was 8.61 mg m−2 for all streams in this one-year investigation.

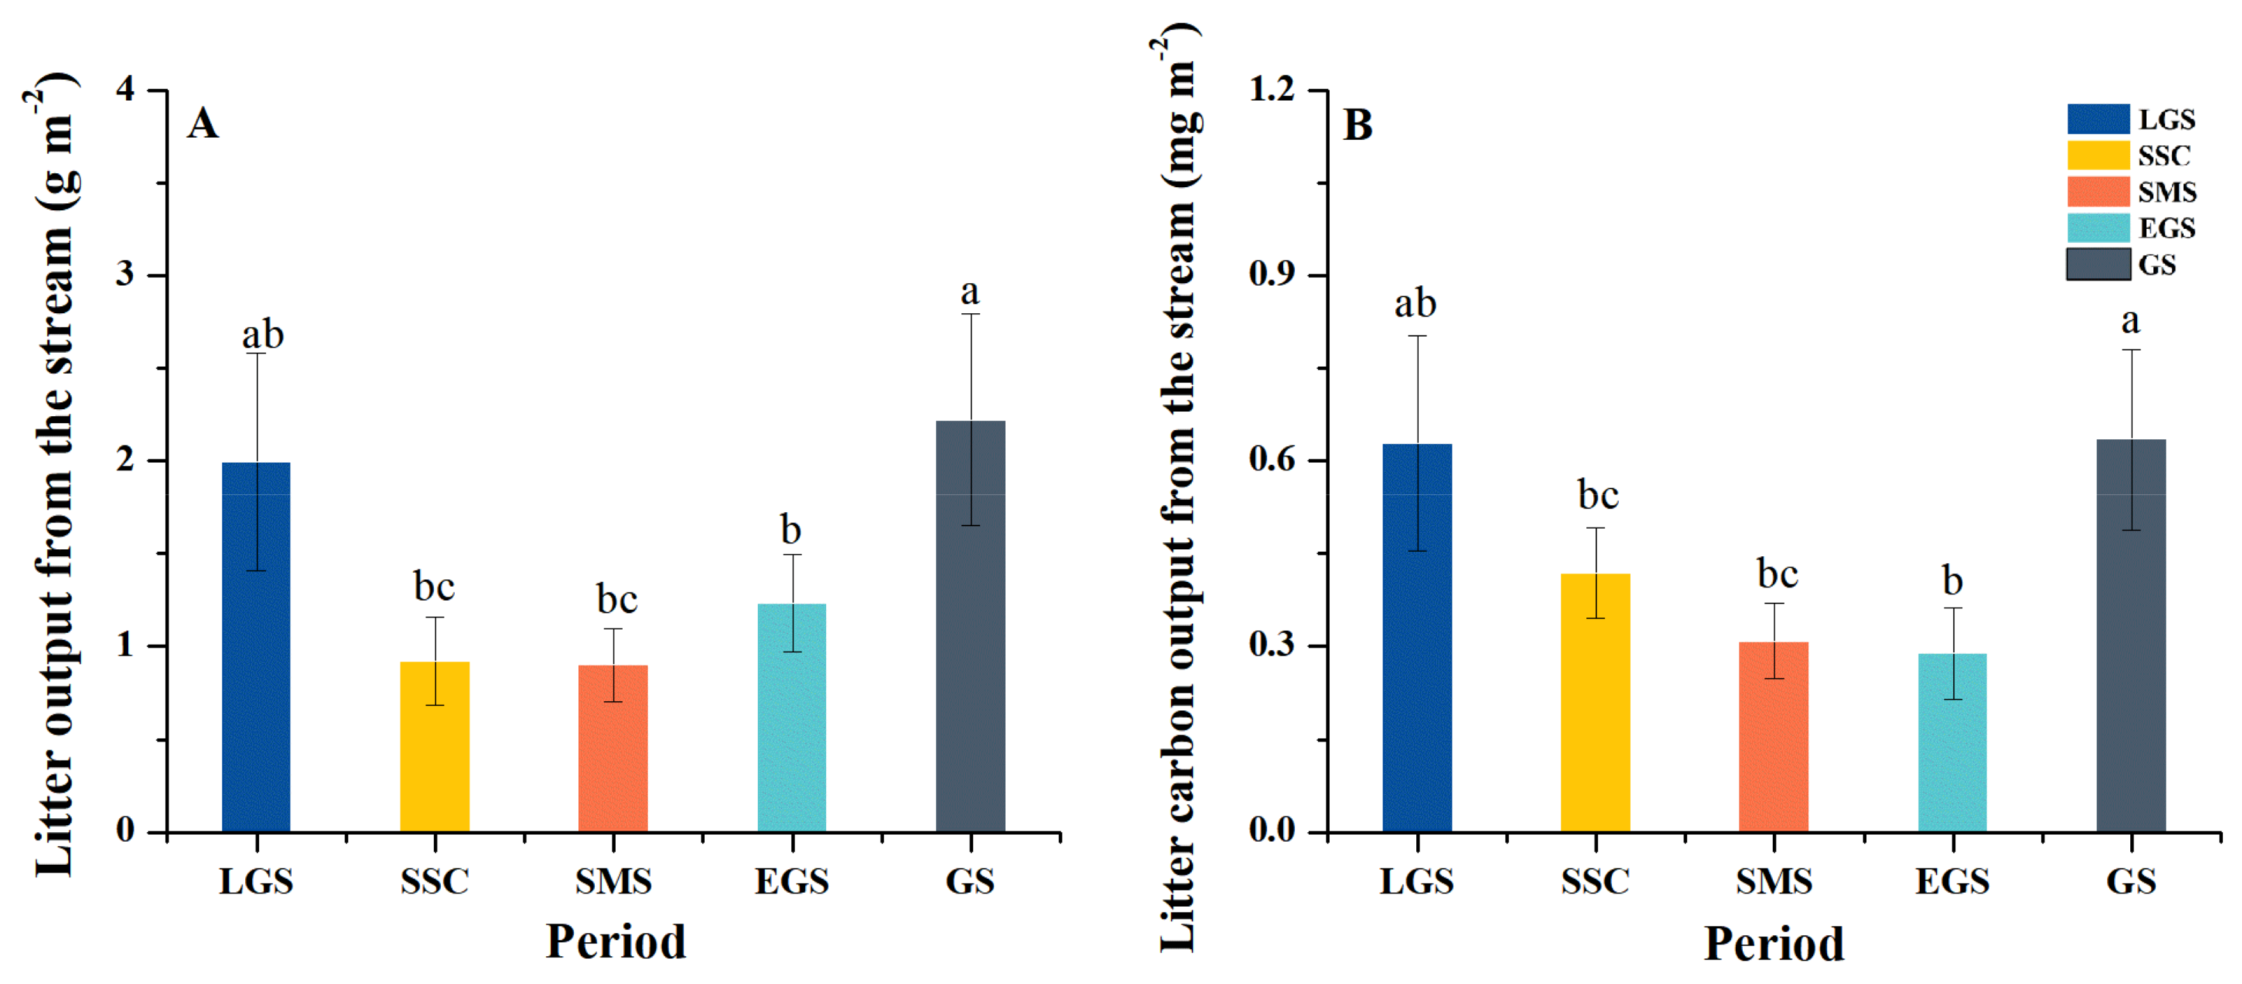
3.2. Litter and Litter Carbon Output from the Stream

The dynamic pattern of litter output from the stream also showed a similar pattern to that of the input. The maximum value (1.69 g m−2) appeared in the LGS, and then the value decreased gradually, reaching the minimum value in the SMS (0.46 g m−2). The second peak (1.72 g m−2) was observed in the EGS (Figure 4A), and these values were all average of per period. The litter output from the all streams ranged from 0.02 to 22.30 g m−2, and the annual average value was 0.56 g m−2 during this one-year investigation.
Consistent with the pattern of litter input to the stream, the output of litter carbon from the streams also had two peaks (Figure 4B), which also appeared in the LGS (0.63 mg m−2) and EGS (0.64 mg m−2), and the lowest point was observed in the SMS (0.31 mg m−2) (Figure 4B), and these values were all average of per period. Additionally, the litter carbon output from all streams ranged from 0.01 to 4.53 g m−2, and the annual value was 0.45 g m−2 during this one-year investigation.

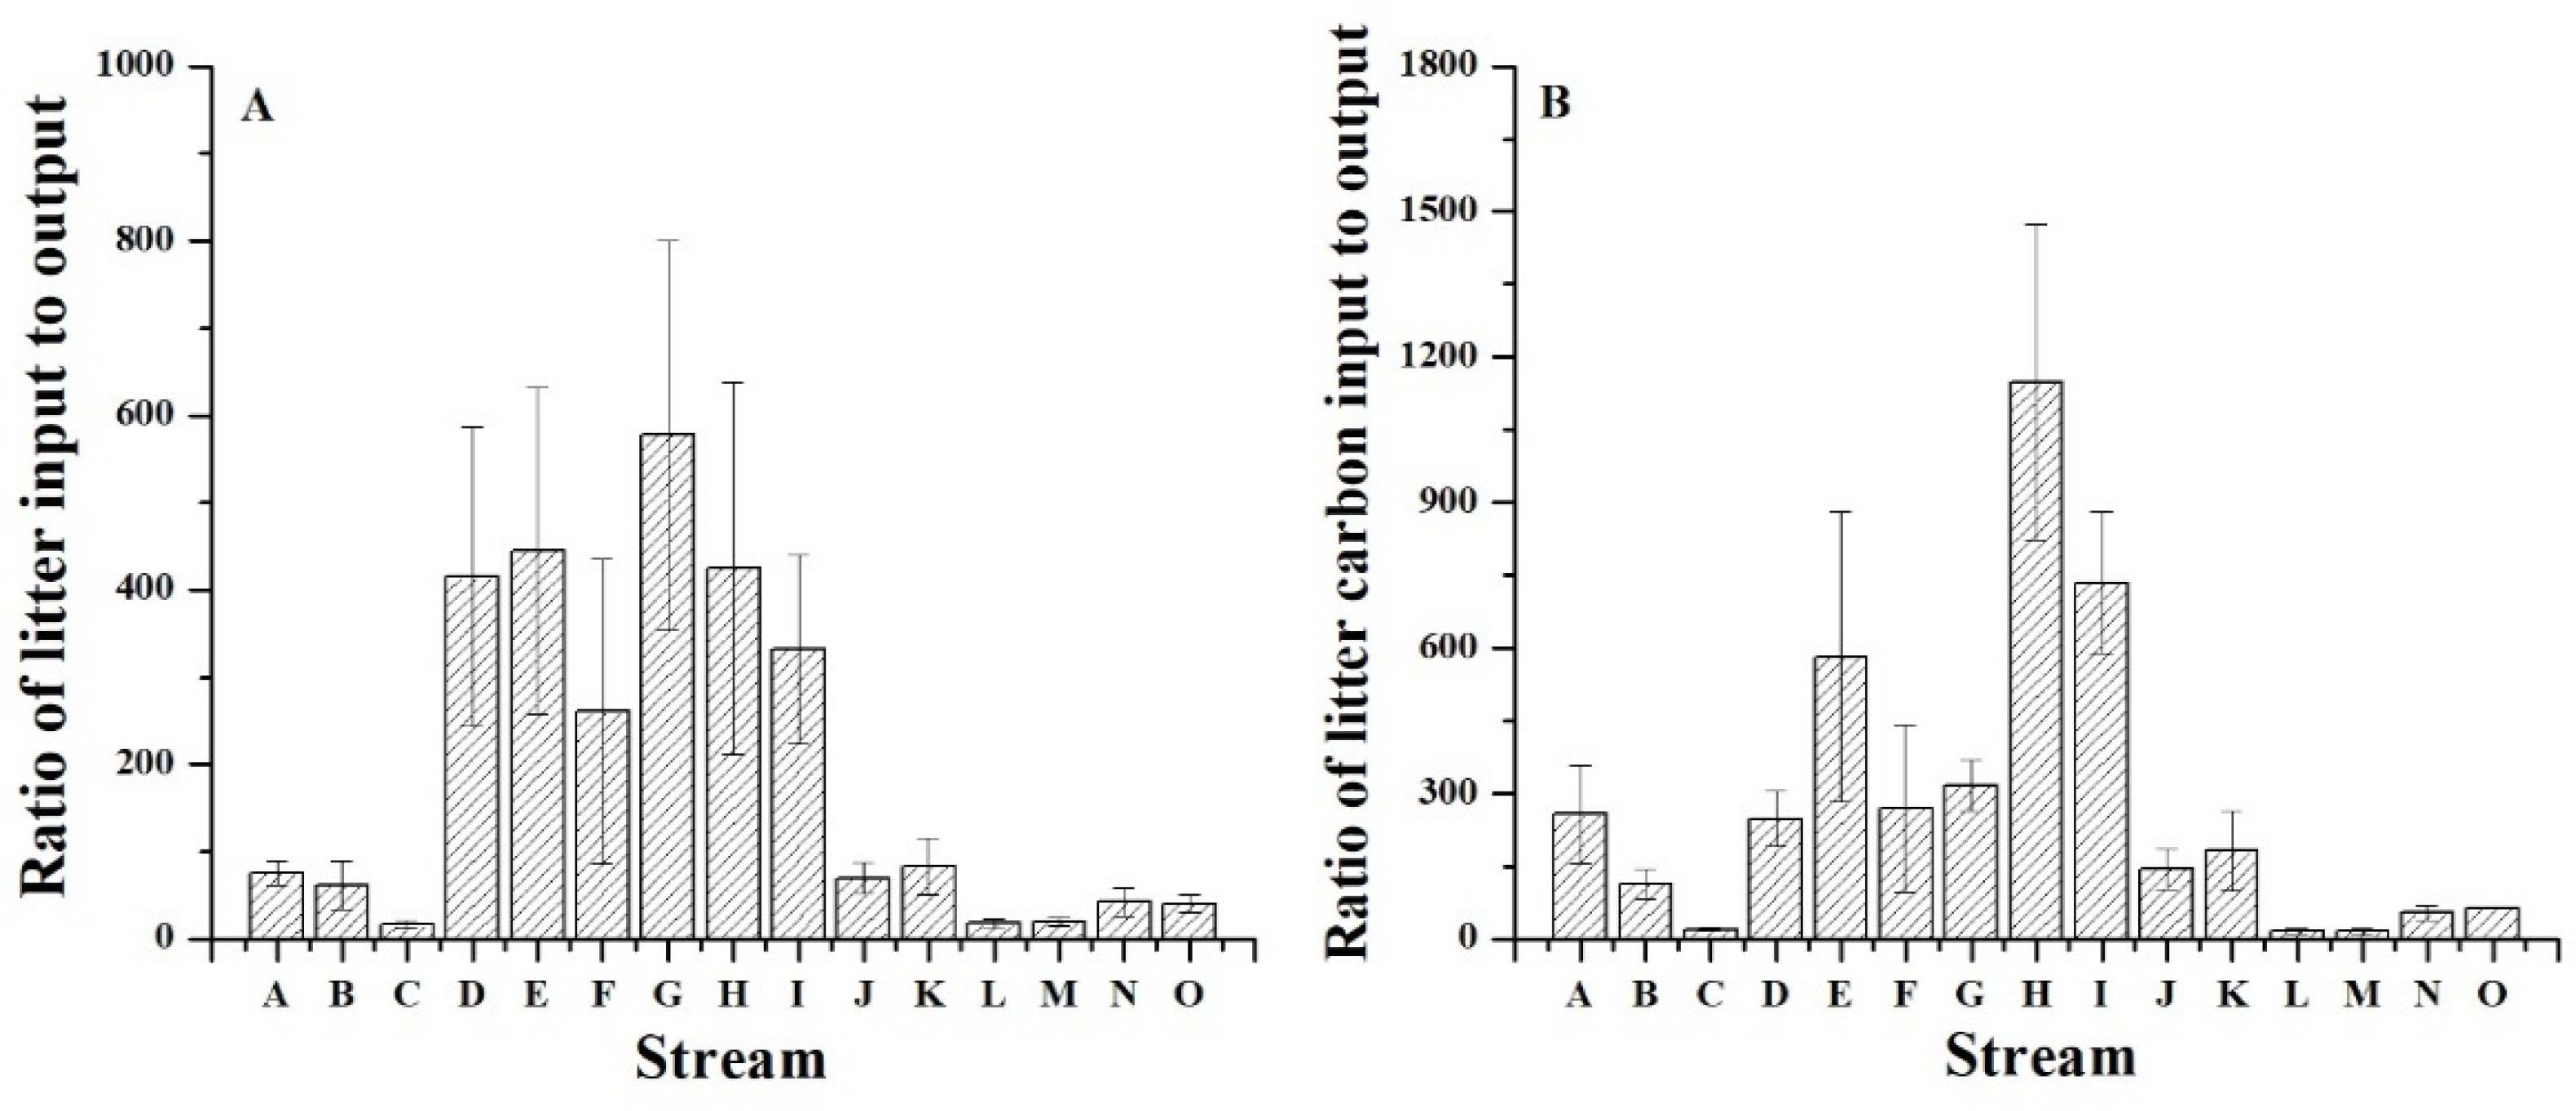
3.3. The Ratios of the Input to Output of Litter and Litter Carbon

During the investigated period, the average ratios of input to output of litter and litter carbon were 188.17 and 270.01 at the forest catchment level, respectively. The ratios of litter input to output ranged from 23.85 to 619.67 (Figure 5A), and the ratios of the input to output of litter carbon ranged from 16.80 to 1147.91 (Figure 5B). Meanwhile, the ratios of both litter input to output and litter carbon input to output showed similar dynamic patterns with the two peaks appearing in the LGS (272.74, 329.70) and EGS (190.46, 304.13), and the lowest point observed in the SMS (37.99, 67.11) for litter and litter carbon, respectively. Additionally, the ratios of input to output for both litter and litter carbon varied greatly with the investigated streams, and the averaged ratios of input to output ranged from 16.42 to 577.91 for litter (Figure 6A), and from 16.80 to 1147.91 for litter carbon, respectively (Figure 6B).

3.4. Relationships of Litter and Litter Carbon Input/Output with Relative Variables

Litter input to the streams was significantly and positively correlated with the temperature and length (Table 2). However, litter input was slightly and negatively correlated with the stream width, but slightly and positively related to the precipitation, water level, sediment depth, and flow velocity of the forest streams (Table 2). Correspondingly, litter carbon input to the streams was also showed the similar relationships with relative variables (Table 2).
Similarly, litter output from the streams was significantly and positively correlated with the precipitation, temperature, litter input, and flow velocity, and slightly and positively with the water level, but significantly and negatively with sediment depth, and slightly and positively with stream width and length. Correspondingly, litter carbon output from the streams was also the similar relationships with the variables mentioned above (Table 3).

4. Discussion

Our results demonstrated that both the input and output of litter and litter carbon in the subalpine forest streams showed two peaks with critical periods, which was not consistent with our first hypothesis that the seasonal input and output of litter and litter carbon might have different dynamic patterns. Climate factors (temperature and precipitation) together with stream characteristics (sediment depth, length, and flow velocity) drive the seasonal sink-source pattern of litter and litter carbon in the subalpine forest streams. Meanwhile, the results showed that the maximum and minimum values of all the indices mentioned above appeared in the later growing season and snowmelt periods, respectively, which was consistent with our second hypothesis that the maximum and minimum values of the indices mentioned above would appear in the litterfall and snowmelt periods, respectively. In particular, the litter and litter carbon input to the streams were higher than the output from the streams in the forest-stream ecosystem, which was consistent with our third hypothesis that the litter and litter carbon input to the streams would be higher than the outputs from the streams in forest-stream ecosystems, implying that subalpine forest streams play an important role in carbon sink in the subalpine forest region.

4.1. Dynamics of Litter and Carbon Input in the Subalpine Forest Streams

Worldwide, the annual litter input to forest streams varies from 3 to 1000 g m−2 y−1, and the highest and lowest values are observed in a coniferous forest in North Carolina and in a shrub/grass-covered riparian zone of Deep Cr, Idaho, respectively (Table 4) [20,21,22,47,48,49,50]. In this study, the annual litter input to the subalpine forest streams was 20.14 g m−2 and ranged from 2.47 to 103.13 g m−2 for our one-year investigation. Meanwhile, litter as the carrier of carbon biogeochemical linkages between forest and stream ecosystems [7], our results also showed the average litter carbon input to forest streams was 8.61 mg m−2 and ranged from 0.11 to 40.57 mg m−2. Annual litter and its carbon input to the forest streams are dominated by the litter production of mountain forest and riparian vegetation through which the streams flow. That is, the higher the litter production in neighboring forest and riparian vegetation, the higher the litter and more litter carbon input to the butted streams. Meanwhile, the streams are linked more closely with the forest ecosystems, and more litter can be inputted to the streams since longer and wider streams can receive more litter. For instance, Wenger et al. (1999) have found that the interception and conversion efficiencies of riparian zones for litter depend on the width of the riparian zones [51]. Previous investigations have also found that subalpine deciduous forests have higher litter production than those in the subalpine shrub and grass vegetation [15]. The subalpine forest region in this study consists mainly of dark coniferous tree species and deciduous coniferous and broadleaved tree species, and litter production varies greatly with forest types [52]. Higher litter production is observed in the Minjiang fir-dominated primary coniferous forest and Larix masteriana-dominated deciduous coniferous forest, and the lower value is observed in the rhododendron shrub forest [15]. Consequently, annual litter and litter carbon input to the subalpine forest streams also varied greatly with the investigated streams, resulting from the investigated streams having different length and width, different forest types and riparian vegetation types along the streams (Table 1). In this study, both litter and litter carbon input were significantly and positively correlated with the stream length (Table 2), indicating that the longer the stream, the more litter input to the streams, which was consistent with the litter input. However, the stream width correlated slightly and negatively with litter input owing to the wider streams flowing through the riparian zones where shrub and herb species produce less plant litter. These results suggest that the litter input to the streams from mountain forests plays more important roles in maintaining the structure and function of the subalpine forest stream ecosystem, since plant litter is a pivotal component of stream food webs and ecosystem functioning [3].
Litter and litter carbon input to the forest streams also showed two peaks with critical periods, and the maximum and minimum values were observed in the late growing season and seasonal snowmelt season, respectively. A reasonable explanation is that seasonal climate change controls the plant rhythm and in turn dominates the seasonal dynamics of litterfall in mountain forests and riparian vegetation. Two peaks of litterfall in the subalpine forest have been observed in the early and late growing seasons [15,53]. The litterfall peak that occurs in the early growing season contributes to the abnormal litter due to windstorms harming young leaves, while the maximum litterfall peak in the late growing season contributes mainly to the plant rhythm due to plant leaf senescence and falling in autumn [52]. Consequently, higher litter input to the forest streams was observed in the later growing season and early growing season. Correspondingly, lower litterfall was accompanied by lower litter input in the snowmelt season. Meanwhile, stream characteristics are often regulated by seasonal precipitation and then influence the seasonal dynamic pattern of litter input. Heavier rainfall can increase the velocity and width of stream flow, leading to more forest floor litter input to the forest stream. Johnson and Jones (2001) have revealed that the stream water level is a limiting factor for the interception and transformation of elements, and more litter can be inputted to the forest stream when the stream water level rises [54]. Briefly, the litter input to forest streams is affected by seasonal climate change, stream characteristics and plant growth rhythms.

4.2. Seasonal Dynamics of Litter and Carbon Output from Subalpine Forest Streams

The annual litter output from the investigated subalpine forest streams varied from 0.02 to 22.30 g m−2, and the average value was 0.56 g m−2 for the investigated streams during this one-year investigation. Correspondingly, the annual litter carbon output varied from 0.01 to 1.51 mg m−2, and the average value was 0.16 mg m−2. In theory, the litter and litter carbon output from the streams depend mainly on three pathways. Firstly, the stocks of litter in the stream ecosystem determine the output from the streams. In other words, the higher the reserves of litter in the streams, the higher the litter and litter outputs from the streams, implying that the litter and litter input to the streams manipulate the litter outputs from the streams [3,15,30]. Secondly, the decomposition and deposition of plant litter in the stream largely regulate the output of litter. For instance, Yue et al. (2016) have found that plant litter incubated in the subalpine forest streams decomposes completely after two years [7]. Our sediment data at the bottom of the streams (unpublished) showed that more than 95% of the litter was locked in the stream floor as sediments: the more litter that is stored in the form of sediment, the less the output of litter from the forest streams, leading to a lower carbon output. The significantly negative relationships found between litter and litter carbon output and sediment depth in this study were consistent with this (Table 3). Thirdly, litter loss in deeper streams was generally significantly higher for a specific litter species [7,55]. Given these cases, stream characteristics, particularly the sediment depth and flow velocity, also play key roles in regulating litter carbon output [30]. For example, Bilby et al. (2003) also found that as stream width increased from 5 m to 15 m, the water velocity also increased; as the litter carbon captured by falling wood dropped by 80%, more carbon was outputted from the streams in the study of the Coastal Pacific Northwest of the United States [56]. The positive relationship between litter output and water level and flow velocity in this study was consistent with their results. Overall, forest streams are key bonds of biological matter linkage between mountain forest ecosystems and downstream.
In aquatic habitats, contrary to our expectation, the litter and its carbon output from the forest streams also presented similar seasonal patterns to those of the input. The results can be explained by the following reasons. On the one hand, the factors influencing litter carbon input to streams also modulate litter carbon output from the streams. For example, the peak and nadir values of litter carbon output are also observed in the later growing season and snow melting season, respectively. On the other hand, stream characteristics also play key roles in manipulating the output of litter and litter carbon from the streams, and these characteristics are always regulated by seasonal precipitation and plant rhythm. In this study, the highest values of litter carbon output from the forest streams were observed in the later growing season, owing to the higher flow velocity and litterfall peak in this period, while the lower flow rate, together with less litter production in the snow-covered period, might contribute more to the occurrence of the lowest values during the snowmelt season. Seasonal precipitation, together with seasonal melting of snow cover, dominates the periodic fluctuations in the depth, velocity, and width of forest streams and determines the seasonal dynamics of litter and litter carbon output from the streams. The forest streams act as the source of litter and litter carbon in the butted river, and the output dynamics are complexly regulated by the sink of litter and litter carbon in the streams and the stream characteristics, as affected by seasonal precipitation.

4.3. Litter Carbon Budget in the Subalpine Forest Stream

The average ratio of litter input to output in the subalpine forest catchment was 188.17, and the average ratio of input to output of litter carbon was 270.01, indicating that forest streams act as the sink of litter carbon in the subalpine forest region. Owing to this huge difference between the input and output, the variables that had a significant effect on litter and litter caron input could explain the significant variability of these ratios in the sampled streams to a great extent. Possible reasons for this wide gap between litter carbon input and output include the following. First, although much litter was inputted to the forest streams, more than 95% of the litter input was deposited at the bottom of the streams in the form of sediment, as mentioned above, resulting in very little carbon being exported from the streams in the form of litter. Second, the effects of abrasion caused by sediment transport in the streams could be another driver of the higher litter loss, which was also regulated by seasonal precipitation (rainfall and snowfall). This process could accelerate litter decomposition rates in aquatic ecosystems [55], leading to less litter carbon being output in the form of litter. Generally, the decomposition and deposition of plant litter in the stream largely regulate the gap between the input and output of litter carbon. For all of the reasons above, forest streams are indispensable carbon sinks in the subalpine forest stream ecosystem. However, the processes and mechanisms of the stream litter budget need to be fully investigated in the future.
Although the carbon output from the streams was smaller than the carbon input, the dissolved carbon output from the streams was a noteworthy part of the forest ecosystem [36,57]. The litter carbon output from the forest streams in this study was much less than that in the investigation of east Finland (0.62–0.94 g m−2 a−1) [58], which might be mainly due to the streams in our research having a shorter length and less anti-interference ability, or since much of the carbon stored in the litter was retained in the more complex ecosystems of rivers and lakes rather than in small streams, resulting in a smaller amount of carbon in the forest catchments [59]. Aquatic litter carbon (stream and riparian zone) could connect forest ecosystems with river ecosystems [16,60]. Therefore, investigations of the litter carbon budget in the forest streams can provide baseline data for further studies on the interconnections between individual aquatic and terrestrial ecosystems within a forest stream ecosystem.

5. Conclusions

Both the input and the output of litter and litter carbon in the subalpine forest streams showed similar patterns with critical periods, as affected by seasonal changes in temperature and precipitation together with stream characteristics (length, flow velocity, sediment depth, etc.). The seasonal temperature pattern and the stream length dominated the input of litter and litter carbon to the stream. Meanwhile, the seasonal temperature and precipitation patterns, sediment depth, and flow velocity determined the output of litter and litter carbon from the stream. Additionally, the litter and litter carbon input to the streams were higher than the output from the streams in the forest stream ecosystem, indicating that the subalpine forest streams play a crucial role in linking the carbon biogeochemical cycle between subalpine forests and downstream rivers. In-depth investigations on the carbon biogeochemical linkages in forest–riparian–river meta-ecosystems should be conducted, particularly concerning the linkages between the carbon biogeochemical cycle in the meta-ecosystems and forest characteristics, topographical features, and catchment shapes under different climate change scenarios.

Author Contributions

Conceptualization, W.Y. and J.H.; methodology, J.H. and W.Y.; software, J.H. and F.L.; validation, J.H. and W.Y.; formal analysis, J.H.; investigation, J.H., F.L., Z.W., X.L.; resources, W.Y.; data curation, W.Y. and J.H.; writing—original draft preparation, J.H.; writing—review and editing, W.Y. and J.H.; visualization, J.H.; supervision, W.Y.; project administration, W.Y.; funding acquisition, W.Y. and F.L. All authors have read and agreed to the published version of the manuscript.

Funding

This study was supported by the National Natural Science Foundation of China (32071554, 32001139).

Institutional Review Board Statement

Not applicable.

Informed Consent Statement

Not applicable.

Data Availability Statement

All data generated or analyzed during this study are included in this published article. No new data were created or analyzed in this study. Data sharing is not applicable to this article. Data in Table 4 are available through Triska et al. 1982, Benfield 1997, Webster et al. 1997, Hart 2006, Muto 2008, Tonin et al. 2017, and Railoun 2018.

Acknowledgments

The authors of this study would like to thank all people involved in the initial sampling assignments.

Conflicts of Interest

The authors declare no conflict of interest.

References

  1. Sutherland, A.B.; Meyer, J.L.; Gardiner, E.P. Effects of land cover on sediment regime and fish assemblage structure in four southern Appalachian streams. Freshw. Biol. 2002, 47, 1791–1805. [Google Scholar] [CrossRef]
  2. Gessner, M.O.; Swan, C.M.; Dang, C.K.; McKie, B.G.; Bardgett, R.D.; Wall, D.H.; Hattenschwiler, S. Diversity meets decomposition. Trends Ecol. Evol. 2010, 25, 372–380. [Google Scholar] [CrossRef] [PubMed]
  3. Wallace, J.B.; Eggert, S.L.; Meyer, J.L.; Webster, J.R. Multiple trophic levels of a forest stream linked to terrestrial litter inputs. Science 1997, 277, 102–104. [Google Scholar] [CrossRef] [Green Version]
  4. Tranvik, L.J.; Downing, J.A.; Cotner, J.B.; Loiselle, S.A.; Striegl, R.G.; Ballatore, T.J.; Ballatore, T.J.; Dillon, P.; Finlay, K.; Fortino, K.; et al. Lakes and reservoirs as regulators of carbon cycling and climate. Limnol. Oceanograohy 2009, 54, 2298–2314. [Google Scholar] [CrossRef] [Green Version]
  5. Battin, T.J.; Kaplan, L.A.; Findlay, S.; Hopkinson, C.S.; Marti, E.; Packman, A.I.; Newbold, J.D.; Sabater, F. Biophysical controls on organic carbon fluxes in fluvial networks. Nat. Geosci. 2008, 1, 95–100. [Google Scholar] [CrossRef]
  6. Loreau, M.; Mouquet, N.; Holt, R.D. Meta-ecosystems: A theoretical framework for a spatial ecosystem ecology. Ecol. Lett. 2003, 6, 673–679. [Google Scholar] [CrossRef] [Green Version]
  7. Yue, K.; Yang, W.Q.; Peng, C.H.; Peng, Y.; Zhang, Z.; Huang, C.P.; Tan, Y.; Wu, F.Z. Foliar litter decomposition in an alpine forest meta-ecosystem on the eastern Tibetan Plateau. Sci. Total Environ. 2016, 566, 279–287. [Google Scholar] [CrossRef]
  8. Coûteaux, M.M.; Bottner, P.; Berg, B. Litter decomposition, climate, and liter quality. Trends Ecol. Evol. 1995, 10, 63–66. [Google Scholar] [CrossRef]
  9. Abril, M.; Muñoz, I.; Menéndez, M. Heterogeneity in leaf litter decomposition in a temporary Mediterranean stream during flow fragmentation. Sci. Total Environ. 2016, 553, 330–339. [Google Scholar] [CrossRef] [PubMed] [Green Version]
  10. Ferreira, V.; Canhoto, C. Future increase in temperature may stimulate litter decomposition in temperate mountain streams: Evidence from a stream manipulation experiment. Freshw. Biol. 2015, 60, 881–892. [Google Scholar] [CrossRef]
  11. Berg, B.; Meentemeyer, V. Litterfall in some European coniferous forests as dependent on climate: A synthesis. Can. J. For. Res. 2001, 31, 292–301. [Google Scholar] [CrossRef]
  12. Louzada, J.N.C.; Schoereder, J.H.; Marco, J.P. Litter decomposition in semidecidous forest and Eucalyptus spp. crop in Brazil: A comparison. For. Ecol. Manag. 1997, 94, 31–36. [Google Scholar] [CrossRef]
  13. Bachega, L.R.; Bouillet, J.P.; Piccolo, M.C.; Saint-André, L.; Bouvet, J.M.; Nouvellon, Y.; Goncalves, J.L.M.; Robin, A.; Laclau, J.P. Decomposition of Eucalyptus grandis and Acacia mangium leaves and fine roots in tropical conditions did not meet the home field advantage hypothesis. For. Ecol. Manag. 2016, 359, 33–43. [Google Scholar] [CrossRef] [Green Version]
  14. Cornwell, W.K.; Cornelissen, J.H.C.; Amatangelo, K.; Dorrepaal, E.; Eviner, V.T.; Godoy, O.; Hobbie, S.E.; Hoorens, B.; Kurokawa, H.; Pérez-Harguindeguy, N.; et al. Plant species traits are the predominant control on litter decomposition rates within biomes worldwide. Ecol. Lett. 2008, 11, 1065–1071. [Google Scholar] [CrossRef] [PubMed]
  15. Wei, X.; Yang, Y.; Shen, Y.; Chen, Z.; Dong, Y.; Wu, F.; Zhang, L. Litter production and its dynamic pattern in a dark coniferous forest in the alpine gorge region. Chin. J. Appl. Environ. Biol. 2017, 23, 745–752. [Google Scholar]
  16. Guo, J.; Yu, L.H.; Fang, X.; Xiang, W.H.; Deng, X.W.; Lu, X. Litter production and turnover in four types of subtropical forests in China. Acta Ecol. Sin. 2015, 35, 4668–4677. [Google Scholar]
  17. Rueda-Delgado, G.; Wantzen, K.M.; Tolosa, M.B. Leaf-litter decomposition in an Amazonian floodplain stream: Effects of seasonal hydrological changes. J. N. Am. Benthol. Soc. 2006, 25, 233–249. [Google Scholar] [CrossRef]
  18. Taylor, B.R.; Chauvet, E.E. Relative influence of shredders and fungi on leaf litter decomposition along a river altitudinal gradient. Hydrobiologia 2014, 721, 239–250. [Google Scholar] [CrossRef] [Green Version]
  19. Tiegs, S.D.; Akinwole, P.O.; Gessner, M.O. Litter decomposition across multiple spatial scales in stream networks. Oecologia 2009, 161, 343–351. [Google Scholar] [CrossRef] [Green Version]
  20. Benfield, E.F. Comparison of Litterfall Input to Streams. Freshw. Sci. 1997, 16, 104–108. [Google Scholar] [CrossRef]
  21. Webster, J.R. Stream organic matter budgets-introduction. J. N. Am. Benthol. Soc. 1997, 16, 2–13. [Google Scholar] [CrossRef]
  22. Triska, F.J.; Sedell, J.R.; Gregory, S.V. Coniferous forest streams. In Analysis of Coniferous Forest Ecosystems in the Western United States; Edmonds, R.L., Ed.; Hutchinson Ross: Stroudsburg, PA, USA, 1982; pp. 292–332. [Google Scholar]
  23. Soininen, J.; Bartels, P.; Heino, J.; Miska, L.; Hillebrand, H. Toward more integrated ecosystem research in aquatic and terrestrial environments. BioScience 2015, 65, 174–182. [Google Scholar] [CrossRef] [Green Version]
  24. Wang, Y.Q.; Wang, Y.J. Evolution of study on the forest stream water quality. Res. Soil Water Conserv. 2004, 10, 242–246. [Google Scholar]
  25. Bünemann, E.; Bossio, D.; Smithson, P.; Frossard, E.; Oberson, A. Microbial community composition and substrate use in a highly weathered soil as affected by crop rotation and P fertilization. Soil Biol. Biochem. 2004, 36, 889–901. [Google Scholar] [CrossRef]
  26. Perakis, S.S.; Hedin, L.O. Nitrogen loss from unpolluted South American forests mainly via dissolved organic compounds. Nature 2002, 415, 416–419. [Google Scholar] [CrossRef] [PubMed]
  27. Zhang, M.H.; Cheng, X.L.; Geng, Q.H.; Shi, Z.; Luo, Y.Q.; Xu, X. Leaf litter traits predominantly control litter decomposition in streams worldwide. Glob. Ecol. Biogeogr. 2019, 28, 1469–1486. [Google Scholar] [CrossRef]
  28. Baldy, V.; Gobert, V.; Guerold, F.; Chauvet, E.; Lambrigot, D.; Charcosset, J.Y. Leaf litter breakdown budgets in streams of various trophic status: Effects of dissolved inorganic nutrients on microorganisms and invertebrates. Freshw. Biol. 2007, 52, 1322–1335. [Google Scholar] [CrossRef] [Green Version]
  29. Leroy, C.J.; Whitham, T.G.; Keim, P.M.; Jane, C. Plant genes link forests and streams. Ecology 2006, 87, 255–261. [Google Scholar] [CrossRef] [PubMed]
  30. Zhang, Y.; Yang, W.Q.; Tan, B.; Liang, Z.Y.; Wu, F.Z. Storage and content of organic carbon in alpine forest stream in the upper reaches of the Yangtze River. Fresenius Environ. Bull. 2017, 26, 3402–3408. [Google Scholar]
  31. Yuan, Z.Q.; Li, B.H.; Bai, X.J.; Lin, F.; Shi, S.; Ye, J.; Wang, X.G.; Hao, Z.Q. Composition and seasonal dynamics of litterfalls in a broad-leaved Korean pine (Pinus koraiensis) mixed forest in Changbai Mountains, Northeast China. Chin. J. Appl. Ecol. 2010, 21, 2171–2178. [Google Scholar]
  32. Skalny, A.V. Bioelementology as an interdisciplinary integrative approach in life sciences: Terminology, classification, perspectives. J. Trace Elem. Med. Biol. 2011, 25, S3–S10. [Google Scholar] [CrossRef] [PubMed]
  33. Finlay, J.C. Controls of stream water dissolved inorganic carbon dynamics in a forested watershed. Biogeochemistry 2003, 62, 231–252. [Google Scholar] [CrossRef]
  34. Easthouse, K.B.; Mulder, J.; Christophersen, N.; Seip, H.M. Dissolved organic carbon fractions in soil and stream water during variable hydrological conditions at Birkenes, Southern Norway. Water Resourc. Res. 1992, 28, 1585–1596. [Google Scholar] [CrossRef]
  35. Gomes, T.F.; Broek, M.V.; Govers, G.; Silva, R.W.C.; Moraes, J.M.; Camargo, P.B.; Mazzi, E.A.; Martinelli, L.A. Runoff, soil loss, and sources of particulate organic carbon delivered to streams by sugarcane and riparian areas: An isotopic approach. Catena 2019, 181, 1–9. [Google Scholar] [CrossRef]
  36. Zhang, X.Y.; Yu, G.R.; Zheng, Z.M.; Wang, Q.F. Carbon Emission and Spatial Pattern of Soil Respiration of Terrestrial Ecosystems in China: Based on Geostatistic Estimation of Flux Measurement. Prog. Geogr. 2012, 1, 97–108. [Google Scholar]
  37. Duan, L.; Zheng, W.; Li, M. Geologic hazards on the western Sichuan plateau and their controls. Sediment. Geol. Tethyan Geol. 2005, 25, 95–99. [Google Scholar]
  38. Zhang, H.; Yang, W.Q.; Wang, M.; Liao, S. Carbon, nitrogen and phosphorus storage of woody debris in headwater streams in an alpine forest in upper reaches of the Mingjiang River. Acta Ecol. Sin. 2016, 36, 1967–1974. [Google Scholar]
  39. Alvarez, S.; Guerrero, M. Enzymatic activities associated with decomposition of particulate organic matter in two shallow ponds. Soil Biol. Biochem. 2000, 32, 1941–1951. [Google Scholar] [CrossRef]
  40. Yang, W.Q.; Wu, F.Z. Ecosystem Processes and Management of Subalpine Coniferous Forest in the Upper Reaches of the Yangtze River; Science Press: Beijing, China, 2021. [Google Scholar]
  41. Sun, H.L. Ecological and Environmental Problems in the Upper Reaches of the Yangtze River; China Environmental Press: Beijing, China, 2008. [Google Scholar]
  42. Wu, F.Z.; Peng, C.H.; Zhu, J.; Zhang, J.; Tan, B.; Yang, W.Q. Impact of freezing and thawing dynamics on foliar litter carbon release in alpine/subalpine forests along an altitudinal gradient in the eastern Tibetan Plateau. Biogeosciences 2014, 11, 6471–6481. [Google Scholar]
  43. Wu, F.Z.; Yang, W.Q.; Zhang, J.; Deng, R. Litter decomposition in two subalpine forests during the freeze–thaw season. Acta Oecol. 2010, 36, 135–140. [Google Scholar] [CrossRef]
  44. Zhang, C.; Yang, W.Q.; Zhang, H.; Zhang, B.; Yue, K.; Peng, Y.; Wu, F.Z. Standing biomass and carbon-storage of non-woody debris and their distribution in the alpine forest streams of Western Sichuan in the upper reaches of Minjiang River. Ecol. Environ. Sci. 2014, 23, 1509–1514. [Google Scholar]
  45. Lu, R.K. Soil Agrochemical Analysis Methods; China Agricultural Science and Technology Press: Beijing, China, 1999. [Google Scholar]
  46. Bates, D.; Maechler, M.; Bolker, B.; Walker, S. Fitting linear mixed-effects models using lme4. J. Stat. Softw. 2015, 67. [Google Scholar] [CrossRef]
  47. Hart, J.J.; Welch, R.M.; Norvell, W.; Kochian, L.V. Characterization of cadmium uptake, translocation and storage in near-isogenic lines of durum wheat that differ in grain cadmium concentration. New Phytol. 2006, 172, 261–271. [Google Scholar] [CrossRef] [PubMed]
  48. Muto, E.A. The Characteristics and Fate of Leaf Litter Inputs to Boreal Shield Streams in Relation to Riparian Stand Structure; The University of Guelph: Guelph, ON, Canada, 2008. [Google Scholar]
  49. Tonin, A.M.; Goncalves, J.F.; Bambi, P.; Couceiro, S.R.M.; Feitoza, L.A.M.; Fontana, L.E.; Hamada, N.; Hepp, L.U.; Lezan-Kowalczuk, V.G.; Leite, G.F.M.; et al. Plant litter dynamics in the forest-stream interface: Precipitation is a major control across tropical biomes. Sci. Rep. 2006, 7, 10799. [Google Scholar] [CrossRef] [PubMed] [Green Version]
  50. Railoun, M.Z. Impacts of the Invasive Tree Acacia Mearnsii on Riparian and Instream Aquatic Environments in the Cape Floristic Region, South Africa; Stellenbosch University: Stellenbosch, South Africa, 2018. [Google Scholar]
  51. Wenger, S.A. A Review of the Scientific Literature in Riparian Buffer Width, Extent and Vegetation; University of Georgia Press: Athens, GA, USA, 1999; pp. 6–51. [Google Scholar]
  52. Yang, W.Q.; Wang, K.Y.; Kellomaki, S.; Gong, H.D. Litter dynamics of three subalpine forests in Western Sichuan. Pedosphere 2005, 15, 653–659. [Google Scholar]
  53. Wei, X.Y.; Yang, Y.L.; Shen, Y.; Chen, Z.H.; Dong, Y.L.; Wu, F.Z.; Zhang, L. Effects of litterfall on the accumulation of extracted soil humic substances in subalpine forests. Front. Plant Sci. 2020, 11, 254. [Google Scholar] [CrossRef] [PubMed]
  54. Johnson, S.L.; Jones, J.A. Stream temperature responses to forest harvest and debris flows in western Cascades, Oregon. Can. J. Fish. Aquat. Sci. 2000, 57, 30–39. [Google Scholar] [CrossRef]
  55. Graça, M.A.; Ferreira, V.; Canhoto, C.; Encalada, A.C.; Guerrero-Bolaño, F.; Wantzen, K.M.; Boyero, L. A conceptual model of litter breakdown in low order streams. Int. Rev. Hydrobiol. 2015, 100, 1–12. [Google Scholar] [CrossRef]
  56. Bilby, R.E. Role of organic debris dams in regulating the export of dissolved organic and particulate matter from a forested watershed. Ecology 1981, 62, 1234–1243. [Google Scholar] [CrossRef]
  57. Drewitt, G.B.; Black, T.A.; Nesic, Z.; Humpgreys, E.R.; Morgenstern, K. Measuring Forest floor CO2 fluxes in a Douglas-fir forest. Agric. For. Meteorol. 2002, 110, 299–317. [Google Scholar] [CrossRef]
  58. Rantakari, M.; Mattsson, T.; Kortelainen, P.; Mattsson, T.; Piirainen, S. Organic and inorganic carbon concentrations and fluxes from managed and unmanaged boreal first-order catchments. Sci. Total Environ. 2010, 408, 1649–1658. [Google Scholar] [CrossRef] [PubMed]
  59. Cole, J.J.; Prairie, Y.T.; Caraco, N.F.; McDowell, W.H.; Tranvik, L.J.; Striegl, R.G.; Duarte, C.M.; Kortelaien, P.; Downing, J.A.; Middelburg, J.J.; et al. Plumbing the global carbon cycle: Integrating inland waters into the terrestrial carbon budget. Ecosystems 2007, 10, 172–185. [Google Scholar] [CrossRef] [Green Version]
  60. Wallace, T.A.; Ganf, G.G.; Brookes, J.D. A comparison of phosphorus and DOC leachates from different types of leaf litter in an urban environment. Freshw. Biol. 2008, 53, 1902–1913. [Google Scholar] [CrossRef]
Figure 1. The investigated streams in the Bipenggou Valley, located in the upper reaches of the Yangtze River. The letters A–O indicate the 15 sampling streams [7].
Forests 12 01764 g001
Figure 2. Litter and litter carbon input and output monitoring system in the investigated streams of the Bipenggou Valley, located in the upper reaches of the Yangtze River.
Forests 12 01764 g002
Figure 3. Dynamics of litter (A) and litter carbon (B) input to the subalpine forest streams in the upper reaches of the Yangtze River. LGS, SSC, SMS, EGS and GS indicate the sampling periods, i.e., later growing season (LGS: September to October), seasonal snow cover (SSC: November to April next year), snowmelt season (SMS: April to May), early growing season (EGS: May to June), and growing season (GS: July to August). The vertical coordinate is the mean of litter input accumulation of 15 streams during this period. Different lowercase letters indicate the significant difference among different periods (p < 0.05), while the same letter indicates no significant difference among each other.
Forests 12 01764 g003
Figure 4. Dynamics of litter (A) and litter carbon (B) output from the subalpine forest streams in the upper reaches of the Yangtze River from 11 July 2015, to 2 August 2016. LGS, SSC, SMS, EGS and GS indicate the sampling periods, i.e., later growing season (LGS: September to October), seasonal snow cover (SSC: November to April next year), snowmelt season (SMS: April to May), early growing season (EGS: May to June), and growing season (GS: July to August). The vertical coordinate is the mean of litter input accumulation of 15 streams during this period. Different lowercase letters indicate the significant difference among different periods (p < 0.05), while the same letter indicates no significant difference among each other.
Forests 12 01764 g004
Figure 5. The ratios of input to output of litter (A) and litter carbon (B) in the subalpine forest streams in the upper reaches of the Yangtze River from 11 July 2015, to 2 August 2016. The value of each dot is the ratio of the average for the investigated streams during the sampling time. Different lowercase letters indicate the significant difference among different periods (p < 0.05), while the same letter indicates no significant difference among each other.
Forests 12 01764 g005
Figure 6. The ratios of input to output of litter (A) and litter carbon (B) in the subalpine forest streams in the upper reaches of the Yangtze River from 11 July 2015, to 2 August 2016. Each bar is the average of 13 sampling times for each forest stream. A–O are the sampled streams in the study.
Forests 12 01764 g006
Table 1. Basic characteristics of 15 representative subalpine forest streams in the investigated subalpine forest catchment.
StreamElevation
(m)
Length
(m)
Width
(m)
Water Level (cm)Flow Velocity
(m3/s)
Main Plants
A36682200.63 ± 0.168.57 ± 3.200.11 ± 0.11A. faxoniana, Cyperus spp., S saltuaria
B3667660.69 ± 0.145.15 ± 1.600.07 ± 0.07A. faxoniana, Cyperus spp., S. saltuaria
C3658130.63 ± 0.227.16 ± 3.830.01 ± 0.02A. faxoniana, Cyperus spp., S. saltuaria
D365892.40.86 ± 0.194.81 ± 1.080.06 ± 0.07A. faxoniana, Cyperus spp., S. saltuaria
E3657470.34 ± 0.303.73 ± 3.430.01 ± 0.01A. faxoniana, Cyperus spp., S. saltuaria
F3640651.11 ± 0.306.90 ± 1.440.11 ± 0.12S. saltuaria, R. lapponicum
G36401861.02 ± 0.338.96 ± 1.910.06 ± 0.06S. saltuaria, Carex spp., R. weginzowii
H36341080.82 ± 0.286.73 ± 4.380.04 ± 0.07S. saltuaria, Carex spp., S. rufopilosa
I36342561.02 ± 0.227.19 ± 1.800.13 ± 0.12S. saltuaria, R. weginzowii, Carex spp.
J3634181.29 ± 1.003.85 ± 3.050.04 ± 0.07S. saltuaria, R. weginzowii, Carex spp.
K3611361.00 ± 0.247.93 ± 2.320.10 ± 0.08R. lapponicum, S. saltuaria
L3611110.93 ± 0.583.70 ± 1.890.03 ± 0.05R. lapponicum, S. saltuaria
M3610120.85 ± 0.236.26 ± 1.420.03 ± 0.08R. lapponicum, S. saltuaria
N3607280.84 ± 0.3211.72 ± 4.880.15 ± 0.14S. mastersiana, Cyperus spp., S. rufopilosa
O3607170.65 ± 0.414.34 ± 3.840.02 ± 0.04S. mastersiana, S. rufopilosa, Cyperus spp.
Table 2. Relationships of litter and litter carbon input with stream characteristics in the subalpine forest catchment.
Factorsd.f.pr2
Litter inputPrecipitation730.97<0.01
Temperature73<0.01 **0.32
Sediment depth730.27<0.01
Water level730.500.04
Flow velocity730.27<0.01
Width73−0.29<0.01
Length73<0.01 **0.11
Litter carbon inputPrecipitation730.630.02
Temperature73<0.01 **0.30
Sediment depth730.210.04
Water level730.220.01
Flow velocity730.210.01
Width73−0.43<0.01
Length730.01 *0.06
* p < 0.05, ** p < 0.01. d.f.: degree of freedom.
Table 3. Relationships of litter and litter carbon output with stream characteristics in the subalpine forest streams.
Factorsd.f.pr2
Litter outputPrecipitation730.002 **0.15
Temperature730.02 *0.08
Sediment depth73−0.04 *0.05
Water level730.240.02
Flow velocity730.02 *0.07
Width73−0.68<0.01
Length73−0.070.04
Litter input730.002 **0.18
Litter carbon outputPrecipitation730.04 *0.01
Temperature730.003 **0.08
Sediment depth73−0.03 *0.04
Water level730.33<0.01
Flow velocity730.04 *0.06
Width73−0.41<0.01
Length73−0.26<0.01
Litter carbon input73<0.001 **0.22
* p < 0.05, ** p < 0.01. d.f.: degree of freedom.
Table 4. Litter Input to Forest Streams Reported Worldwide.
SiteTree SpicesInput (g m−2 y−1)References
Upper Reaches of Yangtze River, ChinaConiferous forest262This study
Ogeechee River, Georgia, USAConiferous forest537Triska et al. (1982)
Satellite Br, North Carolina, USAMixed deciduous forest629Benfield (1997)
Devil’s Club Cr, Oregon, USAConiferous forest736Benfield (1997)
Deep Cr, Idaho, USAShrub/grass cover3Benfield (1997)
Mack Cr, Oregon, USAConiferous forest730Benfield (1997)
Sycamore Cr, Arizona, USAShrub cover20Benfield (1997)
North Carolina, USADeciduous forest1000Webster et al. (1997)
Coast Range of Oregon, USADeciduous forest613Hart (2006)
Domtar Inc. White River Forest, CanadaMixed wood forest167Muto (2008)
BrazilAtlantic forest131Tonin et al. (2017)
BrazilAmazon forest165Tonin et al. (2017)
BrazilCerrado savanna,213Tonin et al. (2017)
Wit River, Western Cape, South Africatypical mountain fynbos69Railoun (2018)
Du Toit’s River, Western Cape, South Africatypical mountain fynbos68Railoun (2018)
Publisher’s Note: MDPI stays neutral with regard to jurisdictional claims in published maps and institutional affiliations.

