Article

Tree Rings Reveal the Impact of Soil Temperature on Larch Growth in the Forest-Steppe of Siberia

by
Liliana V. Belokopytova
1,*,
Dina F. Zhirnova
1,
David M. Meko
2,
Elena A. Babushkina
1,
Eugene A. Vaganov
3,4 and
Konstantin V. Krutovsky
5,6,7,8,9,*
1
Khakass Technical Institute, Siberian Federal University, 655017 Abakan, Russia
2
Laboratory of Tree-Ring Research, University of Arizona, Tucson, AZ 85721-0045, USA
3
Institute of Ecology and Geography, Siberian Federal University, 660036 Krasnoyarsk, Russia
4
Department of Dendroecology, V.N. Sukachev Institute of Forest, Siberian Branch of the Russian Academy of Science, 660036 Krasnoyarsk, Russia
5
Department of Forest Genetics and Forest Tree Breeding, Georg-August University of Göttingen, D-37077 Göttingen, Germany
6
Center for Integrated Breeding Research (CiBreed), Georg-August University of Göttingen, D-37075 Göttingen, Germany
7
Laboratory of Population Genetics, N. I. Vavilov Institute of General Genetics, Russian Academy of Sciences, 119333 Moscow, Russia
8
Laboratory of Forest Genomics, Genome Research and Education Center, Department of Genomics and Bioinformatics, Institute of Fundamental Biology and Biotechnology, Siberian Federal University, 660036 Krasnoyarsk, Russia
9
Scientific and Methodological Center, G. F. Morozov Voronezh State University of Forestry and Technologies, 394036 Voronezh, Russia
*
Authors to whom correspondence should be addressed.
Forests 2021, 12(12), 1765; https://doi.org/10.3390/f12121765
Submission received: 15 October 2021 / Revised: 29 November 2021 / Accepted: 9 December 2021 / Published: 14 December 2021
(This article belongs to the Section Forest Ecophysiology and Biology)

Abstract

:
Dendroclimatology has focused mainly on the tree growth response to atmospheric variables. However, the roots of trees directly sense the “underground climate,” which can be expected to be no less important to tree growth. Data from two meteorological stations approximately 140 km apart in southern Siberia were applied to characterize the spatiotemporal dynamics of soil temperature and the statistical relationships of soil temperature to the aboveground climate and tree-ring width (TRW) chronologies of Larix sibirica Ledeb. from three forest–steppe stands. Correlation analysis revealed a depth-dependent delay in the maximum correlation of TRW with soil temperature. Temperatures of both the air and soil (depths 20–80 cm) were shown to have strong and temporally stable correlations between stations. The maximum air temperature is inferred to have the most substantial impact during July–September (R = −0.46–−0.64) and early winter (R = 0.39–0.52). Tree-ring indices reached a maximum correlation with soil temperature at a depth of 40 cm (R = −0.49–−0.59 at 40 cm) during April–August. High correlations are favored by similar soil characteristics at meteorological stations and tree-ring sites. Cluster analysis of climate correlations for individual trees based on the K-means revealed groupings of trees driven by microsite conditions, competition, and age. The results support a possible advantage of soil temperature over air temperature for dendroclimatic analysis of larch growth in semiarid conditions during specific seasons.

1. Introduction

The influence of climate on the growth and vitality of vegetation is extremely important and widely studied, but usually only in relation to aboveground climatic conditions [1,2]. However, the root system, albeit shielded by the soil from the direct impact of weather, plays a vital role in plants’ intake of water and mineral resources [3]. Therefore, it is reasonable to expect that seasonal moisture and temperature fluctuations in the root-inhabited layer of soil will have no less effect than atmospheric weather on the plant organism. Low soil temperature suppresses the functioning of roots [4], and the water content of the root-inhabited layer of the soil is a more direct measure than precipitation of the moisture available to the plant [5]. Thus, investigating the interactions between vegetation and the “underground climate” should be of great importance and practical relevance. However, the spatial heterogeneity of climatic fields presents limitations challenging to overcome for both atmospheric and soil variables.
In dendrochronology, the main approach to estimating the impact of climate on tree growth has been to identify the statistical relationships between long-term climatic series and the dynamics of ring width (TRW) or other parameters of tree rings [1,2]. This dendroclimatic approach takes advantage of the annual resolution and multicentennial length of tree-ring chronologies, the availability of tree-ring sites across a wide range of forest ecosystems, and the demonstrated reliability of the methodology to identify and measure the strength of climate–growth relationships. Studies have also confirmed that standardized TRW chronologies are good proxies for net primary production and carbon allocation in forest stands [6,7].
On-site data from logger sensors are severely limited in duration and availability and, therefore, are rarely used in dendroclimatic studies [8,9]. The traditional data sources are meteorological stations at distances up to 100 km and more from the tree-ring site or interpolated gridded climate networks with spatial resolutions ranging from less than one kilometre to several degrees (e.g., [10,11,12,13]). Dendroclimatic relationships can be further obscured by the heterogeneity of vegetation cover (modulation of microclimate by the forest canopy [14,15,16]), terrain, and elevation. Nevertheless, a long history of research has proven that aboveground climatic fields (especially temperature) are sufficiently spatially coherent for identifying the important seasonal influences on tree growth.
The spatial complexity of the underground climate is even greater than that of the aboveground climate. Evidently, soil temperature and moisture are driven by aboveground weather [17,18]. The temperature regime of the soil is defined by heat exchange with the surface atmosphere and, therefore, depends on the air temperature and insolation over a previous time period [7,19,20,21]. However, many factors modify heat transfer and add spatial variability to the soil temperature regime: the heat-insulating effect of snow cover [22,23,24,25], additional heat transfer by water evaporation or seepage to deeper horizons [18,26], the presence of permafrost [27,28,29,30,31], and, of course, the chemical and granulometric composition of the soil (determining its heat capacity and thermal conductivity [32,33]).
The forest cover itself can further influence the soil thermal regime by reducing insolation and surface temperature fluctuations under the canopy [9,34], and the soil can be insulated from the air above by leaf litter and other detritus [35,36,37,38]. In effect, the complex dependence on local conditions favours a more mosaic structure of temperature in the soil than in the atmosphere and raises the question of whether soil climatic data distant from the tree-ring site are suitable at all for dendroclimatology. The low availability of long instrumental soil–climate time series also contributes to the limited interest of the scientific community in studying the influence of the underground climate on plants. Some attempts have been made, however, to include instrumental series of soil temperature alongside those of other climatic variables in dendroclimatic correlation analysis [39,40,41]. The success of even tree-ring reconstruction of soil temperature [42] supports the credibility of further investigation of the soil temperature data value in dendroclimatology.
A promising region for studying the influence of soil temperature on tree growth is southern Siberia. The region contains demonstrated climate-sensitive tree-ring chronologies [43,44,45,46] and is characterized by intermontane valleys with a wide diversity of landscapes and vegetation. Forest ecosystems here reach their semiarid forest–steppe border on the valley floor, and trees are moisture-stressed such that growth is significantly correlated with air temperature (negatively) and precipitation (positively) [43,44,45,46]. In one prominent valley, the Khakass-Minusinsk Depression, with several tree-ring sampling sites, daily soil temperature measurements at several depths are available for two meteorological stations. The purpose of this study is to verify the applicability of the soil temperature data for dendroclimatic studies within the region, i.e., to quantify the strength of the relationship of the soil temperature at meteorological stations with indices of tree-ring width from forest stands at some distance from the stations. Three objectives are addressed in this paper. The first is to quantify the relationships between air and soil temperatures at different depths and compare the long-term climatic dynamics of temperature above and below ground between the two meteorological stations. The second is to determine the dendroclimatic suitability of the soil temperature series from these stations at the habitat scale by comparing the strength of the relationships of local larch chronologies to air temperature, precipitation, and soil temperature. The third is to investigate the contribution of soil–landscape complex spatial heterogeneity to the variability of climate response on the scale of individual trees.

2. Materials and Methods

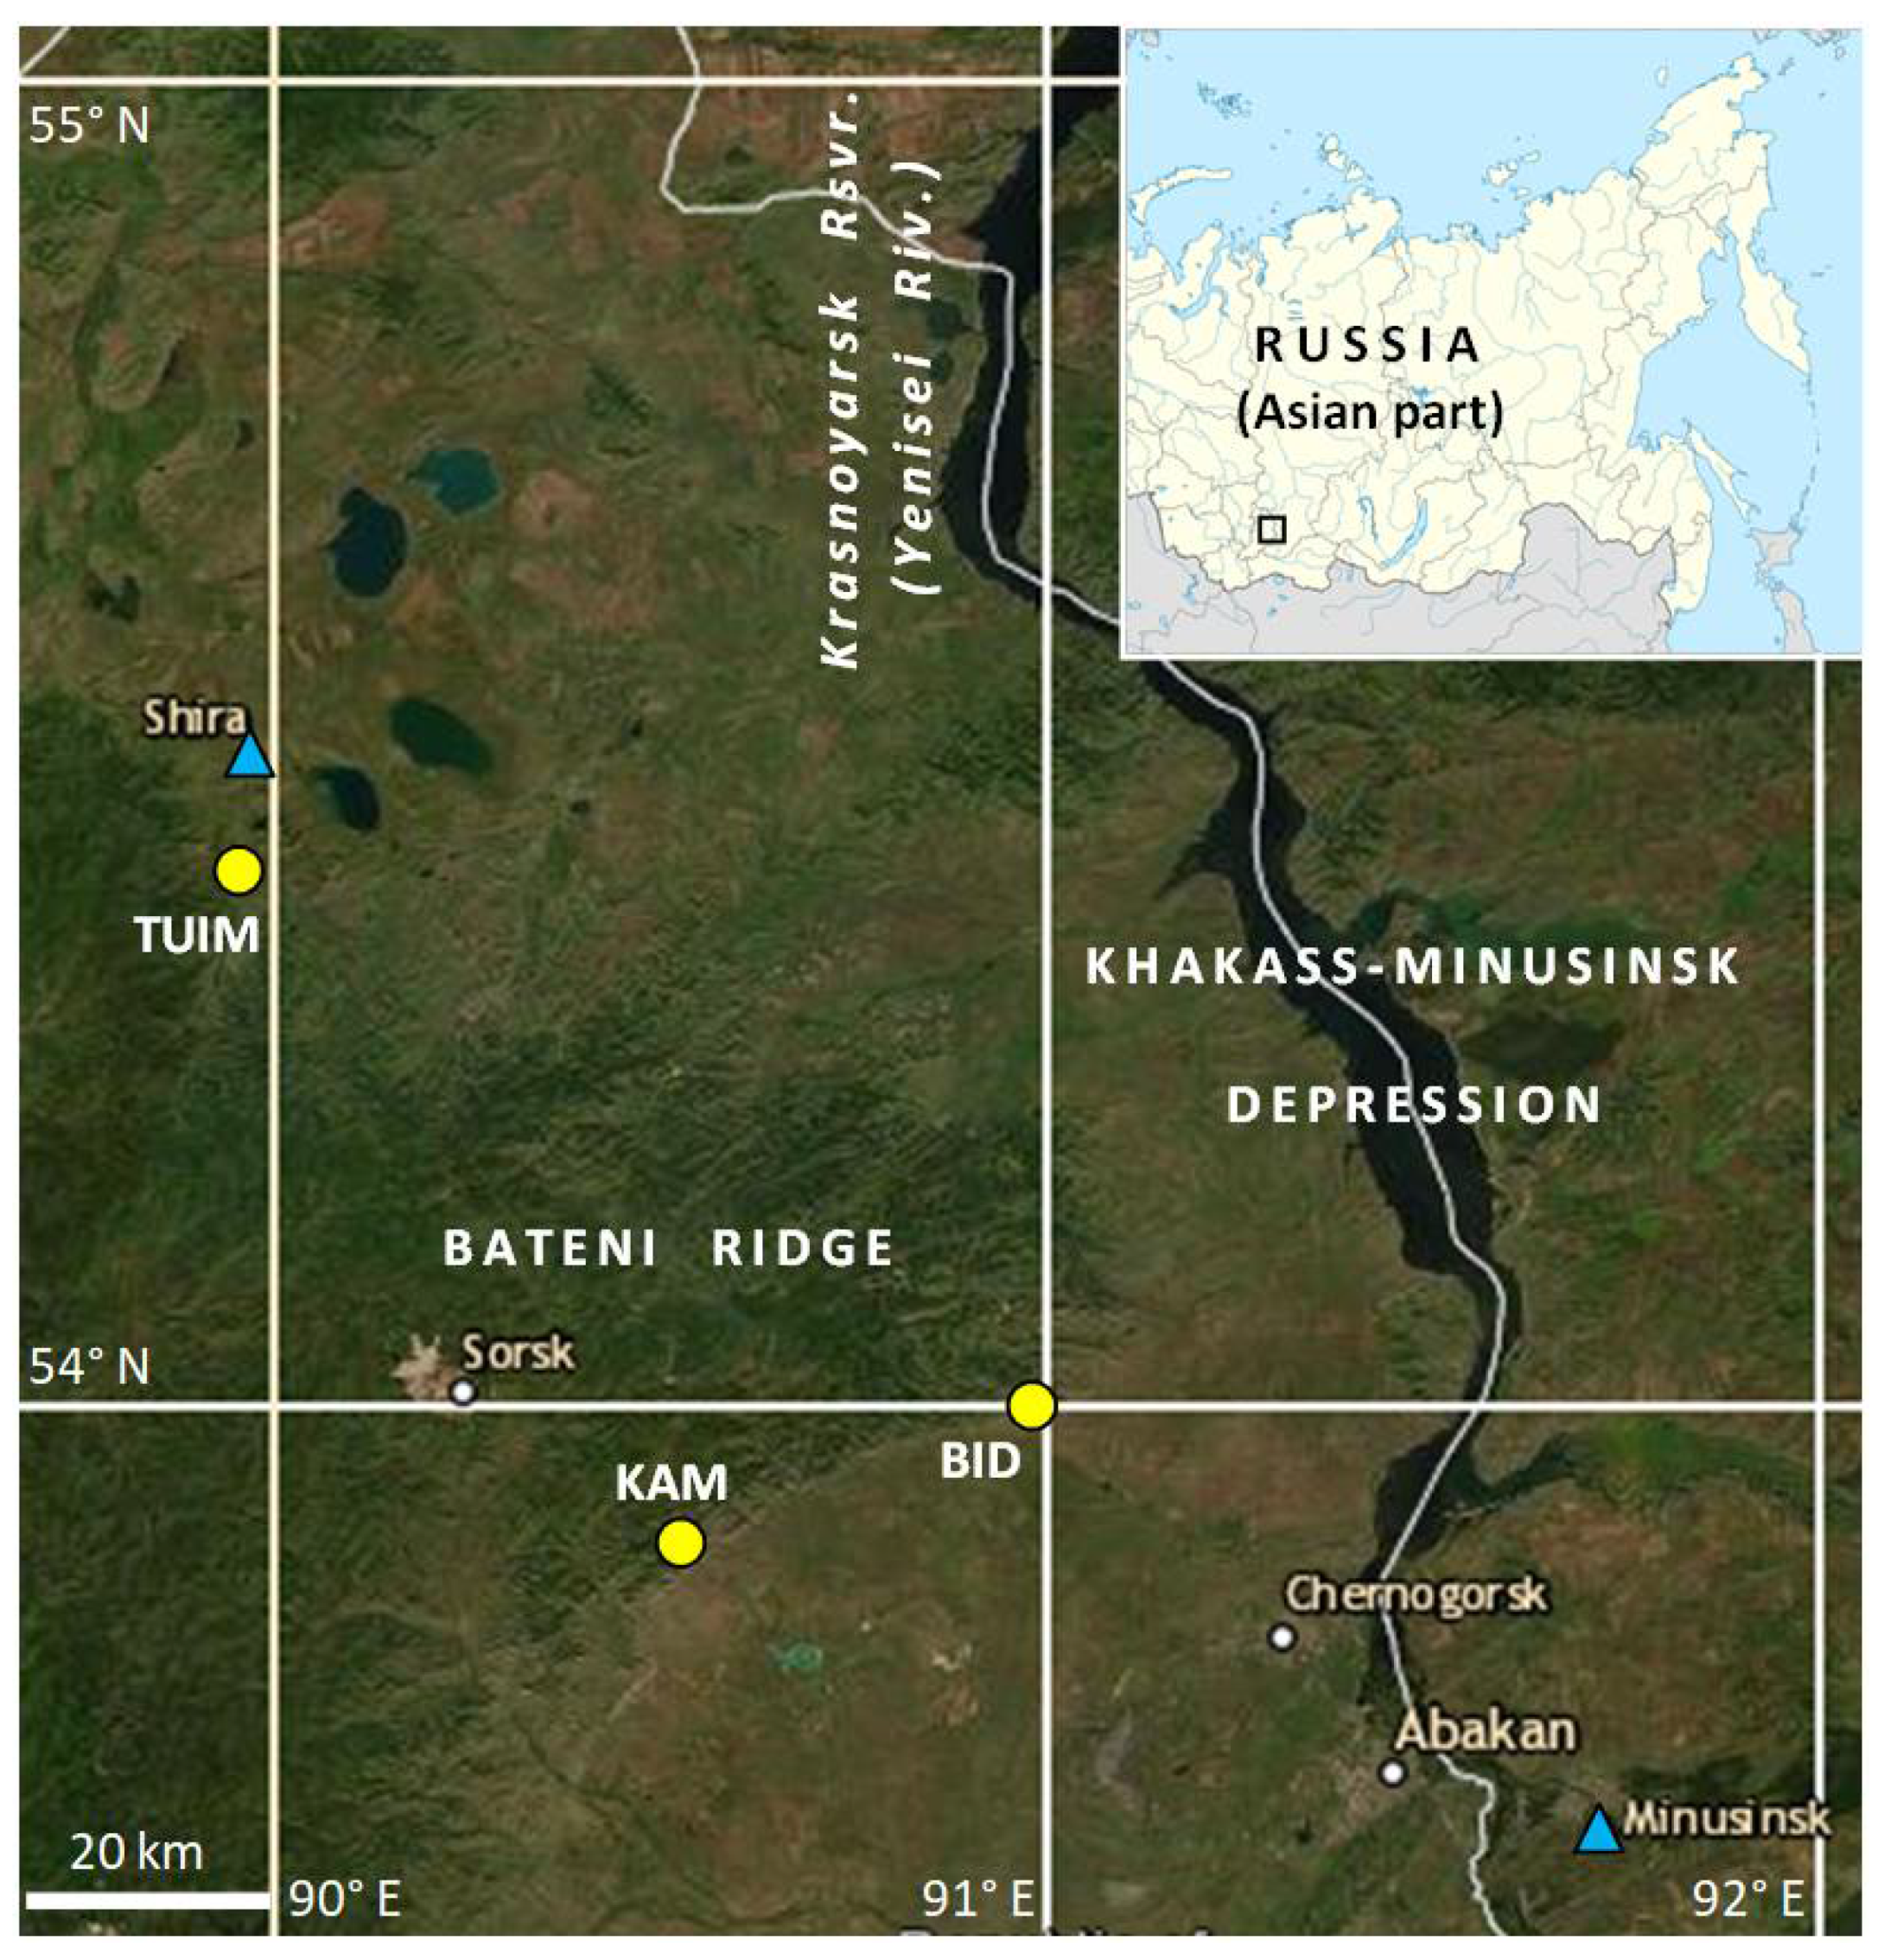
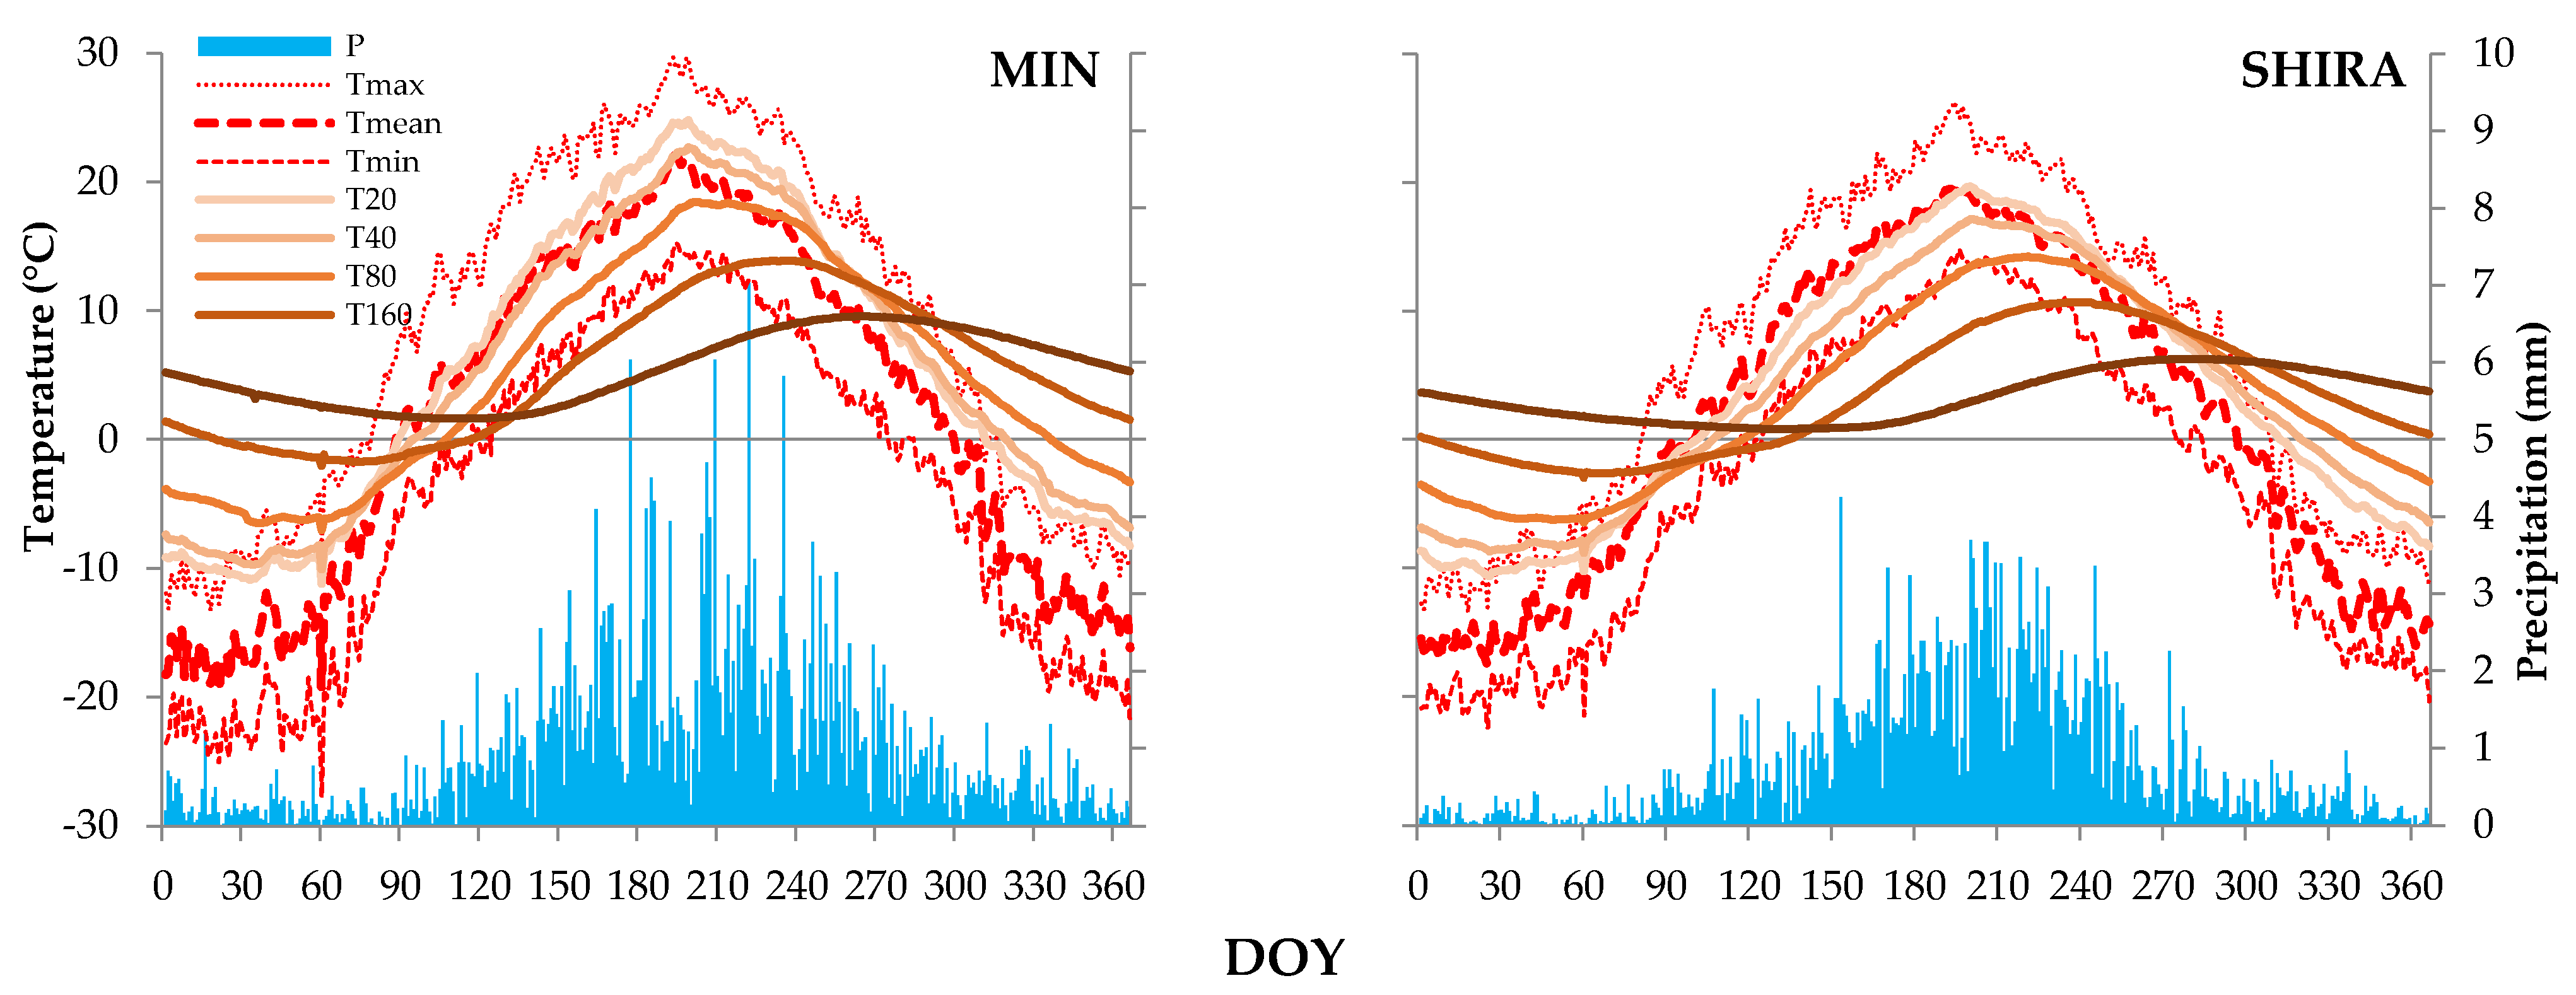
2.1. Geographical Setting, Climatic Data Sources and Climate of Study Region

The study was carried out in south central Siberia, in the foothills of the Bateni Ridge (Figure 1). This low (up to 1200 m a.s.l.) spur of the Kuznetsk Alatau mountain system, covered with mixed stands of Siberian larch (Larix sibirica Ledeb.), Scots pine (Pinus sylvestris L.), and silver birch (Betula pendula Roth.), intrudes into the drier and hotter steppes of the Khakass-Minusinsk Depression (250–500 m a.s.l.), through which the middle course of the large Yenisei River flows. In the low montane zone, especially in the foothills, the elevation of the boundary between forest and steppe vegetation strongly depends on the orientation of the slope. While shaded northern aspects are occupied by closed forest stands, sunlit southern aspects are represented by open forest interspersed with isolated trees (mainly conifers) and steppe grasses. The soils are loamy and stony; mainly grey forest soils characterize the ridges, and southern chernozem soils are more common in the steppe zone. Data on soil types were accessed from the Information System Soil-Geographical Database of Russia by the Soil Data Center of the M. V. Lomonosov Moscow State University (https://soil-db.ru/map; accessed on 7 October 2021).
The climatic data consist of daily air temperature, soil temperature, and precipitation series for stations Shira (SHIRA, 54.50° N 59.93° E, 475 m a.s.l.) and Minusinsk (MIN, 53.72° N 91.10° E, 255 m a.s.l.) (Figure 2). SHIRA is located on loamy soils in the steppe zone near the northern border of the ridge, west of the Yenisei River. MIN, the nearest meteorological station to the southeastern tip of the ridge, is located on Aeolian sandy soils on the opposite bank of the river. Landscape and soils are less similar at MIN than at SHIRA to conditions at the forest stands studied. Monthly and seasonal averages of climate variables were computed for the period of maximum instrumental data coverage, 1985–2000 (Figure S1). At SHIRA, the average annual air temperature (1985–2000) is approximately +1.4 °C, and the average annual precipitation is 290 mm; at MIN the corresponding values are +1.9 °C and 360 mm. The average annual soil temperatures differ little with depth: 3.3–3.6 °C at SHIRA and 5.2–5.6 °C at MIN, for depths of 20–320 cm. The regional climate is sharply continental [47], with large daily and seasonal variations in air temperature. Cold winters with little snow last from November to March; snow makes up only ~20% of the annual precipitation and falls mainly in November. Snow cover usually melts quickly in spring. For example, at MIN, snow cover was recorded in 71% of the years, 1916–2020, on 15 March, but in only 18% of the years on 1 April. The mean snow depths on these dates were 8.3 and 1.9 cm, respectively. The frost-free period (positive minimum daily temperature) lasts on average from May to September. During the same interval, the average daily temperature exceeds +5 °C, such that the interval can be regarded approximately as the vegetative season. Summers are hot, with seasonal maximum rainfall in July. The moisture deficit in the forest–steppe ecotone of the continental climatic zone is distributed relatively evenly over the vegetative season, both on average and in regard to drought events.
The average (1985–2000) seasonal curves of the mean, maximum, and minimum air temperatures at SHIRA and MIN are synchronous and practically parallel, i.e., these three variables have similar average seasonal variations (Figure 2). The average daily range (max–min) of air temperature is 13.1 °C at MIN and 10.0 °C at SHIRA. The range of the seasonal curves of minimum, maximum, and mean temperature is 41.6–43.1 at MIN and 37.2–39.7 °C at SHIRA. The seasonal curves of soil temperature lag those of air temperature, and the lag increases with depth (Figure S2, Table 1). The seasonal range of soil temperature decreases with depth.
Soil freezes to a depth greater than 1.6 m at both stations. Year-to-year fluctuations in soil temperature lag behind those of air temperature (correlation between long-term series is highest when soil temperature series are compared with air temperature series some days prior), although the lag is shorter than for the seasonal curves shown in Figure 2. In general, the relation of soil temperature to air temperature weakens with depth faster at SHIRA than at MIN. This applies to all aspects: the decrease in seasonal range, the decrease in maximum cross-correlation, and the increase in delay.
The distance between meteorological stations SHIRA and MIN is ~142 km. Over the common period 1985–2000, between-station correlations of the same daily series (e.g., Tmean on 1 July at SHIRA and Tmean on 1 July at MIN) are significant at p < 0.05 for almost the entire year for air temperatures and for soil temperatures at depths <1 m and average correlations are 0.7–0.8 (Figure S3). At greater depths, between-station correlations for soil temperatures are lower in winter and the beginning of spring than at other times of the year. If daily series are smoothed by a 21-day moving average, the patterns of the relationship between the temperature regimes of the two stations remain the same. In contrast to temperature, daily precipitation series at the two stations are not significantly correlated. This is expected because of the stochastic spatiotemporal nature of precipitation, but some significant correlations emerge in the 21-day moving averages. Between-station correlations of 21-day-average precipitation vary over the year from −0.2 to 0.9 and are significantly positive at p < 0.05 for only ~56% of the year.

2.2. Tree-Ring Sites, Sampling, Measurement, and Data Processing

The study was carried out at three forest stands along the border of the Bateni Ridge and the Khakass-Minusinsk Depression (Figure 1): TUIM (54.41° N 89.96° E, 550–600 m a.s.l.) in the northwest, KAM (53.92° N 90.60° E, 700–770 m a.s.l.) in the southwest, and BID (54.00° N 89.98° E, 640–670 m a.s.l.) at the southeastern tip of the ridge.
The landscape at TUIM is slightly hilly (slopes < 5°). Single larches or small clumps of trees grow on rocky soil among dry steppe vegetation (scarce and low herbaceous plants, mainly Gramineae species). BID is characterized by a chain of hills where larch–pine stands with an admixture of birch have a maximum density on the northern slopes and a minimum density on the southern slopes. Herbaceous vegetation is mainly represented by forbs. Samples at BID were collected in the lower parts of southeastern and eastern gentle slopes (<15°) from closed stands and clearings at the edges of the stands. At KAM, a small valley is enclosed by hills; larch grows in closed stands with birch and a herbaceous undercover of forbs on shaded northern slopes. The flat valley floor is covered with various grasses and a few freestanding larch and birch trees, while the steeper and stony sunlit slopes are covered with vegetation very similar to that at TUIM. Core samples were collected from a variety of microsites: the lower forest edge on the northern slope, freestanding trees on the valley floor, and clumps of trees on the western and southern slopes.
Wood samples (cores) were collected from healthy mature living larch trees without signs of mechanical damage and without close neighbours. The first collection at all three sites was carried out in 2012–2013. Additional sampling was carried out in 2019 when the location of each sampled tree was recorded. Patterns of microconditions for individual trees sampled in 2019 were derived qualitatively from stand density and landscape confirmed by satellite and topographic maps, respectively, and from recorded observations of the herbaceous vegetation. Samples were collected and processed using standard dendrochronological techniques [48]. For each individual tree, cambial age (number of rings from pith to bark) was calculated. For cores missing pith, pith offset was estimated from curvature of the innermost rings with the concentric circles method [49], and cambial age was adjusted accordingly.
Tree-ring chronologies sensitive to climatic fluctuations at these sampling sites have been developed and analyzed by Zhirnova et al. [45]. The individual TRW series were measured on a LINTAB stage using the program TSAP [50] and were cross-dated visually with the help of the program COFECHA [51]. Site chronologies were developed statistically using the program ARSTAN [52]. This process consisted of (1) removal of age-related trends by a cubic smoothing spline with a 50% response at 67% of the sample length, (2) removal of low-order autocorrelation (which is assumed to represent year-to-year biological carryover processes), and (3) averaging of resulting individual indexed series within each sampling site using the biweight mean.

2.3. Statistical Analysis

The quality of the TRW chronologies was summarized by the following statistics: standard deviation, mean sensitivity [1], mean inter-series correlation coefficient [53], and expressed population signal (EPS, [54]). To identify the relationships of climatic parameters with each other and with the TRW of larch, we used pairwise Pearson correlation coefficients and lagged cross-correlations [55]. For dendroclimatic analysis, we used climatic variables averaged (temperature) or aggregated (precipitation) from daily data. For each intra-annual period of homogenous climatic response recognized from monthly dendroclimatic correlations, we computed all possible climatic time series with a window width varying from 10 days to the entire period duration and identified the series most strongly correlated with the TRW chronology. The analysis was repeated for each of the three local chronologies.
The periods of strongest influence of climatic factors on larch growth identified in this way were then used in cluster analysis when classifying individual trees (only the 2019 subsample) by the climatic growth response. At each site, the classification was carried out to three clusters by the K-means nonhierarchical method, in which the samples with the most contrasting climatic response were selected as the initial centres of the clusters [55]. K-means cluster analysis is an automated grouping of objects into K groups in such a way that characteristics of objects within the same group are more similar than between groups. In this study, a set of 13 correlation coefficients between residual TRW series of individual trees and crucial climatic variables found for each sampling site as described above were used as quantitative characteristics of trees. Clusters were also tested for any significant difference in the cambial age of comprising trees, and maps of the sampling sites with marked locations of classified trees were analyzed to recognize patterns related to landscape and stand density.
The statistical significance of the correlation coefficients, the difference of correlation, and the difference of samples (clusters) by cambial age were determined using a two-tailed t-test [55]. The statistical characteristics of the chronologies were obtained in ARSTAN, the cluster analysis was carried out in STATISTICA 10 (www.statsoft.ru; accessed on 7 October 2021), and the rest of the calculations were performed in Microsoft Excel.

3. Results

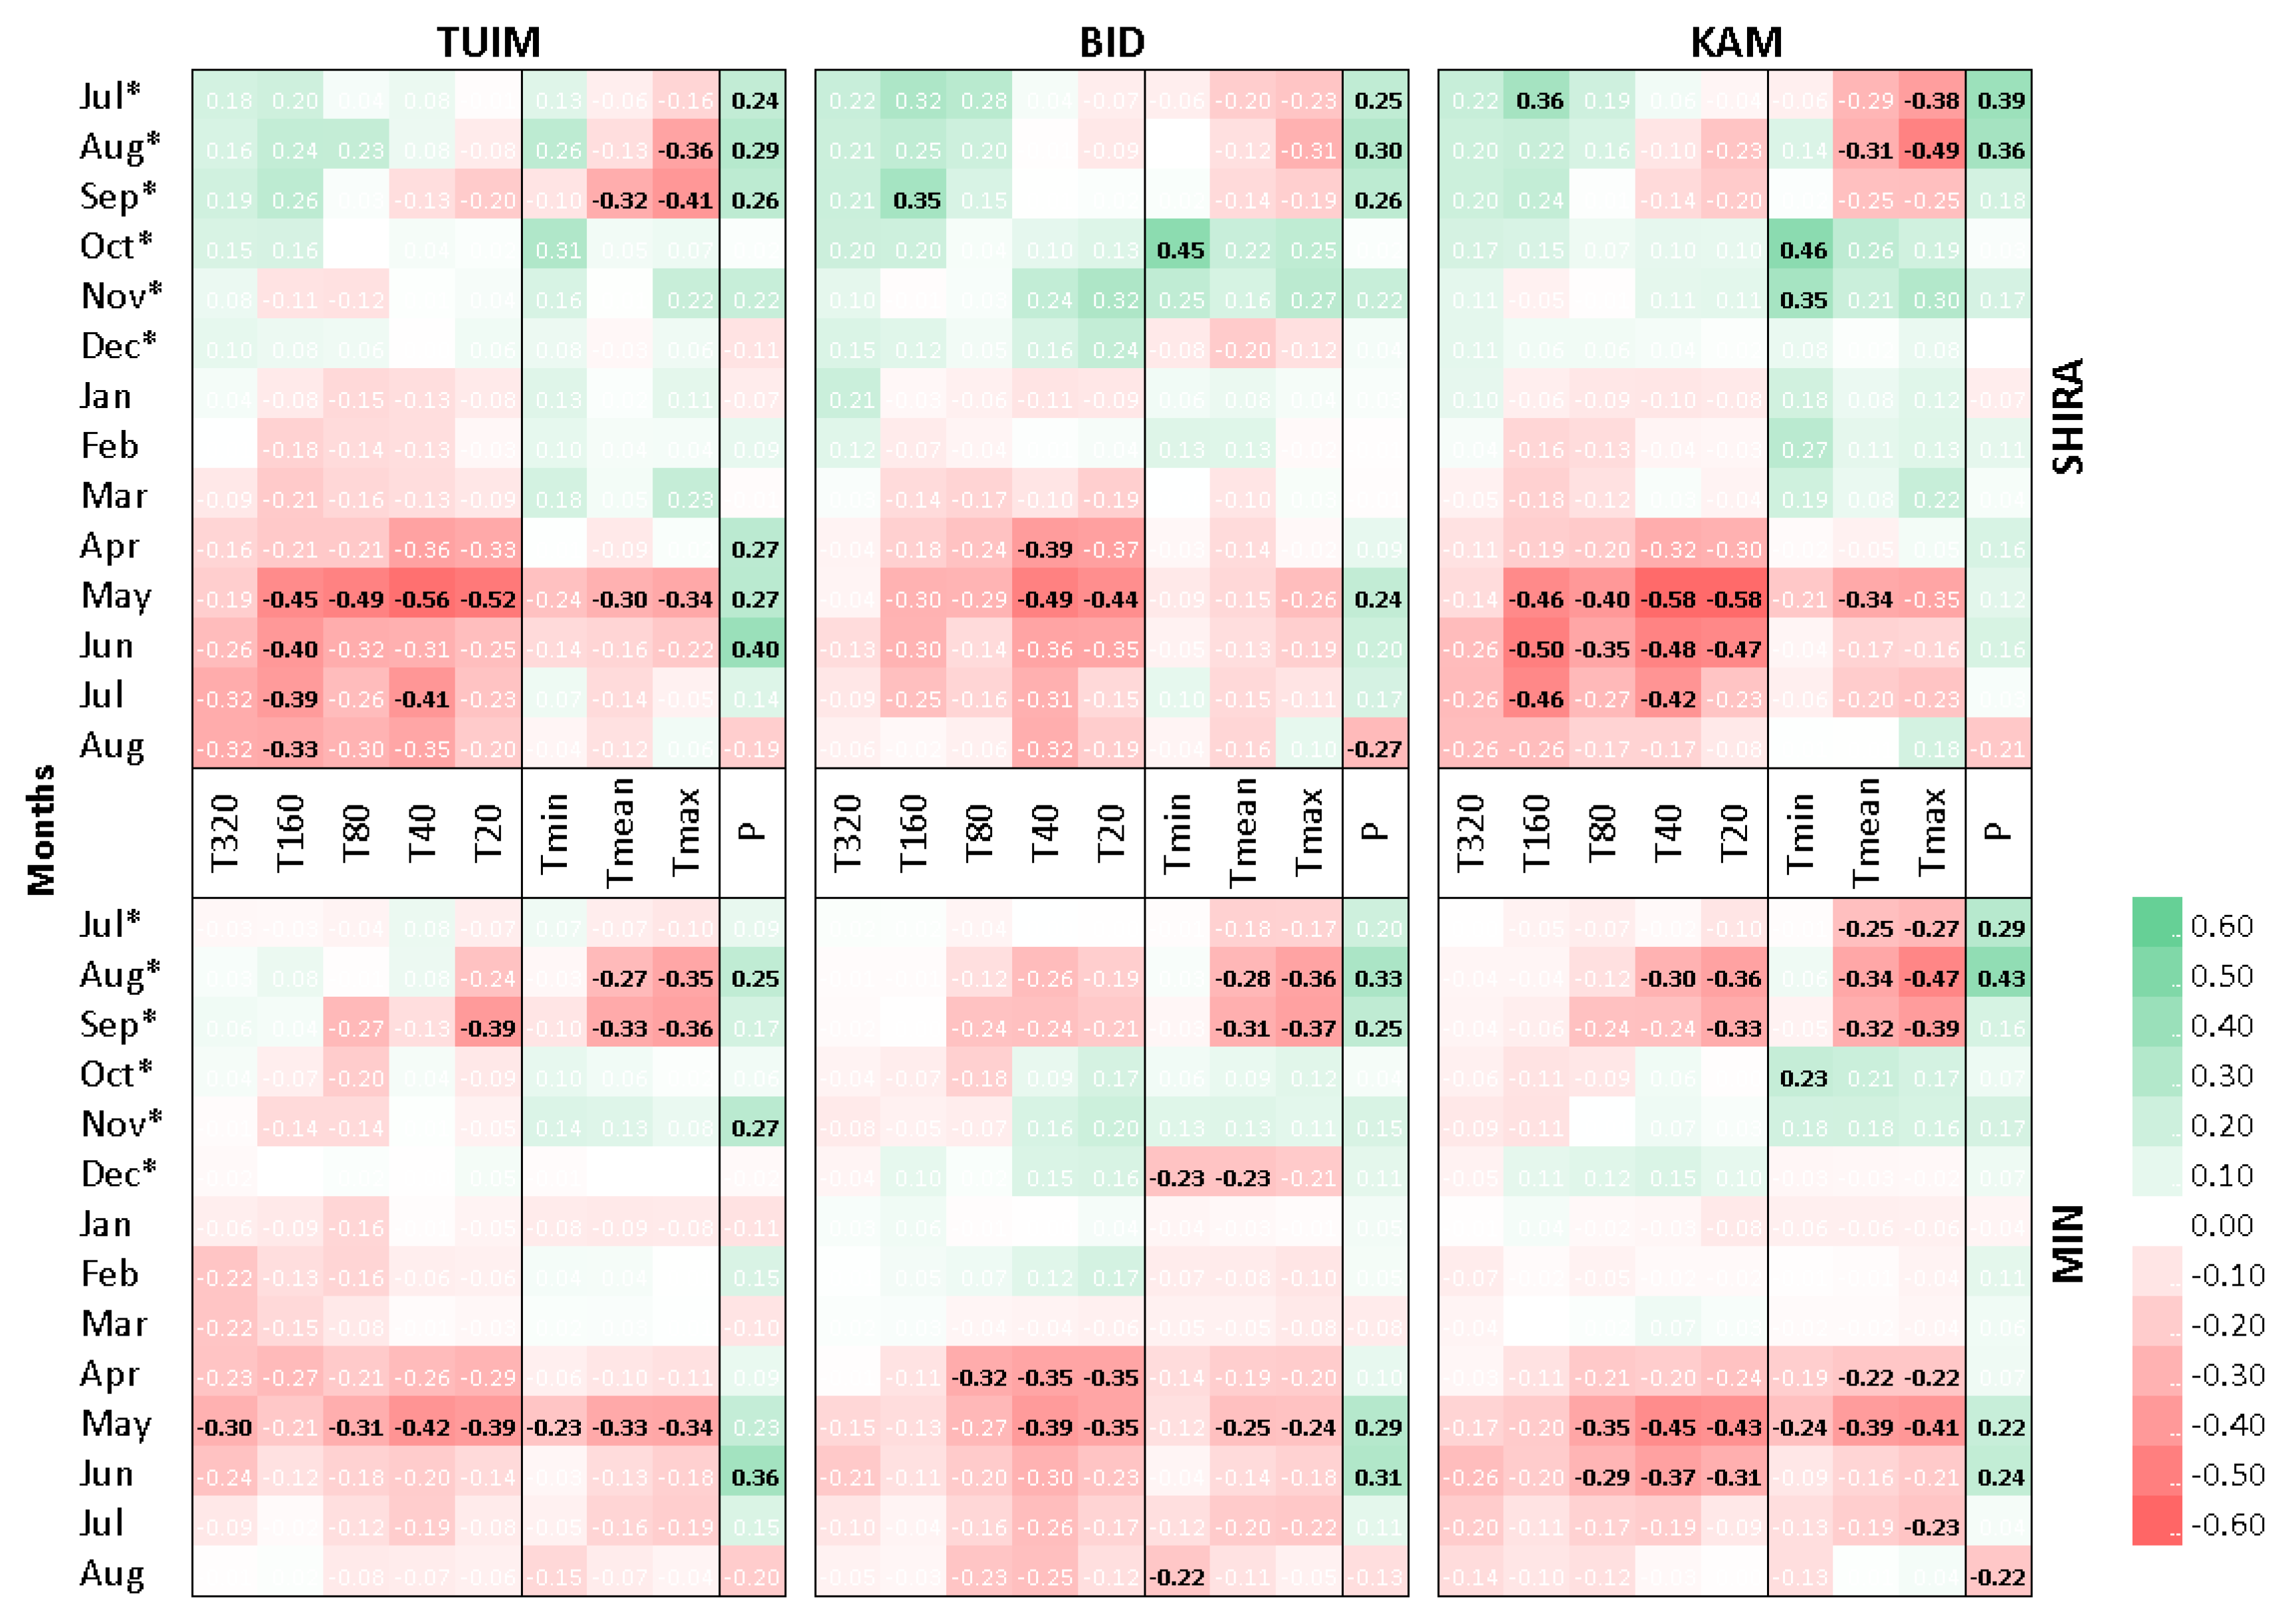
3.1. Climatic Response of Tree-Ring Chronologies

The high correlation of the TRW series collected in 2012–2013 with those collected in 2019 supported combining the earlier and later collections into a single local chronology for each site. The combined local chronologies, plotted in Figure 3, have inter-series correlations and mean sensitivity typical of climate-sensitive larch forest stands (Table 2). All three chronologies have adequate sample sizes, as judged by EPS > 0.85 at the start year (1936) of our climatic analysis, to represent the unknown population tree-ring variation at the sites.
Preliminary dendroclimatic analysis at a monthly time resolution showed that all three residual TRW chronologies respond similarly to climatic factors (Figure 4). A positive impact of precipitation on growth is most pronounced in July–September of the previous year and April–July of the current year. Air temperatures for essentially the same periods negatively correlate with TRW, and the correlation is stronger with Tmax than with Tmin. A positive relationship of larch growth with air temperatures is also evident in the first half of the winter preceding ring formation. Larch radial growth is negatively correlated with soil temperatures during April–August. This negative relationship reaches a maximum in May at depths of 20–40 cm but is present at all depths studied.
Correlations of tree-ring series with soil temperature in August-September of the previous season are negative, but these are mostly insignificant and observed at only shallow depths. It should be noted that correlations with precipitation and air temperatures are slightly stronger when using data from the nearer station: SHIRA for the northernmost TUIM site and MIN for the more southerly BID and KAM sites (albeit differences between individual correlation coefficients are not significant at p < 0.05). In contrast, all three tree-ring chronologies are more highly correlated with soil temperature at SHIRA than at MIN, and the difference in correlations is significant at p ≈ 0.05 in some cases. Therefore, in subsequent dendroclimatic analysis, we used the climatic data from SHIRA. This also simplifies the comparison of the results of dendroclimatic analysis at the three sites.
The daily time intervals of maximum influence of climatic factors, except for soil temperatures at depths of 160 and 320 cm in the previous season, were identified for three seasonal groupings, or periods, for which the monthly correlations suggested consistently unidirectional climatic influence: previous July–October, previous November–December, and current April–August (Figure 4). We refer to these periods as the previous vegetative season, the cold season, and the current vegetative season. For each period, we identified the daily time interval with maximum correlations for each factor, which was significantly (p < 0.05) correlated with the larch tree-ring index at one or more sites (Table 3). The inferred critical intervals of climatic influence have several interesting patterns. For both the previous and the current vegetative seasons, the start and end of the interval of maximum influence, as a rule, occur later at TUIM than at the other two sites. Several dates appear to be consistent across sites: the end of the critical intervals for the influence of air temperatures and precipitation of the previous growing season, the period of the precipitation influence, and the end of the Tmin influence in the current season. With the increase in depth, the beginning of the influence of soil temperatures at all sites shifts to a later date.

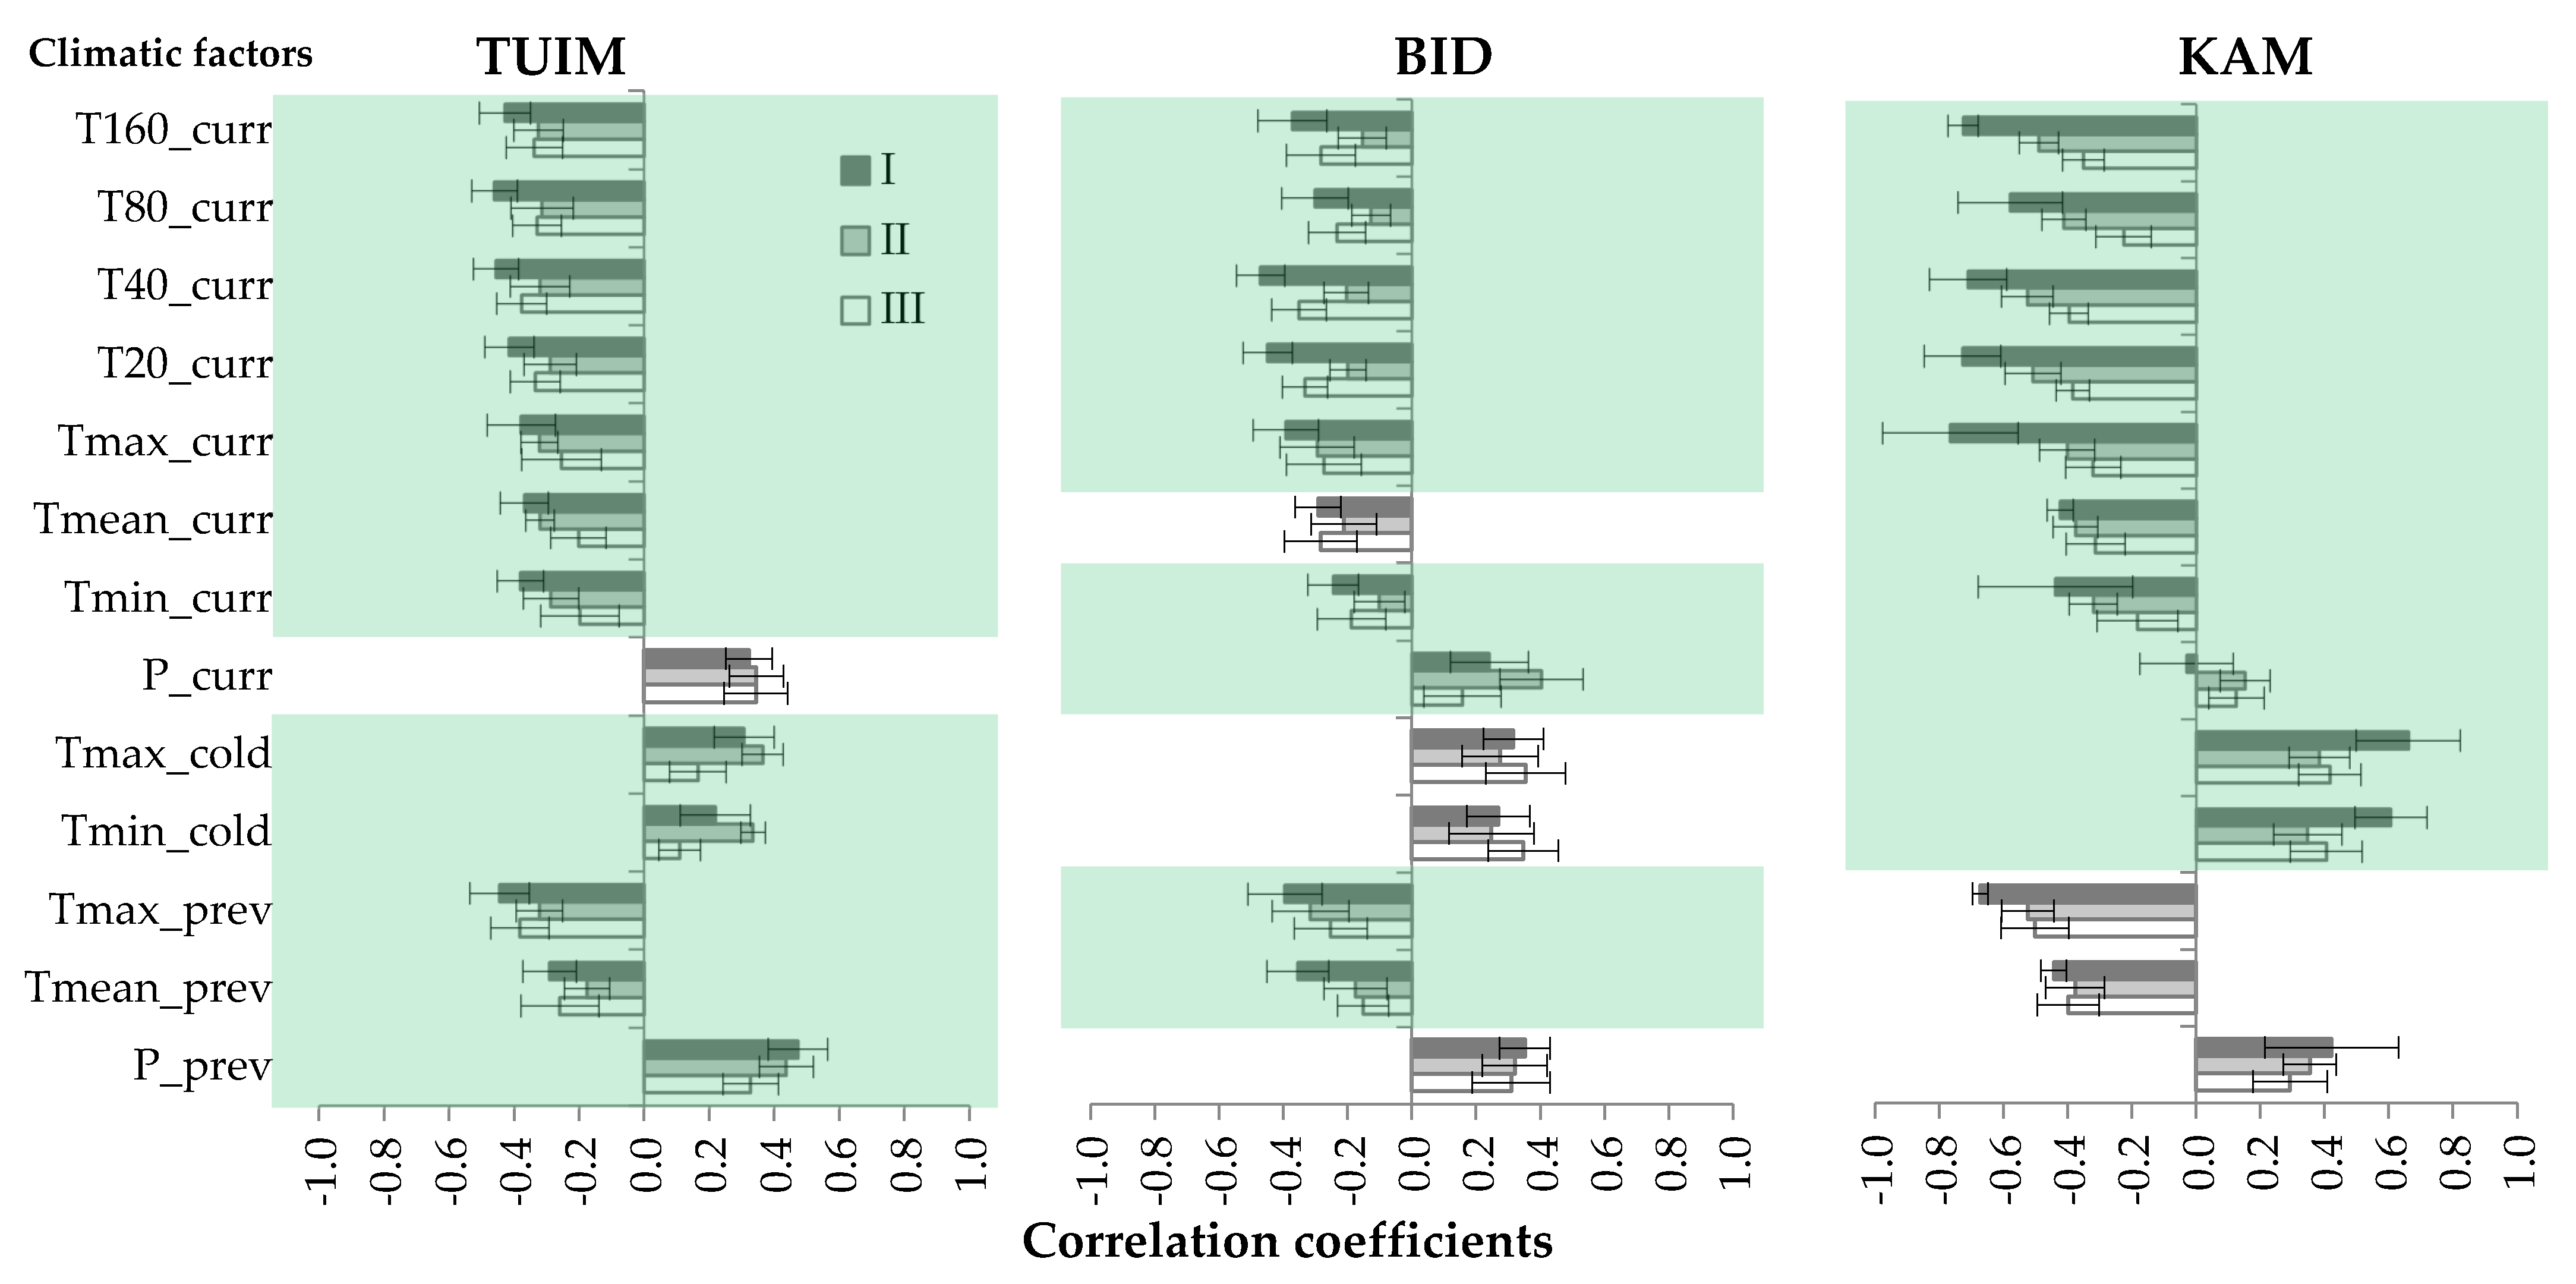
3.2. Cluster Analysis of Individual Trees’ Climatic Reactions

For the 13 combinations of critical intervals and climate variables listed for each site in Table 3, the same climate time series were used in a pairwise correlation analysis with the tree ring index of each individual tree at the sites. The resulting correlations (13 correlations characterizing the climatic response of each tree) were then analyzed with cluster analysis based on the K-means to explore possible groupings at each site related to the microsite and other tree-specific factors. Three clusters were identified for each site to maximize the difference between clusters and the similarity within them (Figure 5). A preliminary trial of the number of clusters (from two to four, data not presented) showed three clusters as optimal for the trade-off between a detailed description of the local population’s internal structure, limitation of sample depth, and reliability of differences between clusters. Note that for most of the factors considered, the climatic response is statistically significantly different (p < 0.05) between the three clusters.
The between-cluster differences in the climatic response are smallest for TUIM and largest for KAM. For all three sites, significant differences have a common direction: trees of cluster I have the maximum sensitivity to all factors except for precipitation of the current season, to which the trees of cluster II react most strongly. Trees with minimal climatic sensitivity to most factors are in cluster III (TUIM, KAM) or cluster II (BID). No significant differences in the age structure of clusters were found for TUIM, but the other two sites were characterized by a significant difference in the average cambial age of trees between clusters (Table 4), with its minimum value in cluster I. The pattern of the spatial distribution of trees belonging to different clusters was less evident for TUIM than for the other sites (Figure S4). For BID, trees of cluster I are more often found in a closed forest stand, forming several compact groups. On the other hand, trees of cluster II tend to be at the forest edge, and those of cluster III are located in a transitional position between the other two. The elevation of the tree location and the position on the slope do not appear to be significant factors in the spatial grouping of trees in this area into clusters. For KAM, cluster I contains only two young freestanding trees growing on flat terrain. Further classification for KAM separates trees growing on the lower edge of a closed stand at the foot of the northern slope (mainly cluster III) from freestanding trees and small clumps of trees on the valley floor and southeastern and southern slopes (mainly cluster II). There are a few exceptions to this classification for KAM.

4. Discussion

Despite the difference in the composition of soils and the vertical patterns of the soil temperature field, the correlations of long-term soil temperature series between stations within the shallow layers (at depths of 20, 40 and, to a lesser extent, 80 cm) are consistently high and comparable to those of air temperatures. This gives us reason to believe that the computed correlations of larch TRW with instrumental soil temperature at the two meteorological stations reflect the actual impact of temperature in the root-inhabited layer of the soil at the sampling sites on the growth of trees.

4.1. Physical Basis for Climate-Growth Correlations

A positive effect of precipitation and a negative effect of air temperature during the previous and current vegetative seasons on larch growth in the study area have been reported previously [45]. In the forest–steppe zone, moisture is low, the snow cover is thin and completely melts before the beginning of larch growth [56,57], and the hilly landscape typically dictates a deep-water table. Therefore, as in other drought-prone regions in continental climates [58,59], current precipitation during the warm season is the primary source of soil moisture, and high temperature acts as an exacerbating drying factor. This mechanism of the temperature effect is consistent with the fact that during the warm season, the most pronounced temperature response is observed for maximum temperature, which occurs during the daylight hours and, in concert with open stomata and the action of other energy-balance variables (e.g., higher wind speeds), stimulates evapotranspiration most strongly [60,61,62]. On the other hand, a lower response was observed for minimum temperature, which occurs at night during the vegetative season.
The effect of soil temperature on growth is most pronounced for depths of 20–40 cm, i.e., the main root-inhabited layer for larch in the study area [63]. In the first half of the vegetative season, this effect is recorded in the rate of cell division in the cambial zone of the growing ring [64]. Later in the season, the storage of nutrients depends on moisture availability [65,66,67]. The stock of nutrients generated is used by larch at the beginning of the next season to re-grow the photosynthetic apparatus, and therefore is reflected in the next ring [68,69]. At the beginning of the winter season, when the frost hardiness of larch is still forming, severe frosts can damage tissues [70]. Repair of this damage in the following spring also consumes plant resources. These frosts are also accompanied by soil freezing, but the lack of a significant correlation of tree growth with soil temperature at the start of the winter season suggests that negative soil temperatures are not critical for the root system during dormancy. This is consistent with the findings of Gurskaya and Shiyatov [70] that most frost injuries in larch occur above ground.
The patterns of variability in the timing of the impact of climate on the growth of larch are associated with the phenological phases of seasonal growth [64] and the drivers of those phases. The main trigger for the change in phenophases of tree growth is temperature [71]. This explains the important intervals of climatic influence at the colder TUIM site occurring later than the respective intervals at the other two tree-ring sites. We suspect that the lag in the influence of temperatures of deeper soil layers on the growth of larch at the beginning of the vegetative season is associated with gradual thawing and warming of the soil from top to bottom (cf. Figure 2). The synchronous end of the climatic influence in autumn at all three sites suggests that the completion of growth processes and the fall of the needles before the tree goes into dormancy is regulated to a greater extent by a shortening photoperiod than by a decrease in temperature [72,73].
We found that larch growth is more strongly correlated with atmospheric variables for the meteorological station closest geographically and not separated from the forest stand by the mountain massif. However, growth at all three sites is most strongly correlated with soil temperature at SHIRA. We hypothesize that the similarity of the soil type between stations and sampling sites is an additional factor that increases the reliability of that station’s soil temperature series for dendroclimatic analysis at relatively large distances. The effect appears to be so strong that tree-ring correlations with SHIRA soil temperature at the beginning of the vegetative season are even higher than those with air temperature.

4.2. Dependence of Climatic Response on Individual Characteristics of Trees

Clusters of trees with different response intensities to the main climatic factors were identified at all three sampling sites. At all three sampling sites, the observed within-site climatic response variability is consistent for soil temperature and aboveground climatic variables, which supports our hypothesis that soil temperature data from meteorological stations distant from the forest stand can reliably be used to study relationships between tree-ring indices and soil temperature.
However, the reason for tree-to-tree differences in climate response revealed by the cluster analysis is complicated. Clusters are most different at KAM, where the sampled trees grow in the most diverse conditions: slopes of different orientations, different stand densities, and even different characteristics of the grass cover as an indicator of the soil moisture availability (see Figure S4). The cluster analysis results are most easily explained by microsite differences at this site. At the other two sites, with more homogeneous microsite conditions, differences between the clusters are less pronounced than at KAM. Overall, the cluster results are consistent with studies suggesting that the most significant contribution to the differential sensitivity of trees to climate, at least in the forest–steppe zone of southern Siberia, is from microhabitat conditions that enhance or hinder water supply [74,75].
At BID, the cluster results suggest an influence of tree age and possibly stand density on the differential climate response of trees. An “edge effect”, i.e., greater availability of resources and greater sensitivity of tree growth to climate for trees growing at the border between a forest stand and clearings, has been previously reported [76,77]. Although age dependence in the sensitivity of trees to climate has been previously investigated, the results are ambiguous: both an increase and a decrease in climatic sensitivity with age have been reported [78,79]. Evidently, both age and availability of open space are positively related to allometric properties of trees (e.g., size of the crown, trunk, and root system) that determine the need for and ability to obtain water and nutrients [80,81,82].
Finally, at TUIM, where the site’s landscape is most uniform, and moisture is most limited (total absence of closed stands and dominance of herbaceous cover by steppe grasses), cluster results showed no intra-site climate sensitivity patterns either in tree location or in age. We can only speculate that cluster differences observed at the TUIM site are driven by factors not considered in this study. Such factors might include the genotype of individual trees, as shown by a few studies in the new field of dendrogenomics [83,84]. A study of the contribution of genetic factors to tree-to-tree differences in climate response at these three larch stands is currently in progress.

5. Conclusions

Soil temperature series from meteorological stations as far as 100 km from the tree-ring sites have been found suitable for dendroclimatic studies of the dependence of larch tree growth on soil temperature in south central Siberia. The maximum correlation of soil temperature with TRW indices was found to occur at depths of 20–80 cm, coinciding with the depth of the main root zone of larch. Moreover, soil temperature near a depth of 40 cm was found for the tree-ring sites studied to be more highly correlated than near-surface air temperature with TRW indices. The results support the hypothesis that the spatial coherence of air temperature between meteorological stations drives similar coherence in soil temperature. Differences in the thermal inertia related to soil properties substantially dampen coherence only for deep soil layers. The results of cluster analysis indicate that within-site (tree-to-tree) differences in the response of growth to soil temperature and aboveground climate are comparable and partially explained by soil–landscape heterogeneity, competition between trees, and cambial age. Overall, we suggest an increased focus on soil temperature in unravelling climatic factors influencing tree growth and underscore the importance of taking soil type into account when selecting available sources of soil temperature data for this purpose.

Supplementary Materials

The following are available online at https://www.mdpi.com/article/10.3390/f12121765/s1, Figure S1: Cover periods and missing data in daily climatic series available at two stations MIN and SHIRA. The dashed rectangle frame depicts the period with the most complete data for all climatic variables; the size of the coloured dots reflects the proportion of missing data, Figure S2: Cross-correlations between the average (1985–2000) seasonal curves of air temperature Tmean and soil temperature at different depths according to MIN and SHIRA data, Figure S3: Correlations of daily and moving 21-day long-term series of the same climatic variables between two stations SHIRA and MIN (1985–2000). For precipitation, correlations were calculated only for the 21-day series due to the stochastic and discrete nature of this variable, Figure S4: Spatial classification of individual trees within sites KAM, TUIM and BID according to their climatic signal. Trees were classified into three clusters at each site depicted by three colours, respectively: red (I), blue (II), and white (III). Background maps are satellite data Google© 2021.

Author Contributions

Conceptualization, L.V.B. and D.F.Z.; data curation, D.F.Z.; formal analysis, L.V.B.; funding acquisition, D.M.M. and K.V.K.; investigation, L.V.B., D.F.Z. and E.A.B.; methodology, L.V.B., D.M.M. and E.A.V.; project administration, D.F.Z. and E.A.B.; resources, E.A.B. and K.V.K.; software, L.V.B. and D.F.Z.; supervision, E.A.B. and E.A.V.; validation, D.M.M., E.A.V. and K.V.K.; visualization, L.V.B.; writing—original draft preparation, L.V.B. and D.F.Z.; writing—review and editing, L.V.B., D.F.Z., D.M.M. and K.V.K. All authors have read and agreed to the published version of the manuscript.

Funding

This study was supported by the Russian Foundation for Basic Research grant #19-04-00964 (development of methodology) and the Russian Science Foundation grant #19-14-00120 (sample collection and data analysis). D. Meko’s contribution was supported by the Office of Polar Programs of National Science Foundation, USA (NSF #1917503).

Data Availability Statement

The data presented in this study are available on request from the corresponding authors.

Acknowledgments

The authors acknowledge support from the German Research Foundation (DFG) and the Open Access Publication Funds of the University of Göttingen. We are grateful to anonymous reviewers whose comments helped us improve the quality of the manuscript.

Conflicts of Interest

The authors declare no conflict of interest. The funders had no role in the design of the study; in the collection, analyses, or interpretation of data; in the writing of the manuscript, or in the decision to publish the results.

References

  1. Fritts, H.C. Tree Rings and Climate; Academic Press: London, UK, 1976. [Google Scholar] [CrossRef]
  2. Hughes, M.K.; Swetnam, T.W.; Diaz, H.F. Dendroclimatology: Progress and Prospects; Springer: Dordrecht, Germany, 2010. [Google Scholar] [CrossRef]
  3. Eshel, A.; Beeckman, T. Plant Roots: The Hidden Half, 4th ed.; CRC Press, Taylor and Francis Group: Boca Raton, FL, USA, 2013. [Google Scholar] [CrossRef]
  4. Alvarez-Uria, P.; Körner, C. Low temperature limits of root growth in deciduous and evergreen temperate tree species. Funct. Ecol. 2007, 21, 211–218. [Google Scholar] [CrossRef]
  5. Veihmeyer, F.J.; Hendrickson, A.H. Soil moisture in relation to plant growth. Ann. Rev. Plant Physiol. 1950, 1, 285–304. [Google Scholar] [CrossRef]
  6. Babst, F.; Alexander, M.R.; Szejner, P.; Bouriaud, O.; Klesse, S.; Roden, J.; Ciais, P.; Poulter, B.; Frank, D.; Moore, D.J.P.; et al. A tree-ring perspective on the terrestrial carbon cycle. Oecologia 2014, 176, 307–322. [Google Scholar] [CrossRef] [PubMed] [Green Version]
  7. Xu, K.; Wang, X.; Liang, P.; An, H.; Sun, H.; Han, W.; Li, Q. Tree-ring widths are good proxies of annual variation in forest productivity in temperate forests. Sci. Rep. 2017, 7, 1945. [Google Scholar] [CrossRef] [PubMed] [Green Version]
  8. Chen, J.; Franklin, J.F. Growing-season microclimate variability within an old-growth Douglas-fir forest. Clim. Res. 1997, 8, 21–34. [Google Scholar] [CrossRef] [Green Version]
  9. Morecroft, M.D.; Taylor, M.E.; Oliver, H.R. Air and soil microclimates of deciduous woodland compared to an open site. Agric. For. Meteorol. 1998, 90, 141–156. [Google Scholar] [CrossRef]
  10. Daly, C.; Halbleib, M.; Smith, J.I.; Gibson, W.P.; Doggett, M.K.; Taylor, G.H.; Pasteris, P.P. Physiographically sensitive mapping of climatological temperature and precipitation across the conterminous United States. Int. J. Climatol. 2008, 28, 2031–2064. [Google Scholar] [CrossRef]
  11. Meko, D.M.; Stahle, D.W.; Griffin, D.; Knight, T.A. Inferring precipitation–anomaly gradients from tree rings. Quatern. Int. 2011, 235, 89–100. [Google Scholar] [CrossRef]
  12. Harris, I.; Jones, P.D.; Osborn, T.J.; Lister, D.H. Updated high-resolution grids of monthly climatic observations—the CRU TS3.10 Dataset. Int. J. Climatol. 2014, 34, 623–642. [Google Scholar] [CrossRef] [Green Version]
  13. Touchan, R.; Anchukaitis, K.J.; Shishov, V.V.; Sivrikayan, F.; Attieh, J.; Ketmen, M.; Meko, D.M. Spatial patterns of eastern Mediterranean climate influence on tree growth. Holocene 2014, 24, 381–392. [Google Scholar] [CrossRef]
  14. Porte, A.; Huard, F.; Dreyfus, P. Microclimate beneath pine plantation, semi-mature pine plantation and mixed broadleaved-pine forest. Agric. For. Meteorol. 2004, 126, 175–182. [Google Scholar] [CrossRef]
  15. Geiger, R.; Aron, R.H.; Todhunter, P. The Climate near the Ground, 7th ed.; Rowman & Littlefield: Lanham, MD, USA, 2009. [Google Scholar]
  16. von Arx, G.; Graf Pannatier, E.; Thimonier, A.; Rebetez, M. Microclimate in forests with varying leaf area index and soil moisture: Potential implications for seedling establishment in a changing climate. J. Ecol. 2013, 101, 1201–1213. [Google Scholar] [CrossRef]
  17. Qian, B.; Gregorich, E.G.; Gameda, S.; Hopkins, D.W.; Wang, X.L. Observed soil temperature trends associated with climate change in Canada. J. Geophys. Res. Atmos. 2011, 116, D02106. [Google Scholar] [CrossRef]
  18. Onwuka, B.; Mang, B. Effects of soil temperature on some soil properties and plant growth. Adv. Plants Agric. Res. 2018, 8, 34–37. [Google Scholar] [CrossRef]
  19. Wu, J.; Nofziger, D.L. Incorporating temperature effects on pesticide dug radiation into a management model. J. Environ. Qual. 1999, 28, 92–100. [Google Scholar] [CrossRef]
  20. Elias, E.A.; Cichota, R.; Torraiani, H.H.; De Jong Van Lier, Q. Analytical soil temperature model: Correction for temporal variation of daily amplitude. Soil Sci. Soc. Am. J. 2004, 68, 784–788. [Google Scholar] [CrossRef]
  21. Nwankwo, C.; Ogagarue, D. An Investigation of Temperature Variation at Soil Depths in Parts of Southern Nigeria. Am. J. Environ. Eng. 2012, 2, 142–147. [Google Scholar] [CrossRef] [Green Version]
  22. Vaganov, E.A.; Hughes, M.K.; Kirdyanov, A.V.; Schweingruber, F.H.; Silkin, P.P. Influence of snowfall and melt timing on tree growth in subarctic Eurasia. Nature 1999, 400, 149–151. [Google Scholar] [CrossRef]
  23. Zhang, T.; Barry, R.; Gilichinsky, D.; Bykhovets, S.; Sorokovikov, V.A.; Ye, J. An Amplified Signal of Climatic Change in Soil Temperatures during the Last Century at Irkutsk, Russia. Clim. Chang. 2001, 49, 41–76. [Google Scholar] [CrossRef]
  24. Kirdyanov, A.; Hughes, M.; Vaganov, E.; Schweingruber, F.; Silkin, P. The importance of early summer temperature and date of snow melt for tree growth in the Siberian Subarctic. Trees 2003, 17, 61–69. [Google Scholar] [CrossRef]
  25. Sanmiguel-Vallelado, A.; Camarero, J.J.; Morán-Tejeda, E.; Gazol, A.; Colangelo, M.; Alonso-González, E.; López-Moreno, J.I. Snow dynamics influence tree growth by controlling soil temperature in mountain pine forests. Agric. For. Meteorol. 2021, 296, 108205. [Google Scholar] [CrossRef]
  26. García-Suárez, A.M.; Butler, C.J. Soil temperatures at Armagh observatory, Northern Ireland, from 1904 to 2002. Int. J. Climatol. 2006, 26, 1075–1089. [Google Scholar] [CrossRef] [Green Version]
  27. Osawa, A.; Zyryanova, O.A.; Matsuura, Y.; Kajimoto, T.; Wein, R.W. Permafrost Ecosystems: Siberian Larch Forests; Springer: Dordrecht, The Netherlands, 2010. [Google Scholar] [CrossRef]
  28. Bryukhanova, M.V.; Kirdyanov, A.V.; Prokushkin, A.S.; Silkin, P.P. Specific features of xylogenesis in Dahurian larch, Larix gmelinii (Rupr.) Rupr., growing on permafrost soils in Middle Siberia. Russ. J. Ecol. 2013, 44, 361–366. [Google Scholar] [CrossRef]
  29. Dashtseren, A.; Ishikawa, M.; Iijima, Y.; Jambaljav, Y. Temperature regimes of the active layer and seasonally frozen ground under a forest-steppe mosaic, Mongolia. Permafr. Periglac. Process. 2014, 25, 295–306. [Google Scholar] [CrossRef]
  30. Park, H.; Sherstiukov, A.B.; Fedorov, A.N.; Polyakov, I.V.; Walsh, J.E. An observation-based assessment of the influences of air temperature and snow depth on soil temperature in Russia. Environ. Res. Lett. 2014, 9, 064026. [Google Scholar] [CrossRef]
  31. Wang, X.; Chen, R.; Han, C.; Yang, Y.; Liu, J.; Liu, Z.; Guo, S.; Song, Y. Response of shallow soil temperature to climate change on the Qinghai–Tibetan Plateau. Int. J. Clim. 2020, 41, 1–16. [Google Scholar] [CrossRef]
  32. Abu-Hamdeh, N.H.; Reeder, R.C. Soil thermal conductivity effects of density, moisture, salt concentration, and organic matter. Soil Sci. Soc. Am. J. 2000, 64, 1285–1290. [Google Scholar] [CrossRef]
  33. Elizbarashvili, E.S.; Urushadze, T.F.; Elizbarashvili, M.E.; Elizbarashvili, S.E.; Schaefer, M.K. Temperature regime of some soil types in Georgia. Eurasian Soil Sci. 2010, 43, 427–435. [Google Scholar] [CrossRef]
  34. Alem, S.; Madera, P.; Pavlis, J. Soil temperature in an open site and below two plantation forest canopies in a tropical highland area, southern Ethiopia. Theor. Appl. Climatol. 2020, 139, 907–914. [Google Scholar] [CrossRef]
  35. Chen, J.Q.; Franklin, J.F.; Spies, T.A. Contrasting microclimates among clear-cut, edge, and interior of old-growth Douglas-fir forest. Agric. For. Met. 1993, 63, 219–237. [Google Scholar] [CrossRef]
  36. Breshears, D.D.; Rich, P.M.; Barnes, F.J.; Campbell, K. Overstory-imposed heterogeneity in solar radiation and soil moisture in a semiarid woodland. Ecol. Appl. 1997, 7, 1201–1215. [Google Scholar] [CrossRef]
  37. Holst, T.; Mayer, H.; Schindler, D. Microclimate within beech stands part II: Thermal conditions. Eur. J. Forest Res. 2004, 123, 13–28. [Google Scholar] [CrossRef]
  38. Matthias, A.D.; Musil, S. Temperatures and thermal diffusivity within a rangeland soil near oracle, Arizona. J. Arizona-Nevada Acad. Sci. 2012, 44, 15–21. [Google Scholar] [CrossRef]
  39. García-Suárez, A.M.; Butler, C.J.; Baillie, M.G.L. Climate signal in tree-ring chronologies in a temperate climate: A multi-species approach. Dendrochronologia 2009, 27, 183–198. [Google Scholar] [CrossRef] [Green Version]
  40. Nikolaev, A.N.; Fedorov, P.P.; Desyatkin, A.R. Influence of climate and soil hydrothermal regime on radial growth of Larix cajanderi and Pinus sylvestris in Central Yakutia, Russia. Scand. J. For. Res. 2009, 24, 217–226. [Google Scholar] [CrossRef]
  41. Brédoire, F.; Kayler, Z.E.; Dupoueyl, J.-L.; Derrien, D.; Zeller, B.; Barsukov, P.A.; Rusalimova, O.; Nikitich, P.; Bakker, M.R.; Legout, A. Limiting factors of aspen radial growth along a climatic and soil water budget gradient in south-western Siberia. Agric. For. Meteorol. 2020, 282, 107870. [Google Scholar] [CrossRef]
  42. Yuan, S.; Zheng, Y.; Qi, Y.; Kong, F.; Wang, D.; Zhang, F. A method for reconstructing the past soil temperature based on tree-ring widths. For. Sci. 2020, 66, 393–402. [Google Scholar] [CrossRef]
  43. Belokopytova, L.V.; Babushkina, E.A.; Zhirnova, D.F.; Panyushkina, I.P.; Vaganov, E.A. Climatic response of conifer radial growth in forest-steppes of South Siberia: Comparison of three approaches. Contemp. Probl. Ecol. 2018, 11, 366–376. [Google Scholar] [CrossRef] [Green Version]
  44. Babushkina, E.A.; Zhirnova, D.F.; Belokopytova, L.V.; Tychkov, I.I.; Vaganov, E.A.; Krutovsky, K.V. Response of four tree species to changing climate in a moisture-limited area of South Siberia. Forests 2019, 10, 999. [Google Scholar] [CrossRef] [Green Version]
  45. Zhirnova, D.F.; Babushkina, E.A.; Belokopytova, L.V.; Vaganov, E.A. To which side are the scales swinging? Growth stability of Siberian larch under permanent moisture deficit with periodic droughts. For. Ecol. Manag. 2020, 459, 117841. [Google Scholar] [CrossRef]
  46. Zhirnova, D.F.; Belokopytova, L.V.; Meko, D.M.; Babushkina, E.A.; Vaganov, E.A. Climate change and tree growth in the Khakass-Minusinsk Depression (South Siberia) impacted by large water reservoirs. Sci. Rep. 2021, 11, 14266. [Google Scholar] [CrossRef]
  47. Alisov, B.P. Climate of the USSR; Moscow State University: Moscow, Russia, 1956. (In Russian) [Google Scholar]
  48. Cook, E.R.; Kairiukstis, L.A. Methods of Dendrochronology: Applications in the Environmental Sciences; Springer: Dordrecht, The Netherlands, 1990. [Google Scholar] [CrossRef]
  49. Pirie, M.R.; Fowler, A.M.; Triggs, C.M. Assessing the accuracy of three commonly used pith offset methods applied to Agathis australis (Kauri) incremental cores. Dendrochronologia 2015, 36, 60–68. [Google Scholar] [CrossRef]
  50. Rinn, F. TSAP-Win: Time Series Analysis and Presentation for Dendrochronology and Related Applications: User Reference; RINNTECH: Heidelberg, Germany, 2003. [Google Scholar]
  51. Holmes, R.L. Computer-assisted quality control in tree-ring dating and measurement. Tree Ring Bull. 1983, 43, 68–78. [Google Scholar]
  52. Cook, E.R.; Krusic, P.J. Program ARSTAN: A Tree-Ring Standardization Program Based on Detrending and Autoregressive Time Series Modeling, with Interactive Graphics; Lamont-Doherty Earth Observatory, Columbia University: New York, NY, USA, 2005. [Google Scholar]
  53. Cook, E.R. A Time Series Analysis Approach to Tree-Ring Standardization. Ph.D. Thesis, University of Arizona, Tucson, AZ, USA, 1985. [Google Scholar]
  54. Wigley, T.M.L.; Briffa, K.R.; Jones, P.D. On the average value of correlated time series, with applications in dendroclimatology and hydrometeorology. J. Appl. Meteorol. Climatol. 1984, 23, 201–213. [Google Scholar] [CrossRef]
  55. Wilks, D.S. Statistical Methods in the Atmospheric Sciences, 4th ed.; Elsevier: Cambridge, UK, 2019. [Google Scholar]
  56. Velisevich, S.N.; Khutornoi, O.V. Effects of climatic factors on radial growth of Siberian stone pine and Siberian larch in sites with different soil humidity in the south of western Siberia. J. Sib. Fed. Univ. Biol. 2009, 2, 117–132. (In Russian) [Google Scholar]
  57. Urban, J.; Rubtsov, A.V.; Urban, A.V.; Shashkin, A.V.; Benkova, V.E. Canopy transpiration of a Larix sibirica and Pinus sylvestris forest in Central Siberia. Agric. For. Meteorol. 2019, 271, 64–72. [Google Scholar] [CrossRef]
  58. Liu, H.; Park Williams, A.; Allen, C.D.; Guo, D.; Wu, X.; Anenkhonov, O.A.; Liang, E.; Sandanov, D.V.; Yin, Y.; Qi, Z.; et al. Rapid warming accelerates tree growth decline in semi-arid forests of Inner Asia. Glob. Chang. Biol. 2013, 19, 2500–2510. [Google Scholar] [CrossRef]
  59. Belokopytova, L.; Zhirnova, D.; Kostyakova, T.; Babushkina, E. Dynamics of moisture regime and its reconstruction from a tree-ring width chronology of Pinus sylvestris in the downstream basin of the Selenga River, Russia. J. Arid Land 2018, 10, 877–891. [Google Scholar] [CrossRef] [Green Version]
  60. Ermida, S.L.; Trigo, I.F.; DaCamara, C.C.; Göttsche, F.M.; Olesen, F.S.; Hulley, G. Validation of remotely sensed surface temperature over an oak woodland landscape—The problem of viewing and illumination geometries. Remote Sens. Environ. 2014, 148, 16–27. [Google Scholar] [CrossRef]
  61. Jackson, R.D.; Idso, S.B.; Reginato, R.J.; Pinter, P.J., Jr. Canopy temperature as a crop water stress indicator. Water Resour. Res. 1981, 17, 1133–1138. [Google Scholar] [CrossRef]
  62. Williams, A.P.; Allen, C.D.; Macalady, A.K.; Griffin, D.; Woodhouse, C.A.; Meko, D.M.; Swetnam, T.W.; Rauscher, S.A.; Seager, R.; Grissino-Mayer, H.D.; et al. Temperature as a potent driver of regional forest drought stress and tree mortality. Nat. Clim. Chang. 2013, 3, 292–297. [Google Scholar] [CrossRef]
  63. Sorokina, O.A. (Krasnoyarsk State Agrarian University, Krasnoyarsk, Russian Federation). Personal communication. 2021. [Google Scholar]
  64. Vaganov, E.A.; Hughes, M.K.; Shashkin, A.V. Growth Dynamics of Conifer Tree Rings: Images of Past and Future Environments; Springer: Dordrecht, The Netherlands, 2006. [Google Scholar] [CrossRef]
  65. Kozlowski, T.T. Carbohydrate sources and sinks in woody plants. Bot. Rev. 1992, 58, 107–222. [Google Scholar] [CrossRef]
  66. Bréda, N.; Huc, R.; Granier, A.; Dreyer, E. Temperate forest trees and stands under severe drought: A review of ecophysiological responses, adaptation processes and long-term consequences. Ann. For. Sci. 2006, 63, 625–644. [Google Scholar] [CrossRef] [Green Version]
  67. Pallardy, S.G. Physiology of Woody Plant, 3rd ed.; Academic Press: San-Diego, CA, USA, 2010. [Google Scholar]
  68. Piper, F.I.; Fajardo, A. Foliar habit, tolerance to defoliation and their link to carbon and nitrogen storage. J. Ecol. 2014, 102, 1101–1111. [Google Scholar] [CrossRef]
  69. Danek, M.; Chuchro, M.; Walanus, A. tree-ring growth of larch (Larix decidua Mill.) in the Polish Sudetes—the influence of altitude and site-related factors on the climate–growth relationship. Forests 2018, 9, 663. [Google Scholar] [CrossRef] [Green Version]
  70. Gurskaya, M.A.; Shiyatov, S.G. Distribution of frost injuries in the wood of conifers. Russ. J. Ecol. 2006, 37, 7–12. [Google Scholar] [CrossRef]
  71. Rossi, S.; Deslauriers, A.; Griçar, J.; Seo, J.W.; Rathgeber, C.B.K.; Anfodillo, T.; Morin, H.; Levanic, T.; Oven, P.; Jalkanen, R. Critical temperatures for xylogenesis in conifers of cold climates. Glob. Ecol. Biogeogr. 2008, 17, 696–707. [Google Scholar] [CrossRef]
  72. Migliavacca, M.; Cremonese, E.; Colombo, R.; Busetto, L.; Galvagno, M.; Ganis, L.; Meroni, M.; Pari, E.; Rossini, M.; Siniscalco, C.; et al. European larch phenology in the Alps: Can we grasp the role of ecological factors by combining field observations and inverse modelling? Int. J. Biometeorol. 2008, 52, 587–605. [Google Scholar] [CrossRef]
  73. Lukkarinen, A.J.; Ruotsalainen, S.; Peltola, H.; Nikkanen, T. Bud set and autumn coloration of Larix sibirica and Larix gmelinii provenances in a field trial in southern Finland. Scand. J. For. Res. 2014, 29, 27–40. [Google Scholar] [CrossRef]
  74. Bílek, L.; Remes, J.; Podrazsky, V.; Rozenbergar, D.; Diaci, J.; Zahradník, D. Gap regeneration in near-natural European beech forest stands in Central Bohemia-the role of heterogeneity and micro-habitat factors. Dendrobiology 2014, 71, 59–71. [Google Scholar] [CrossRef] [Green Version]
  75. García de Jalón, L.; Limousin, J.M.; Richard, F.; Gessler, A.; Peter, M.; Hättenschwiler, S.; Milcu, A. Microhabitat and ectomycorrhizal effects on the establishment, growth and survival of Quercus ilex L. seedlings under drought. PLoS ONE 2020, 15, e0229807. [Google Scholar] [CrossRef]
  76. Sandoval, S.; Cancino, J. Modeling the edge effect in even-aged Monterrey pine (Pinus radiata D. Don) stands incorporating a competition index. For. Ecol. Manag. 2008, 256, 78–87. [Google Scholar] [CrossRef]
  77. Albiero-Júnior, A.; Venegas-González, A.; Rodríguez-Catón, M.; Oliveira, J.M.; Longhi-Santos, T.; Galvão, F.; Temponi, L.G.; Botosso, P.C. Edge effects modify the growth dynamics and climate sensitivity of Araucaria angustifolia trees. Tree-Ring Res. 2020, 76, 11–26. [Google Scholar] [CrossRef]
  78. Rozas, V.; DeSoto, L.; Olano, J.M. Sex-specific, age-dependent sensitivity of tree-ring growth to climate in the dioecious tree Juniperus thurifera. New Phytol. 2009, 182, 687–697. [Google Scholar] [CrossRef]
  79. Wang, X.; Zhang, Y.; McRae, D.J. Spatial and age-dependent tree-ring growth responses of Larix gmelinii to climate in northeastern China. Trees 2009, 23, 875–885. [Google Scholar] [CrossRef]
  80. Martín-Benito, D.; Cherubini, P.; Del Río, M.; Cañellas, I. Growth response to climate and drought in Pinus nigra Arn. trees of different crown classes. Trees 2008, 22, 363–373. [Google Scholar] [CrossRef]
  81. Zang, C.; Pretzsch, H.; Rothe, A. Size-dependent responses to summer drought in Scots pine, Norway spruce and common oak. Trees 2012, 26, 557–569. [Google Scholar] [CrossRef]
  82. Comas, L.; Becker, S.; Cruz, V.M.V.; Byrne, P.F.; Dierig, D.A. Root traits contributing to plant productivity under drought. Front. Plant Sci. 2013, 4, 442. [Google Scholar] [CrossRef] [Green Version]
  83. Johnson, J.S.; Chhetri, P.K.; Krutovsky, K.V.; Cairns, D.M. Growth and its relationship to individual genetic diversity of mountain hemlock (Tsuga mertensiana) at alpine treeline in Alaska: Combining dendrochronology and genomics. Forests 2017, 8, 418. [Google Scholar] [CrossRef] [Green Version]
  84. Fasanella, M.; Suarez, M.L.; Hasbun, R.; Premoli, A.C. Individual-based dendrogenomic analysis of forest dieback driven by extreme droughts. Can. J. For. Res. 2021, 51, 420–432. [Google Scholar] [CrossRef]
Figure 1. Map of the study area displaying sampling sites in foothills of the Bateni Ridge (circles) and the two closest meteorological stations (triangles). The insert shows the location of the study area in Russia. The background map is based on satellite data© 2020 Google; the insert schematic map was adopted from the cropped map of Khakassia within Russia under CC BY-SA 4.0 (https://commons.wikimedia.org/wiki/File:Map_of_Russia_-_Khakassia.svg; accessed on 7 October 2021).
Forests 12 01765 g001
Figure 2. Intra-seasonal climate dynamics at two meteorological stations: daily series of precipitation, air temperature (minimum, maximum, and mean), and soil temperature at depths of 20, 40, 80, 160, and 320 cm averaged over the period with minimal missing data at both stations (1985–2000; see Figure S1 for cover periods of available climatic series).
Forests 12 01765 g002
Figure 3. Residual local tree-ring width chronologies (lines) and sample size (shaded; the number of cores for each calendar year) of Siberian larch at the TUIM, BID, and KAM tree-ring sites.
Forests 12 01765 g003
Figure 4. Correlations of Siberian larch local residual chronologies TUIM, BID, and KAM (left to right) with monthly variables at stations SHIRA (top panels) and MIN (bottom panels). The vertical axis is the monthly temporal scale, where asterisks (*) mark months of the previous year. The horizontal axis represents various climatic variables: T320…T20 are average soil temperatures at corresponding depths (cm); Tmin, Tmean, and Tmax are monthly averages of daily minimum, mean, and maximum air temperatures, respectively; and P is the sum of precipitation. The correlation coefficient is coded as a gradient of green (positive) to red (negative), which shades are presented in the key legend on the right. Correlations significant at p < 0.05 in accordance with the coverage periods of the climatic series (Figure S1) are highlighted in bold black font.
Forests 12 01765 g004
Figure 5. Cluster analysis results based on the K-means to classify individual trees within sampling sites according to the climatic response. Bars show means, and whiskers show standard deviations of dendroclimatic correlation coefficients for each cluster. Clusters are designated by Roman numerals I, II, III. Climatic factors are abbreviated as defined in Table 3. Shaded areas indicate significant (p < 0.05) differences in correlation between at least two clusters.
Forests 12 01765 g005
Table 1. Soil temperature: seasonal dynamics and cross-correlations with mean air temperature.
Depth, cmSeasonal Range,
°C *
Cross-Correlation of
Average Seasonal
Curves
Long-Term Daily Series,
Mean
Long-Term 21-Day Series,
Mean
Delay, DaysR **Delay, DaysRDelay, DaysR
MIN
2036.0 (−11.2–+24.8)50.99010.6820.72
4032.7 (−10.1–+22.7)100.98920.6340.75
8025.5 (−7.0–+18.5)220.98540.4690.64
16015.9 (−2.0–+13.9)450.979insignificant R210.40
3207.9 (+1.6–+9.6)810.985insignificant Rinsignificant R
SHIRA
2030.3 (−10.6–+19.7)90.99010.6730.69
4026.0 (−8.8–+17.1)160.98920.5750.66
8020.7 (−6.5–+14.2)280.98650.42100.58
16013.7(−3.0–+10.7)490.977insignificant R190.43
3205.5 (+0.8–+6.3)980.975insignificant Rinsignificant R
* Seasonal temperature range was calculated as the difference of maximum and minimum values on average seasonal curve computed for 1985–2000. ** R is the maximum cross-correlation coefficient between seasonal curves or long-term series of mean daily air temperature (Tmean) and soil temperature; presented values are significant at p < 0.05.
Table 2. Statistical characteristics of dendrochronological samples and local standardized (residual) tree-ring width chronologies of Siberian larch for three sampling sites.
StatisticsSampling Sites
TUIMBIDKAM
Sample
Number of trees *84 (35)68 (35)61 (43)
Cover period, years1719–20191704–20191710–2019
Average TRW, cm1.2651.2280.924
Residual chronology
Mean inter-series correlation0.4960.4690.451
Standard deviation0.3990.2830.357
Mean sensitivity coefficient0.4620.3300.380
* Numbers in brackets represent trees sampled in 2019.
Table 3. Maximum dendroclimatic correlations of Siberian larch local residual chronologies with climatic variables computed from daily data at station SHIRA for time intervals in the previous vegetative season (prev), the cold season (cold), and the current vegetative season (curr). P, precipitation; Tmean, mean daily air temperature; Tmin, minimal daily air temperature; Tmax, maximal daily air temperature; T20…T160, mean daily soil temperatures at respective depths in cm. The numerator is the time interval; the denominator is a correlation.
Climatic VariableTUIMBIDKAM
Previous vegetative season
Pprev21 Jul *–1 Oct */0.48 16 Jul *–1 Oct */0.47 19 Jul *–1 Oct */0.49
Tmean_prev22 Jul *–21 Sep */−0.35 9 Jul *–22 Sep */−0.33 1 Jul *–21 Sep */−0.49
Tmax_prev18 Jul *–21 Sep */−0.58 6 Jul *–22 Sep */−0.46 1 Jul *–22 Sep */−0.64
Cold season
Tmin_cold12 Nov *–5 Dec */0.34 12 Nov *–7 Dec */0.36 12 Nov *–7 Dec */0.47
Tmax_cold11 Nov *–8 Dec */0.42 12 Nov *–7 Dec */0.39 11 Nov *–8 Dec */0.52
Current vegetative season
Pcurr28 Mar–21 Jul/0.47 28 Mar–21 Jul/0.38 28 Mar–21 Jul/0.21
Tmin_curr22 Apr–10 Jun/−0.41 18 Apr–10 Jun/−0.2419 Apr–10 Jun/−0.29
Tmean_curr22 Apr–21 Jul/−0.42 11 Apr–22 Jul/−0.33 19 Apr–23 Jul/−0.45
Tmax_curr21 Apr–22 Jul/−0.45 17 Apr–23 Jul/−0.43 18 Apr–23 Jul/−0.47
T20_curr24 Apr–18 Jul/−0.47 21 Apr–17 Jul/−0.47 25 Apr–18 Jul/−0.58
T40_curr26 Apr–12 Aug/−0.51 23 Apr–13 Aug/−0.49 27 Apr–9 Aug/−0.59
T80_curr6 May–31 May/−0.50 25 Apr–1 Jun/−0.3127 Apr–1 Jun/−0.41
T160_curr1 Jun–4 Aug/−0.48 1 Jun–21 Jul/−0.35 1 Jun–21 Jul/−0.57
* Months of the previous year. Correlations significant at p < 0.05.
Table 4. Classification results: number of trees (N) and age structure * of clusters: full range of variation (min–max), mean value and standard deviation (mean ± SD) in years.
ClusterCharacteristicsTUIMBIDKAM
IN16142
min–max62–22041–11934–37
mean ± SD130 ± 47 a83 ± 27 a36 ± 2 a
IIN111125
min–max67–18642–247101–288
mean ± SD119 ± 36 a124 ± 63 ab186 ± 69 b
IIIN81016
min–max79–17451–31968–286
mean ± SD120 ± 36 a168 ± 89 b132 ± 51 c
* In this table, cambial age is presented, i.e., the number of tree rings in the core from pith to bark. The actual age of trees is greater than the cambial age due to sampling at approximately 1.3 m above ground level. Superscript letters mark the significance of age differences between clusters within each site: mean age values marked with the same letter are not significantly different at p < 0.05.
Publisher’s Note: MDPI stays neutral with regard to jurisdictional claims in published maps and institutional affiliations.

