
Modeling the Potential Distribution of Three Taxa of Akebia Decne. under Climate Change Scenarios in China


Abstract
:1. Introduction
2. Materials and Methods
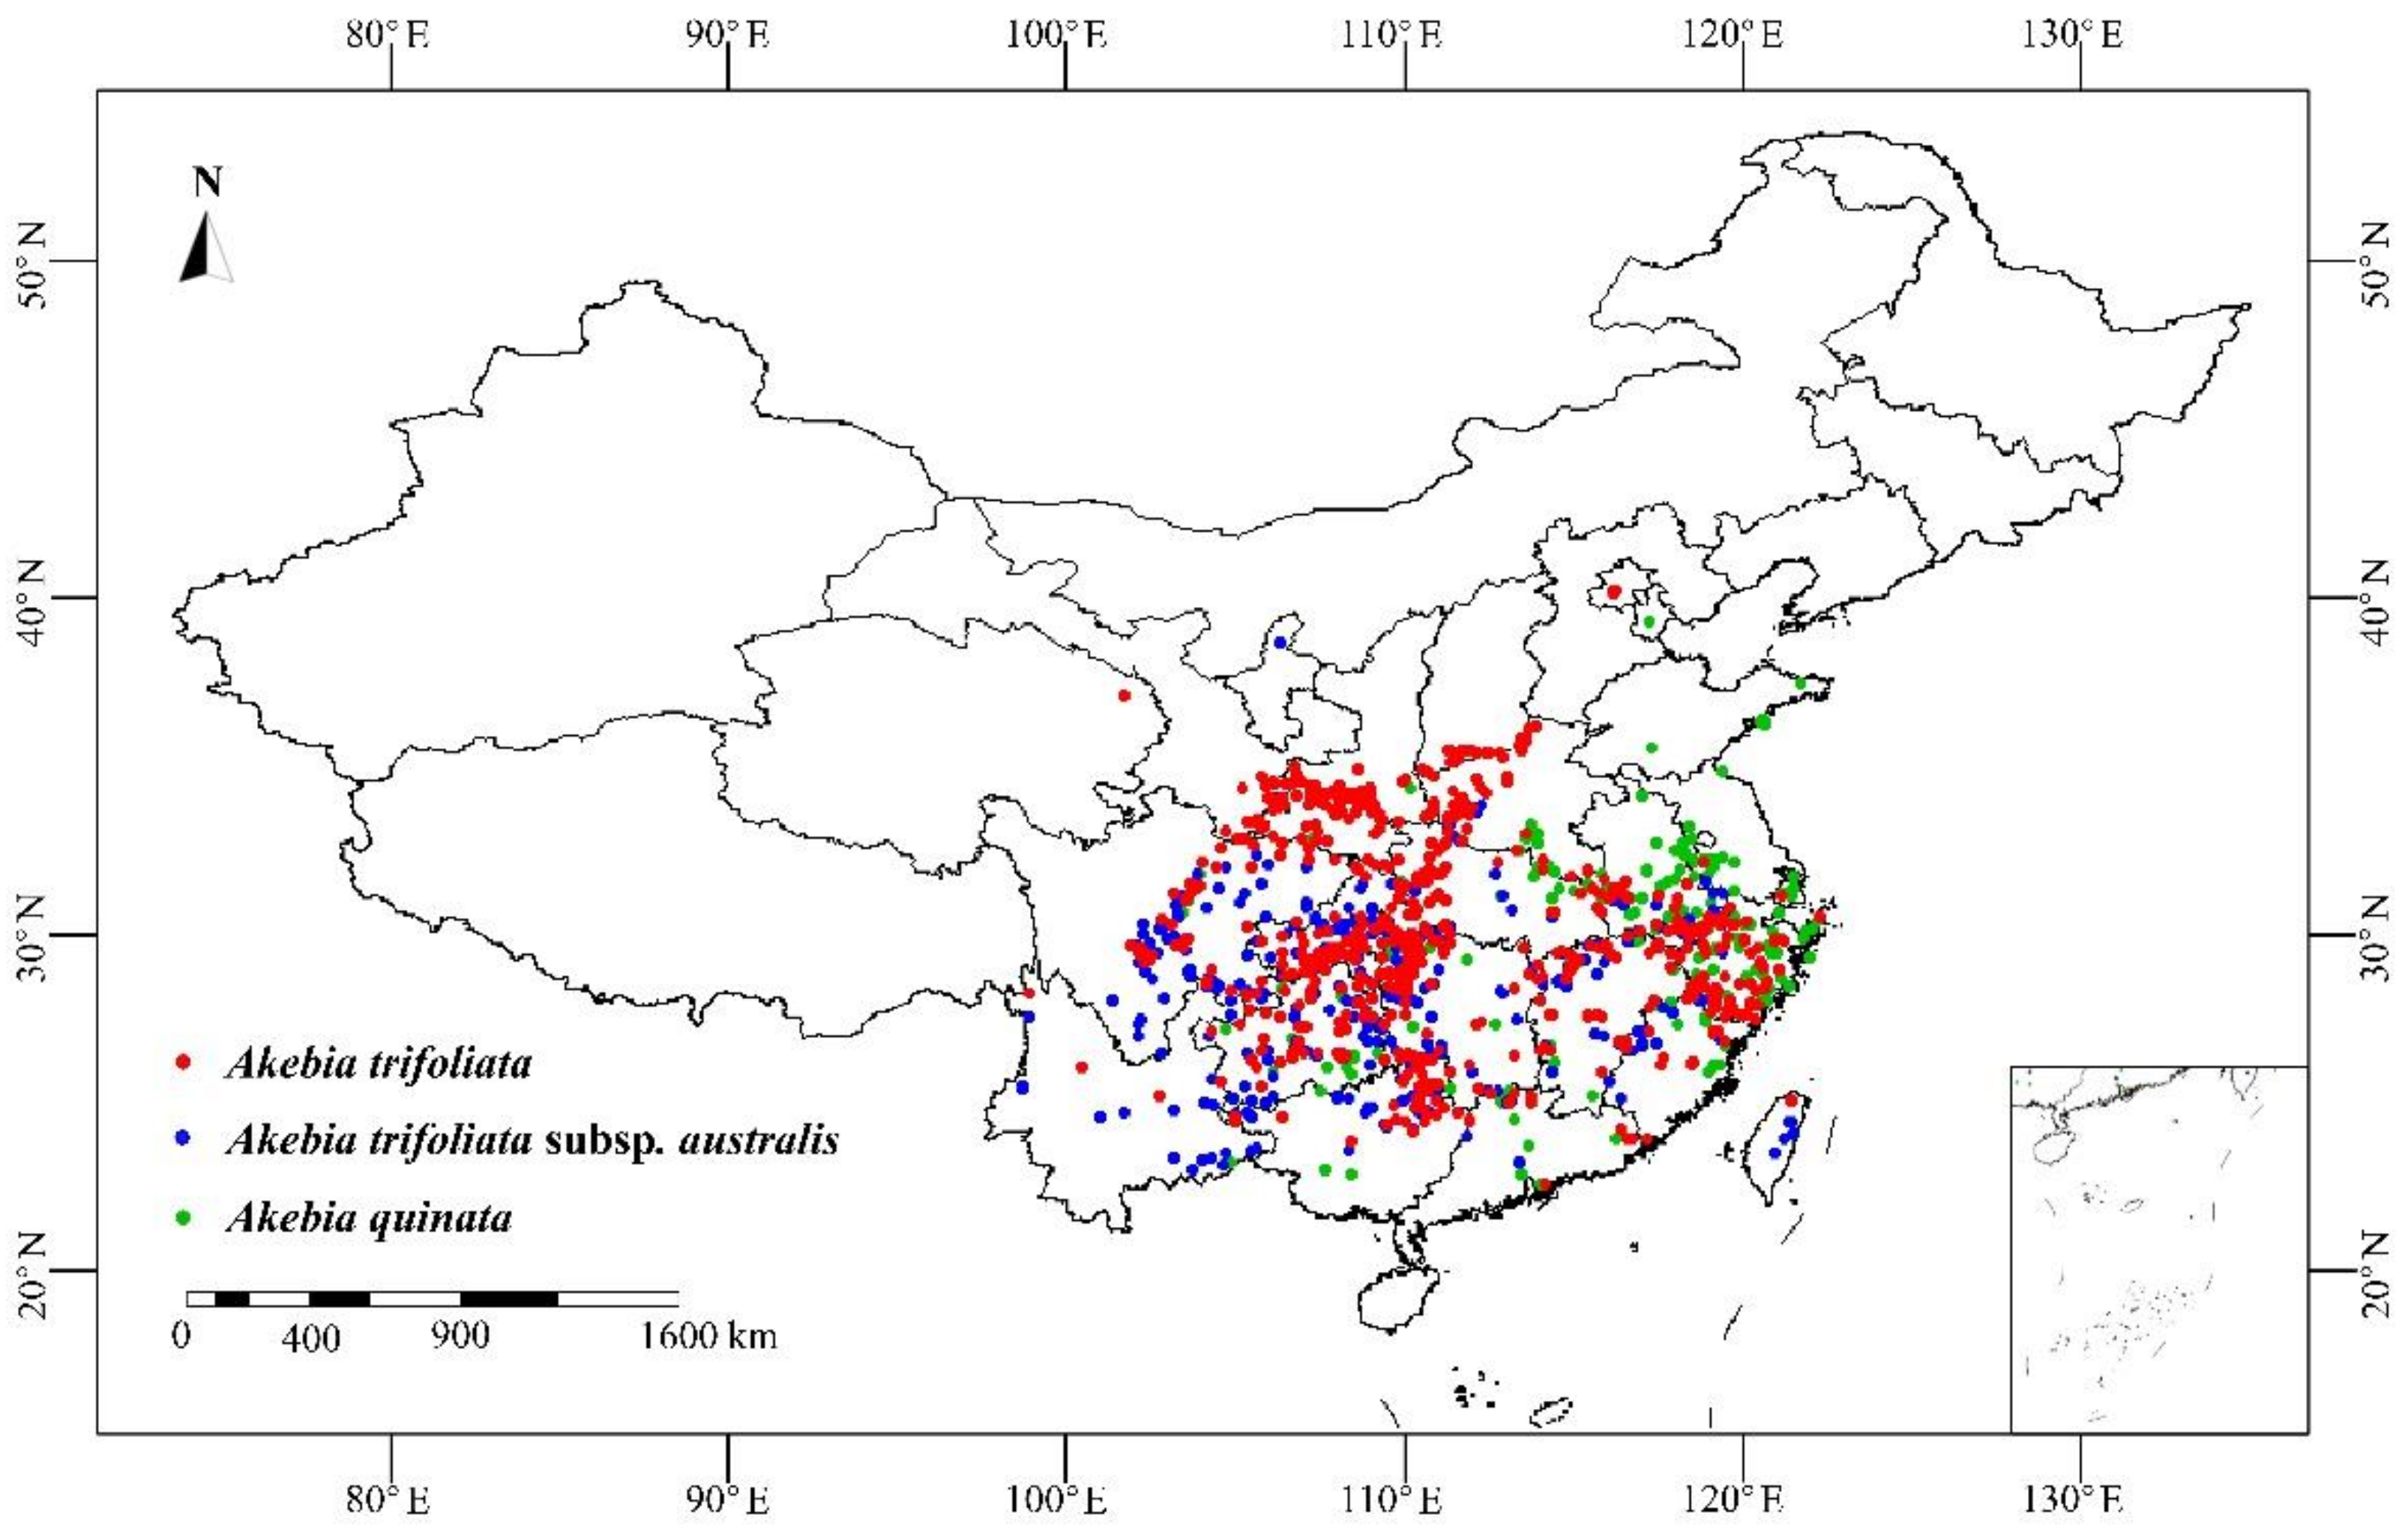
2.1. Species Occurrence Data
2.2. Bioclimatic Variables and Pattern of Scenarios
2.3. Optimization of Model Parameters
2.4. Classification of Suitable Area
3. Results
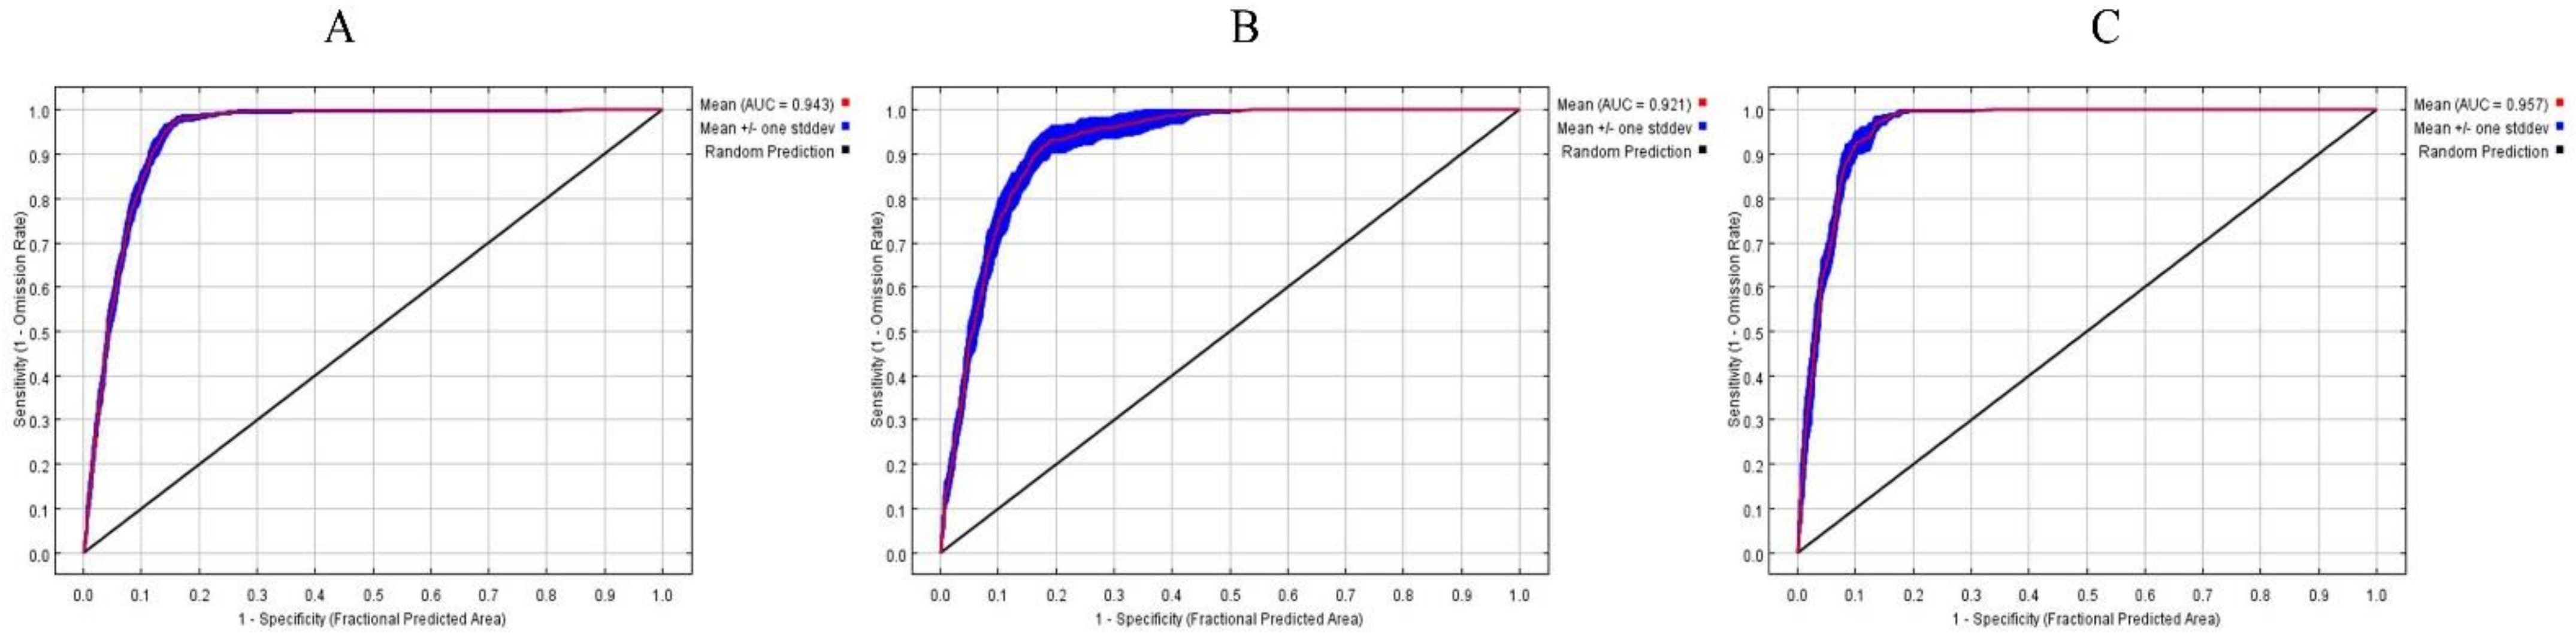
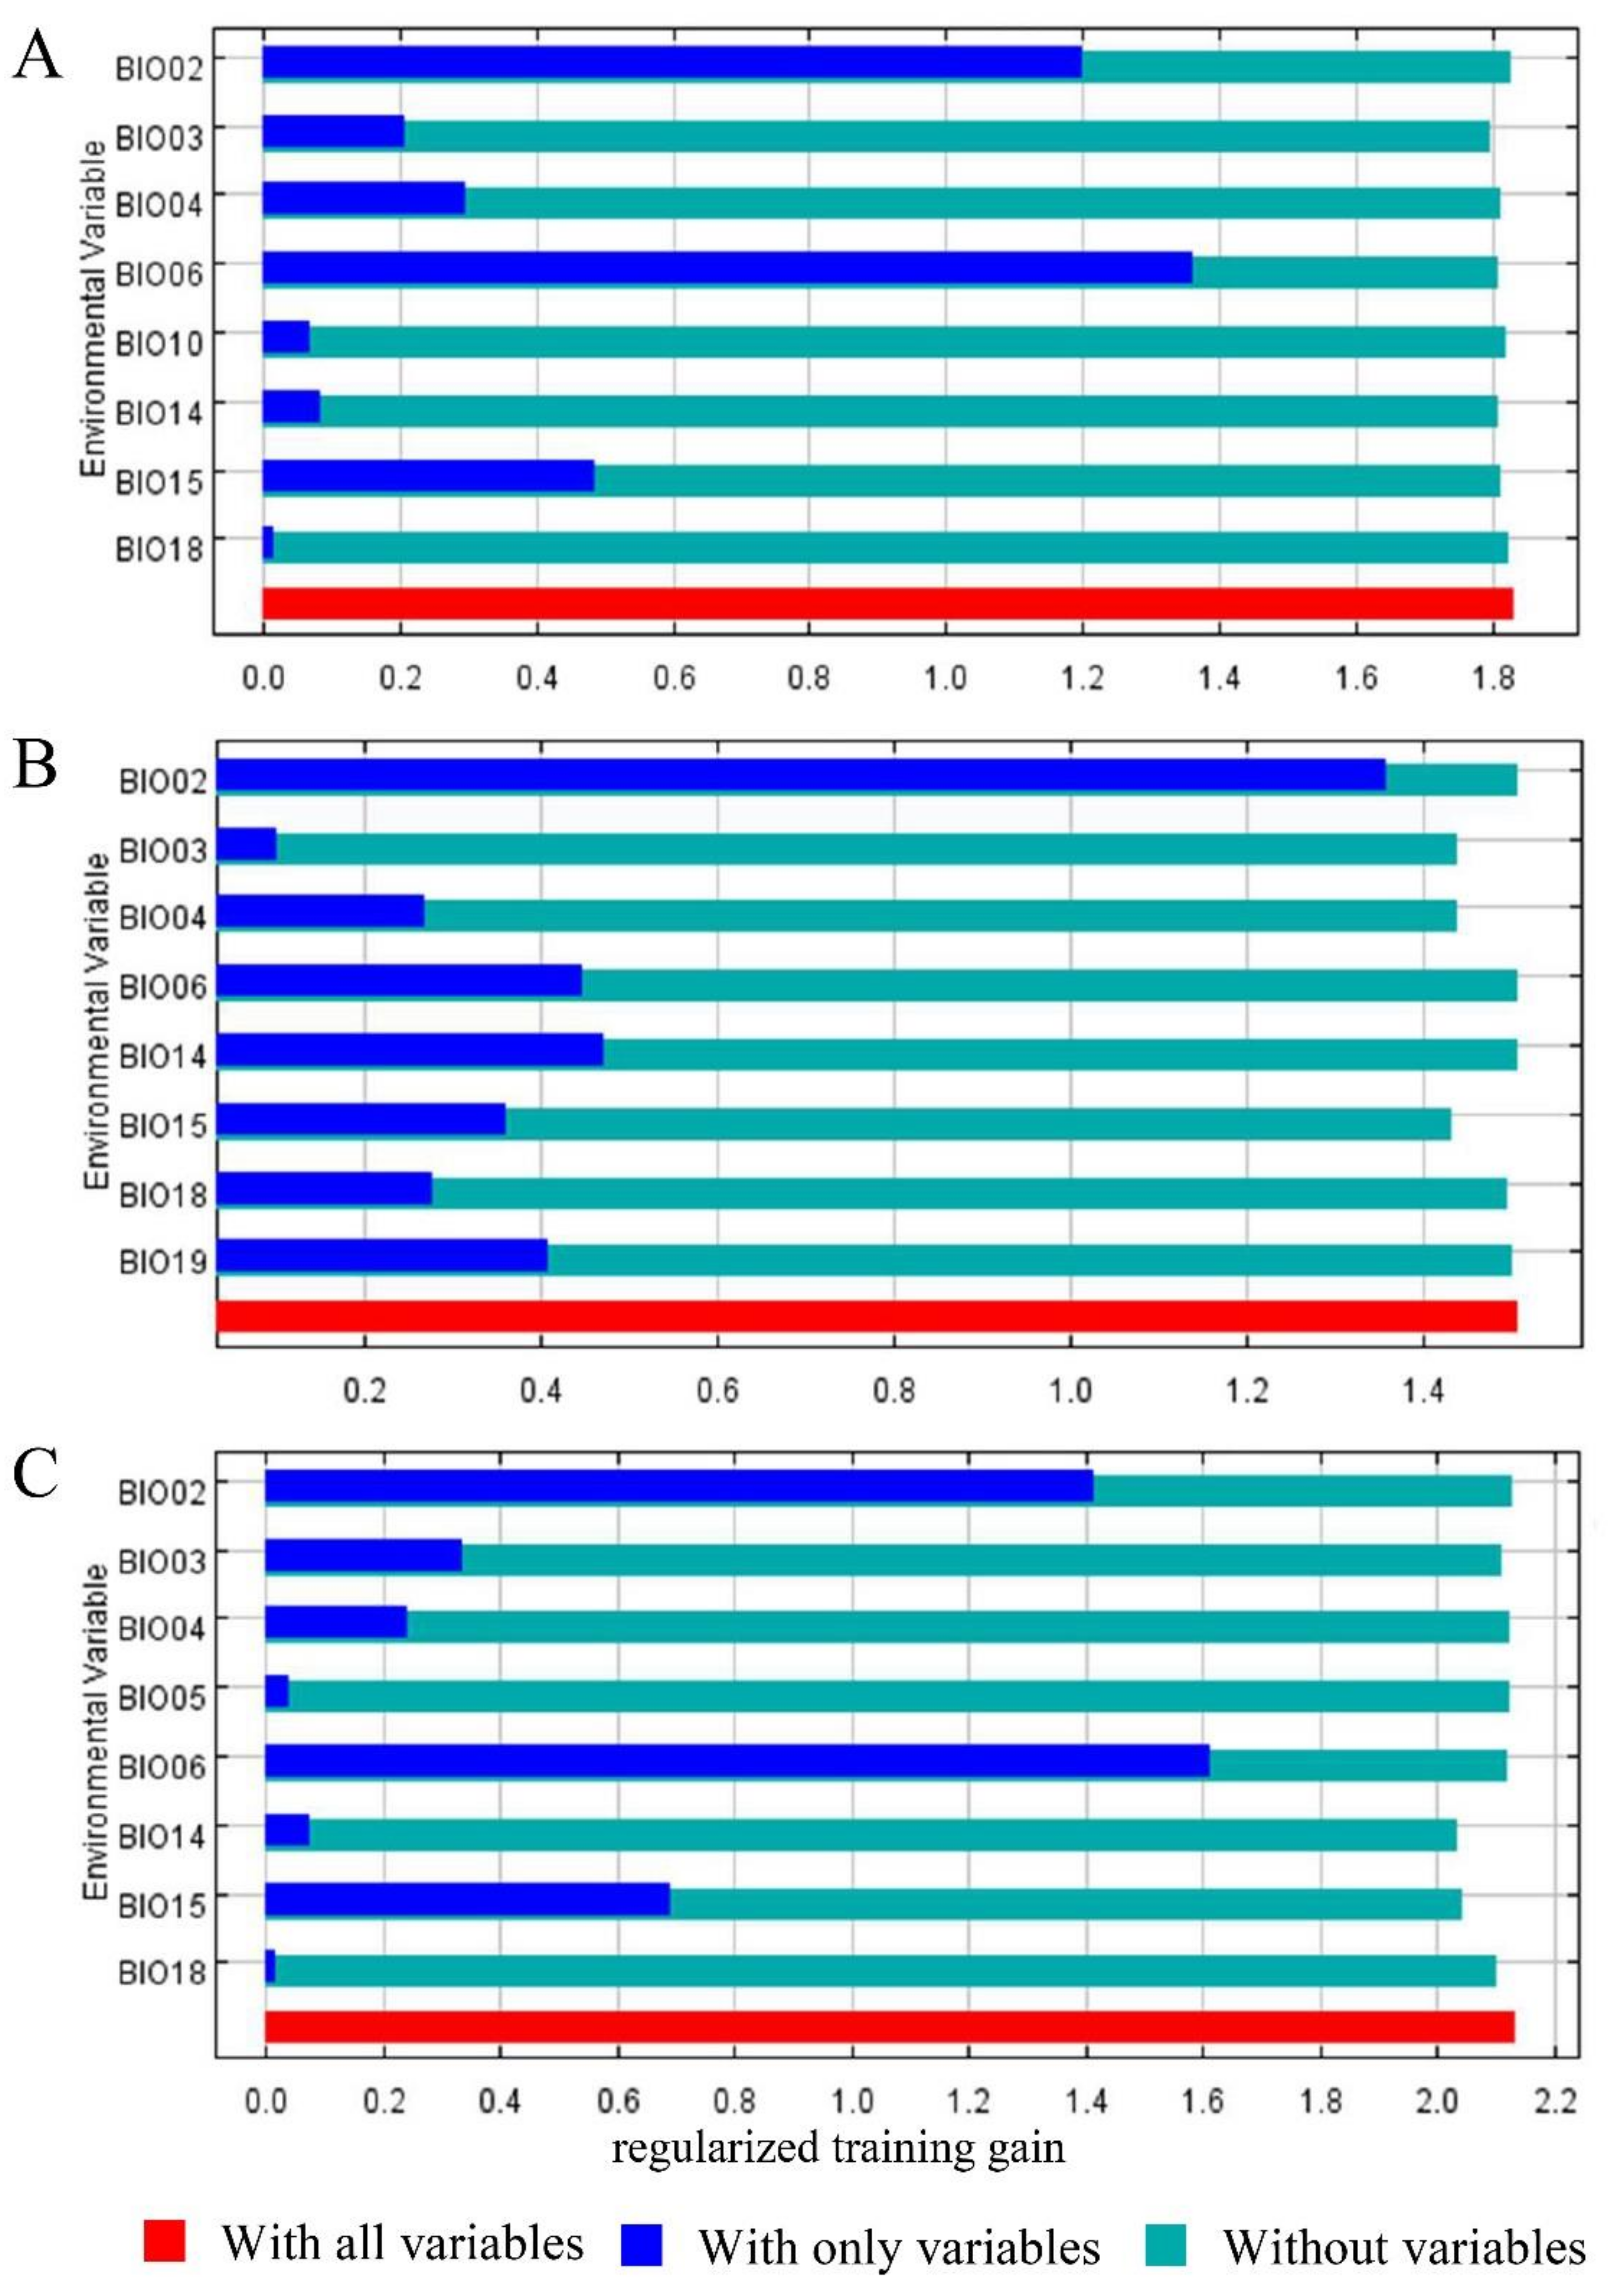
3.1. Contribution of Bioclimatic Variables and Model Accuracy
3.2. The Current Potential Distributions of the Three Akebia Taxa
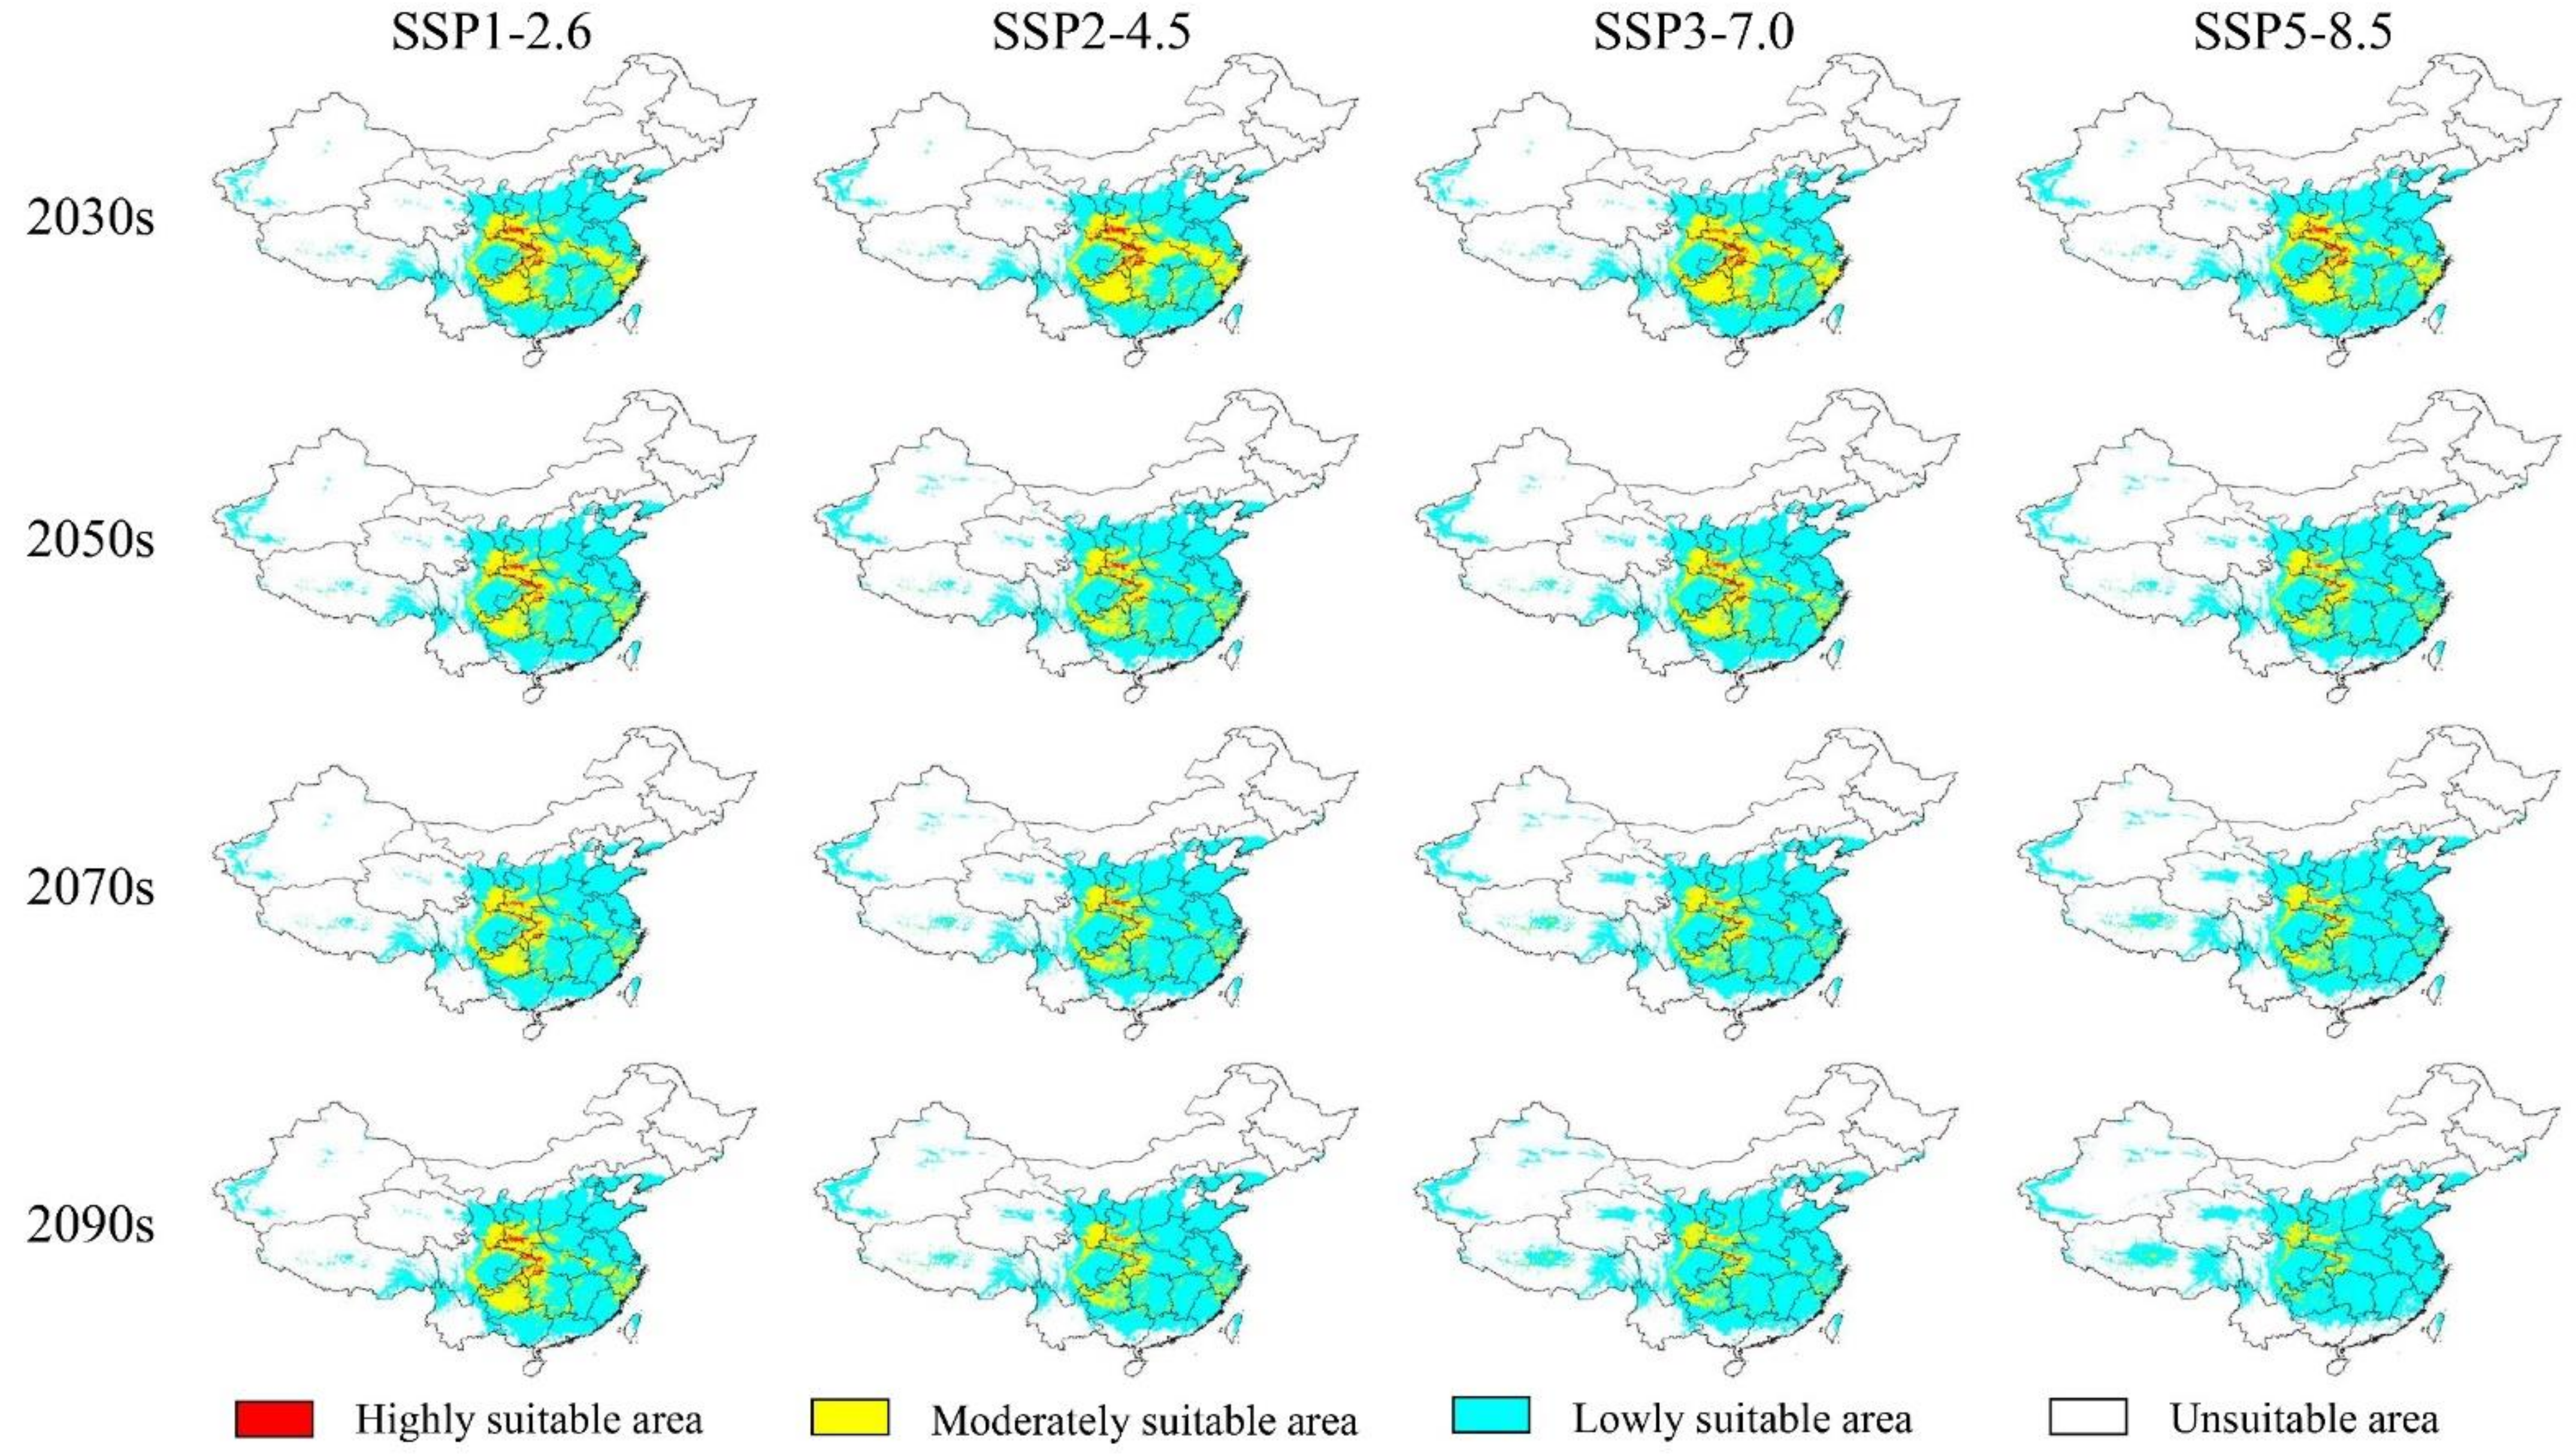
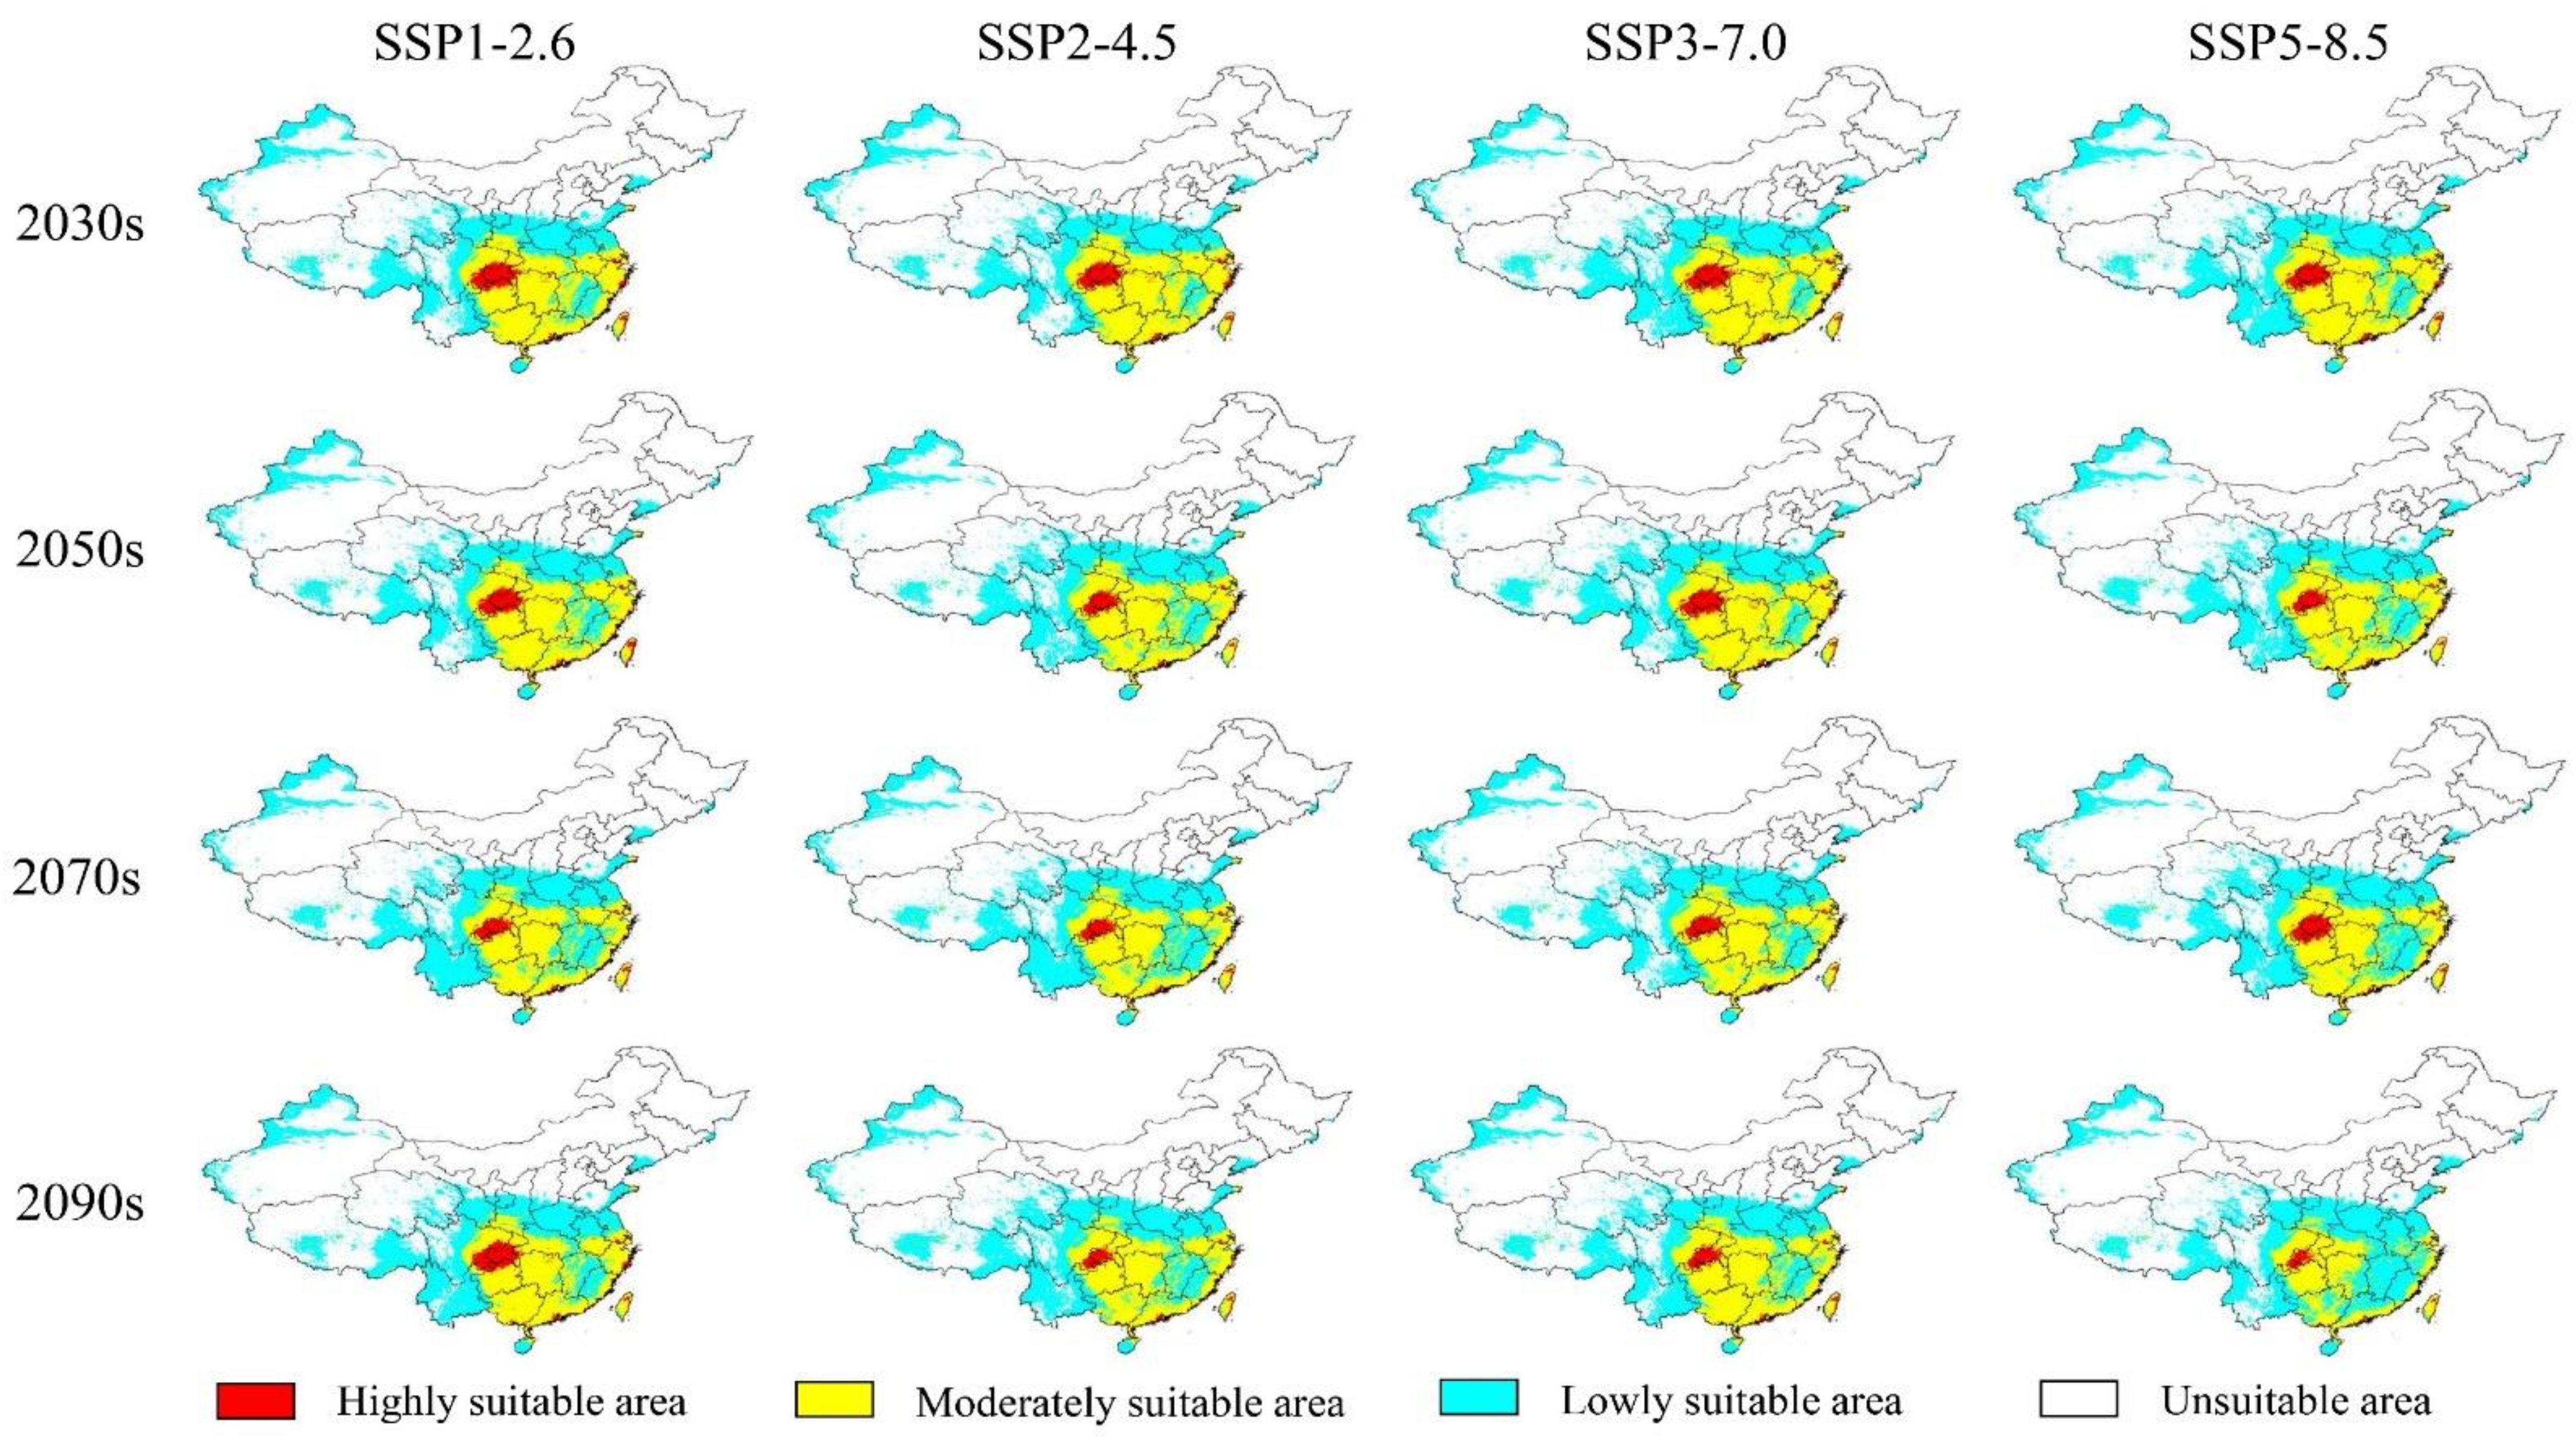
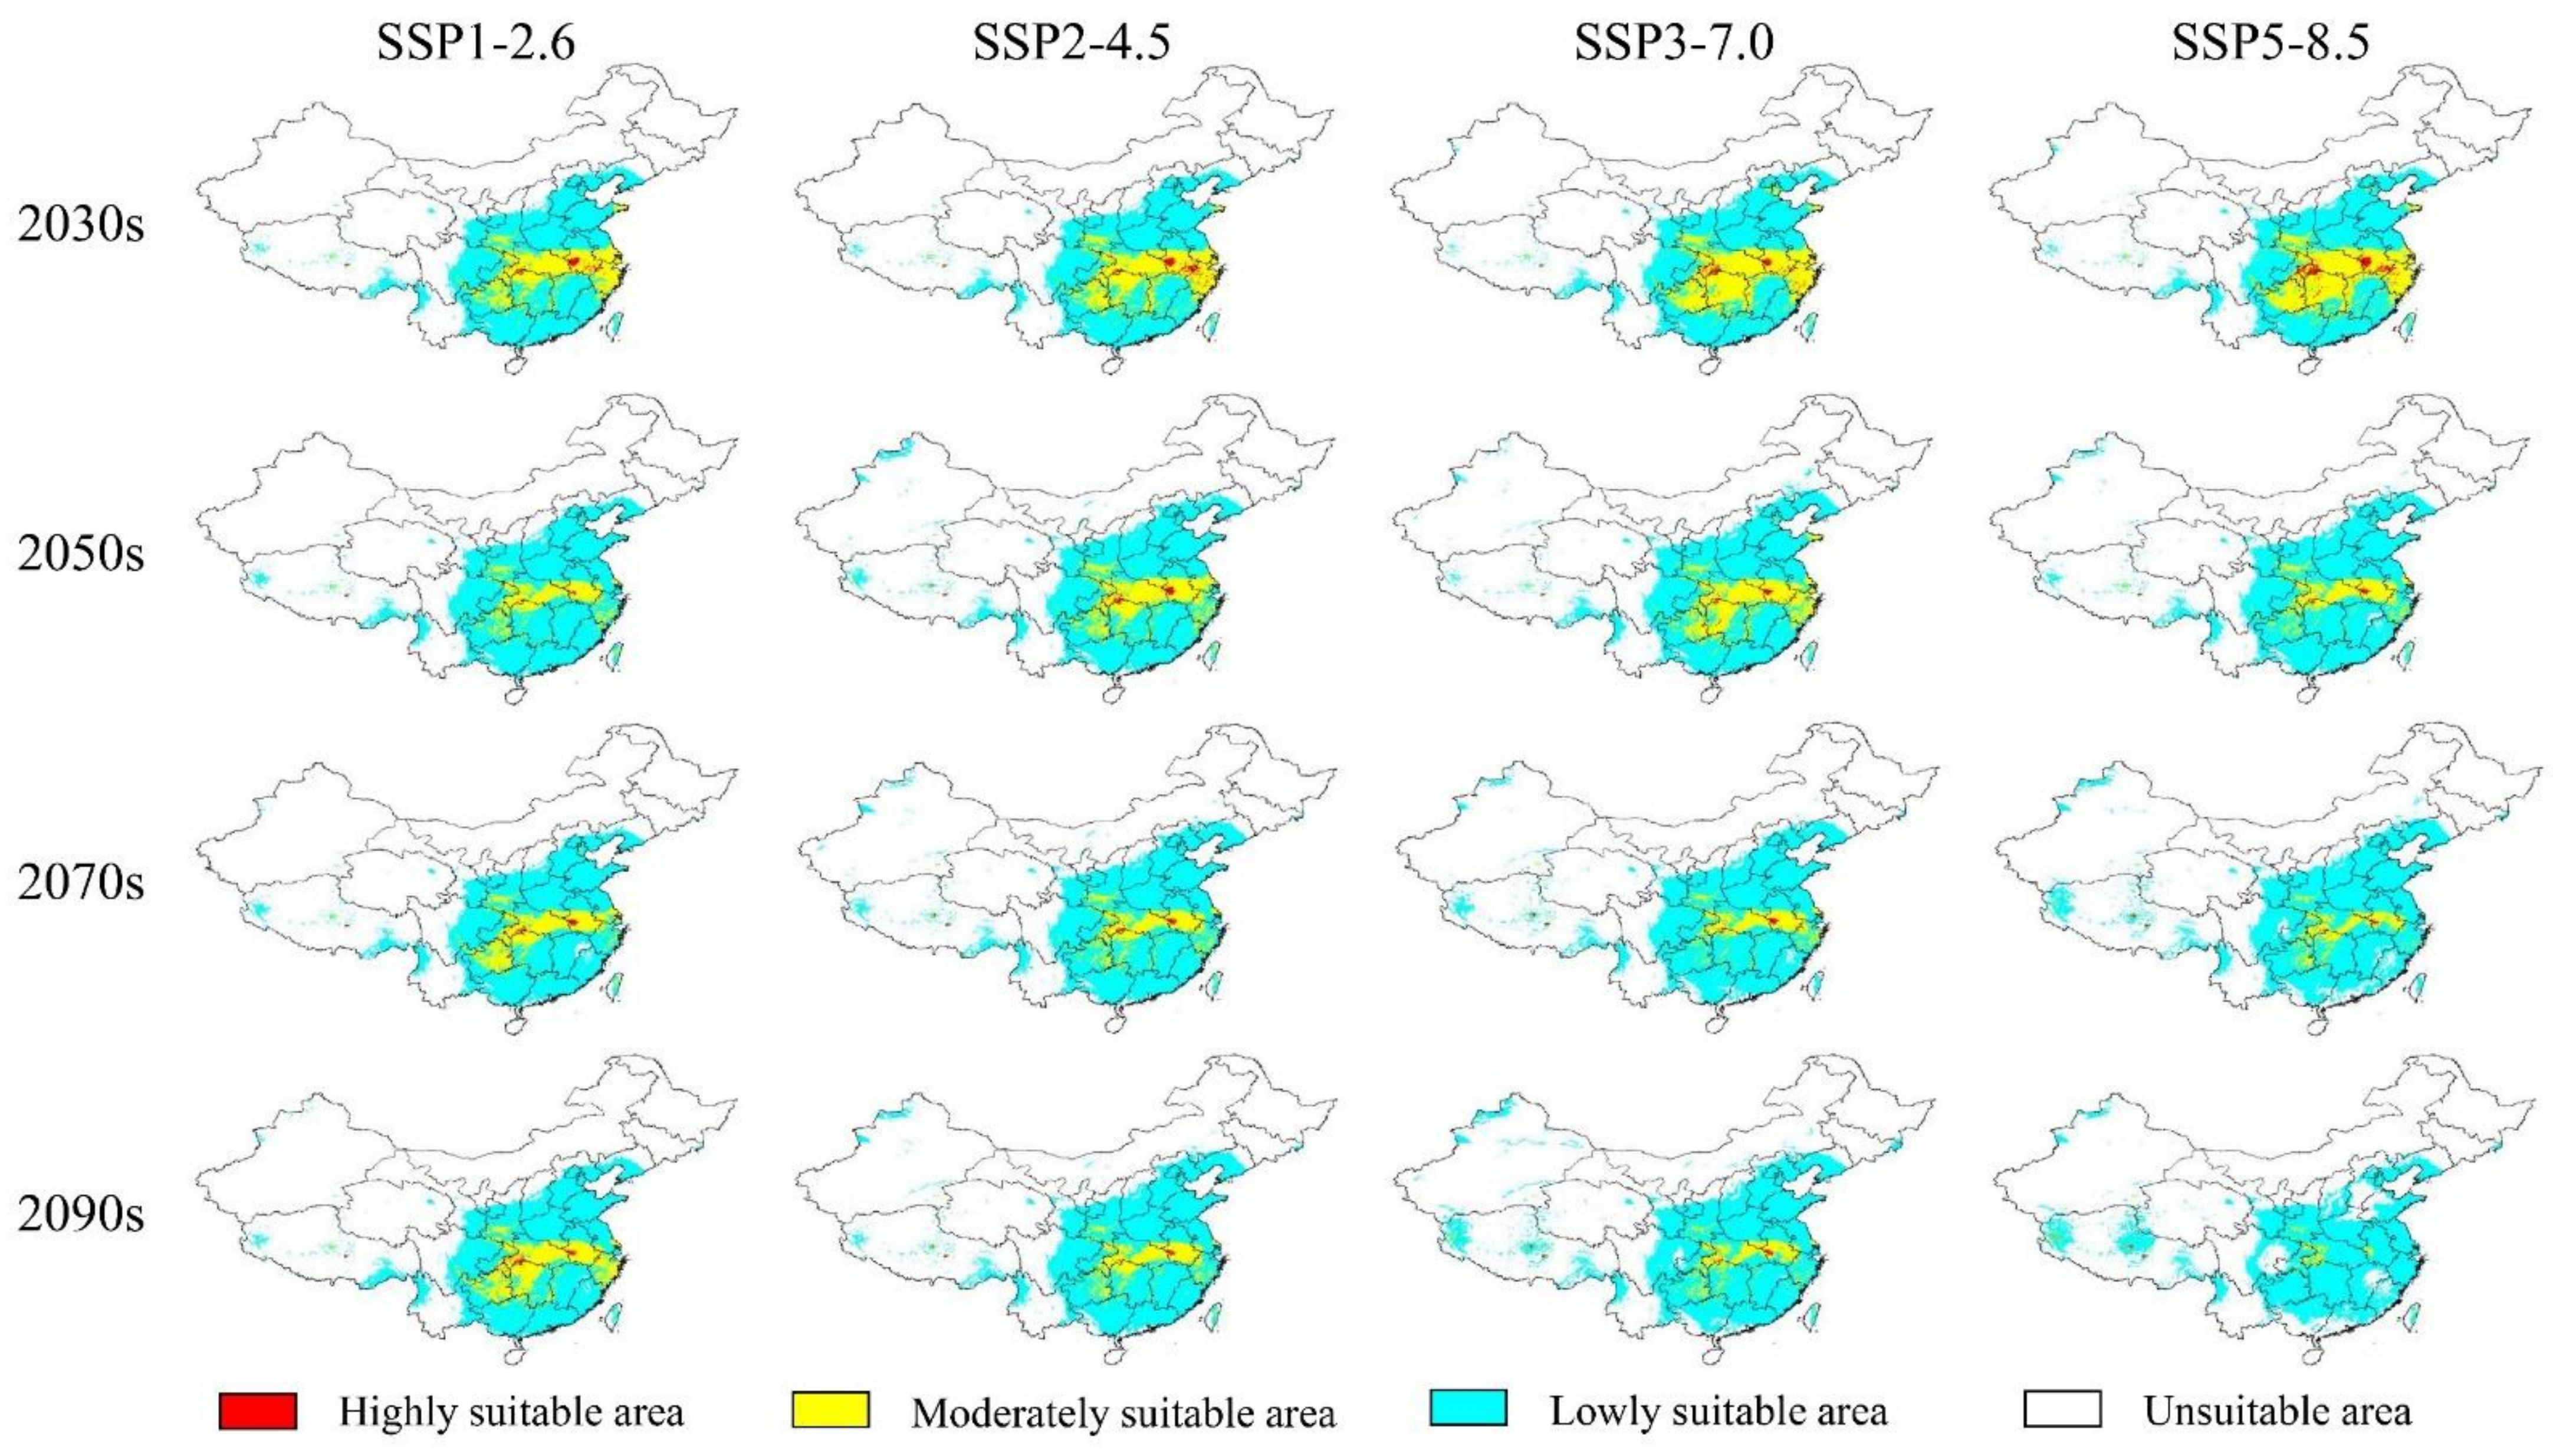
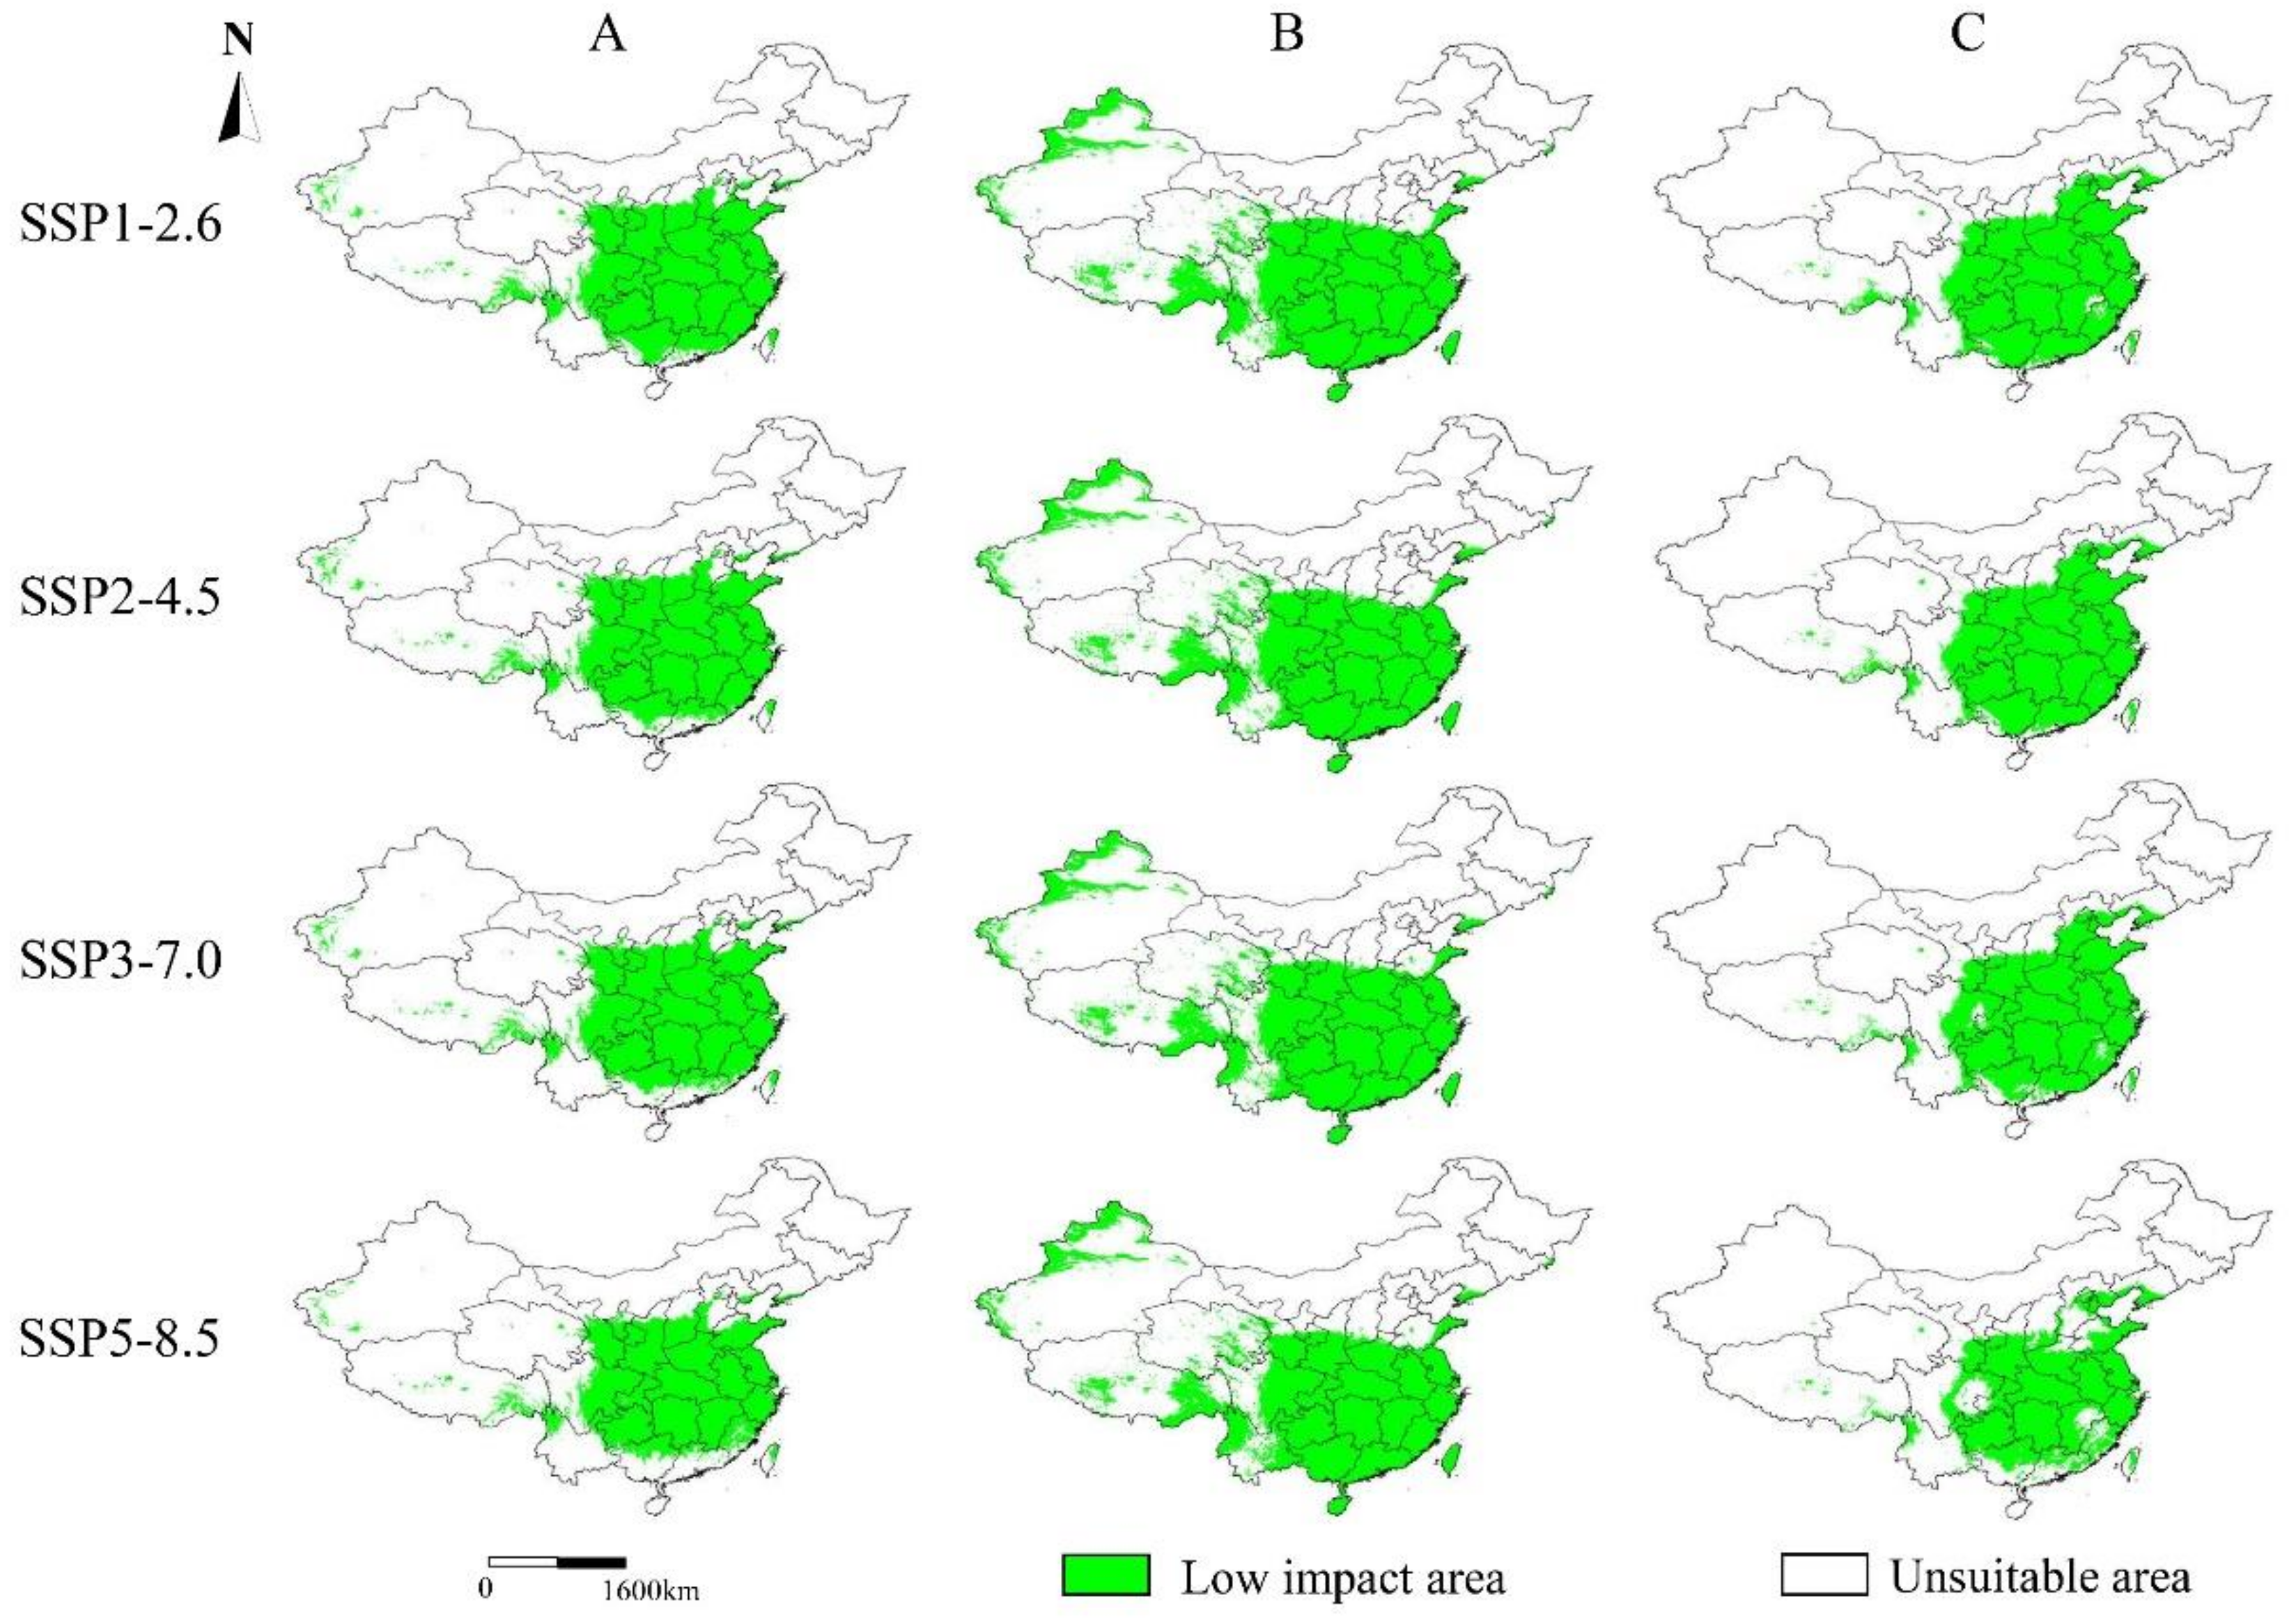
3.3. The Potential Future Distributions of the Three Akebia Taxa
4. Discussion
4.1. Optimization of MAXENT Model
4.2. Distribution of the Current Suitable Areas of the Three Akebia Taxa
4.3. Changes on the Future Suitable Areas of the Three Akebia Taxa and Their Implications
5. Conclusions
Author Contributions
Funding
Data Availability Statement
Conflicts of Interest
References
- IPCC. Summary for Policymakers. In Climate Change 2021: The Physical Science Basis. Contribution of Working Group I to the Sixth Assessment Report of the Intergovernmental Panel on Climate Change; Intergovernmental Panel on Climate Change: Cambridge, UK; New York, NY, USA, 2021. [Google Scholar]
- Parmesan, C.; Yohe, G. A globally coherent fingerprint of climate change impacts across natural systems. Nat. Cell Biol. 2003, 421, 37–42. [Google Scholar] [CrossRef] [PubMed]
- Grimm, N.B.; Faeth, S.H.; Golubiewski, N.E.; Redman, C.L.; Wu, J.; Bai, X.; Briggs, J.M. Global Change and the Ecology of Cities. Science 2008, 319, 756–760. [Google Scholar] [CrossRef] [Green Version]
- Urban, M.C. Accelerating extinction risk from climate change. Science 2015, 348, 571–573. [Google Scholar] [CrossRef] [PubMed] [Green Version]
- Ying, Z. Projections of 2 °C warming over the globe and China under RCP4.5. Atmos. Ocean. Sci. Lett. 2012, 5, 514–520. [Google Scholar] [CrossRef]
- Zhao, D.S.; Gao, X.; Wu, S.G.; Zheng, D. Trend of climate variation in China from 1960 to 2018 based on natural regionalization. Adv. Earth Sci. 2020, 35, 750–760. [Google Scholar]
- Barnosky, A.D.; Matzke, N.; Tomiya, S.; Wogan, G.O.U.; Swartz, B.; Quental, T.B.; Marshall, C.; McGuire, J.L.; Lindsey, E.L.; Maguire, K.C.; et al. Has the Earth’s sixth mass extinction already arrived? Nature 2011, 471, 51–57. [Google Scholar] [CrossRef] [PubMed]
- Jin, K.; Wang, F.; Li, P. Responses of Vegetation Cover to Environmental Change in Large Cities of China. Sustainability 2018, 10, 270. [Google Scholar] [CrossRef] [Green Version]
- Piao, S.; Yin, G.; Tan, J.; Cheng, L.; Huang, M.; Li, Y.; Liu, R.; Mao, J.; Myneni, R.B.; Peng, S.; et al. Detection and attribution of vegetation greening trend in China over the last 30 years. Glob. Chang. Biol. 2015, 21, 1601–1609. [Google Scholar] [CrossRef]
- Jiang, M.; Tian, S.; Zheng, Z.; Zhan, Q.; He, Y. Human Activity Influences on Vegetation Cover Changes in Beijing, China, from 2000 to 2015. Remote Sens. 2017, 9, 271. [Google Scholar] [CrossRef] [Green Version]
- Pan, Y.; Birdsey, R.A.; Fang, J.; Houghton, R.; Kauppi, P.E.; Kurz, W.A.; Phillips, O.L.; Shvidenko, A.; Lewis, S.L.; Canadell, J.G.; et al. A Large and Persistent Carbon Sink in the World’s Forests. Science 2011, 333, 6045. [Google Scholar] [CrossRef] [Green Version]
- Oliver, T.; Hill, J.K.; Thomas, C.D.; Brereton, T.; Roy, D.B. Changes in habitat specificity of species at their climatic range boundaries. Ecol. Lett. 2009, 12, 1091–1102. [Google Scholar] [CrossRef]
- Weng, Y.W.; Cai, W.J.; Wang, C. The application and future directions of the Shared Socioeconomic Pathways (SSPs). Adv. Clim. Chang. Res. 2020, 16, 215–222. [Google Scholar]
- DeMarche, M.L.; Doak, D.F.; Morris, W.F. Incorporating local adaptation into forecasts of species’ distribution and abundance under climate change. Glob. Chang. Biol. 2019, 25, 775–793. [Google Scholar] [CrossRef] [PubMed]
- Coro, G.; Vilas, L.G.; Magliozzi, C.; Ellenbroek, A.; Scarponi, P.; Pagano, P. Forecasting the ongoing invasion of Lagocephalus sceleratus in the Mediterranean Sea. Ecol. Model. 2018, 371, 37–49. [Google Scholar] [CrossRef]
- Elith, J.; Phillips, S.J.; Hastie, T.; Dudík, M.; Chee, Y.E.; Yates, C.J. A statistical explanation of MaxEnt for ecologists. Divers. Distrib. 2011, 17, 43–57. [Google Scholar] [CrossRef]
- Hirzel, A.H.; Hausser, J.; Chessel, D.; Perrin, N. Ecological-Niche Factor Analysis: How to Compute Habitat-Suitability Maps without Absence Data? Ecology 2002, 83, 2027–2036. [Google Scholar] [CrossRef]
- Beaumont, L.J.; Hughes, L.; Poulsen, M. Predicting species distributions: Use of climatic parameters in BIOCLIM and its im-pact on predictions of species’ current and future distributions. Ecol. Model. 2005, 186, 251–270. [Google Scholar] [CrossRef]
- Sánchez, F.E. GARP modeling of natural and human factors affecting the potential distribution of the invasives Schismus ara-bicus and Brassica tournefortii, in ‘El Pinacate y Gran Desierto de Altar’ Biosphere Reserve. Ecol. Model. 2007, 204, 457–474. [Google Scholar] [CrossRef]
- Phillips, S.J.; Anderson, R.P.; Schapire, R.E. Maximum entropy modeling of species geographic distributions. Ecol. Model. 2006, 190, 231–259. [Google Scholar] [CrossRef] [Green Version]
- Lawler, J.J.; White, D.; Neilson, R.P.; Blaustein, A.R. Predicting climate-induced range shifts: Model differences and model reliability. Glob. Chang. Biol. 2006, 12, 1568–1584. [Google Scholar] [CrossRef] [Green Version]
- Li, Y.; Li, M.; Li, C.; Liu, Z. Optimized Maxent Model Predictions of Climate Change Impacts on the Suitable Distribution of Cunninghamia lanceolata in China. Forests 2020, 11, 302. [Google Scholar] [CrossRef] [Green Version]
- Dyderski, M.K.; Paź, S.; Frelich, L.E.; Jagodziński, A.M. How much does climate change threaten European forest tree species distributions? Glob. Chang. Biol. 2018, 24, 1150–1163. [Google Scholar] [CrossRef] [PubMed]
- Elith, J.; Graham, C.H.; Anderson, R.P.; Dudík, M.; Ferrier, S.; Guisan, A.; Hijmans, R.J.; Huettmann, F.; Leathwick, J.R.; Lehmann, A.; et al. Novel methods improve prediction of species’ distributions from occurrence data. Ecography 2006, 29, 129–151. [Google Scholar] [CrossRef] [Green Version]
- Farashi, A.; Alizadeh-Noughani, M. Effects of models and spatial resolutions on the species distribution model performance. Model. Earth Syst. Environ. 2018, 4, 263–268. [Google Scholar] [CrossRef]
- Rong, Z.; Zhao, C.; Liu, J.; Gao, Y.; Zang, F.; Guo, Z.; Mao, Y.; Wang, L. Modeling the effect of climate change on the poten-tial distribution of Qinghai spruce (Picea crassifolia Kom.) in Qilian Mountains. Forests 2019, 10, 62. [Google Scholar] [CrossRef] [Green Version]
- Puchałka, R.; Dyderski, M.K.; Vítková, M.; Sádlo, J.; Klisz, M.; Netsvetov, M.; Prokopuk, Y.; Matisons, R.; Mionskowski, M.; Wojda, T.; et al. Black locust (Robinia pseudoacacia L.) range contraction and expansion in Europe under changing climate. Glob. Chang. Biol. 2021, 27, 1587–1600. [Google Scholar] [CrossRef]
- Zhao, R.; Chu, X.; He, Q.; Tang, Y.; Song, M.; Zhu, Z. Modeling Current and Future Potential Geographical Distribution of Carpinus tientaiensis, a Critically Endangered Species from China. Forests 2020, 11, 774. [Google Scholar] [CrossRef]
- Santos-Hernández, A.F.; Monterroso-Rivas, A.I.; Granados-Sánchez, D.; Villanueva-Morales, A.; Santacruz-Carrillo, M. Pro-jections for Mexico’s tropical rainforests considering ecological niche and climate change. Forests 2021, 12, 119. [Google Scholar] [CrossRef]
- Editorial Commission of Chinese Flora of Chinese Academy of Sciences. Flora of China; Science Press: Beijing, China, 2001; Volume 29, pp. 4–5. [Google Scholar]
- Chinese Pharmacopoeia Commission. Pharmacopoeia of the People’s Republic of China; China Medical Science Press: Beijing, China, 2020. [Google Scholar]
- Liu, Y.; Hou, X.; Xie, Y.; Feng, Y.; Ou, Y.; Yang, S. Overview of research on chemical constituents and pharmacological activ-ities of Akebia Dence. J. Jiangxi Univ. Trad. Chin. Med. 2012, 24, 87–93. [Google Scholar]
- An, J.-P.; Ha, T.K.Q.; Kim, J.; Cho, T.O.; Oh, W.K. Protein tyrosine phosphatase 1B inhibitors from the stems of Akebia quinata. Molecules 2016, 21, 1091. [Google Scholar] [CrossRef]
- Peng, P.; Jia, D.; Cao, L.; Lu, W.; Liu, X.; Liang, C.; Pan, Z.; Fang, Z. Akebia saponin E, as a novel PIKfyve inhibitor, induces lysosome-associated cytoplasmic vacuolation to inhibit proliferation of hepatocellular carcinoma cells. J. Ethnopharmacol. 2021, 266, 113446. [Google Scholar] [CrossRef]
- Lu, W.-L.; Yang, T.; Song, Q.-J.; Fang, Z.-Q.; Pan, Z.-Q.; Liang, C.; Jia, D.-W.; Peng, P.-K. Akebia trifoliata (Thunb.) Koidz Seed Extract inhibits human hepatocellular carcinoma cell migration and invasion in vitro. J. Ethnopharmacol. 2019, 234, 204–215. [Google Scholar] [CrossRef]
- Li, L.; Chen, X.-Z.; Yao, X.-H.; Tian, H.; Huang, H.-W. Geographic Distribution and Resource Status ofThree Important Akebia Species. Plant Sci. J. 2010, 30, 497–506. [Google Scholar] [CrossRef]
- Phillips, S.J.; Dudík, M.; Elith, J.; Graham, C.H.; Lehmann, A.; Leathwick, J.; Ferrier, S. Sample selection bias and pres-ence-only distribution models: Implications for background and pseudo-absence data. Ecol. Appl. 2009, 19, 181–197. [Google Scholar] [CrossRef] [Green Version]
- Warren, D.L.; Glor, R.; Turelli, M. ENMTools: A toolbox for comparative studies of environmental niche models. Ecography 2010, 33, 607–611. [Google Scholar] [CrossRef]
- Fick, S.E.; Hijmans, R.J. WorldClim 2: New 1-km spatial resolution climate surfaces for global land areas. Int. J. Climatol. 2017, 37, 4302–4315. [Google Scholar] [CrossRef]
- Sillero, N. What does ecological modelling model? A proposed classification of ecological niche models based on their under-lying methods. Ecol. Model. 2011, 222, 1343–1346. [Google Scholar]
- Su, B.; Huang, J.; Mondal, S.K.; Zhai, J.; Wang, Y.; Wen, S.; Gao, M.; Lv, Y.; Jiang, S.; Jiang, T.; et al. Insight from CMIP6 SSP-RCP scenarios for future drought characteristics in China. Atmos. Res. 2021, 250, 105375. [Google Scholar] [CrossRef]
- Editorial. The CMIP6 landscape. Nat. Clim. Chang. 2019, 9, 727.
- Wei, J.; Li, X.; Lu, Y.; Zhao, L.; Zhang, H.; Zhao, Q. Modeling the Potential Global Distribution of Phenacoccus madeirensis Green under Various Climate Change Scenarios. Forests 2019, 10, 773. [Google Scholar] [CrossRef] [Green Version]
- Guisan, A.; Graham, C.H.; Elith, J.; Huettmann, F.; the NCEAS Species Distribution Modelling Group. Sensitivity of predic-tive species distribution models to change in grain size. Divers. Distrib. 2007, 13, 332–340. [Google Scholar] [CrossRef]
- Morales, N.S.; Fernández, I.C.; Baca-González, V. MaxEnt’s parameter configuration and small samples: Are we paying at-tention to recommendations? A systematic review. PeerJ 2017, 5, e3093. [Google Scholar]
- Cobos, M.E.; Townsend Peterson, A.; Barve, N.; Osorio-Olvera, L. Kuenm: An R package for detailed development of ecological niche models using Maxent. PeerJ 2019, 7, e6281. [Google Scholar] [CrossRef] [PubMed] [Green Version]
- Angelieri, C.C.; Adams-Hosking, C.; Ferraz, K.M.; de Souza, M.P.; McAlpine, C.A. Using species distribution models to pre-dict potential landscape restoration effects on Puma conservation. PLoS ONE 2016, 11, e0145232. [Google Scholar] [CrossRef]
- Swets, J.A. Measuring the accuracy of diagnostic systems. Science 1988, 240, 1285–1293. [Google Scholar] [CrossRef] [PubMed] [Green Version]
- Peterson, A.T.; Papeş, M.; Soberon, J. Rethinking receiver operating characteristic analysis applications in ecological niche modeling. Ecol. Model. 2008, 213, 63–72. [Google Scholar] [CrossRef]
- Osorio-Olvera, L.; Lira-Noriega, A.; Soberón, J.; Townsend Peterson, A.; Falconi, M.; Contreras-Díaz, R.G.; Martínez-Meyer, E.; Barve, V.; Barve, N. ntbox: An r package with graphical user interface for modelling and evaluating multidimensional ecological niches. Methods Ecol. Evol. 2020, 11, 1199–1206. [Google Scholar] [CrossRef]
- Fuentes, M.M.P.B.; Allstadt, A.J.; Ceriani, S.A.; Godfrey, M.H.; Gredzens, C.; Helmers, D.; Ingram, D.; Pate, M.; Radeloff, V.C.; Shaver, D.J.; et al. Potential adaptability of marine turtles to climate change may be hindered by coastal development in the USA. Reg. Environ. Chang. 2020, 20, 104. [Google Scholar] [CrossRef]
- Warren, D.L.; Seifert, S.N. Ecological niche modeling in MaxEnt: The importance of model complexity and the performance of model selection criteria. Ecol. Appl. 2011, 21, 335–342. [Google Scholar] [CrossRef] [Green Version]
- Kong, W.; Li, X.; Zou, H. Optimizing MaxEnt model in the prediction of species distribution. Chin. J. Appl. Ecol. 2019, 30, 2116–2128. [Google Scholar]
- Hernandez, P.A.; Graham, C.H.; Master, L.L.; Albert, D.L. The effect of sample size and species characteristics on performance of different species distribution modeling methods. Ecography 2006, 29, 773–785. [Google Scholar] [CrossRef]
- Hirzel, A.; Guisan, A. Which is the optimal sampling strategy for habitat suitability modelling. Ecol. Model. 2002, 157, 331–341. [Google Scholar] [CrossRef]
- Kramer-Schadt, S.; Niedballa, J.; Pilgrim, J.D.; Schröder, B.; Lindenborn, J.; Reinfelder, V.; Stillfried, M.; Heckmann, I.; Scharf, A.K.; Augeri, D.M.; et al. The importance of correcting for sampling bias in MaxEnt species distribution models. Divers. Distrib. 2013, 19, 1366–1379. [Google Scholar] [CrossRef]
- Baldwin, R.A. Use of Maximum Entropy Modeling in Wildlife Research. Entropy 2009, 11, 854–866. [Google Scholar] [CrossRef]
- Phillips, S.J.; Dudik, M. Modeling of species distributions with MaxEnt: New extensions and a comprehensive evaluation. Ecography 2008, 31, 161–175. [Google Scholar] [CrossRef]
- Radosavljevic, A.; Robert, P.A. Making better MAXENT models of species distributions: Complexity, overfitting and evaluation. J. Biogeogr. 2014, 41, 629–643. [Google Scholar] [CrossRef]
- Wang, L.; Deng, H.G.; Qiu, X.F.; Wang, P.F.; Yang, F. Determining the impact of key climatic factors on geographic distribu-tion of wild Akebia trifoliate. Ecol. Indic. 2020, 112, 106093. [Google Scholar] [CrossRef]
- Li, L. Study on the Resource and Quality Evaluation of Akebia Quinata in Anhui Province. Master’s Thesis, Anhui University of Traditional Chinese Medicine, Hefei, China, 2018. [Google Scholar]
- Harsch, M.A.; HilleRisLambers, J. Climate Warming and Seasonal Precipitation Change Interact to Limit Species Distribution Shifts across Western North America. PLoS ONE 2016, 11, e0159184. [Google Scholar] [CrossRef] [Green Version]
- Bachman, G.R.; McMahon, M.J. Day and night temperature differential (DIF) or the absence of far-red light alters cell elonga-tion in ‘Celebrity White’ Petunia. J. Amer. Soc. Hort. Sci. 2006, 131, 309–312. [Google Scholar] [CrossRef] [Green Version]
- Christenhusz, M.J.M.; Rix, M. Akebia quinata. Curtis’s Bot. Mag. 2012, 29, 284–289. [Google Scholar] [CrossRef]
- Li, L.; Yao, X.; Zhong, C.; Chen, X.; Huang, H. Akebia: A Potential New Fruit Crop in China. HortScience 2010, 45, 4–10. [Google Scholar] [CrossRef]
- Wang, C.; Shi, X.; Liu, J.; Zhao, J.; Bo, X.; Chen, F.; Chu, Q. Interdecadal variation of potato climate suitability in China. Agric. Ecosyst. Environ. 2021, 310, 107293. [Google Scholar] [CrossRef]
- Li, Y.; Zhang, C.; Zhu, H.; Li, X.; Duan, Y.; Wang, X. Analyses on suitable distribution areas and main climatic variables of Osmanthus yunnanensis and O. delavayi. J. Plant Resour. Environ. 2019, 55, 71–78. [Google Scholar]
- Moore, C.E.; Meacham-Hensold, K.; Lemonnier, P.; Slattery, R.A.; Benjamin, C.; Bernacchi, C.J.; Lawson, T.; Cavanagh, A.P. The effect of increasing temperature on crop photosynthesis: From enzymes to ecosystems. J. Exp. Bot. 2021, 72, 2822–2844. [Google Scholar] [CrossRef] [PubMed]
- Prasad, P.V.V.; Djanaguiraman, M. High night temperature decreases leaf photosynthesis and pollen function in grain sor-ghum. Funct. Plant Biol. 2011, 38, 993–1003. [Google Scholar] [CrossRef]
- Li, X.; Ma, B.; Lu, C.; Yang, H.; Sun, M. Spatial Pattern and Development of Protected Areas in the North-south Transitional Zone of China. Chin. Geogr. Sci. 2021, 31, 149–166. [Google Scholar] [CrossRef]
- Fang, Y.; Cai, S.; Xiang, J.; Zhong, Y.; Hu, Y.; Xia, X. Biodiversity of Dabieshan in eastern Hubei Province and its protection strategy. J. Anhui Agri. Sci. 2007, 35, 5246–5248. [Google Scholar]
- Haddad, N.M.; Brudvig, L.A.; Clobert, J.; Davies, K.F.; Gonzalez, A.; Holt, R.D.; Lovejoy, T.E.; Sexton, J.O.; Austin, M.P.; Collins, C.D.; et al. Habitat fragmentation and its lasting impact on Earth’s ecosystems. Sci. Adv. 2015, 1, e1500052. [Google Scholar] [CrossRef] [Green Version]
- Zhang, Y.J.; Dang, H.S.; Yang, L.L.; Wei, G.Y.; Wang, Y. Geographical distribution and resource survey of wild medicinal plant Akebia trifoliata subsp. trifoliata. Chin. Wild Plant Resour. 2013, 32, 58–62. [Google Scholar]
- Hageer, Y.; Esperón-Rodríguez, M.; Baumgartner, J.B.; Beaumont, L.J. Climate, soil or both? Which variables are better pre-dictors of the distributions of Australian shrub species? PeerJ 2017, 5, e3446. [Google Scholar] [CrossRef]
- Milanesi, P.; Della Rocca, F.; Robinson, R.A. Integrating dynamic environmental predictors and species occurrences: Toward true dynamic species distribution models. Ecol. Evol. 2019, 10, 1087–1092. [Google Scholar] [CrossRef] [PubMed] [Green Version]


| Variable | Description | Unit | Contribution Rate (%) | ||
|---|---|---|---|---|---|
| A. trifoliata | A. trifoliata subsp. australis | A. quinata | |||
| BIO01 | Annual mean temperature | °C | |||
| BIO02 | Mean diurnal range | °C | 16.4 | 89.1 | 15.4 |
| BIO03 | Isothermality (BIO02/BIO07) | % | 14.6 | 2.2 | 15.4 |
| BIO04 | Temperature seasonality | — | 1.5 | 2.0 | 0.9 |
| BIO05 | Max temperature of warmest month | °C | 1.9 | ||
| BIO06 | Min temperature of coldest month | °C | 58.5 | 0.0 | 54.4 |
| BIO07 | Temperature annual range (BIO05-BIO06) | °C | |||
| BIO08 | Mean temperature of wettest quarter | °C | |||
| BIO09 | Mean temperature of driest quarter | °C | |||
| BIO10 | Mean temperature of warmest quarter | °C | 5.9 | ||
| BIO11 | Mean temperature of coldest quarter | °C | |||
| BIO12 | Annual precipitation | mm | |||
| BIO13 | Precipitation of wettest month | mm | |||
| BIO14 | Precipitation of driest month | mm | 1.0 | 0.1 | 2.6 |
| BIO15 | Precipitation seasonality | mm | 1.9 | 5.1 | 8.5 |
| BIO16 | Precipitation of wettest quarter | mm | |||
| BIO17 | Precipitation of driest quarter | mm | |||
| BIO18 | Precipitation of warmest quarter | mm | 0.3 | 0.2 | 0.8 |
| BIO19 | Precipitation of coldest quarter | mm | 1.3 | ||
| Taxa | Climate Scenarios | Total Suitable Area | Low-Suitability Area | Moderate-Suitability Area | High-Suitability Area | |||||
|---|---|---|---|---|---|---|---|---|---|---|
| Area (×104 km2) | Trend (%) 1 | Area (×104 km2) | Trend (%) 1 | Area (×104 km2) | Trend (%)1 | Area (×104 km2) | Trend (%) 1 | |||
| A. trifoliata | 1970–2000 | 290.34 | — | 169.98 | — | 112.35 | — | 8.00 | — | |
| SSP1-2.6 | 2030s | 302.86 | 4.31 | 219.02 | 28.85 | 79.39 | −29.34 | 4.44 | −44.47 | |
| 2050s | 300.66 | 3.56 | 236.48 | 39.12 | 60.79 | −45.89 | 3.39 | −57.65 | ||
| 2070s | 298.33 | 2.75 | 237.87 | 39.94 | 58.19 | −48.21 | 2.27 | −71.60 | ||
| 2090s | 311.74 | 7.37 | 241.49 | 42.07 | 66.33 | −40.96 | 3.93 | −50.94 | ||
| SSP2-4.5 | 2030s | 297.21 | 2.37 | 204.49 | 20.30 | 87.41 | −22.20 | 5.31 | −33.69 | |
| 2050s | 311.90 | 7.34 | 254.14 | 49.51 | 55.42 | −50.67 | 2.35 | −70.64 | ||
| 2070s | 309.67 | 6.66 | 263.29 | 54.89 | 44.88 | −60.06 | 1.51 | −81.16 | ||
| 2090s | 310.75 | 7.03 | 267.15 | 57.16 | 42.69 | −62.00 | 0.91 | −88.57 | ||
| SSP3-7.0 | 2030s | 298.13 | 2.68 | 212.65 | 25.10 | 81.79 | −27.20 | 3.70 | −53.82 | |
| 2050s | 307.06 | 5.76 | 244.49 | 43.83 | 59.97 | −46.62 | 2.61 | −67.44 | ||
| 2070s | 311.36 | 7.24 | 269.46 | 58.52 | 40.65 | −63.82 | 1.25 | −84.39 | ||
| 2090s | 326.43 | 12.43 | 292.41 | 72.02 | 33.27 | −70.38 | 0.74 | −90.71 | ||
| SSP5-8.5 | 2030s | 311.47 | 7.28 | 232.94 | 37.03 | 74.18 | −33.98 | 4.36 | −45.55 | |
| 2050s | 304.61 | 4.92 | 257.62 | 51.55 | 45.54 | −59.47 | 1.46 | −81.77 | ||
| 2070s | 317.12 | 9.22 | 279.22 | 64.26 | 36.77 | −67.27 | 1.13 | −85.88 | ||
| 2090s | 314.46 | 8.31 | 294.75 | 73.40 | 19.55 | −82.06 | 0.15 | −98.07 | ||
| A. trifoliata subsp. australis | 1970–2000 | 352.82 | — | 194.98 | — | 139.69 | — | 18.14 | — | |
| SSP-1-26 | 2030s | 355.57 | 0.78 | 203.90 | 4.57 | 134.72 | −3.56 | 16.95 | −6.55 | |
| 2050s | 353.77 | 0.27 | 205.49 | 5.39 | 132.99 | −4.80 | 15.29 | −15.70 | ||
| 2070s | 359.82 | 1.98 | 225.83 | 18.82 | 123.96 | −11.27 | 10.04 | −44.69 | ||
| 2090s | 359.42 | 1.87 | 212.92 | 9.20 | 129.32 | −7.42 | 17.17 | −5.34 | ||
| SSP2-4.5 | 2030s | 353.38 | 0.16 | 195.51 | 0.27 | 141.63 | −1.38 | 16.24 | −10.46 | |
| 2050s | 362.62 | 2.78 | 221.19 | 13.44 | 130.83 | −6.34 | 10.59 | −41.60 | ||
| 2070s | 355.61 | 0.79 | 228.05 | 16.96 | 118.39 | −15.25 | 9.17 | −49.44 | ||
| 2090s | 361.83 | 2.55 | 231.03 | 18.49 | 122.58 | −12.25 | 8.21 | −54.76 | ||
| SSP3-7.0 | 2030s | 354.78 | 0.56 | 200.40 | 2.78 | 137.89 | −1.29 | 16.49 | −9.11 | |
| 2050s | 357.44 | 1.31 | 207.32 | 6.33 | 135.48 | −3.02 | 14.64 | −19.30 | ||
| 2070s | 357.35 | 1.28 | 217.96 | 11.78 | 128.72 | −7.86 | 10.68 | −41.14 | ||
| 2090s | 358.05 | 1.48 | 215.55 | 10.55 | 132.85 | −4.90 | 9.65 | −46.83 | ||
| SSP5-8.5 | 2030s | 361.08 | 2.34 | 210.94 | 8.18 | 134.78 | −3.51 | 15.36 | −15.32 | |
| 2050s | 358.10 | 1.50 | 219.46 | 12.56 | 128.95 | −7.69 | 9.69 | −46.60 | ||
| 2070s | 359.15 | 1.79 | 223.44 | 14.60 | 122.43 | −12.36 | 13.27 | −26.84 | ||
| 2090s | 341.54 | −3.20 | 241.67 | 23.95 | 94.42 | −32.41 | 5.46 | −69.93 | ||
| A. quinata | 1970–2000 | 272.91 | — | 176.02 | — | 88.12 | — | 8.77 | — | |
| SSP-1-26 | 2030s | 280.92 | 2.94 | 214.54 | 21.88 | 64.04 | −27.33 | 2.35 | −73.20 | |
| 2050s | 280.88 | 2.92 | 242.58 | 37.81 | 37.92 | −56.97 | 0.38 | −95.61 | ||
| 2070s | 279.27 | 2.33 | 230.21 | 30.97 | 47.66 | −45.92 | 1.39 | −84.09 | ||
| 2090s | 287.15 | 5.22 | 225.65 | 28.19 | 59.76 | −32.18 | 1.74 | −80.20 | ||
| SSP2-4.5 | 2030s | 279.03 | 2.24 | 205.40 | 116.69 | 70.50 | −19.99 | 3.12 | −64.39 | |
| 2050s | 294.41 | 7.88 | 236.06 | 34.11 | 56.41 | −35.99 | 1.95 | −77.75 | ||
| 2070s | 297.71 | 9.09 | 257.02 | 46.01 | 39.42 | −55.26 | 1.26 | −85.59 | ||
| 2090s | 296.39 | 8.60 | 259.49 | 47.42 | 36.10 | −59.03 | 0.80 | −90.89 | ||
| SSP3-7.0 | 2030s | 285.15 | 4.48 | 198.59 | 12.82 | 83.90 | −4.78 | 2.66 | −69.68 | |
| 2050s | 294.68 | 7.98 | 232.08 | 34.85 | 61.33 | −30.40 | 1.27 | −85.53 | ||
| 2070s | 289.12 | 5.94 | 256.19 | 45.55 | 31.82 | −63.88 | 1.10 | −87.49 | ||
| 2090s | 305.92 | 12.10 | 276.44 | 57.05 | 28.50 | −67.66 | 0.98 | −88.81 | ||
| SSP5-8.5 | 2030s | 287.89 | 5.49 | 196.71 | 11.75 | 85.95 | −2.47 | 5.23 | −40.36 | |
| 2050s | 291.20 | 6.70 | 252.81 | 43.62 | 37.49 | −57.46 | 0.91 | −89.62 | ||
| 2070s | 291.93 | 6.97 | 266.69 | 51.51 | 24.58 | −72.10 | 0.66 | −92.47 | ||
| 2090s | 254.18 | −6.86 | 246.91 | 40.27 | 6.85 | −92.23 | 0.42 | −95.22 | ||
| Taxa | Scenarios | Area (×104 km2) | Ratio (%) A 1 | Ratio (%) B 2 |
|---|---|---|---|---|
| A. trifoliata | SSP1-2.6 | 276.81 | 28.83% | 95.34% |
| SSP2-4.5 | 267.62 | 27.88% | 92.18% | |
| SSP3-7.0 | 260.25 | 27.11% | 89.64% | |
| SSP5-8.5 | 247.18 | 25.75% | 85.14% | |
| A. trifoliata subsp. australis | SSP1-2.6 | 331.29 | 34.51% | 93.90% |
| SSP2-4.5 | 326.27 | 33.99% | 92.48% | |
| SSP3-7.0 | 327.28 | 34.09% | 92.76% | |
| SSP5-8.5 | 326.28 | 33.99% | 92.48% | |
| A. quinata | SSP1-2.6 | 263.81 | 27.48% | 96.67% |
| SSP2-4.5 | 261.97 | 27.29% | 95.99% | |
| SSP3-7.0 | 252.90 | 26.34% | 92.67% | |
| SSP5-8.5 | 211.40 | 22.02% | 77.46% |
Publisher’s Note: MDPI stays neutral with regard to jurisdictional claims in published maps and institutional affiliations. |
© 2021 by the authors. Licensee MDPI, Basel, Switzerland. This article is an open access article distributed under the terms and conditions of the Creative Commons Attribution (CC BY) license (https://creativecommons.org/licenses/by/4.0/).
Share and Cite
Wang, X.; Zhang, W.; Zhao, X.; Zhu, H.; Ma, L.; Qian, Z.; Zhang, Z. Modeling the Potential Distribution of Three Taxa of Akebia Decne. under Climate Change Scenarios in China. Forests 2021, 12, 1710. https://doi.org/10.3390/f12121710
Wang X, Zhang W, Zhao X, Zhu H, Ma L, Qian Z, Zhang Z. Modeling the Potential Distribution of Three Taxa of Akebia Decne. under Climate Change Scenarios in China. Forests. 2021; 12(12):1710. https://doi.org/10.3390/f12121710
Chicago/Turabian StyleWang, Xiuting, Wenwen Zhang, Xin Zhao, Huiqin Zhu, Limiao Ma, Zengqiang Qian, and Zheng Zhang. 2021. "Modeling the Potential Distribution of Three Taxa of Akebia Decne. under Climate Change Scenarios in China" Forests 12, no. 12: 1710. https://doi.org/10.3390/f12121710
APA StyleWang, X., Zhang, W., Zhao, X., Zhu, H., Ma, L., Qian, Z., & Zhang, Z. (2021). Modeling the Potential Distribution of Three Taxa of Akebia Decne. under Climate Change Scenarios in China. Forests, 12(12), 1710. https://doi.org/10.3390/f12121710