Variations of the Oxidative Ratio across Ecosystem Components and Seasons in a Managed Temperate Beech Forest (Leinefelde, Germany)


Abstract
:
1. Introduction

| Component | OR | Reference |
|---|---|---|
| Lignin | 1.13 | [16] |
| Cellulose | 1.00 | [16] |
| Carbohydrates | 1.00 | * |
| Soluble phenolics | 1.05 | [17,18] |
| Woody leaf | 1.054 | [17,18] |
| Deciduous forest litter | 1.045 | [19] |
| Woody stem | 1.041 | [17,18] |
| Woody root | 1.051 | [17,18] |
| Global vegetation | 1.03 ± 0.02 | [4] |
| 1.07 ± 0.02 | [11] | |
| 1.040 ± 0.005 | [12] | |
| 1.06 | [10] |
2. Materials and Methods
2.1. Study Site
2.2. Methods
3. Results

4. Discussion
4.1. Oxidative Ratio (OR) at Ecosystem Level
4.2. OR and δ13C at Component Level
4.3. Implications for Future Research
5. Conclusions
Supplementary Materials
Author Contributions
Funding
Acknowledgments
Conflicts of Interest
References
- Manning, A.C.; Keeling, R.F. Global oceanic and land biotic carbon sinks from the Scripps atmospheric oxygen flask sampling network. Tellus B Chem. Phys. Meteorol. 2006, 58, 95–116. [Google Scholar] [CrossRef] [Green Version]
- Keeling, R.F.; Manning, A.C. Studies of recent changes in atmospheric O2 content. In Treatise on Geochemistry. Reference Module in Earth Systems and Environmental Sciences, 2nd ed.; Elsevier: Amsterdam, The Netherlands, 2014; Volume 5, pp. 385–404. [Google Scholar]
- Keeling, R.F.; Shertz, S.R. Seasonal and interannual variations in atmospheric oxygen and implications for the global carbon cycle. Nature 1992, 358, 723–727. [Google Scholar]
- Worrall, F.; Clay, G.D.; Masiello, C.A.; Mynheer, G. Estimating the oxidative ratio of the global terrestrial biosphere carbon. Biodegradation 2013, 115, 23–32. [Google Scholar] [CrossRef] [Green Version]
- Ishidoya, S.; Murayama, S.; Takamura, C.; Kondo, H.; Saigusa, N.; Goto, D.; Morimoto, S.; Aoki, N.; Aoki, S.; Nakazawa, T. O2:CO2 exchange ratios observed in a cool temperate deciduous forest ecosystem of central Japan. Tellus B Chem. Phys. Meteorol. 2013, 65, 21120. [Google Scholar] [CrossRef] [Green Version]
- Angert, A.; Sherer, Y. Determining the relationship between tree-stem respiration and CO2 efflux by δO2/Ar measurements. Rapid Commun. Mass Spectrom. 2011, 25, 1752–1756. [Google Scholar]
- Angert, A.; Muhr, J.; Juarez, R.N.; Muñoz, W.A.; Kraemer, G.; Santillan, J.R.; Barkan, E.; Mazeh, S.; Chambers, J.Q.; Trumbore, S.E. Internal respiration of Amazon tree stems greatly exceeds external CO2 efflux. Biogeosciences 2012, 9, 4979–4991. [Google Scholar] [CrossRef] [Green Version]
- Hockaday, W.C.; Masiello, C.; Randerson, J.T.; Smernik, R.; Baldock, J.; Chadwick, O.A.; Harden, J.W. Measurement of soil carbon oxidation state and oxidative ratio by13C nuclear magnetic resonance. J. Geophys. Res. Space Phys. 2009, 114. [Google Scholar] [CrossRef] [Green Version]
- Masiello, C.A.; Gallagher, M.E.; Randerson, J.T.; Deco, R.M.; Chadwick, O.A. Evaluating two experimental approaches for measuring ecosystem carbon oxidation state and oxidative ratio. J. Geophys. Res. Space Phys. 2008, 113. [Google Scholar] [CrossRef] [Green Version]
- Clay, G.D.; Worrall, F.; Plummer, R.; Moody, C.S. Organic matter properties of Fennoscandian ecosystems: Potential oxidation of northern environments under future change? Sci. Total Environ. 2018, 610, 1496–1504. [Google Scholar]
- Clay, G.D.; Worrall, F. Oxidative ratio (OR) of Southern African soils and vegetation: Updating the global OR estimate. Catena 2015, 126, 126–133. [Google Scholar] [CrossRef] [Green Version]
- Worrall, F.; Clay, G.D.; Macdonald, A. The impact of fertilizer management on the oxidation status of terrestrial organic matter. Soil Use Manag. 2016, 32, 45–52. [Google Scholar] [CrossRef] [Green Version]
- Nelson, D.L.; Lehninger, A.L.; Cox, M.M. Lehninger Principles of Biochemistry; Macmillan: New York, NY, USA, 2001. [Google Scholar]
- Ono, K.; Hiraide, M.; Amari, M. Determination of lignin, holocellulose, and organic solvent extractives in fresh leaf, litterfall, and organic material on forest floor using near-infrared reflectance spectroscopy. J. For. Res. 2003, 8, 191–198. [Google Scholar] [CrossRef]
- Marenco, R.A.; Gonçalves, J.F.D.C.; Vieira, G. Leaf gas exchange and carbohydrates in tropical trees differing in successional status in two light environments in central Amazonia. Tree Physiol. 2001, 21, 1311–1318. [Google Scholar] [CrossRef] [Green Version]
- Pallardy, S.G.; Kozlowski, T.T. Physiology of Woody Plants; Academic Press: Cambridge, MA, USA, 2010. [Google Scholar]
- Randerson, J.T.; Masiello, C.A.; Still, C.J.; Rahn, T.; Poorter, H.; Field, C.B. Is carbon within the global terrestrial biosphere becoming more oxidized? Implications for trends in atmospheric O2. Glob. Chang. Biol. 2006, 12, 260–271. [Google Scholar] [CrossRef] [Green Version]
- Poorter, H.; Villar, R. The fate of acquired carbon in plants: Chemical composition and construction costs. In Plant Resource Allocation; Bazzaz, F., Grace, J., Eds.; SPB Academic: The Hague, The Netherlands, 1997; pp. 39–72. [Google Scholar]
- Gallagher, M.E.; Liljestrand, F.L.; Hockaday, W.C.; Masiello, C.A. Plant species, not climate, controls aboveground biomass O2: CO2 exchange ratios in deciduous and coniferous ecosystems. J. Geophys. Res. Biogeosci. 2017, 122, 2314–2324. [Google Scholar] [CrossRef] [Green Version]
- Severinghaus, J.P. Studies of the Terrestrial O2 and Carbon Cycles in Sand Dune Gases and in Biosphere 2. Ph.D. Thesis, Columbia University, New York, NY, USA, 1995. [Google Scholar]
- Gallagher, M.E.; Masiello, C.A.; Hockaday, W.C.; Baldock, J.A.; Snapp, S.; McSwiney, C.P. Controls on the oxidative ratio of net primary production in agricultural ecosystems. Biodegradation 2014, 121, 581–594. [Google Scholar] [CrossRef]
- Knohl, A.; Werner, R.A.; Brand, W.A.; Buchmann, N. Short-term variations in δ 13 C of ecosystem respiration reveals link between assimilation and respiration in a deciduous forest. Oecologia 2005, 142, 70–82. [Google Scholar] [CrossRef]
- Göttlicher, S.; Knohl, A.; Wanek, W.; Buchmann, N.; Richter, A. Short-term changes in carbon isotope composition of soluble carbohydrates and starch: From canopy leaves to the root system. Rapid Commun. Mass Spectrom. 2006, 20, 653–660. [Google Scholar] [CrossRef]
- Anthoni, P.M.; Knohl, A.; Rebmann, C.; Freibauer, A.; Mund, M.; Ziegler, W.; Kolle, O.; Schulze, E.-D. Forest and agricultural land-use-dependent CO2 exchange in Thuringia, Germany. Glob. Chang. Biol. 2004, 10, 2005–2019. [Google Scholar] [CrossRef]
- Mund, M. Carbon Pools of European Beech Forests (Fagus Sylvatica) under Different Silvicultural Management. Ph.D. Thesis, University of Göttingen, Göttingen, Germany, 2004; p. 256. [Google Scholar]
- Granier, A. Evaluation of transpiration in a Douglas-fir stand by means of sap flow measurements. Tree Physiol. 1987, 3, 309–320. [Google Scholar] [CrossRef]
- Granier, A.; Bréda, N.; Biron, P.; Villette, S. A lumped water balance model to evaluate duration and intensity of drought constraints in forest stands. Ecol. Model. 1999, 116, 269–283. [Google Scholar] [CrossRef]
- Skomarkova, M.V.; Vaganov, E.; Mund, M.; Knohl, A.; Linke, P.; Boerner, A.; Schulze, E.-D. Inter-annual and seasonal variability of radial growth, wood density and carbon isotope ratios in tree rings of beech (Fagus sylvatica) growing in Germany and Italy. Trees 2006, 20, 571–586. [Google Scholar] [CrossRef]
- Pate, J.; Arthur, D. δ 13 C analysis of phloem sap carbon: Novel means of evaluating seasonal water stress and interpreting carbon isotope signatures of foliage and trunk wood of Eucalyptus globulus. Oecologia 1998, 117, 301–311. [Google Scholar] [CrossRef]
- Farquhar, G.D.; Ehleringer, J.R.; Hubick, K.T. Carbon isotope discrimination and photosynthesis. Annu. Rev. Plant Biol. 1989, 40, 503–537. [Google Scholar] [CrossRef]
- García-Plazaola, J.I.; Becerril, J.M. Effects of drought on photoprotective mechanisms in European beech (Fagus sylvatica L.) seedlings from different provenances. Trees 2000, 14, 485–490. [Google Scholar] [CrossRef]
- Gallé, A.; Feller, U. Changes of photosynthetic traits in beech saplings (Fagus sylvatica) under severe drought stress and during recovery. Physiol. Plant. 2007, 131, 412–421. [Google Scholar] [CrossRef]
- Gebauer, R.; Plichta, R.; Urban, J.; Volařík, D.; Hájíčková, M. The resistance and resilience of European beech seedlings to drought stress during the period of leaf development. Tree Physiol. 2020, 40, 1147–1164. [Google Scholar] [CrossRef]
- Guendehou, G.H.S.; Liski, J.; Tuomi, M.; Moudachirou, M.; Sinsin, B.; Makipaa, R. Decomposition and changes in chemical composition of leaf litter of five dominant tree species in a West African tropical forest. Trop. Ecol. 2014, 55, 207–220. [Google Scholar]
- Torres-Ruiz, M.; Wehr, J.D. Changes in the nutritional quality of decaying leaf litter in a stream based on fatty acid content. Hydrobiologia 2010, 651, 265–278. [Google Scholar] [CrossRef]
- d’Annunzio, R.; Zeller, B.; Nicolas, M.; Dhôte, J.-F.; Saint-André, L. Decomposition of European beech (Fagus sylvatica) litter: Combining quality theory and 15N labelling experiments. Soil Biol. Biochem. 2008, 40, 322–333. [Google Scholar] [CrossRef]
- Evans, J.R. Photosynthesis and nitrogen relationships in leaves of C3 plants. Oecologia 1989, 78, 9–19. [Google Scholar] [CrossRef]
- Hebeler, R.; Oeljeklaus, S.; Reidegeld, K.A.; Eisenacher, M.; Stephan, C.; Sitek, B.; Stühler, K.; Meyer, H.E.; Sturre, M.J.G.; Dijkwel, P.P.; et al. Study of Early Leaf Senescence in Arabidopsis thaliana by Quantitative Proteomics Using Reciprocal 14N/15N Labeling and Difference Gel Electrophoresis. Mol. Cell. Proteom. 2008, 7, 108–120. [Google Scholar] [CrossRef] [Green Version]
- Matile, P.; Hörtensteiner, S.; Thomas, H. Chlorophyll degradation. Annu. Rev. Plant Biol. 1999, 50, 67–95. [Google Scholar] [CrossRef] [Green Version]
- Feller, U.; Anders, I.; Mae, T. Rubiscolytics: Fate of Rubisco after its enzymatic function in a cell is terminated. J. Exp. Bot. 2007, 59, 1615–1624. [Google Scholar] [CrossRef] [Green Version]
- Ono, Y.; Wada, S.; Izumi, M.; Makino, A.; Ishida, H. Evidence for contribution of autophagy to R ubisco degradation during leaf senescence in a rabidopsis thaliana. Plant Cell Environ. 2013, 36, 1147–1159. [Google Scholar] [CrossRef] [PubMed]
- Spreitzer, R.J.; Salvucci, M.E. RUBISCO: Structure, Regulatory Interactions, and Possibilities for a Better Enzyme. Annu. Rev. Plant Biol. 2002, 53, 449–475. [Google Scholar] [CrossRef] [Green Version]
- Bar-On, Y.M.; Milo, R. The global mass and average rate of rubisco. Proc. Natl. Acad. Sci. USA 2019, 116, 4738–4743. [Google Scholar] [CrossRef] [Green Version]
- Bockheim, J.; Gennadiyev, A.; Hartemink, A.; Brevik, E. Soil-forming factors and Soil Taxonomy. Geoderma 2014, 226, 231–237. [Google Scholar] [CrossRef]
- Morán, J.I.; Álvarez, V.; Cyras, V.P.; Vázquez, A. Extraction of cellulose and preparation of nanocellulose from sisal fibers. Cellulose 2007, 15, 149–159. [Google Scholar] [CrossRef]
- Sheltami, R.M.; Abdullah, I.; Ahmad, I.; Dufresne, A.; Kargarzadeh, H. Extraction of cellulose nanocrystals from mengkuang leaves (Pandanus tectorius). Carbohydr. Polym. 2012, 88, 772–779. [Google Scholar] [CrossRef]
- Radotić, K.; Mićić, M. Methods for extraction and purification of lignin and cellulose from plant tissues. In Sample Preparation Techniques for Soil, Plant, and Animal Samples; Humana Press: New York, NY, USA, 2016; pp. 365–376. [Google Scholar]
| Standard | C (m%) | N (m%) | O (m%) | H (m%) |
|---|---|---|---|---|
| Acetanilide | 71.56 ± 1.72 (48) | 10.47 ± 0.51 (47) | 12.85 ± 0.47 (24) | 6.34 ± 0.17 (25) |
| Peach leaves | 47.04 ± 0.20 (42) | 2.96 ± 0.03 (49) | 37.10 ± 0.37 (49) | 6.60 ± 0.13 (52) |
| KOSI-B1-1 | 41.69 ± 0.91 (25) | 2.31 ± 0.07 (25) | 41.03 ± 0.90 (25) | 5.50 ± 0.19 (25) |
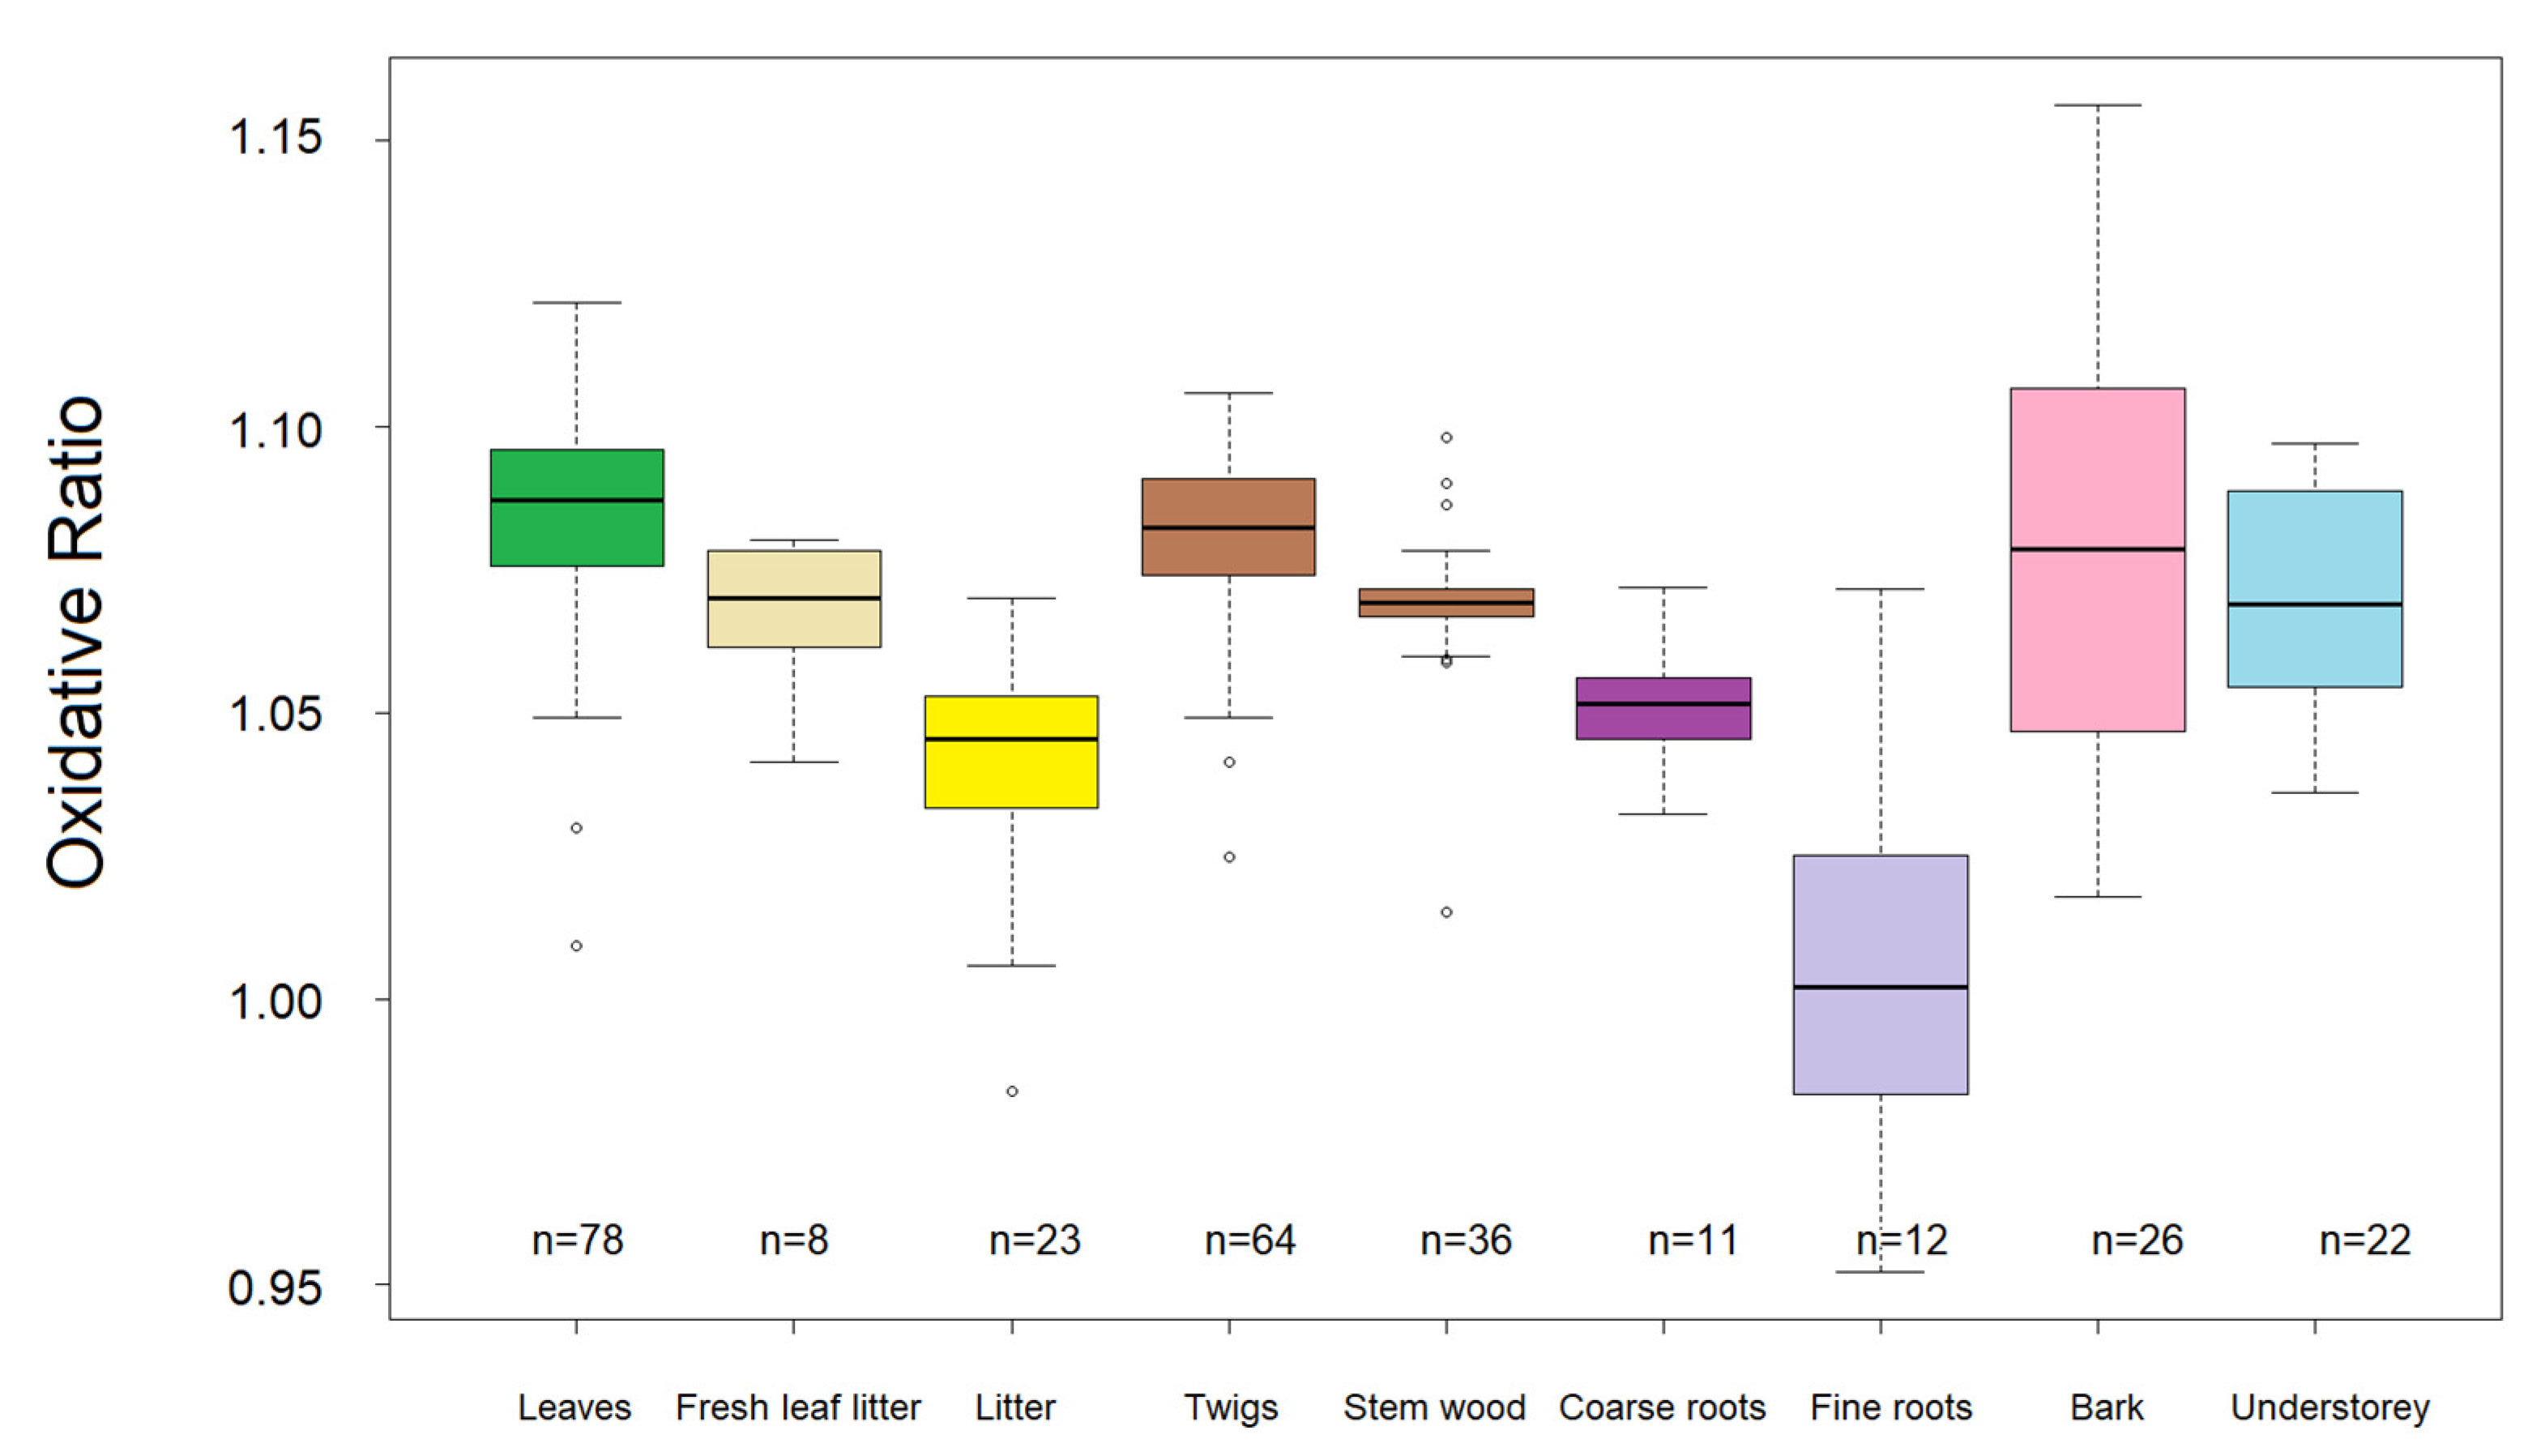
| Sample Type | N Samples | Plant Biomass Share [%] | C/N (±SE) | C/O (±SE) | Cox (±SE) | OR (±SE) | ||||
|---|---|---|---|---|---|---|---|---|---|---|
| Leaves | 78 | 0.6 | 22.81 | ±0.52 | 1.22 | ±0.01 | −0.228 | ±0.007 | 1.086 | ±0.002 |
| Twigs | 64 | 14.7 1 | 44.68 | ±1.69 | 1.21 | ±0.01 | −0.258 | ±0.009 | 1.081 | ±0.002 |
| Stem wood | 36 | 68.9 | 119.24 | ±6.79 | 1.08 | ±0.01 | −0.256 | ±0.007 | 1.069 | ±0.001 |
| Bark | 26 | N/A | 57.62 | ±2.85 | 1.24 | ±0.03 | −0.264 | ±0.028 | 1.078 | ±0.007 |
| Fresh leaf litter | 8 | N/A | 42.67 | ±1.55 | 1.21 | ±0.02 | −0.210 | ±0.020 | 1.068 | ±0.005 |
| Litter (organic layer) | 23 | 1.2 | 29.11 | ±1.10 | 1.18 | ±0.01 | −0.072 | ±0.020 | 1.041 | ±0.004 |
| Understorey vegetation | 22 | 19.55 | ±0.65 | 1.08 | ±0.01 | −0.140 | ±0.017 | 1.069 | ±0.004 | |
| Fine roots | 12 | 0.5 | 34.04 | ±2.20 | 1.02 | ±0.04 | 0.063 | ±0.041 | 1.004 | ±0.010 |
| Coarse roots | 11 | 14.1 | 44.15 | ±5.17 | 1.07 | ±0.03 | −0.138 | ±0.017 | 1.051 | ±0.003 |
| Leaves | Stem Wood | Twigs | Litter | Fine Roots | Coarse Roots | Bark | Understorey Veg. | |
|---|---|---|---|---|---|---|---|---|
| Stem wood | ** | |||||||
| Twigs | - | * | ||||||
| Litter | *** | ** | *** | |||||
| Fine roots | *** | *** | *** | *** | ||||
| Coarse roots | *** | - | ** | - | *** | |||
| Bark | - | - | - | *** | *** | * | ||
| Understorey veg. | * | - | - | ** | *** | - | - | |
| Fresh leaf litter | - | - | - | - | *** | - | - | - |
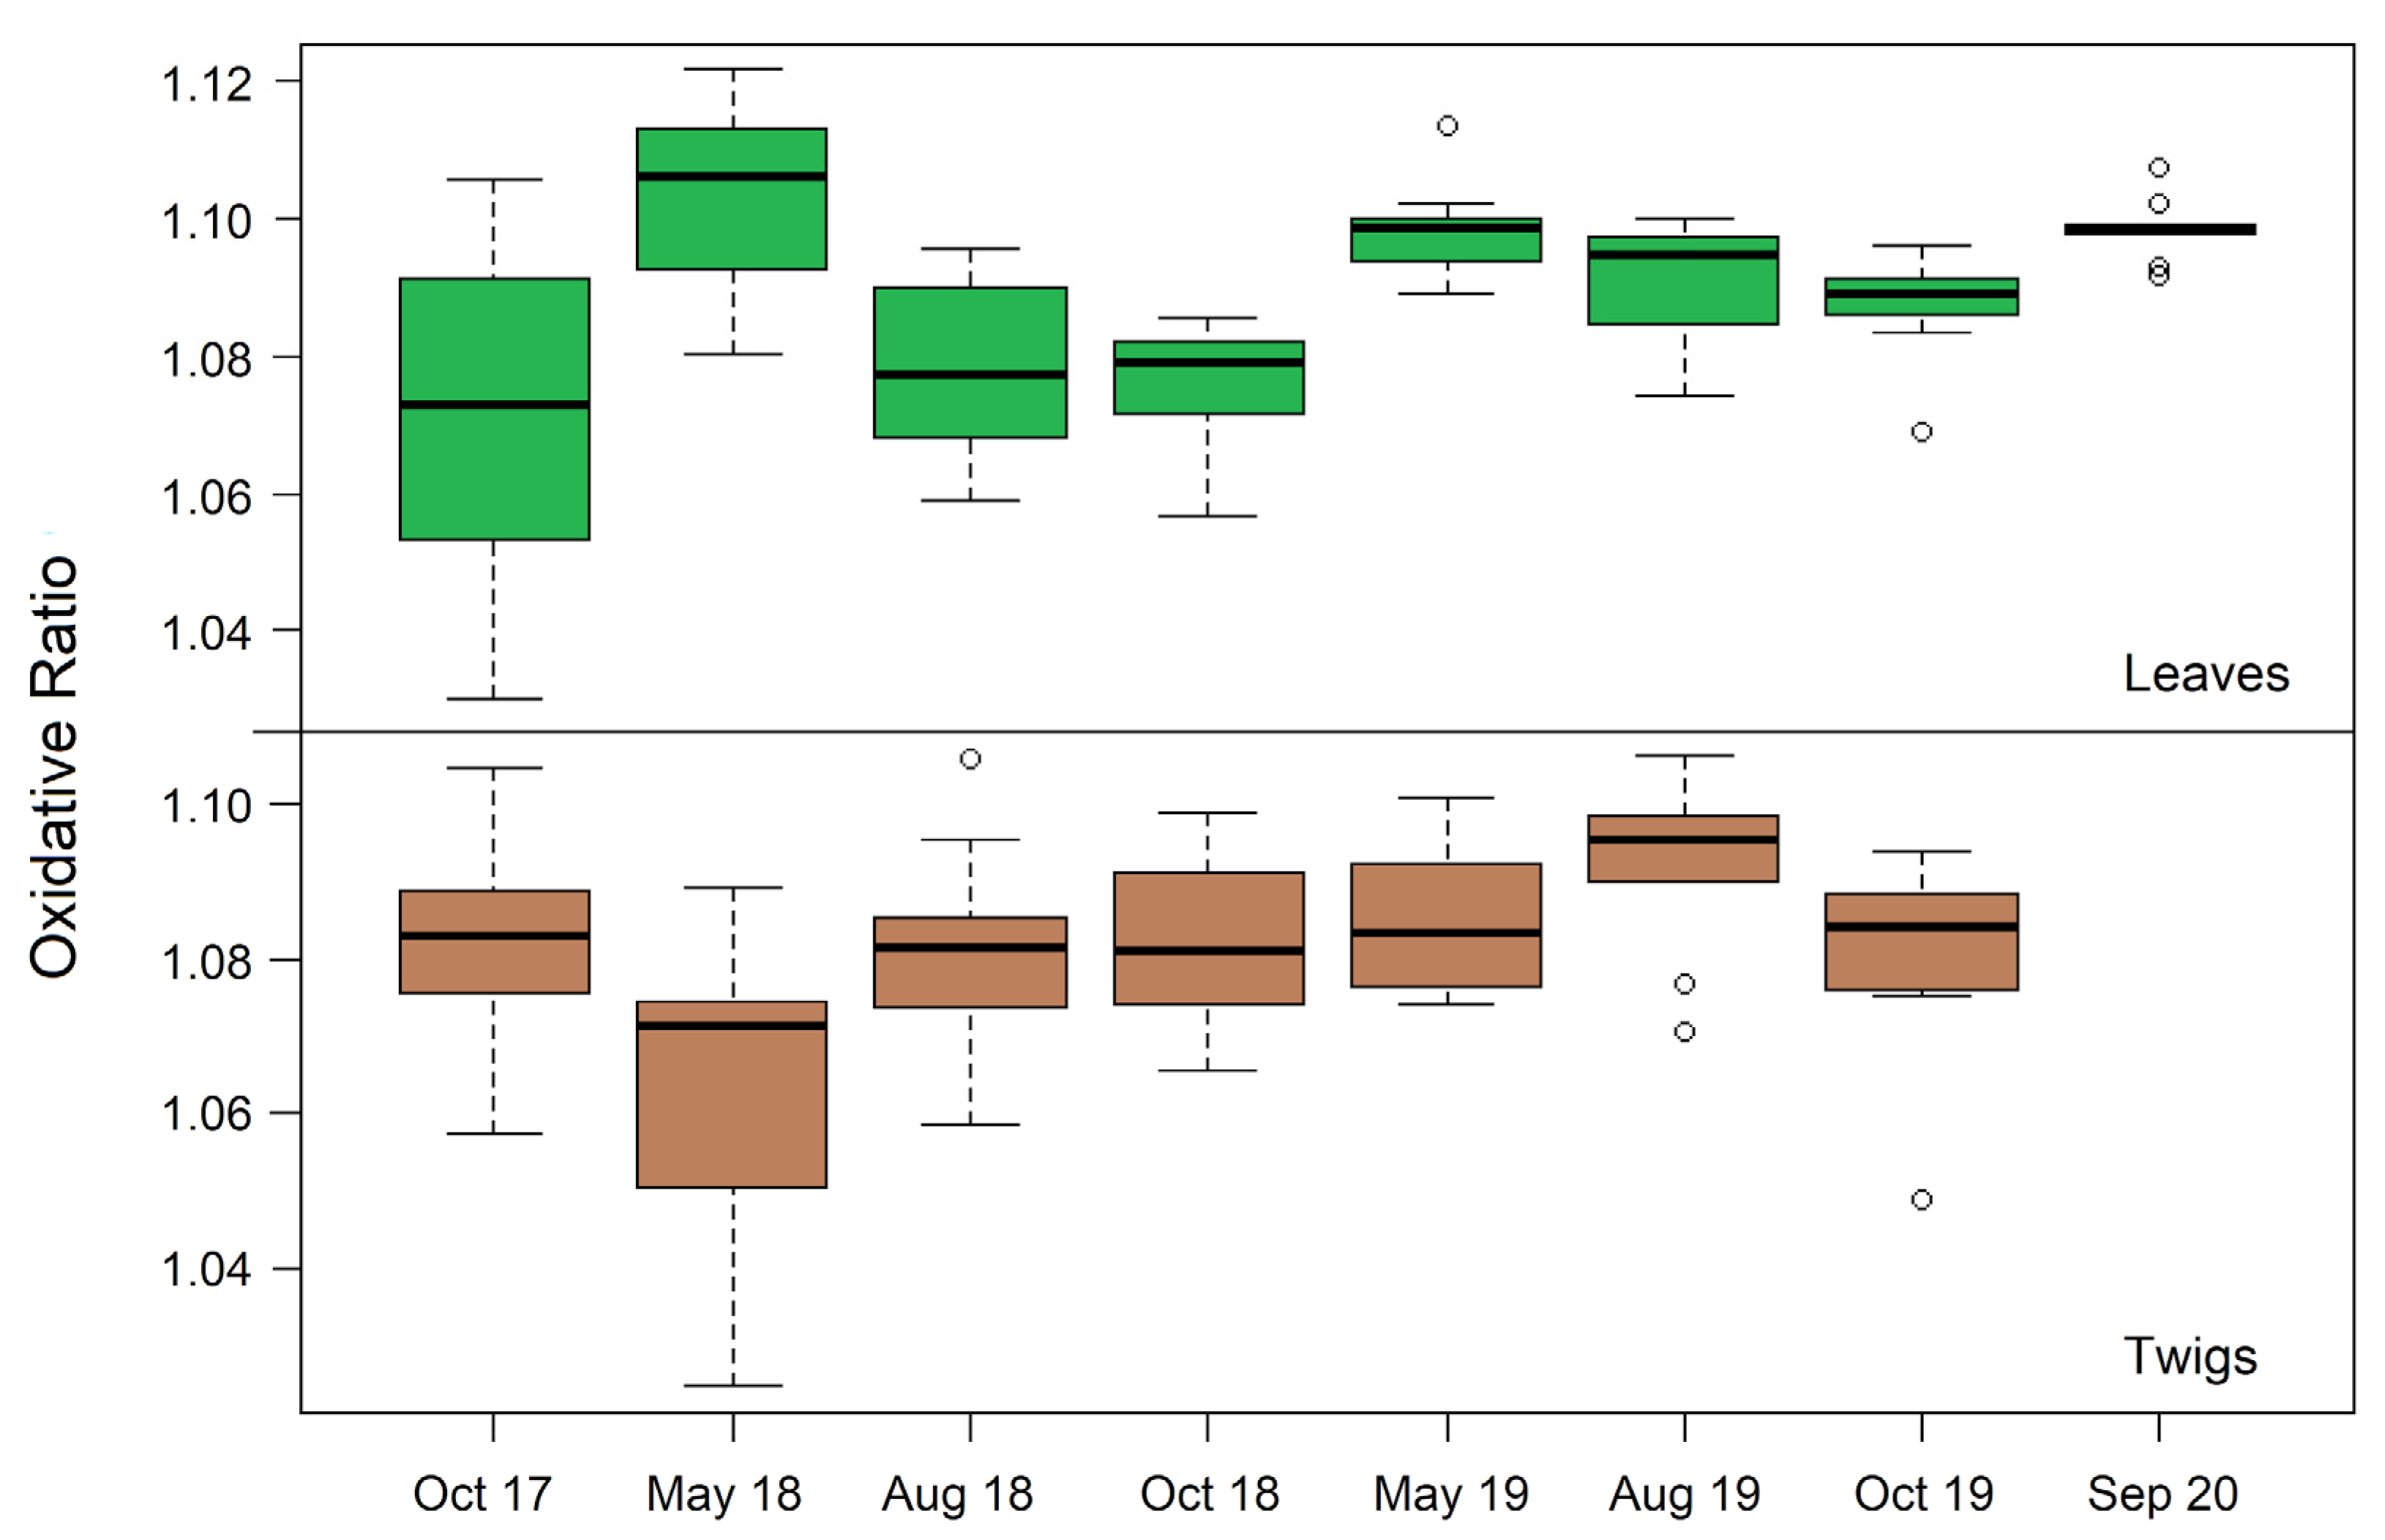
| Sample Type | Plant BM Share [%] | Oct 2017 | May 2018 | Aug 2018 | Oct 2018 | May 2019 | Aug 2019 | Oct 2019 | Sep 2020 |
|---|---|---|---|---|---|---|---|---|---|
| OR ± SE | OR ± SE | OR ± SE | OR ± SE | OR ± SE | OR ± SE | OR ± SE | OR ± SE | ||
| Leaves | 0.6 | 1.069 ± 0.007 | 1.104 ± 0.005 | 1.077 ± 0.005 | 1.076 ± 0.003 | 1.098 ± 0.002 | 1.091 ± 0.003 | 1.087 ± 0.003 | 1.099 ± 0.002 |
| Twigs | 14.7 1 | 1.082 ± 0.004 | 1.064 ± 0.007 | 1.081 ± 0.005 | 1.083 ± 0.004 | 1.085 ± 0.003 | 1.094 ± 0.003 | 1.078 ± 0.004 | - |
| Stem wood * | 68.9 | - | - | - | - | 1.065 ± 0.004 | - | - | 1.071 ± 0.001 |
| Bark | N/A | 1.060 ± 0.007 | 1.114 ± 0.021 | 1.032 ± 0.010 | 1.115 ± 0.018 | 1.108 ± 0.001 | 1.076 ± 0.024 | 1.081 ± 0.022 | - |
| Fresh leaf litter | N/A | 1.013 | - | - | - | - | - | 1.068 ± 0.004 | - |
| Litter | 1.2 | 1.046 ± 0.003 | 1.029 ± 0.019 | 1.039 ± 0.001 | 1.036 ± 0.009 | 1.026 ± 0.025 | 1.050 ± 0.003 | 1.058 ± 0.010 | - |
| (org. layer) | |||||||||
| Understorey veg. | N/A | 1.058 ± 0.008 | 1.088 ± 0.007 | 1.080 ± 0.009 | 1.089 ± 0.002 | 1.078 ± 0.008 | 1.069 ± 0.002 | 1.042 ± 0.001 | - |
| AGB | 85.4 | 1.070 ± 0.002 | 1.069 ± 0.002 | 1.069 ± 0.002 | 1.069 ± 0.002 | 1.070 ± 0.002 | 1.070 ± 0.002 | 1.070 ± 0.002 | - |
| Fine roots | 0.5 | - | 0.983 | - | 0.981 ± 0.024 | 1.016 ± 0.009 | 1.037 ± 0.021 | 0.981 ± 0.016 | - |
| Coarse roots | 14.1 | - | 1.058 ± 0.005 | - | - | 1.047 ± 0.004 | 1.059 ± 0.008 | 1.044 ± 0.006 | - |
| BGB | 14.6 | - | 1.055 ± 0.005 | - | - | 1.046 ± 0.004 | 1.058 ± 0.008 | 1.042 ± 0.006 | - |
Publisher’s Note: MDPI stays neutral with regard to jurisdictional claims in published maps and institutional affiliations. |
© 2021 by the authors. Licensee MDPI, Basel, Switzerland. This article is an open access article distributed under the terms and conditions of the Creative Commons Attribution (CC BY) license (https://creativecommons.org/licenses/by/4.0/).
Share and Cite
Jürgensen, J.; Muhr, J.; Knohl, A. Variations of the Oxidative Ratio across Ecosystem Components and Seasons in a Managed Temperate Beech Forest (Leinefelde, Germany). Forests 2021, 12, 1693. https://doi.org/10.3390/f12121693
Jürgensen J, Muhr J, Knohl A. Variations of the Oxidative Ratio across Ecosystem Components and Seasons in a Managed Temperate Beech Forest (Leinefelde, Germany). Forests. 2021; 12(12):1693. https://doi.org/10.3390/f12121693
Chicago/Turabian StyleJürgensen, Jonathan, Jan Muhr, and Alexander Knohl. 2021. "Variations of the Oxidative Ratio across Ecosystem Components and Seasons in a Managed Temperate Beech Forest (Leinefelde, Germany)" Forests 12, no. 12: 1693. https://doi.org/10.3390/f12121693
APA StyleJürgensen, J., Muhr, J., & Knohl, A. (2021). Variations of the Oxidative Ratio across Ecosystem Components and Seasons in a Managed Temperate Beech Forest (Leinefelde, Germany). Forests, 12(12), 1693. https://doi.org/10.3390/f12121693