Article

ATR-FTIR Study of Alaska Yellow Cedar Extractives and Relationship with Their Natural Durability

by
Shahlinney Lipeh
1,2,†,
Laurence Schimleck
1,*,
Mark E. Mankowski
3,
Armando G. McDonald
4 and
Jeffrey J. Morrell
5
1
Department of Wood Science and Engineering, Oregon State University, Corvallis, OR 97331, USA
2
Wood Biodegradation Unit, Forest Products Division, Forest Research Institute of Malaysia, Kepong 52109, Malaysia
3
USDA Forest Service Forest Products Laboratory, Starkville, MS 39759, USA
4
Department of Forest, Rangeland and Fire Sciences, University of Idaho, Moscow, ID 83844, USA
5
National Centre for Timber Durability and Design Life, University of the Sunshine Coast, Sippy Downs, Sunshine Coast, QLD 4106, Australia
*
Author to whom correspondence should be addressed.
This paper is a part of the Doctoral Dissertation of the Senior Author.
Forests 2021, 12(12), 1692; https://doi.org/10.3390/f12121692
Submission received: 9 November 2021 / Revised: 28 November 2021 / Accepted: 1 December 2021 / Published: 3 December 2021
(This article belongs to the Section Wood Science and Forest Products)

Abstract

:
New approaches for assessing wood durability are needed to help categorize decay resistance as timber utilization shifts towards plantations or native forest regrowth that may be less durable than original native forest resources. This study evaluated attenuated total reflectance Fourier transform infrared (ATR-FTIR) spectroscopy combined with principal component analysis (PCA) for distinguishing between groups of Alaska yellow cedar (Cupressus nootkatensis) wood for susceptibility to two decay fungi (Gloeophyllum trabeum and Rhodonia placenta) and the eastern subterranean termite (Reticulitermes flavipes). Alaska yellow cedar durability varied with test organisms, but the majority of samples were highly resistant to fungal and termite attack. Weight losses and extractives yield using sequential extractions (toluene:ethanol > ethanol > hot water) showed moderate to weak relationships. PCA analysis revealed limited ability to distinguish amongst levels of wood durability to all tested organisms. The absence of non-resistant samples may have influenced the ability of the chemometric methods to accurately categorize durability.

1. Introduction

The heartwood of some tree species exhibits exceptional resistance to fungal and insect attack, but this property can be highly variable between and even within individual trees [1]. These variations are becoming more important with the shift from harvesting old-growth forests to short rotation plantation trees and native forest regrowth. Wood from plantation and regrowth forests are generally proving to be more susceptible to degradation compared to old growth trees due to a decrease in the presence of toxic chemicals or extractives [2,3].
Extractives are non-structural, low molecular weight chemical compounds that are normally quantified by removal using solvents with varying polarities [1,4]. Differences in heartwood extractives content and concentration have been related to the existence of durability gradients in wood [5,6,7,8]. In general, extractives content increases from the pith towards the outer heartwood and reaches a maximum at the boundary between heartwood and sapwood [1]. Longitudinally, concentration decreases with tree height. Durability gradients are also believed to be caused by biological detoxification, natural oxidation of heartwood extractives, and continued polymerization of extractives to produce less toxic compounds [9,10,11]. This makes durability classification a complex process.
Durability classification has generally been determined using weight loss in standardized laboratory trials such as AWPA Standard E10 [12] or by visual rating after exposing wood samples to biodegradation agents in field trials over certain periods of time [13,14]. These tests are laborious, destructive, and can require long-term exposure (months to years) before durability can be classified, especially for highly durable species [15]. They are also not practical for regularly quantifying resistance of individual boards during production. Developing non-destructive methods for rapidly assessing durability could allow classification of durability for individual pieces.
Infrared spectroscopic techniques, such as Fourier transform infrared spectroscopy with attenuated total reflectance (ATR-FTIR) or near infrared (NIR) spectroscopy are rapid, surface-based techniques used to characterize many wood properties [16,17,18,19]. These techniques are used mainly for determination and prediction of major wood component levels (cellulose, hemicellulose, lignin, and extractives) or wood moisture content [20,21,22,23,24]. Additionally, wood components can be related to physical and mechanical properties and NIR spectroscopy together with statistical analysis has been used to predict wood density, tensile strength, modulus of elasticity, and modulus of rupture [25,26,27,28].
Despite the wide utilization of spectroscopic approaches to assess wood chemistry, few studies have explored the relationships between spectral information, extractives composition, and durability [19,29,30,31,32,33,34]. Previous studies have produced variable results; for example, Gierlinger et al. [35] showed that FT-NIR accurately predicted larch (Larix decidua Mill., L. leptolepis (Lamb.) Carr. and L. x eurolepis) heartwood durability against decay fungi, whereas Stirling et al. [32] showed that NIR was poorly correlated with western red cedar (Thuja plicata Donn ex D.Don) decay resistance. FT-IR-based durability prediction has been employed to a limited extent as it requires mixing wood powder with KBr before it can be analyzed which is time-consuming. However, the development of ATR-FTIR and DRIFTS technologies allows samples to be analyzed with minimal or no preparation. Lipeh et al. [19] recently utilized ATR-FTIR for determining western juniper (Juniperus occidentalis Hook. var. occidentalis) durability, but relationships amongst extractive contents, durability, and spectral data were weak.
Spectral information can be combined with appropriate chemometrics analyses to reveal important relationships. Hierarchical cluster analysis (HCA) and principal component analysis (PCA) are exploratory methods that can be used to explore relationships with spectral data analysis [36,37,38]. These techniques can be used to identify spectral patterns related to variations between sample groups and to develop models for predicting wood properties [17,39,40].
Alaska yellow cedar (Cupressus nootkatensis D.Don., Cupressaceae) is native to western North America and is found along the coasts of southeast Alaska and British Columbia, and at higher elevations as far south as northern California [41,42]. The wood is highly prized owing to its excellent durability against biodegradation [43,44], and is popular in Japan as a replacement for native hinoki (Chamaecyparis obtusa (Siebold & Zucc.) Endl.) as a structural material, for manufacture of ceremonial boxes, and as a raw material for restoration of temples and shrines [45]. However, Alaska yellow cedar has been in decline over much of its range for several decades owing to a combination of factors related to climate change including reduced snow pack that increases the risk of shallow root damage when exposed soils freeze [46,47]. Efforts are on-going to recover the population [46,47] and there is concern that wood quality, including durability of regrowth Alaska yellow cedar, might be inferior to that of old growth trees. To assess durability on a large-scale, a rapid method of assessment is required and therefore, the aim of this study was to explore relationships between the extractives content of commercially available Alaska yellow cedar and variations in resistance to fungal and termite attack using ATR-FTIR spectroscopy. Spectral data were assessed using PCA to determine if this method could be used to non-destructively establish durability classes for this species, and potentially serve as a screening tool for assessing regrowth Alaska yellow cedar.

2. Materials and Methods

2.1. Sample Origin and Preparation

Ten kiln-dried Alaska yellow cedar boards (94 mm by 144 mm by 300 mm long) were selected for study. The boards varied from quarter to flat sawn, did not include the pith, and were obtained from old growth (>100 years old) native forest trees grown on the Queen Charlotte Islands (Brooks Manufacturing, Bellingham, WA, USA). The samples represented the current commercially available resource. No obvious color differences were observed between heartwood and sapwood and there is no chemical indicator for heartwood of these species. Instead, lack of absorption of water droplets on the cross-cut surface was used as an indicator of pit occlusion resulting from heartwood formation. This approach was previously used for separating heartwood and sapwood on Port Orford cedar (Chamaecyparis lawsoniana (A.Murray bis) Parl.), a related species that also does not produce distinctly colored heartwood [48].
The boards were aligned so that 15 mm (tangential) by 90 mm (radial) by 140 mm long strips could be cut. These samples were then further cut to produce five or six 15 mm by 15 mm by 140 mm (R, T, L). Samples closest to the pith were discerned by the curvature of the growth rings. The resulting pattern allowed us to assess radial changes in heartwood characteristics while the 140 mm long samples at each radial position could be further cut to produce end-matched samples for decay and termite testing as well as extractives analysis. Samples were numbered sequentially from the pith side (R1) to bark side R6 or R7) as determined by the orientation of the growth rings with the number of samples depending on the radial dimension of the board. The subsamples were conditioned for one month at 20 ± 2 °C and 65 ± 5% relative humidity. Samples were then oven-dried (50 ± 2 °C) for 48 h and density determined according to ASTM Standard D4442-16 [49]. Low temperatures were used to minimize the possibility of extractives degradation [50]. These subsamples were cut into eight 15 mm cubes (three for exposure to two fungi in decay tests, one for FTIR, and one for extractives analysis) and three samples, 15 × 15 × 6 mm (R × T × L), for termite exposure at each radial position.

2.2. Total Extractives Analysis

A total of sixty-four 15 mm cubes (one sample/radial position/parent board) were individually ground to pass a 60-mesh screen using a model 4 Wiley mill (Arthur H. Thomas Co., Swedesboro, NJ, USA). Ground wood was sealed individually inside air-tight plastic bags that were stored in the dark at 5 °C until used in order to minimize the risk of microbial growth. Total extractives analysis was conducted using a soaking technique allowing extraction of many samples simultaneously [51]. This method was chosen instead of conventional Soxhlet extraction as prescribed in ASTM Standard D1105-96 [52] owing to the large number of extractions required. However, complete extraction may not occur, and results can only be compared between tested wood samples and not as an absolute measure of extractives content.
The ground wood powder was weighed (1.0 ± 0.05 g) and placed inside an individual fabric filter bag (Nuiby unbleached tea filter bags, 61 × 81 mm), labeled, and weighed again to obtain an initial net weight with bag. Three individual bags (replicates) were prepared for the wood powder from each radial location from the ten boards. The bags were then oven-dried at 50 ± 2 °C for 24 h and an initial oven-dried weight recorded. The samples were then sequentially extracted using toluene:ethanol (Fisher Scientific, Hampton, NH, USA, 99.9%), 95% ethanol (Fisher Scientific, Hampton, NH, USA, 99.9%), and hot water. The solvent selection was based on procedures described in ASTM Standard D1105-96 [52] for preparation of extractive free wood.
A Erlenmeyer flask (10 L) was filled with toluene:ethanol (9 L) along with the filter bags and a stir bar. The flask was then heated at 60 °C with continuous stirring for 24 h. The bags were removed, rinsed with ethanol, and oven-dried at 50 ± 2 °C for 24 h. Weight loss after extraction was recorded as the extractives content of each sample. These steps were then repeated using 95% ethanol. For hot water extraction, the bags were placed in an Erlenmeyer flask (6 L) filled with distilled water and boiled in a water bath for 6 h. The bags were removed from flasks and rinsed with distilled water, then air-dried overnight before they were oven-dried at 50 ± 2 °C for 48 h and weighed. Combined weight losses after all three extractions were recorded as the total extractives content.

2.3. Durability Assessment

2.3.1. Wood Decay Testing

Decay resistance was assessed following procedures described in AWPA Standard E30 [53]. Six Alaska yellow cedar blocks (15 mm cubes sampled consecutively in the longitudinal direction) from each radial position (three per fungus) were conditioned at 20 °C and 65% relative humidity to constant weight. Blocks (384 in total, with 3 replicates for each fungus) were then oven-dried at 50 ± 2 °C, weighed (nearest 0.01 g), and initial oven-dried weights recorded. Blocks were then placed in plastic bags and sterilized by exposure to 2.5 × 10⁻⁸ kGy of ionizing radiation from a 60Co source at the Oregon State University Radiation Center. Blocks were kept for no more than two weeks after sterilization and prior to fungal exposure.
Decay chambers were 454 mL French square glass bottles half-filled with soil dampened with water (12 mL) and a western hemlock (Tsuga heterophylla (Raf.) Sarg.) wood feeder strip (25 × 20 × 3 mm) on the soil surface. The bottles were sterilized by autoclaving at 121 °C for 45 min and allowed to cool in a fume hood overnight. A small plug (10 mm diameter) cut from the edge of an active culture of Rhodonia placenta (Fr.) Niemelä, K.H. Larss. & Schigel (isolate Madison #698, USDA Forest Products Laboratory, Madison, WI, USA) or Gloeophyllum trabeum (Pers.) Murrill (isolate Madison #617) grown in 1.5% PDA (potato-dextrose agar) was placed on one edge of the wood feeder. These fungi cause brown-rot decay and are among the principal degraders of wooden structures, especially in temperate regions [54].
The jars were incubated at 28 °C for one week for G. trabeum, or two weeks for R. placenta, to allow fungal mycelium to cover the feeder strips. A sterilized Alaska yellow cedar block from each radial location was then placed, cross section down, on the feeder strip and the jar was incubated at 28 °C for 12 weeks. Three replicate blocks from each radial location of each board were prepared for each fungus (192 blocks each). Additionally, ten blocks of non-durable ponderosa pine (Pinus ponderosa Douglas ex C. Lawson) sapwood were used as a control for each fungus. Two pine blocks were removed, oven-dried, and weighed each week starting from week 8 to monitor when average weight loss of the two blocks was greater than or equal to 50% when the test was terminated.
The blocks were removed at the end of each test, scraped clean of soil and fungal mycelium, and weighed. The blocks were then oven-dried overnight at 50 °C and weighed again. The difference between the oven-dried weight before and after test was used to determine wood weight loss. The oven-dry weight and weight of each sample at the conclusion of the decay tests was used to determine sample moisture content at that time. Decay resistance was classified using the scale described in AWPA Standard E30 [53] where 0–10% weight loss is highly resistant, 11–24% is resistant, 25–44% is moderately resistant, and >45% is non-resistant to decay.

2.3.2. Termite Testing

Termites, Reticulitermes flavipes (Kollar) (Blattodea: Rhinotermitidae), were collected from a single colony at Sam D. Hamilton Noxubee National Wildlife Refuge (Starkville, MS, USA). Logs containing termites were cut using a chainsaw and placed into 30-gallon trashcans, transported to and maintained in the laboratory at 25 °C in darkness. Termites were removed from log sections by breaking the rotting wood open and shaking the termites out of the wood through a screen on the day of test initiation. Termites were placed in plastic tubs with moistened paper towels for 2 h before being weighed.
Alaska yellow cedar blocks (15 × 15 × 6 mm) from all ten boards and radial locations were tested following a modified no-choice termite test (termites force fed on only one type of wood block and smaller test jars) described in AWPA Standard E1-16 [55]. Test containers used were cylindrical plastic containers (Pioneer Plastics 002C, 50.8 mm D × 36.5 mm H) filled with 50 g of washed, dried, screened, sterilized sand. To the sand, 9 mL of sterile deionized water was added to create a moisture content of 18%. The containers with sand and water were allowed to stand for 2 h prior to use. Wood blocks were oven-dried for 24 h at 50 °C, weighed to the nearest 0.001 g, and conditioned to room temperature before the test was initiated. Each test block was placed on top of a piece of aluminum foil on the surface of the damp sand and termites (0.3 g, approximately 150 termites including 1–3 soldiers) were added to each test container. Three replicates were used for each test, with a total of 192 blocks used. All test containers were incubated for 28 d at 24 °C and 50 ± 5% relative humidity. At the end of the test, the blocks were cleaned, and weight loss due to termite feeding was calculated based on differences between oven-dried weight before and after exposure. Since termite numbers for the testing were weighed to limit injury to individual termites, termite mortality was not assessed as a final number would have been inaccurate.

2.4. ATR-FTIR Spectroscopy

Prior to extraction, a small aliquot of ground wood from each radial location on each board was assessed using FTIR. Mid-infrared spectra in the range 4000 and 650 cm−1 were recorded in triplicate (32 scans) using an attenuated total reflectance (ATR) system with a ZnSe crystal head Smart iTR (Thermo Fisher Scientific, Waltham, MA, USA)) mounted on a Nicolet iS50 spectrometer (Thermo Scientific, USA). Spectral analysis of the powdered Alaska yellow cedar was done using OMNIC software version 9.2 (Thermo Fisher Scientific, Waltham, MA, USA)). A background spectrum was obtained every 15 min. The resulting spectra were averaged, baseline corrected (using the linear algorithm method available in the OMNIC software), and smoothed (7 pt.) prior to analysis.

2.5. Statistical Analysis

All analyses were conducted using R Studio version 1.0.136 [56]. Average fungal and termite feeding weight losses for each radius location per board were averaged and standard deviations determined.
Chemometrics analyses using PCA were performed using the R package “Chemospec” [57] on the spectral dataset. Data for these analyses were categorized as N = non-resistant (included non-resistant and moderately resistant categories owing to the small number of non-resistant samples), R = resistant, and RR = highly resistant based on the results of durability tests against G. trabeum, R. placenta, and R. flavipes.
PCA was applied to the fingerprint region (1800 to 650 cm−1) and factor loadings calculated. The highest peaks in the first, second, and third factor loadings were identified and assigned based on known bond vibrations. The resulting PC plots (as a function of the wavenumber) were analyzed visually to detect spectral regions with high positive or negative factor loadings.

3. Results and Discussion

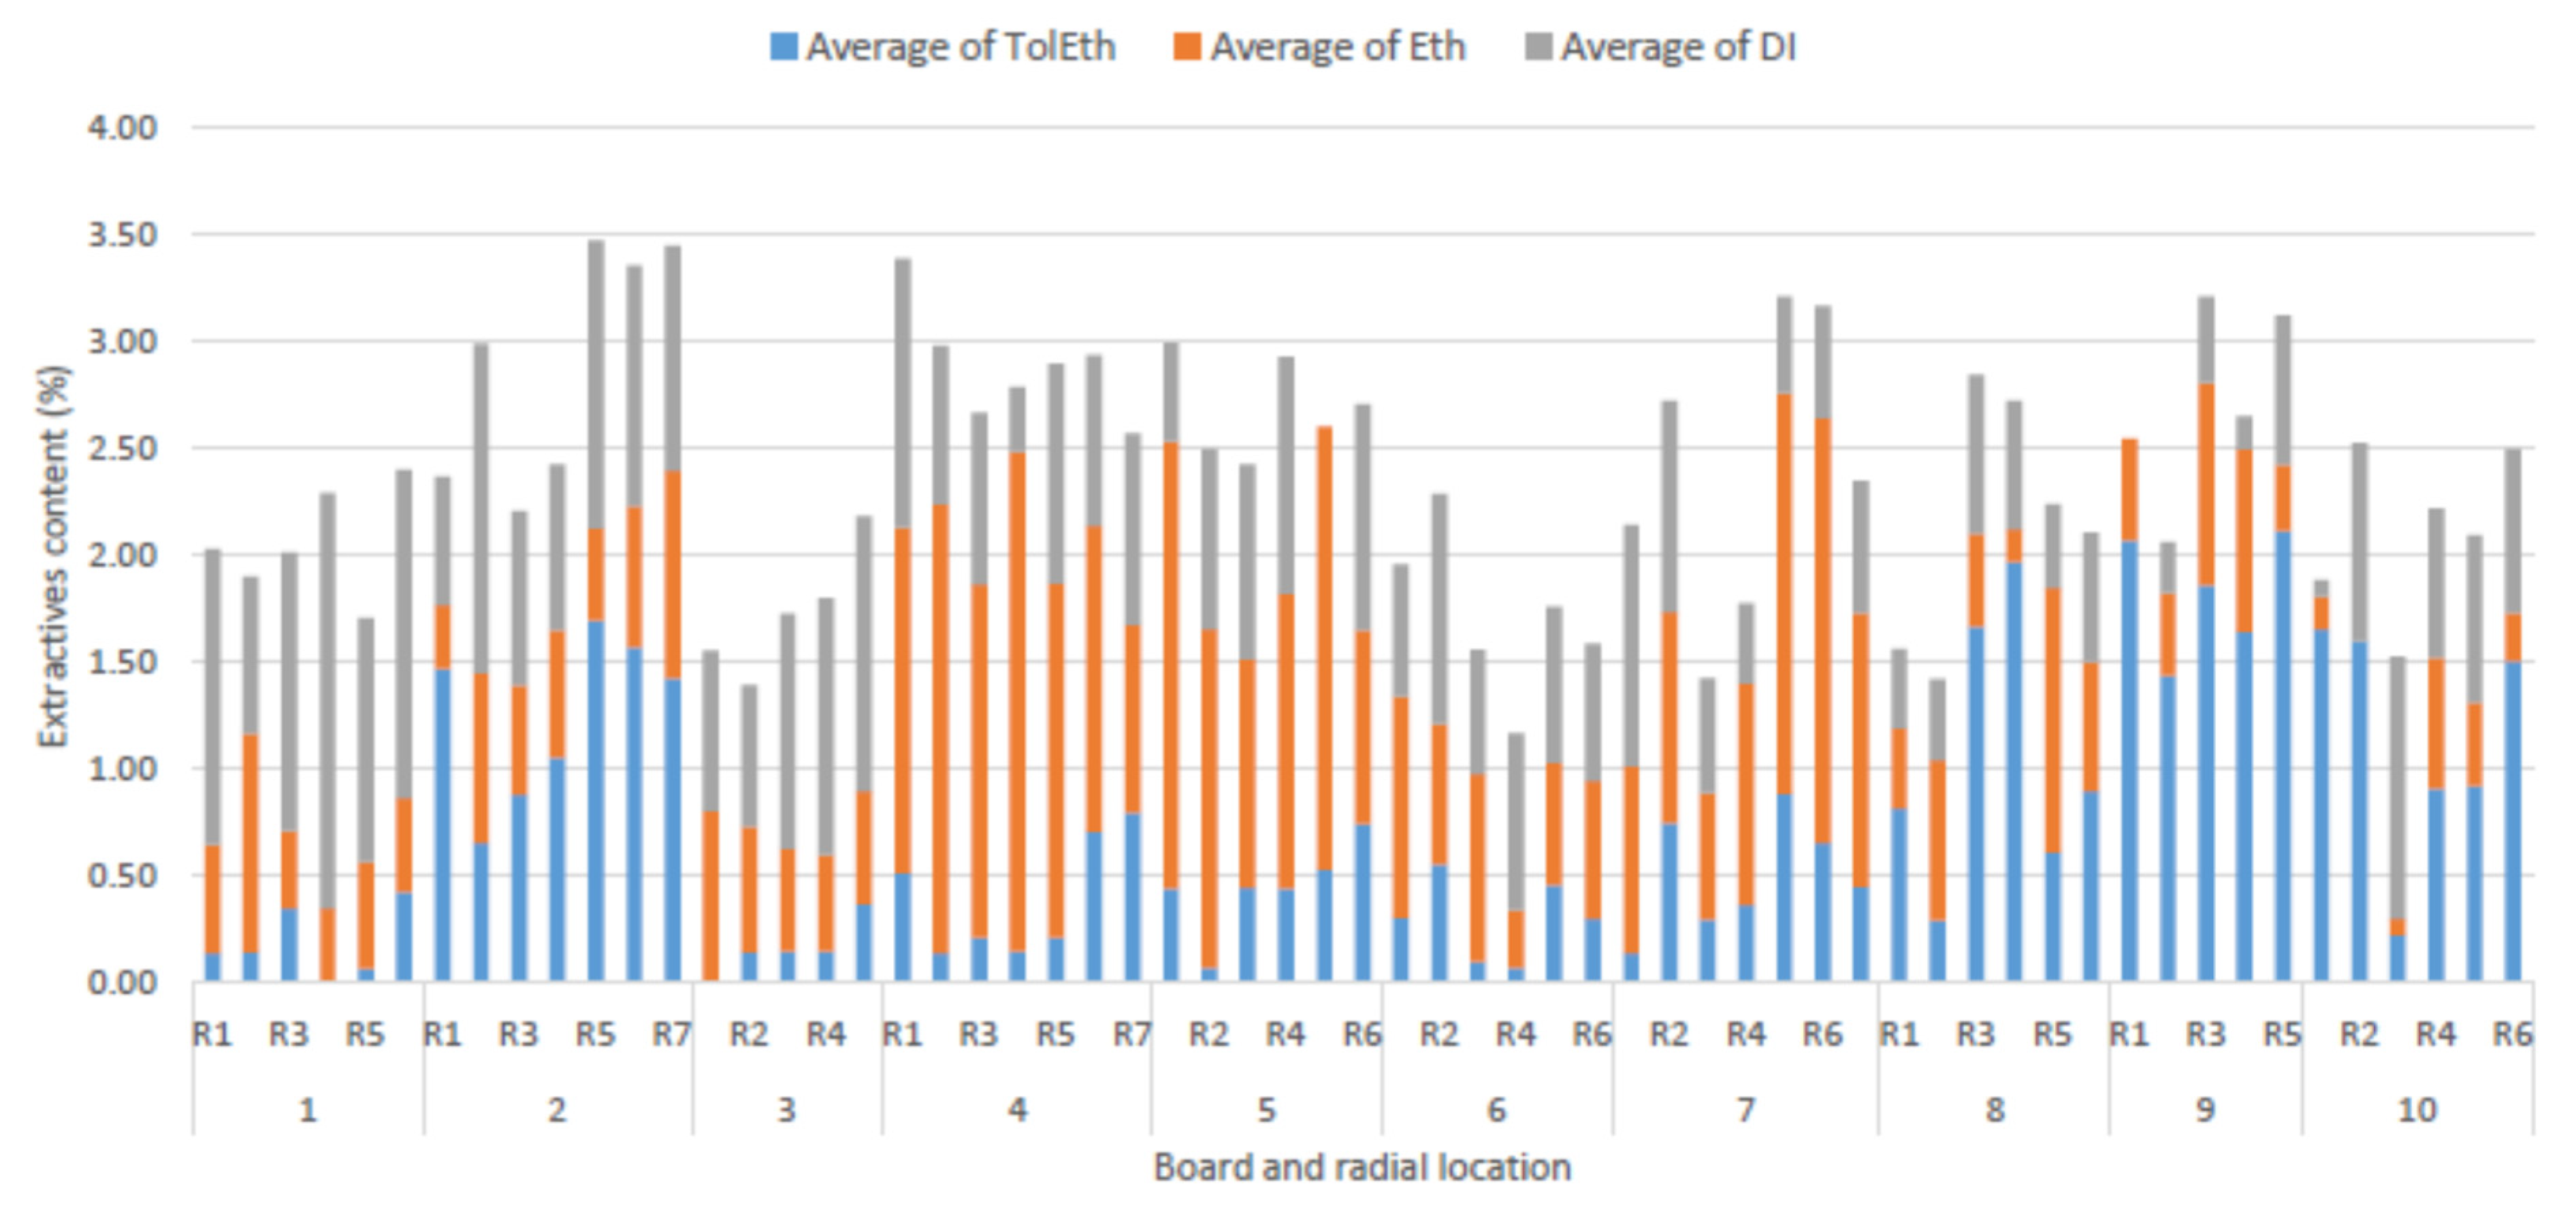
3.1. Extractives Analysis

Toluene-ethanol extracts were dark yellow, while ethanol extracts were light yellow. Total extractives content ranged from 0.84% to 3.39% of the dry weight (Figure 1). These results were lower than those from an earlier study [58] which obtained extractives yields of 4% using the same series of solvents, but with a different extraction technique (Soxhlet extraction).
Toluene-ethanol removes waxes, fats, some resins, and wood gums, while hot water removes tannins, gums, sugars, starches, and coloring matter. Ethanol extracts consist of phenolic substances, terpenoids, fats, and carbohydrates [59]. Khasawneh and Karchesy [60] examined ethanol extracts of Alaska yellow cedar using GC-MS and identified valencene-11,12-diol and kudtdiol. However, carvacrol and nootkatone were not identified, even though these compounds are usually recovered from Alaska yellow cedar heartwood essential oil obtained by either stream distillation [60] or as an ethyl acetate extract [61]. Nootkatone is highly volatile and easily degraded [62], and Soxhlet extraction might not be suitable for detecting some extractive compounds from Alaska yellow cedar.

3.2. Weight Loss to Decay Fungi and Termites

Weight losses due to fungal exposure for 12 weeks showed considerable variability in decay resistance (Table 1). G. trabeum produced higher weight losses than R. placenta, especially on boards 1, 2, 9, and 10. Board 6 was highly resistant against both fungi, with all samples having weight losses less than 5%. Weight losses due to G. trabeum showed more variability with most blocks classified as highly resistant to resistant, but a small number were only moderately resistant to non-resistant. Most of the non-durable samples came from the same boards (boards 1, 2, and 7). In previous studies on Alaska yellow cedar, R. placenta produced higher weight losses than G. trabeum [58,63]. Exposure to the eastern subterranean termites, R. flavipes showed that wood ranged from highly resistant to resistant (Table 1), except for some samples on board 1 that were moderately resistant. Board 6 was highly resistant to R. flavipes attack, consistent with the results for the fungal decay tests.
Variability in weight losses by G. trabeum, as indicated by the higher standard deviation values were observed in some of the samples, particularly those from board 2. Some of this variability was also observed on other samples exposed to G. trabeum, especially those further from the pith. Some blocks from board 1 exposed to G. trabeum, R. placenta, and R. flavipes displayed high variability (Table 1).
Durability classifications of Alaska yellow cedar samples exposed to G. trabeum or R. placenta were determined in accordance with AWPA Standard E30 [53]. Over 85% of samples exposed to R. placenta were classified as highly resistant, 10.2% resistant, 3.8% moderately resistant, and 0.4% nonresistant. Consistent with the greater weight loss observed for G. trabeum, only 69.1% of samples were classed as highly resistant. Of the remaining samples, 18.1%, 7.9%, and 4.9% were classified as resistant, moderately resistant, and non-resistant, respectively.

3.3. Relationship between Weight Loss and Extractive Content

Relationships between extractive contents and weight losses caused by G. trabeum, R. placenta, and R. flavipes were assessed using Pearson’s correlation coefficient (Figure 2). An increase in ethanol extracts indicated a moderate relationship with reduced weight loss by G. trabeum (r = −0.60), R. flavipes (r = −0.40), and R. placenta (r = −0.30). Ethanol extracts include phenolic substances and terpenoids [59] that are known to contribute to the high durability of Alaska yellow cedar [58,64,65].
Alaska yellow cedar heartwood contains nootkatone (sesquiterpene), nootkatin (tropolone), and carvacrol (terpenoid), which are insecticidal and/or fungicidal and have been used for controlling many arthropod pests [66,67]. Furthermore, Kirker et al. [58] showed significantly higher weight losses in extracted Alaska yellow cedar (extraction sequence was the same as used in this study) compared to non-extracted samples exposed to G. trabeum, R. placenta, or R. flavipes.
Poor relationships were observed between toluene:ethanol and hot water extracts and weight losses by R. placenta or R. flavipes. The moderate relationship between increases in toluene:ethanol and hot water extracts and increasing weight losses by G. trabeum (Figure 2) indicated that some of the compounds from these extracts might contribute to the wood being more susceptible to G. trabeum. Hot water extracts contain sugars and starch that are easily utilized by decay fungi [68], potentially contributing to increased weight loss by G. trabeum.

3.4. ATR-FTIR Spectra

Averaged ATR-FTIR spectra were investigated for their potential to distinguish between different durability classes of Alaska yellow cedar after exposure to G. trabeum (Figure 3a), R. placenta (Figure 3b), or R. flavipes (Figure 3c). The lack of representatives for ‘moderately durable’ and ‘non-durable’ groups (Table 1) led us to classify both as ‘non-durable’. Comparisons between averaged spectra among the three different durability classes for G. trabeum showed no clear differences or groupings in terms of intensity of absorbance between peaks of the highly resistant, resistant, and non-resistant Alaska yellow cedar (Figure 3a). Similar findings were observed in spectra representing different durability classifications for R. placenta (Figure 3b) and R. flavipes (Figure 3c).

3.5. ATR-FTIR for Identifying Alaska Yellow Cedar Durability

PCA was used for qualitative recognition of different durability groups. The spectral data (1800–650 cm−1) were examined using robust PCA as outliers were detected in the spectral data.
The first two PCs explained 98.58% of the variation in ATR-FTIR spectral data for durability against G. trabeum, with PC1 representing 98% and PC2 accounting for 0.58% of the variation (Figure 4a). Groupings within the 95% confidence interval did not clearly show any separations between the groups with all three durability classes overlapping. We observed similar PCA durability classifications for R. placenta (Figure 4b) and R. flavipes (Figure 4c) with the first two PCs explaining >97% of variation in the ATR-FTIR spectral dataset.
The loadings profiles (not shown) of the first two PCs for samples exposed to G. trabeum suggested that PC1 variation was related to the regions around 1050 cm−1 (C-O stretching in cellulose and hemicellulose) [16,69], whereas PC2 loadings showed variations mainly at 1600 cm−1 (C=C stretching or aromatic ring formation), a region associated with extractives and lignin. However, the variation associated with PC2 only made a small contribution (0.58%) to spectral data variability. The loading plot for PC1 for samples exposed to R. placenta showed that variation was mainly from 1020 cm−1, similar to the finding for G. trabeum. PC2 variations were from the 1650 cm−1 region associated with keto-carbonyl conjugated with benzene rings. PCA analyses of ATR-FTIR spectra related to resistance to R. flavipes indicated similar results to G. trabeum and R. placenta for PC1; however, PC2 loadings were caused by variation at 990 cm−1, which is indicative of C-O valence vibration of cellulose [70]. It is possible that the sensitivity of ATR-FTIR to wood particle size created pressure between the ATR-FTIR crystal tip that affected the differences seen in the 1050 cm−1 region. The use of wood powder produces homogeneous conditions; however, care must be taken to ensure that particle sizes are similar to minimize absorbance effects.
Although the PCA analysis failed to recognize different groupings based on Alaska yellow cedar resistance to the test organisms, ATR-FTIR spectra from a previous study comparing extracted and non-extracted Alaska yellow cedar suggest an influence at higher extractives levels [71]. Furthermore, ATR-FTIR spectra also showed sensitivity to carvacrol [34], one of the main biocides of Alaska yellow cedar [72,73,74]. Differences between carvacrol levels in extracted Alaska yellow cedar were detected using ATR-FTIR, but only at greater than 5% concentration [34]. None of the extractives levels in Alaska yellow cedar used in this study were at that level suggesting that this technique may be more useful for species with higher extractives levels.

4. Conclusions

Variations in extractive content and resistance to brown-rot fungi and termites were observed for the ten Alaska yellow cedar boards but the wood displayed high resistance to the tested organisms. Increased ethanol extractives levels contributed moderately to decreased weight losses by fungi and termites. The use of ATR-FTIR with PCA was unable to accurately predict Alaska yellow cedar durability. Insufficient representatives from the non-resistant and moderately resistant groups may have contributed to the poor predictions.
Despite the lack of predictive ability, infrared spectroscopy could still be applied to detect chemical compounds important to wood durability. This study showed that interpreting infrared spectra was complicated by the complex nature of individual wood components. Future studies should compare spectral and durability information of younger plantation trees with native forest samples. Younger trees might offer more variability in their durability and extractives content and these results could be used to improve the current predictive model.

Author Contributions

J.J.M. and S.L. conceived and designed the study. S.L. conducted most of the experimental analysis with S.L. and M.E.M. conducting the termite tests. A.G.M. and L.S. provided advice related to FTIR and chemometric analysis. S.L. wrote the original draft of the paper with each of the co-authors contributing to subsequent versions. All authors have read and agreed to the published version of the manuscript.

Funding

This research received no external funding.

Data Availability Statement

Data are stored at Oregon State University and will be supplied upon request.

Acknowledgments

The authors thank Brooks Manufacturing, Bellingham, WA for providing the Alaskan yellow cedar boards and Craig Bell and Shawn Cooper (FPL Starkville) for their help with the termite collection and testing.

Conflicts of Interest

The authors declare no conflict of interest.

References

  1. Hillis, W.E. Heartwood and Tree Exudates; Springer: Berlin/Heidelberg, Germany, 2011. [Google Scholar]
  2. Haupt, M.; Leithoff, H.; Meier, D.; Puls, J.; Richter, H.G.; Faix, O. Heartwood extractives and natural durability of plantation-grown teakwood (Tectona grandis L.)—A case study. Eur. J. Wood Wood Prod. 2003, 61, 473–474. [Google Scholar] [CrossRef]
  3. França, F.J.N.; França, T.S.F.A.; Arango, R.M.; Woodward, B.M.; Vidaurre, G.B. Variation in natural durability of seven Eucalyptus grandis × Eucalyptus hybrid clones. For. Prod. J. 2017, 67, 230–235. [Google Scholar]
  4. Scheffer, T.C.; Cowling, E.B. Natural resistance of wood to microbial deterioration. Annu. Rev. Phytopathol. 1966, 4, 147–168. [Google Scholar] [CrossRef]
  5. Nault, J. Radial distribution of thujaplicins in old growth and second growth western red cedar (Thuja plicata Donn). Wood Sci. Technol. 1988, 22, 73–80. [Google Scholar] [CrossRef]
  6. Gierlinger, N.; Wimmer, R. Radial distribution of heartwood extractives and lignin in mature European larch. Wood Fiber Sci. 2004, 36, 387–394. [Google Scholar]
  7. Lukmandaru, G.; Takahashi, K. Radial distribution of quinones in plantation teak (Tectona grandis L.f.). Ann. For. Sci. 2009, 66, 605. [Google Scholar] [CrossRef] [Green Version]
  8. Hashida, K.; Tabata, M.; Kuroda, K.; Otsuka, Y.; Kubo, S.; Makino, R.; Kubojima, Y.; Tonosaki, M.; Ohara, S. Phenolic extractives in the trunk of Toxicodendron vernicifluum: Chemical characteristics, contents and radial distribution. J. Wood Sci. 2014, 60, 160–168. [Google Scholar] [CrossRef]
  9. Anderson, A.B.; Scheffer, T.; Duncan, C.G. The chemistry of decay resistance and its decrease with heartwood aging in incense cedar (Libocedrus decurrens Torrey). Holzforschung 1963, 17, 1–5. [Google Scholar] [CrossRef]
  10. Dizhbite, T. Characterization of the radical scavenging activity of lignins—Natural antioxidants. Bioresour. Technol. 2004, 95, 309–317. [Google Scholar] [CrossRef]
  11. Gao, H.; Shupe, T.F.; Eberhardt, T.L.; Hse, C.Y. Antioxidant activity of extracts from the wood and bark of Port Orford cedar. J. Wood Sci. 2007, 53, 147–152. [Google Scholar] [CrossRef]
  12. AWPA. E10-16 Laboratory method for evaluating the decay resistance of wood-based materials against pure basidiomycete cultures: Soil/block test. In Annual Book of AWPA Standards; American Wood Protection Association: Birmingham, AL, USA, 2017; pp. 402–413. [Google Scholar]
  13. AWPA. E7-15 Standard field test for evaluation of wood preservatives to be used in ground contact (UC4a, UC4b, UC4c): Stake test. In Annual Book of AWPA Standards; American Wood Protection Association: Birmingham, AL, USA, 2015; p. 10. [Google Scholar]
  14. Stirling, R. Natural durability classification systems used around the world. In Proceedings of the IRG Annual Meeting, Beijing, China, 24–28 May 2009; IRG/WP 09-10694. International Research Group on Wood Protection: Stockholm, Sweden, 2009. [Google Scholar]
  15. Miller, R.B.; Wiedenhoeft, A.C.; Williams, R.S.; Stockman, W.; Green, F. Characteristics of ten tropical hardwoods from certified forests in Bolivia. Part II, Natural durability to decay fungi. Wood Fiber Sci. 2003, 35, 429–433. [Google Scholar]
  16. Pandey, K.K. A study of chemical structure of soft and hardwood and wood polymers by FTIR spectroscopy. J. Appl. Polym. Sci. 1999, 71, 1969–1975. [Google Scholar] [CrossRef]
  17. So, C.-L.; Via, B.K.; Groom, L.H.; Schimleck, L.R.; Shupe, T.F.; Kelley, S.S.; Rials, T.G. Near infrared spectroscopy in the forest products industry. For. Prod. J. 2004, 54, 6–16. [Google Scholar]
  18. Tsuchikawa, S.; Schwanninger, M. A review of recent near-infrared research for wood and paper (Part 2). Appl. Spectrosc. Rev. 2013, 48, 560–587. [Google Scholar] [CrossRef]
  19. Lipeh, S.; Schimleck, L.R.; Mankowski, M.E.; McDonald, A.G.; Morrell, J.J. Relationship between attenuated total reflectance Fourier transform infrared spectroscopy of western juniper and natural resistance to fungal and termite attack. Holzforschung 2020, 74, 246–259. [Google Scholar] [CrossRef]
  20. Ajuong, E.M.; Breese, M.C. Fourier transform infrared characterization of Pai wood (Afzelia africana Smith) extractives. Holz Roh Werkst. 1998, 56, 139–142. [Google Scholar] [CrossRef]
  21. Schwanninger, M.; Hinterstoisser, B. Determination of the lignin content in wood by FT-NIR. In Proceedings of the 11th ISWPC, International Symposium on Wood and Pulping Chemistry, Nice, France, 11–14 June 2001; pp. 641–644. [Google Scholar]
  22. Jones, R.W.; Meglen, R.R.; Hames, B.R.; McClelland, J.F. Chemical analysis of wood chips in motion using thermal-emission mid-infrared spectroscopy with projection to latent structures regression. Anal. Chem. 2002, 74, 453–457. [Google Scholar] [CrossRef] [PubMed]
  23. Hodge, G.R.; Woodbridge, W.C. Use of near infrared spectroscopy to predict lignin content in tropical and sub-tropical pines. J. Near Infrared Spectrosc. 2004, 12, 381–390. [Google Scholar] [CrossRef]
  24. Poke, F.S.; Raymond, C.A. Predicting extractives, lignin, and cellulose contents using near infrared spectroscopy on solid wood in Eucalyptus globulus. J. Wood Chem. Technol. 2006, 26, 187–199. [Google Scholar] [CrossRef]
  25. Schimleck, L.R.; Evans, R. Estimation of wood stiffness of increment cores by near infrared spectroscopy: The development and application of calibrations based on selected cores. IAWA J. 2002, 23, 217–224. [Google Scholar] [CrossRef]
  26. Meder, R.; Gallagher, S.; Mackie, K.L.; Böhler, H.; Meglen, R.R. Rapid determination of the chemical composition and density of Pinus radiata by PLS modelling of transmission and diffuse reflectance FTIR spectra. Holzforschung 1999, 53, 261–266. [Google Scholar] [CrossRef]
  27. Kelley, S.S.; Rials, T.G.; Snell, R.; Groom, L.H.; Sluiter, A. Use of near infrared spectroscopy to measure the chemical and mechanical properties of solid wood. Wood Sci. Technol. 2004, 38, 257–276. [Google Scholar] [CrossRef]
  28. Schimleck, L.R.; Rezende, G.D.; Demuner, B.J.; Downes, G.M. Estimation of whole-tree wood quality traits using near infrared spectra from increment cores. Appita J. 2006, 59, 231–236. [Google Scholar]
  29. Gierlinger, N.; Jacques, D.; Schwanninger, M.; Wimmer, R.; Hinterstoisser, B.; Pâques, L.E. Rapid prediction of natural durability of larch heartwood using Fourier transform near-infrared spectroscopy. Can. J. For. Res. 2003, 33, 1727–1736. [Google Scholar] [CrossRef]
  30. Sykacek, E.; Gierlinger, N.; Wimmer, R.; Schwanninger, M. Prediction of natural durability of commercial available European and Siberian larch by near-infrared spectroscopy. Holzforschung 2006, 60, 643–647. [Google Scholar] [CrossRef]
  31. Stirling, R.; Trung, T.; Breuil, C.; Bicho, P. Predicting wood decay and density using NIR spectroscopy. Wood Fiber Sci. 2007, 39, 414–423. [Google Scholar]
  32. Stirling, R.; Morris, P.I.; Grace, J.K. Prediction of the decay and termite resistance of western red cedar heartwood. For. Prod. J. 2015, 65, 84–92. [Google Scholar] [CrossRef] [Green Version]
  33. Li, Y.; Altaner, C. Predicting extractives content of Eucalyptus bosistoana F. Muell. heartwood from stem cores by near infrared spectroscopy. Spectrochim. Acta Part A Mol. Biomol. Spectrosc. 2018, 198, 78–87. [Google Scholar] [CrossRef] [PubMed]
  34. Lipeh, S.; Schimleck, L.R.; Morrell, J.J. Determination of carvacrol content in Alaska yellow cedar (Callitropsis nootkatensis) extractives. Bioresources 2019, 14, 9928–9944. [Google Scholar]
  35. Gierlinger, N.; Schwanninger, M.; Hinterstoisser, B.; Wimmer, R. Rapid determination of heartwood extractives in Larix sp by means of Fourier transform near infrared spectroscopy. J. Near Infrared Spectrosc. 2002, 10, 203–214. [Google Scholar] [CrossRef]
  36. Schimleck, L.R.; Michell, A.J.; Vinden, P. Eucalypt wood classification by NIR spectroscopy and principal components analysis. Appita J. 1996, 49, 319–324. [Google Scholar]
  37. Martin, M.; Martin, F.L. Identifying variables responsible for clustering in discriminant analysis of data from infrared microspectroscopy of a biological sample. J. Comput. Biol. 2007, 14, 1176–1184. [Google Scholar] [CrossRef]
  38. Toscano, G.; Rinnan, A.; Pizzi, A.; Mancini, M. The use of near-infrared (NIR) spectroscopy and principal component analysis (PCA) to discriminate bark and wood of the most common species of the pellet sector. Energy Fuels 2017, 31, 2814–2821. [Google Scholar] [CrossRef]
  39. Meder, R.; Thumm, A.; Bier, H. Veneer stiffness predicted by NIR spectroscopy calibrated using mini-LVL test panels. Holz Roh Werkst. 2002, 60, 159–164. [Google Scholar] [CrossRef]
  40. Nascimbem, L.B.L.R.; Rubini, B.R.; Poppi, R.J. Determination of quality parameters in moist wood chips by near infrared spectroscopy combining PLS-DA and Support Vector Machines. J. Wood Chem. Technol. 2013, 33, 247–257. [Google Scholar] [CrossRef]
  41. Harris, A.S. Chamaecyparis nootkatensis (D.Don) Spach, Alaska-cedar. In Silvics of North America; Burns, R.M., Honkala, B.H., Eds.; Technical Coordinators, Conifers, Agriculture, Handbook 654; USDA-FS: Washington, DC, USA, 1990; Volume 1, pp. 97–102. [Google Scholar]
  42. Sturrock, R.N. Phellinus weirii and other fungi causing decay in western redcedar and yellow-cedar. In A Tale of Two Cedars—International Symposium on Western Red Cedar and Yellow-Cedar; USDA-FS: Portland, OR, USA, 2010. [Google Scholar]
  43. Kelsey, R.G.; Hennon, P.E.; Huso, M.; Karchesy, J.J. Changes in heartwood chemistry of dead yellow-cedar trees that remain standing for 80 years or more in southeast Alaska. J. Chem. Ecol. 2005, 31, 2653–2670. [Google Scholar] [CrossRef] [PubMed] [Green Version]
  44. Karchesy, J.J.; Kelsey, R.G.; González-Hernández, M.P. Yellow-cedar, Callitropsis (Chamaecyparis) nootkatensis, secondary metabolites, biological activities, and chemical ecology. J. Chem. Ecol. 2018, 44, 510–524. [Google Scholar] [CrossRef] [PubMed]
  45. Jozsa, L.A. Yellow cypress wood quality and the hinoki connection. In Yellow Cypress: Can We Grow It? Can We Sell It? Lousier, J.D., Ed.; Forestry Canada British Columbia Ministry of Forests: Victoria, BC, Canada, 1991; pp. 9–12. [Google Scholar]
  46. Hennon, P.E.; Shaw, C.G.; Hansen, E.M. Dating decline and mortality of Chamaecyparis nootkatensis in southeast Alaska. For. Sci. 1990, 36, 502–515. [Google Scholar]
  47. Beier, C.M.; Sink, S.E.; Hennon, P.E.; D’Amore, D.V.; Juday, G.P. Twentieth-century warming and the dendroclimatology of declining yellow-cedar forests in southeastern Alaska. Can. J. For. Res. 2008, 38, 1319–1334. [Google Scholar] [CrossRef] [Green Version]
  48. Ajuong, E.; Freitag, C.; Morrell, J.J. Decay resistance and extractive content of second growth Port Orford cedar (Chamaecyparis lawsoniana) wood. Wood Fiber Sci. 2014, 46, 502–509. [Google Scholar]
  49. ASTM. D4442-16 Standard test methods for direct moisture content measurement of wood and wood-based materials. In ASTM Annual Book of Standards; ASTM International: West Conshohocken, PA, USA, 2017; pp. 415–420. [Google Scholar]
  50. Scheffer, T.C. Microbiological degradation and the causal organisms; Degradation and protection of wood. In Wood Deterioration and Its Prevention by Preservative Treatment; Nicholas, D.D., Ed.; Syracuse University Press: Syracuse, NY, USA, 1973; Volume 1, pp. 31–106. [Google Scholar]
  51. Taylor, A.M.; Gartner, B.L.; Morrell, J.J.; Tsunoda, K. Effects of heartwood extractive fractions of Thuja plicata and Chamaecyparis nootkatensis on wood degradation by termites or fungi. J. Wood Sci. 2006, 52, 147–153. [Google Scholar] [CrossRef]
  52. ASTM. D1105-96 Standard test method for preparation of extractive free wood. In ASTM Annual Book of Standards; ASTM International: West Conshohocken, PA, USA, 2017; pp. 151–152. [Google Scholar]
  53. AWPA. E30-16 Standard method for evaluating natural decay resistance of wood using laboratory decay tests. In Annual Book of AWPA Standards; American Wood Protection Association: Birmingham, AL, USA, 2019; pp. 490–493. [Google Scholar]
  54. Duncan, C.G.; Lombard, F.F. Fungi Associated with Principal Decays in Wood Products in the United States; USDA-FS Research Paper WO-4; USDA-FS: Washington, DC, USA, 1965.
  55. AWPA. E1-16 Laboratory method for evaluating the termite resistance of wood-based materials: Choice and no-choice tests. In Annual Book of AWPA Standards; American Wood Protection Association: Birmingham, AL, USA, 2017; pp. 375–380. [Google Scholar]
  56. RStudio. RStudio: Integrated Development for R; RStudio: Boston, MA, USA, 2016; Available online: http://www.rstudio.com/ (accessed on 24 August 2018).
  57. Hanson, B.A. ChemoSpec: An R Package for Chemometric Analysis of Spectroscopic Data (Package Version 4.4.85). 2017. Available online: https://mran.microsoft.com/snapshot/2017-08-06/web/packages/ChemoSpec/vignettes/ChemoSpec.pdf (accessed on 24 August 2018).
  58. Kirker, G.T.; Blodgett, A.B.; Arango, R.A.; Lebow, P.K.; Clausen, C.A. The role of extractives in naturally durable wood species. Int. Biodeterior. Biodegrad. 2013, 82, 53–58. [Google Scholar] [CrossRef]
  59. Sjöström, E. Wood Chemistry, 2nd ed.; Academic Press: San Diego, CA, USA, 1993; pp. 90–108. [Google Scholar]
  60. Khasawneh, M.A.; Karchesy, J.J. Terpenoids of the heartwood of Chamaecyparis nootkatensis. Am. J. Org. Chem. 2011, 1, 1–5. [Google Scholar] [CrossRef]
  61. Kelsey, R.; González-Hernández, M.; Karchesy, J.; Veluthoor, S. Volatile terpenoids and tropolones in heartwood extracts of yellow-cedar, Monterey cypress, and their hybrid Leyland cypress. Ann. For. Sci. 2015, 72, 349–355. [Google Scholar] [CrossRef]
  62. Bharadwaj, A.; Stafford, K.C.; Behle, R.W. Efficacy and environmental persistence of nootkatone for the control of the blacklegged tick (Acari: Ixodidae) in residential landscapes. J. Med. Entomol. 2012, 49, 1035–1044. [Google Scholar] [CrossRef]
  63. De Groot, R.C.; Woodward, B.; Hennon, P.E. Natural decay resistance of heartwood from dead, standing yellow-cedar trees: Laboratory evaluations. For. Prod. J. 2000, 50, 53–59. [Google Scholar]
  64. Grace, J.K.; Yamamoto, R.T. Natural resistance of Alaska-cedar, redwood, and teak to Formosan subterranean termites. For. Prod. J. 1994, 44, 41–45. [Google Scholar]
  65. Arango, R.A.; Green, F.; Hintz, K.; Lebow, P.K.; Miller, R.B. Natural durability of tropical and native woods against termite damage by Reticulitermes flavipes (Kollar). Int. Biodeterior. Biodegrad. 2006, 57, 146–150. [Google Scholar] [CrossRef]
  66. Rao, A.; Zhang, Y.; Muend, S.; Rao, R. Mechanism of antifungal activity of terpenoid phenols resembles calcium stress and inhibition of the TOR pathway. Antimicrob. Agents Chemother. 2010, 54, 5062–5069. [Google Scholar] [CrossRef] [Green Version]
  67. Panella, N.A.; Dolan, M.C.; Karchesy, J.J.; Xiong, Y.; Peralta-Cruz, J.; Khasawneh, M.A.; Montenieri, J.A.; Maupin, G.O. Use of novel compounds for pest control: Insecticidal and acaricidal activity of essential oil components from heartwood of Alaska yellow cedar. J. Med. Entomol. 2018, 42, 352–358. [Google Scholar] [CrossRef]
  68. Zabel, R.A.; Morrell, J.J. Wood Microbiology: Decay and Its Prevention, 2nd ed.; Academic Press: San Diego, CA, USA, 1992; p. 556. [Google Scholar]
  69. Kuo, M.; McClelland, J.F.; Luo, S.; Chien, P.-L.; Walker, R.D.; Hse, C.-Y. Applications of infrared photoacoustic spectroscopy for wood samples. Wood Fiber Sci. 2007, 20, 132–145. [Google Scholar]
  70. Xu, F.; Yu, J.; Tesso, T.; Dowell, F.; Wang, D. Qualitative and quantitative analysis of lignocellulosic biomass using infrared techniques: A mini-review. Appl. Energy 2013, 104, 801–809. [Google Scholar] [CrossRef] [Green Version]
  71. Lipeh, S.; Morrell, J.J. Rapid detection of the Alaska yellow cedar, Callitropsis nootkatensis (Cupressaceae) extractives using Fourier transform infrared (FT-IR) spectroscopy. In Proceedings of the IRG Annual Meeting, Ghent, Belgium, 4–8 June 2017; IRG/WP 17-20612. International Research Group on Wood Protection: Stockholm, Sweden, 2017. [Google Scholar]
  72. Kondal, S.; Cakir, A.; Ozer, H.; Cakmakei, R.; Kesdak, M.; Mete, E. Antifungal, phytotoxic and insecticidal properties of essential oils isolated from Turkish Origenum acutidens and its three components, carvacrol, thymol and p-cymene. Bioresour. Technol. 2008, 99, 8788–8795. [Google Scholar]
  73. Xie, Y.; Wang, K.; Huang, Q.; Lei, C. Evaluation of toxicity of monoterpenes to subterranean termites, Reticulitermes chinensis Snyder. Ind. Crops Prod. 2014, 53, 163–166. [Google Scholar] [CrossRef]
  74. Zhang, Z.; Yang, T.; Mi, N.; Wang, Y.; Li, G.; Wang, L.; Xi, Y. Antifungal activity of monoterpenes against wood white-rot fungi. Int. Biodeterior. Biodegrad. 2016, 106, 157–160. [Google Scholar] [CrossRef]
Figure 1. Extractives content (%) from ten boards (1–10) of Alaska yellow cedar radially from near the pith (R1) to bark (R6 or R7) after sequential extraction using toluene:ethanol 1:2 (TolEth), ethanol (Eth), and hot water (DI). Each value represents the average oven dry weight for three extractions.
Forests 12 01692 g001
Figure 2. Relationship between weight losses (%) caused by exposure to (a). G. trabeum (Gt), (b). R. placenta (Pp), and (c). R. flavipes (Rf) and extractive yield using three different solvents: hot water (bottom), ethanol (middle), and toluene-ethanol (top).
Forests 12 01692 g002
Figure 3. Representative FT-IR spectra in the range 4000–650 cm−1 for Alaska yellow cedar samples according to durability classifications established by exposure to (a) G. trabeum, (b) R. placenta, and (c) R. flavipes. Green = highly resistant, blue = resistant, red = non-resistant.
Forests 12 01692 g003
Figure 4. PCA with (a) PC1 vs. PC2 scores plotted using robust PCA techniques for the different durability classes against G. trabeum, (b) R. placenta, and (c) R. flavipes. Solid lines on the PC1 vs. PC2 plot indicate the 95% confidence interval for each group. N = non-resistant (red), R = resistant (blue), RR = highly resistant (green).
Forests 12 01692 g004
Table 1. Average total extractives content and weight losses of Alaska yellow cedar samples exposed to the G. trabeum, R. placenta, or R. flavipes.
BoardRadialExtractives
Content (%) (n = 3)
Weight Loss (%)
G. trabeum (n = 9)R. placenta (n = 9)R. flavipes (n = 9)
1R11.96 (0.44)12.29 (9.70)1.18 (0.86)15.32 (4.00)
R21.83 (0.36)6.53 (6.48)2.01 (0.76)16.85 (1.98)
R31.94 (0.67)18.41 (3.69)1.01 (0.09)18.10 (0.41)
R41.94 (0.23)11.97 (2.77)1.03 (0.11)15.11 (6.99)
R51.13 (1.30)17.10 (14.14)3.02 (2.87)26.21 (15.34)
R62.10 (0.15)37.58 (28.73)19.01 (19.38)33.33 (17.54)
2R12.37 (0.76)28.73 (30.74)17.26 (0.62)18.17 (2.28)
R22.99 (0.42)17.42 (18.79)8.96 (1.58)8.38 (3.41)
R32.21 (0.37)16.19 (20.50)4.80 (3.63)9.32 (2.66)
R42.43 (0.44)15.37 (13.35)5.47 (4.06)9.99 (0.66)
R52.81 (3.39)12.91 (17.70)5.49 (2.21)9.48 (4.22)
R62.84 (3.59)18.78 (25.77)8.36 (1.97)12.78 (1.70)
R72.45 (3.73)12.74 (17.45)17.17 (15.43)10.85 (2.16)
3R11.48 (0.88)0.85 (0.04)4.94 (0.50)6.70 (2.84)
R21.17 (0.62)1.24 (0.38)11.87 (9.12)18.87 (1.76)
R31.69 (0.49)8.23 (10.51)9.17 (12.25)14.35 (0.69)
R41.80 (1.18)10.89 (12.11)0.62 (0.35)14.88 (0.34)
R51.17 (0.49)0.50 (0.08)0.73 (0.31)19.71 (3.01)
R60.84 (0.60)0.88 (0.33)1.07 (0.24)17.85 (0.55)
R72.18 (0.13)0.99 (0.44)1.34 (0.30)12.35 (0.60)
4R13.39 (1.23)3.44 (0.70)3.82 (0.29)5.07 (1.00)
R22.76 (0.47)3.42 (0.33)3.75 (0.91)11.81 (2.21)
R32.59 (0.36)2.26 (0.00)9.06 (0.00)6.65 (6.59)
R42.64 (0.56)3.96 (1.05)6.10 (4.82)5.26 (1.39)
R52.90 (0.50)2.31 (0.66)4.43 (1.81)7.85 (2.09)
R62.94 (0.55)2.20 (0.90)2.23 (0.63)8.10 (1.29)
R72.57 (0.51)2.76 (0.06)4.15 (1.54)6.29 (2.43)
5R12.99 (0.31)0.15 (4.39)0.34 (1.87)14.21 (3.18)
R22.50 (0.57)−1.10 (3.51)−0.53 (0.91)10.99 (2.83)
R32.43 (0.41)0.86 (3.83)−0.52 (1.06)12.37 (0.93)
R42.93 (0.35)3.21 (1.02)−0.25 (2.67)13.68 (2.07)
R52.60 (0.11)0.39 (1.93)−0.97 (1.59)12.50 (2.71)
R62.71 (0.19)5.22 (12.11)−0.21 (1.89)10.38 (0.80)
6R11.89 (0.98)1.01 (0.89)0.99 (0.86)1.06 (0.92)
R22.22 (0.91)0.61 (0.53)0.87 (0.77)2.57 (1.03)
R31.17 (0.49)1.12 (0.97)0.95 (0.82)1.38 (1.35)
R40.84 (0.60)1.95 (0.36)1.49 (0.16)1.49 (0.13)
R51.82 (0.50)1.50 (0.09)1.79 (0.13)2.31 (1.66)
R61.59 (0.80)2.02 (0.10)1.38 (0.13)1.31 (1.27)
7R11.92 (0.40)33.62 (26.34)11.40 (14.02)10.74 (2.59)
R22.72 (0.04)26.95 (20.26)7.93 (7.27)12.51 (1.89)
R31.20 (0.38)31.59 (39.52)8.36 (8.37)10.01 (0.43)
R41.78 (0.80)27.07 (33.63)6.22 (5.20)7.19 (3.38)
R53.21 (0.39)14.13 (15.63)5.66 (3.87)3.38 (1.98)
R63.17 (0.66)12.75 (11.86)7.60 (6.79)10.04 (2.78)
R72.35 (0.38)N/a6.17 (4.37)7.15 (1.40)
8R11.27 (1.10)1.22 (0.23)1.52 (0.43)6.40 (1.89)
R21.20 (0.90)0.30 (0.26)4.55 (1.19)5.62 (1.00)
R32.69 (0.27)−0.76 (3.13)3.15 (1.89)4.15 (0.92)
R42.14 (0.73)1.54 (0.24)1.74 (0.21)7.26 (3.76)
R52.24 (0.52)1.50 (0.22)1.62 (0.14)6.01 (4.90)
R62.11 (0.33)1.82 (0.27)1.43 (0.38)5.61 (2.34)
9R12.15 (0.45)13.72 (12.81)0.46 (0.61)21.44 (2.19)
R23.10 (0.22)−1.20 (1.43)1.00 (0.72)6.47 (0.99)
R32.90 (1.01)21.22 (5.77)1.22 90.60)38.62 (4.15)
R42.65 (0.48)6.26 (8.82)1.00 (0.79)8.43 (1.57)
R53.12 (0.83)10.94 (6.48)12.22 (8.21)25.90 (2.85)
R6N/a19.82 (3.41)16.85 (11.63)30.59 (3.72)
10R11.80 (0.30)13.72 (12.81)0.46 (0.61)3.29 (0.86)
R22.14 (0.64)−1.20 (1.43)1.00 (0.72)5.38 (1.36)
R31.37 (0.22)21.22 (5.77)1.22 (0.60)7.45 (1.64)
R42.22 (0.48)6.26 (8.82)1.00 (0.79)3.75 (0.88)
R52.09 (0.22)10.94 (6.48)12.22 (8.21)6.89 (0.22)
R72.34 (0.62)19.82 (3.41)16.85 (11.63)4.39 (1.60)
Publisher’s Note: MDPI stays neutral with regard to jurisdictional claims in published maps and institutional affiliations.

