Article

Directional Variability in Response of Pinus koraiensis Radial Growth to Climate Change

1
School of Forestry, Northeast Forestry University, Harbin 150000, China
2
Mills College, Oakland, CA 94613, USA
*
Author to whom correspondence should be addressed.
Forests 2021, 12(12), 1684; https://doi.org/10.3390/f12121684
Submission received: 5 November 2021 / Revised: 30 November 2021 / Accepted: 30 November 2021 / Published: 1 December 2021
(This article belongs to the Section Forest Ecology and Management)

Abstract

:
Climate change affects forest ecosystems at a variety of scales, from the composition of landscapes to the growth of individual trees. Research across regions and tree species has produced contradictory findings on the effects of climate variables on radial growth. Here, we examine tree ring samples taken from four directions of a tree to determine whether there is directional variability in tree growth in relation to climate trends. The results showed directional differences in the temporal growth processes of Pinus koraiensis, with more commonalities between the west and north directions and between the east and south directions. The contemporaneous June maximum temperature was the main climate factor associated with the difference between the growth of tree rings toward the east or west. Annual tree ring growth toward the east was more affected by the year’s temperature while growth toward the south was more sensitive to the year’s precipitation. Our research demonstrates that diverse response of tree growth to climate may exist at intra-individual scale. This contributes to understanding the sensitivity of tree growth to climate change at differ scales.

1. Introduction

Forests are under great pressure with climate change [1], but little is known about how forests have responded to the continuous warming since the latter half of the last century [2]. Babst et al. (2018) [3] called for more research on the growth–climate relationship in order to improve the ecological knowledge of individual vulnerability to climate stress, expand the chronological scale of trees, and increase the contribution of assessing the impact of climate on forests. Understanding the impact of global warming on tree growth at various scales is essential for assessing forest structure, function, and dynamics [4].
Tree rings have long been used to explore the relationship between tree radial growth and climate factors, providing accurate measurements of annual diameter growth as well as climate indicators keyed to specific years [5,6]. The use of tree rings to analyze the impact of climate change on tree growth was originally limited to single-site studies, but more recent work based on multi-site sampling has found spatial differences in the response of tree growth to climate variables [7,8]. Traditional dendrochronological research usually amplifies the climate signal in tree growth and filters out differences in tree growth caused by other factors such as age, diameter class, and competitive pressure [9]. This has made it difficult to understand how the variability in growth response to climate is affected by these other factors. The quantification of tree species vulnerability to stress factors such as climate change must recognize that individuals, not forests, respond to climate [10]. With these issues in mind, recent studies have paid more attention to the effects of non-climate factors such as age, competition, size, or soil conditions on the response of individual tree growth to climate [11,12,13].
Obvious differences in the growth–climate response between trees of same species may be due to competition, microsite variation (soil depth, soil moisture, wind, insolation), age, size, crown width, physical damage, or asynchronous masting [14,15,16,17]. However, prior studies at scales of individual trees, stands, or landscapes are based on the assumption that there are no directional differences in the growth and the growth–climate response within individual trees. Few researchers have examined intra-individual growth variability. Recently, several studies considering the response of radial growth to climate variables found evidence of height effects [18,19,20,21] and some studies document the growing evidence of direction-specific radial growth for several shrub species [22,23,24]. Fang et al. (2015) [25] examined directional growth of trees (Pinus tabuliformis and Picea purpurea) near summits and cliffs within the semi-arid Chinese Loess Plateau, finding that tree cores taken from the south showed greater sensitivity to drought. While Gut et al. (2019) [26] failed to find a directional effect in trees (e.g., Pinus sylvestris, Picea abies, and Quercus robur), they only examined tree ring data in the east and south directions. No other studies have looked for direction-specific climate–growth relationships in trees from all directions. To evaluate these varying results, we conducted an expanded analysis on intra-individual scales at four main directions (east, west, north, and south) of Pinus koraiensis Siebold et Zuccarini. P. koraiensi is distributed in northeast Asia. It forms a broad-leaved Pinus koraiensis forest with other broad-leaved tree species, which is a typical zonal and climax vegetation type in in temperate regions of northeast Asia [27].
We speculate that the directional growth and response to climate may be heterogeneous because of the variation in each direction of crown width, number of neighbors, growth of underground roots, and microclimate. In this paper, we use the core of each tree in four directions in a flat plot to research the following questions: (1) Is there any difference in four directions’ tree-ring time series of single tree? (2) Is there any difference in growth–climate response of individuals at different directions? (3) Do non-climate factors regulate the climate–growth relationship and temporal growth process?

2. Materials and Methods

2.1. Tree Rings and Climate Data

The study area is situated in the Mudanfeng Nature Reserve (129.82° E, 44.40° N) of Mudanjiang City, Heilongjiang Province, China, which belongs to the temperate continental monsoon climate (Figure 1). We delineated a study plot of 50 × 50 m2 in a natural forest setting, with slope and aspect of 3° toward the northeast. The dominant tree species in the plot is P. koraiensis, with subdominant tree species including Juglans mandshurica, Tilia amurensis, Fraxinus mandshurica, and Phellodendron amurense. We took cores from four directions for all P. koraiensis with diameter at breast height (DBH) above 10 cm. In addition, DBH, tree height, crown width at the four directions, species of adjacent trees, and position angle and distances between trees were measured and recorded. A total of 324 tree cores from 88 trees were collected. Due to pests, nodules, etc., some trees did not produce complete cores in some directions, leaving 54 trees with high quality cores taken from all the four directions for use in this study.
Following standard dendrochronological methods, the 216 cores from the 54 trees were mounted in grooved wooden bars, air dried, and polished for cross-dating and measurements of ring width. The skeleton diagram method [28] was used for preliminary cross dating [14] to eliminate the possibility of false or absent rings and mark intervals of 10, 50, and 100 years on each growth ring. The tree ring width was measured with a LINTAB 6 measuring system (Frank Rinntech, Heidelberg, Germany) coupled with the Time Series Analysis Programme (TSAP) at an accuracy of 0.001 mm. Cross-dating and measurement accuracy were statistically verified with the COFECHA program [29]. Each ring-width series was detrended and standardized by fitting a negative exponential curve or linear regression of negative exponential using the ARSTAN program [30]. The ring-width index was then derived by dividing the ring width by the fitted value for each ring. The method of bi-weight robust mean was used for averaging the individual detrended series in the sample plot to produce standard chronologies for the site overall and each of the cardinal directions. Due to variations in coring among some samples, the starting years for cores from the four directions of a tree may differ by 1–3 years, so the common years of four cores of a tree were used for subsequent analysis.
Meteorological data was provided by China Meteorological Administration’s Science Data Sharing Service network (http://data.cma.cn/en, accessed on 3 November 2021). Climate variables include the monthly average mean, minimum and maximum temperatures, and monthly total precipitation from 1955 to 2017. These monthly data are calculated from daily data.

2.2. Radial Growth Process Analysis

In order to study the similarity of temporal tree growth in different directions, we conducted a Pearson correlation analysis to analyze the tree-ring width indices (RWIs) of the four directions. Six correlation analyses were conducted between directional pairs for each tree, namely N-E (North and East), N-S (North and South), N-W (North and West), E-S (East and South), E-W (East and West), S-W (South and West). Since it is generally believed that if pairwise correlations exceed a threshold (>0.7), collinearity is high and should not be used in the same model [31,32]. In this paper, we used 0.7 as a breakpoint. If the correlation coefficient between RWIs from different directions was less than 0.7, we flagged those two directions as different in temporal growth, indicating that either directional core could not represent the tree’s radial growth independently.
In order to further determine whether tree growth has systematic directional differences due to different responses to main signals, following Gut et al. (2019) [26], we used principal component gradient analysis (PCGA) to analyze the 216 RWIs. PCGA is a method proposed by Buras et al. (2016) [33] to detect the growth signals of sub-groups within a tree-ring time series group. Based on principal component analysis (PCA), a time series group is divided into one or several sub-groups by transforming the loads of the first two principal components (PC1 and PC2) into polar coordinates. Vectors with the same direction and angle respond to similar signals. Visually distinct groups of vectors indicate subpopulation signals [33]. We used PCGA to evaluate four direction-specific subpopulations, then applied the Wilcoxon signed-rank significance test to each pair of directions for the common years of the four cores from each tree.

2.3. Radial Growth–Climate Analysis

We conducted a Pearson correlation analysis on the 216 RWIs, the average standard chronology of site, the average standard chronology of the four directions, and the monthly climate indicators from June of the previous year to September of the current year. For subsequent analysis, we selected climatic factors significantly associated with at least one mean chronology.
As PCGA only focuses on the first two principal components, which explained most of the differences among 216 chronologies, we extracted the load of those principal components according to the direction based on the analysis of the 216 RWIs. We calculated the score of those principal components and obtained principal component series, which we defined as the directional principal component chronology. We also calculated the principal component score regardless of direction and defined them as the principal component chronology. We then conducted a multiple regression analysis with the selected climate indicators to identify the climate factors that lead to tree ring variability. In addition, we used the selected climate indicators and the principal component chronology for correlation analysis to find the driving factors of the first two principal components [34]. We took the square of the correlation coefficient between RWIs and selected climate variables ( r 2 ) because the r 2 in univariate linear regression refers to the variance explained by a regressor [26,35], enabling us to estimate the potential impact of corresponding climate variables on tree growth trends. Again, following Gut et al. (2019) [26], we used the Wilcoxon signed rank test to investigate the direction-specific divergence of r 2 , which tested the pooled individual differences between directional pairs, in our study (N-E, N-S, N-W, E-S, E-W, and S-W). Consequently, the test allowed for identifying significant mean differences between directional pairs cores’ r 2 (e.g., Δ r 2 = r N 2 r E 2 ).

3. Results

3.1. Directional Differences of Tree Ring Indices

A total of 324 correlation analyses were performed on tree-ring index series of 54 individual trees. The average age of 54 trees was 83 (ranged from 57 to 124). Among the 54 trees, 33 trees had at least one correlation coefficient less than 0.7, including the dominant trees and subdominant trees. Among the 324 correlation coefficients, 99 were between 0.5 and 0.7, and 31 were less than 0.5, with a total of 130, including 23 N-E, 27 N-S, 17 N-W, 18 E-S, 24 E-W, and 21 S-W. Generally, the growth process of individuals diverged among the four directions. Growth consistency was the lowest between north and south, followed by east and west; consistency was the highest between north and west (Figure 2). These differences were distributed in trees of different age classes and social classes (not shown). The social levels reflect the competitive situation [36]. Therefore, this difference was independent of age classes and social classes (competition). We inferred from above that there were multifarious reasons leading to variations in growth among the different directions of the same tree.
The principal component analysis showed that the first two components explained 58% (46% for PC1 and 12% for PC2) of the total variance of the time-series. The Wilcoxon signed-rank tests showed that the differences of six groups in the polar angles of the PCGA ranks is as follows:
E-W (p = 0.026) > S-W (p = 0.075) > N-E (p = 0.24) > N-S (p = 0.265) > E-S (p = 0.373) > N-W (p = 0.76)
This indicated that there was a main signal leading to the growth difference in different directions, and with the greatest difference shown between the E-W pair. N-W was the most consistent, followed by E-S. Moreover, the PCGA plots showed no distinct visual groupings of the PCGA ranks (Figure 3).

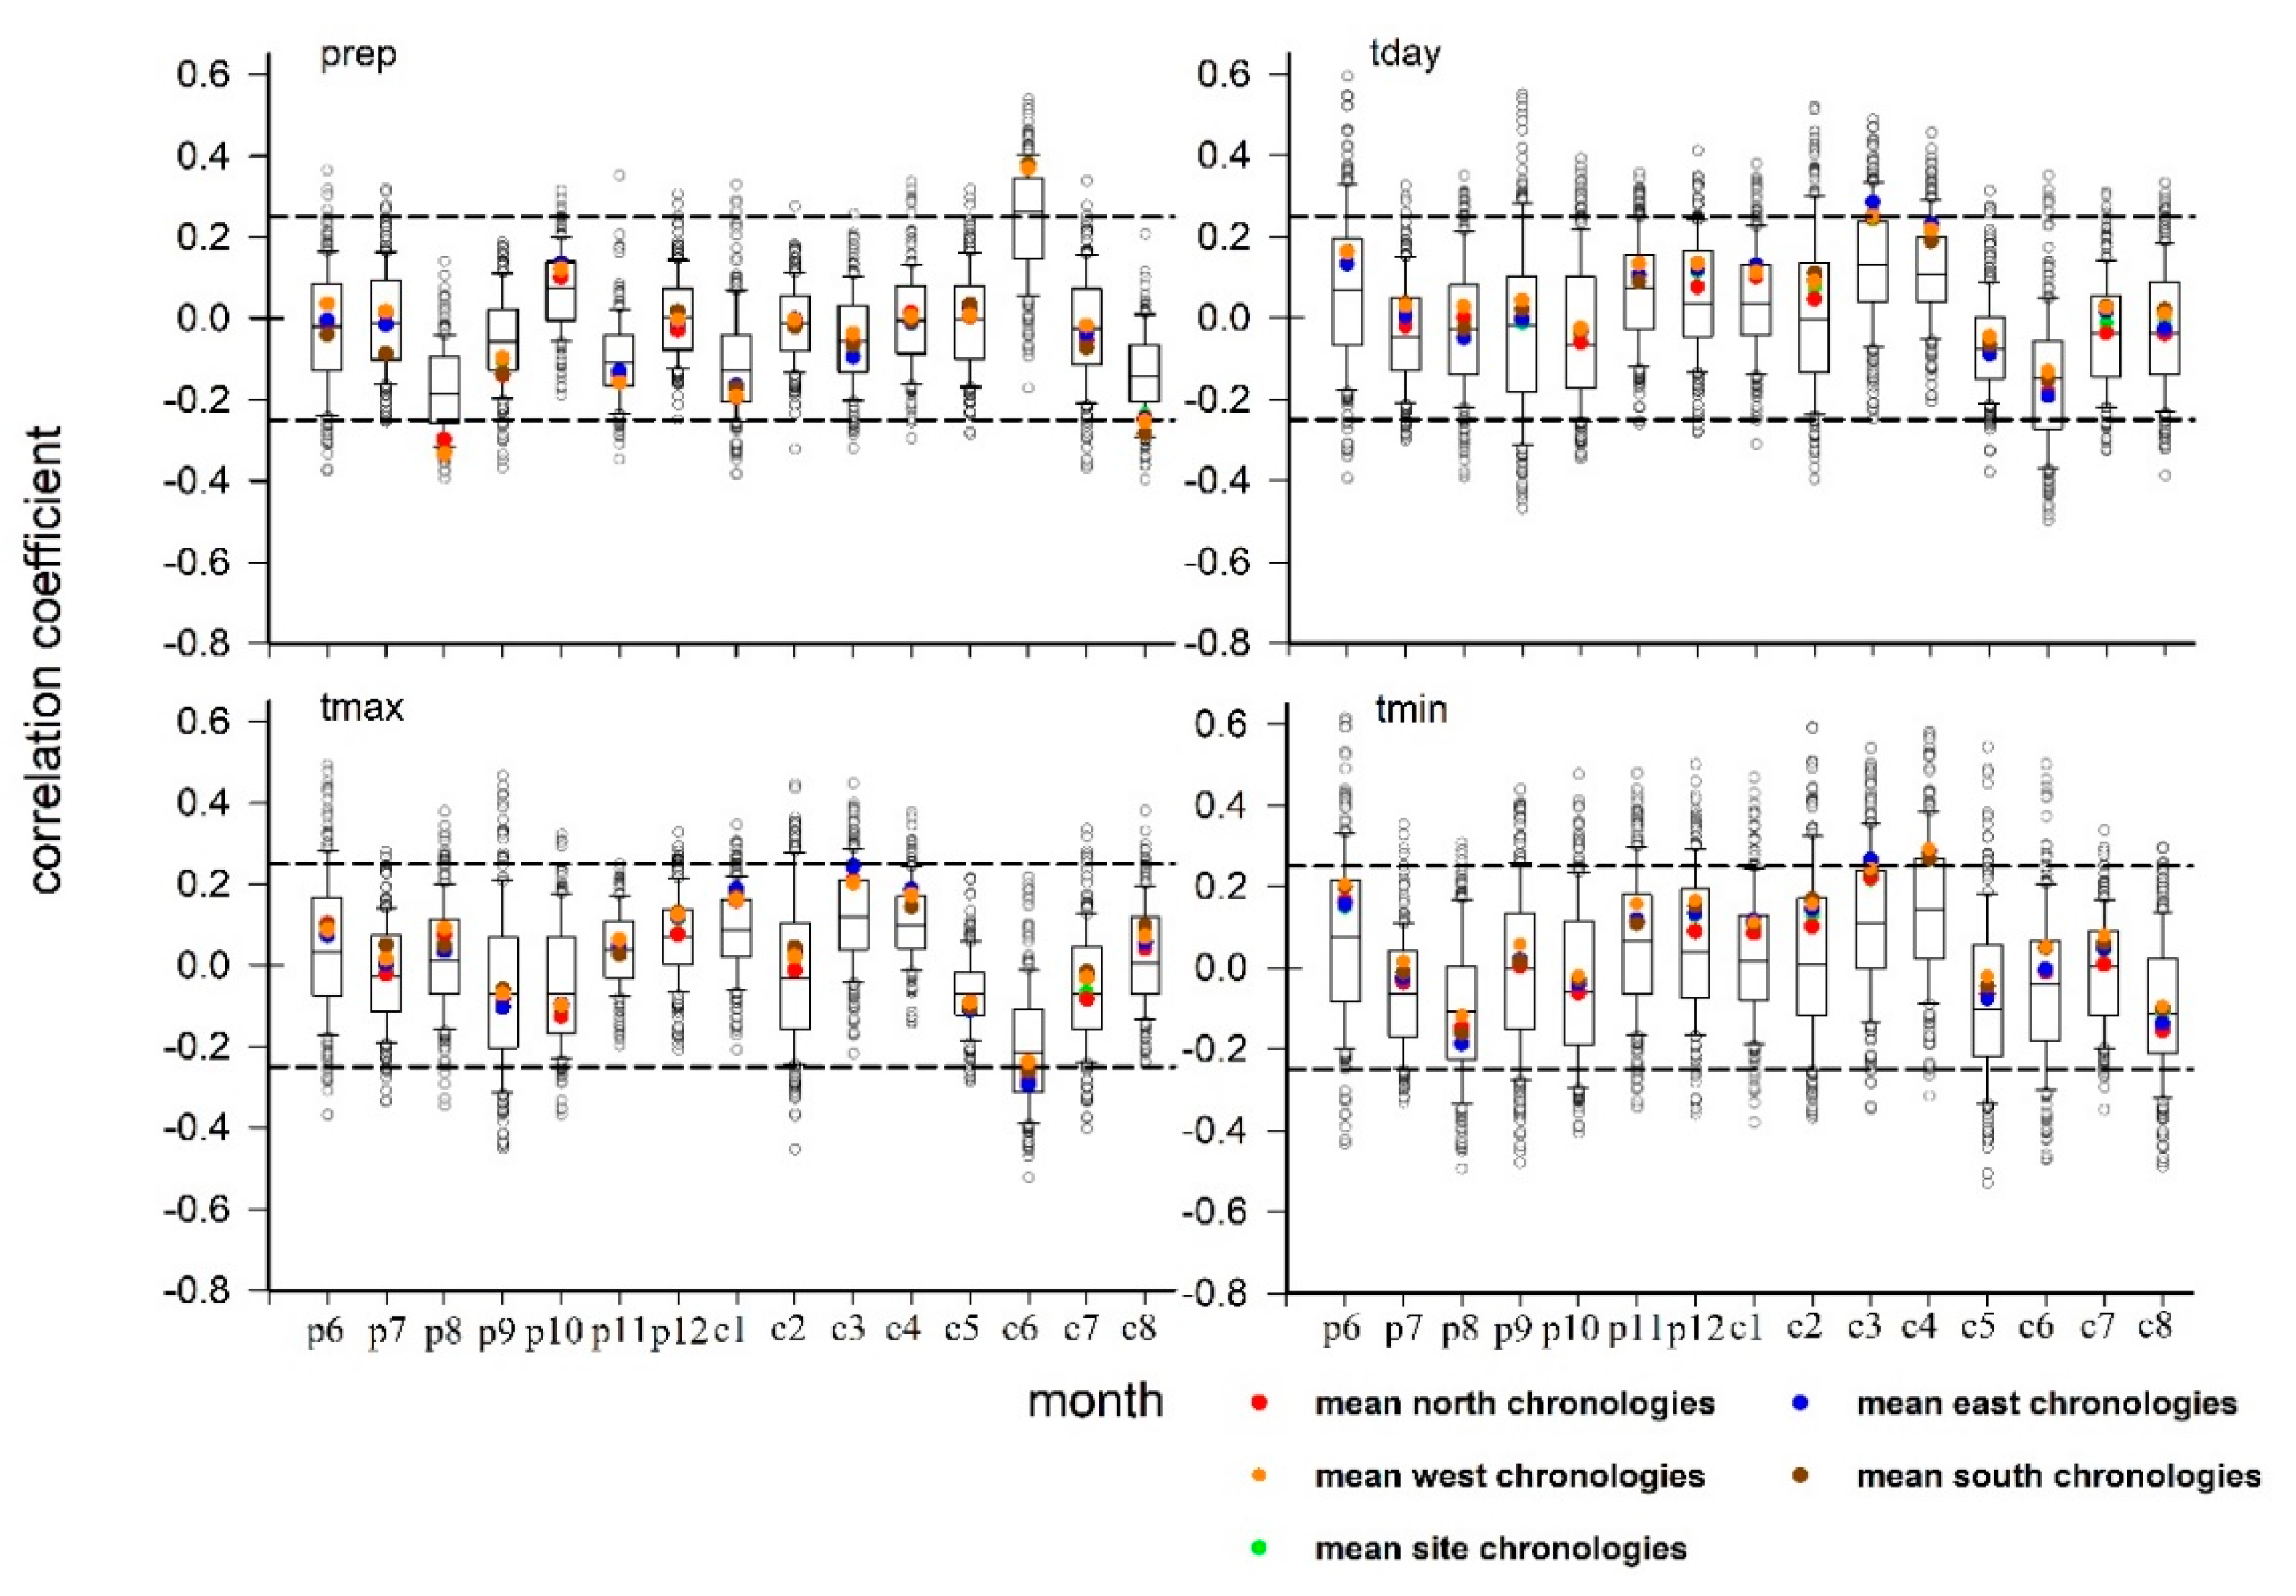
3.2. Direction Differences in Climate–Growth Relationship

We found that seven climatic factors were significantly correlated with at least one direction average chronology: previous August precipitation (prep-p8), current June precipitation (prep-c6), current August precipitation (prep-c8), current March average daily temperature (tday-c3), current March daily minimum temperature (tmin-c3), current April daily minimum temperature (tmin-c4), and current June maximum temperature (tmax-c6). Among these, prep-p8, prep-c6, and tmin-c4 were significantly correlated with the average standard chronologies of the site and the four directions (p < 0.5); prep-p8 was negatively correlated while prep-c6 and tmin-c4 were positively correlated. Both prep-c8 and tday-c3 were significantly correlated with the average standard chronologies of all directions except north; prep-c8 was negatively correlated while tday-c3 was positively correlated. The tmax-c6 variable was significantly negatively correlated with average standard chronologies of site and all directions except west, and tmin-c3 was only significantly positively correlated with the east direction average standard chronology. As shown in Figure 4, we found diverging correlations between the growth of individual trees in different directions and climate indicators.
Correlations between the principal component chronologies and the above seven climatic factors were mostly significant, indicating climatic influences on PC1 and PC2 loadings. The results of the multiple regression analysis on the directional principal component chronology and the above seven climatic factors showed that the climate factors had little effect on the differences in growth of the four directions in the PC1 group, but in PC2 group, there was a significant difference. Therefore, we infer that directional variability was mainly concentrated in the second principal component. In addition, the PC2 plot intuitively showed that the E-S and N-W pairs were more consistent. This was the same as the results of PCGA.
The first principal component chronology was significantly correlated with prep-p8 (r = −0.37), prep-c6 (r = 0.32), prep-c8 (r = −0.31), tday-c3 (r = 0.37), tmin-c3 (r = 0.38), tmin-c4 (r = 0.42). The second principal component chronology was significantly correlated with tday-c3 (r = −0.37), tmax-c6 (r = −0.44), tmin-c3 (r = −0.50), tmin-c4 (r = −0.50) (not shown).
In the PC1 group, tmin-c4, prep-c6, prep-c8, and prep-p8 modeled radial growth best, accounting for 39%, 41%, 41%, and 41% of the total variance in radial growth toward the north, east, south, and west, respectively. The highest relative contribution rate to the four directions was from tmin-c4, at 44%, 44%, 40%, and 45%, respectively.
In the PC2 group, tmin-c3, tmin-c4, tday-c3, and tmax-c6 best fit the radial growth toward the north, accounting for 53% of the variance. Meanwhile, tmin-c3, tday-c3, and tmax-c6 modeled best for radial growth toward the west, accounting for 50%. The best fit for the radial growth of the east and south directions was tmin-c3, tmin-c4, tmax-c6, tday-c3, and prep-c8, accounting for 56% and 54%, respectively. Among these variables, the directional contribution rates of tmin-c4, tmax-c6, and tmin-c3 are quite different. The contribution rates of tmin-c4 to north, east, south, and west were 4%, 59%, 54%, and 0 respectively; tmax-c6 rates were 31%, 19%, 21%, and 43% respectively; and tmin-c3 rates were 49%, 13%, 15%, and 49%, respectively (Figure 5).
Direction-specific differences (Δ r 2 ) in climate–growth relationships were almost insignificant according to the Wilcoxon signed-rank tests, except for prep-c8 (with E-S and S-W) and tmax-c6 (with E-W and S-W). This suggests that there is the potential for prep-c8 to affect the growth differences between south and east or between south and west, and for tmax-c6 to affect the growth differences between west and east or west and south. This result included all the factors driving tree growth variability. Combined with Figure 5, tmax-c6 was the main reason for the differences between east and west and between west and south. The mean Δ r 2 of tday-c3, tmin-c3, tmin-c4, and tmax-c6 was higher in the east than in other directions, suggesting that growth in the east side of the tree is more sensitive to temperature than in other directions. The mean Δ r 2 of prep-c6 and prep-c8 were higher in the south than in other directions, suggesting that growth in the south side of the tree is more sensitive to current precipitation than in other directions (Figure 6).

4. Discussion

The radial growth of most trees in four directions was significantly negatively correlated with the current June maximum temperature, and significantly positively correlated with the current June precipitation (Figure 4). This is consistent with previous research results showing that both June maximum temperature and precipitation of the current year are the key factors affecting the radial growth of P. koraiensis at all latitudes, at scales of stands and individuals [37,38].
In our analysis, tmax-c6 emerged as the main reason for the difference between east and west growth. In recent decades, the maximum June temperature in the Mudanjiang region has risen significantly (Figure 7) and the June precipitation with no significant change (not shown). June is a period of rapid radial growth in P. koraiensis, but growth is limited by water condition as precipitation in this region is mainly concentrated in July and August, which can be insufficient to meet the needs of potential growth. Higher temperatures in June aggravate the lack of soil water. Soil drought stress can reduce the leaf water potential of trees, increase the water adsorption capacity of mesophyll cells, and limits the movement of water in leaves, thus reducing the photosynthesis rate of trees and affecting the growth of trees [37]. Moreover, the daily rotation of the Earth (the sun rises in the East and sets in the west) causes more radiation in the east and south directions, so the temperature rises faster in these directions during early summer. Therefore, the changes of maximum temperature in June have a relatively greater impact on growth in the east and south directions, resulting in greater differences from the west direction.
Our analysis also indicated that tree-ring time series were more homologous between south and east and between north and west. This could reflect variation in microclimates with a detectable effect on growth patterns and modes of climate response. The variation in climate–growth response is mainly concentrated in the warm season, which is also consistent with large scale circulation movement in this region: warm and moisture air move from southeast to northwest during the warming season month [39], further aggravating the heat difference in distinct directions.
The results of the correlation analysis showed that there were more trees with greater differences in growth between north and south, followed by east and west. In the PCGA results, the difference between east and west was significant, followed by the south and west. The inconsistency between the two results could be caused by the interference of non-climate factors. PCGA extracted the first two principal components, accounting for 58% of the variances in the RWIs, while the correlation analysis was the result of retaining all the information. One of the main dendrochronological principles is to assume that the common information shared among trees in a stand can be regarded as climate information [40]. Therefore, the first principal component is driven by the growth response of trees to major climate growth-limiting factors, while the other principal components were affected by microclimate or non-climate factors to greater or lesser degrees.
Trees show divergent climate–growth associations from their neighbors within a stand because of distinctive site and tree characteristics like forest composition [41], tree-to-tree competition intensity [36], or tree age and size [42,43,44]. Similarly for a tree, the biological factors in its four directions are heterogeneous, such as the quantity and type of neighborhoods, crown width, or root system; this may be part of the reason for the asynchronous growth process of some individual trees. However, the first two principal components were significantly correlated with most selected climate factors, excluding the influence of non-climatic factors. We also calculated correlations of the third principal component with the seven climatic factors, which were not correlated. The third principal component explained only 6% of the variance, so we speculated that biological factors such as age, competition, etc., had limited effects on the differences between directions. This was consistent with the results presented in Figure 2.
Considering only the climate factors significantly related to the radial growth of most trees in the study plot, the east direction was more sensitive to the temperature of the current year, and the south direction was more sensitive to the precipitation of the current year (Figure 6). This may be partly due to the northeast slope of our sample plot, although the slope is only 3°. Slope mainly affects the radial growth of trees by regulating soil moisture and soil nutrients [15]. Additionally, soil water supply has been identified as a dominating growth factor across scales [45]. The slope direction may increase the soil moisture in the east direction more than in the south direction. The south direction was more sensitive to water conditions, likely because it receives the most solar radiation, while the east direction was more sensitive to temperature.
As noted above, Fang et al. (2015) [25] and Gut et al. (2019) [26] came to opposite conclusions regarding the directional effect of climate variables on tree growth. Fang et al. (2015) [25] mainly studied Pinus tabuliformis and Picea purpurea in the semi-arid Loess Plateau, mostly along ridges or near cliffs where the sites are open and the growth of trees will not be affected by competition factors. Therefore, the trees in that study are more susceptible to direction-specific climate factors, such as radiation and wind. By contrast, Gut et al. (2019) [26], studying a total of eight coniferous and broad-leaved trees, found no directional effects in sites that are even and far from the forest edge, but only the east and the south were compared in that study, based on the expected influence of the two major factors, solar radiation and wind, that potentially drive direction-specific climate signals in their study areas. Our study showed that there were systematic differences between the two opposite directions, west and east (Figure 2).
Moreover, Gut et al. (2019) [26] only retained high frequency information and adjusted the p-value by BH [46], but we did not do so in this paper because of differences in the purpose of our research: their purpose was to study whether directional growth has an impact on climate reconstruction, while our research focuses on differences in growth characteristics and climate response between different directions of individual trees, as well as various differences between directional groups. Therefore, we chose to retain low-frequency information, such as competition, and pay more attention to the absolute value and not just the significance.
This paper only studied the directional specificity at one site, but in terms of slope, altitude, and species composition, our study plot is widely representative of natural forests in north China, where P. koraiensis is the main temperate tree species. In future studies, we will compare multiple species at different latitudes. We also note that directional differences in growth processes may be specific to the time period covered by the lifespan of trees in our study plot. As the relationship between climate change and growth process in different periods is variable [39,47], it is necessary to pay attention to the temporal relationship between climate change and growth process in different directions.

5. Conclusions

Our research showed that there were obvious directional differences in the radial temporal growth of P. koraiensis, including systematic differences in climate response between east and west which are likely caused by the current year June maximum temperature. We proposed these directional differences relate to microclimate effects; these are in turn due to the progression of temperature and the amount of insolation by the daily rotation of the Earth and the transport of warm, moist air from the southeast by large scale atmospheric circulation. As the difference of microclimate is contributed by the large-scale climatic effects: atmospheric circulation and earth rotation, its influence on radial growth of trees in four directions is common. In addition, the small slope made the tree growth to the South more sensitive to current year precipitation while tree growth to the east was more sensitive to current year temperature.
Our result extended the high diversity in sensitivity of tree growth to climate from the individual scale to intra-individual scale, and confirmed that tree radial growth is highly sensitive to climate warming. This may enhance our understanding of how tree growth responds to global warming. Although our study focused on one tree species, the results show that the directional difference existed in most individuals and mainly related to large-scale climate effects. Therefore, we speculated that the directional response difference should exist in other tree species. If this phenomenon is widespread, the traditional unidirectional tree ring sampling method may produce bias in the reported relationship between tree ring growth and climate. At the least, the tree-ring time series of most trees taken in one direction could not fully reflect the characteristics of temporal radial growth and its climate response. Further research with tree ring data should incorporate or control for potential directional differences in tree growth.

Author Contributions

Y.S.: Conceptualization, methodology, formal analysis, writing—original draft. B.L.: methodology, writing—review and editing, project administration. M.H.: writing—review and editing. H.Y.: data curation. All authors contributed substantially to the repeatedly review and revisions. All authors have read and agreed to the published version of the manuscript.

Funding

This work was funded by the National Natural Science Foundation of China (41877416), National Key Research and Development Program of China (2017YFD0601204-01-03, 2018YFC0507003-02) and Fundamental Research Funds for the Central Universities (2572019CP09).

Institutional Review Board Statement

Not applicable.

Informed Consent Statement

Not applicable.

Data Availability Statement

Climate data referenced in this paper are available through the National Meteorological Information Center through the China Meteorological Data Sharing Service Center (CMDC) (http://data.cma.cn/en, accessed on 3 November 2021). The name of the dataset is ‘Dataset of Daily Values of Climate Data from Chinese Stations for Global Exchange’.

Conflicts of Interest

The authors declare no conflict of interest.

References

  1. Bonan, G.B. Forests and climate change: Forcings, feedbacks, and the climate benefits of forests. Science 2008, 320, 1444–1449. [Google Scholar] [CrossRef] [Green Version]
  2. Matías, L.; Linares, J.C.; Sánchez-Miranda, Á.; Jump, A.S. Contrasting growth forecasts across the geographical range of scots pine due to altitudinal and latitudinal differences in climatic sensitivity. Glob. Chang. Biol. 2017, 23, 4106. [Google Scholar] [CrossRef]
  3. Babst, F.; Bodesheim, P.; Charney, N.; Friend, A.D.; Girardin, M.P.; Klesse, S. When tree rings go global: Challenges and opportunities for retro- and prospective insight. Quat. Sci. Rev. 2018, 197, 1–20. [Google Scholar] [CrossRef]
  4. Yuan, D.Y.; Zhao, H.Y.; Li, Z.S.; Zhu, L.J.; Guo, M.; Zhang, Y.D.; Wang, X.C. Radial growth of Pinus koraiensis and Picea koraiensis response to climate change in Yichun City, Heilongjiang Province. Acta Ecol. Sin. 2020, 40, 1150–1160. [Google Scholar]
  5. Liang, H.; Huang, J.G.; Ma, Q.; Li, J.; Wang, Z.; Guo, X.; Zhu, H.; Jiang, S.; Zhou, P.; Yu, B.; et al. Contributions of competition and climate on radial growth of Pinus massoniana in subtropics of China. Agric. For. Meteorol. 2019, 274, 7–17. [Google Scholar] [CrossRef]
  6. Huang, J.; Tardif, J.C.; Bergeron, Y.; Denneler, B.; Berninger, F.; Girardin, M.P. Radial growth response of four dominant boreal tree species to climate along a latitudinal gradient in the eastern canadian boreal forest. Glob. Chang. Biol. 2010, 16, 711–731. [Google Scholar] [CrossRef]
  7. Nicault, A.; Boucher, E.; Tapsoba, D.; Arseneault, D.; Berninger, F.; Bégin, C.; DesGranges, J.L.; Guiot, J.; Marion, J.; Wicha, S.; et al. Spatial analysis of black spruce, Picea mariana, Mill. (B.S.P.) radial growth response to climate in northern Québec-Labrador Peninsula, Canada. Can. J. For. Res. 2015, 45, 343–352. [Google Scholar] [CrossRef] [Green Version]
  8. Lempereur, M.; Limousin, J.M.; Guibal, F.; Ourcival, J.M.; Mouillot, F. Recent climate hiatus revealed dual control by temperature and drought on the stem growth of mediterranean Quercus ilex. Glob. Chang. Biol. 2017, 23, 42–55. [Google Scholar] [CrossRef] [PubMed] [Green Version]
  9. Rozas, V. Individual-based approach as a useful tool to disentangle the relative importance of tree age, size and inter-tree competition in dendroclimatic studies. iForest 2014, 8, 187–194. [Google Scholar] [CrossRef] [Green Version]
  10. Clark, J.S.; Bell, D.M.; Kwit, M.; Stine, A.; Vierra, B.; Zhu, K. Individual-scale inference to anticipate climate-change vulnerability of biodiversity. Philos. Trans. R. Soc. B 2012, 367, 236. [Google Scholar] [CrossRef] [Green Version]
  11. Abiyu, A.; Mokria, M.; Gebrekirstos, A.; Braüning, A. Tree-ring record in ethiopian church forests reveals successive generation differences in growth rates and disturbance events. For. Ecol. Manag. 2018, 409, 835–844. [Google Scholar] [CrossRef]
  12. Latreille, A.; Davi, H.; Huard, F.; Pichot, C. Variability of the climate-radial growth relationship among Abies alba trees and populations along altitudinal gradients. For. Ecol. Manag. 2017, 396, 150–159. [Google Scholar] [CrossRef]
  13. Sullivan, P.F.; Ellison, S.B.; Mcnown, R.W.; Brownlee, A.H.; Sveinbjornsson, B. Evidence of soil nutrient availability as the proximate constraint on growth of treeline trees in northwest Alaska. Ecology 2015, 97, 803. [Google Scholar] [CrossRef] [PubMed]
  14. Ettl, G.J.; Peterson, D.L. Extreme climate and variation in tree growth: Individualistic response in subalpine fir, Abies lasiocarpa. Glob. Chang. Biol. 1995, 1, 231–241. [Google Scholar] [CrossRef]
  15. Fritts, H.C. Tree Rings and Climate; Academic: San Diego, CA, USA, 1976. [Google Scholar] [CrossRef]
  16. Speer, J.H. Fundamentals of Tree-Ring Research; University of Arizona: Tucson, AZ, USA, 2010. [Google Scholar] [CrossRef]
  17. Kelly, D. The evolutionary ecology of mast seeding. Trends Ecol. Evol. 1994, 9, 465–470. [Google Scholar] [CrossRef]
  18. Chhin, S.; Hogg, E.H.; Lieffers, V.J.; Huang, S. Growth-climate relationships vary with height along the stem in lodgepole pine. Tree Physiol. 2010, 30, 335–345. [Google Scholar] [CrossRef] [Green Version]
  19. Zhang, X.; Gao, L.; Qiu, Y.; Guo, J. Characteristics of Korean pine, Pinus koraiensis radial growth at different heights and its response to climate change on Changbai Mountain. Acta Ecol. Sin. 2015, 35, 2978–2984. [Google Scholar]
  20. Zhang, T.; Huang, L.; Zhang, R.; Gao, Y.; Hu, D.; Yu, S.; Jiang, S. The impacts of climatic factors on radial growth patterns at different stem heights in Schrenk spruce, Piceas chrenkiana. Trees 2020, 34, 163–175. [Google Scholar] [CrossRef]
  21. Liu, K.X.; Zhang, T.W.; Zhang, R.B.; Yu, S.L.; Hu, D.Y. Characteristics of tree-ring density at different stem heights and their climatic responses. Chin. J. Appl. Ecol. 2021, 32, 503–512. [Google Scholar] [CrossRef]
  22. Buras, A.; Wilmking, M. Straight lines or eccentric eggs? A comparison of radial and spatial ring width measurements and its implications for climate transfer functions. Dendrochronologia 2014, 32, 313–326. [Google Scholar] [CrossRef]
  23. Shetti, R.; Buras, A.; Smiljanic, M.; Wilmking, M. Climate sensitivity is affected by growth differentiation along the length of Juniperus communis L. shrub stems in the Ural Mountains. Dendrochronologia 2018, 49, 29–35. [Google Scholar] [CrossRef]
  24. Yang, J.; Zhao, H.; Zhang, Y.; Li, Z.; Wang, X. Climate–growth relationship for different directions of Pinus pumila radial growth at the treeline of northern Daxing’an Mountains, China. Trees 2018, 32, 311–322. [Google Scholar] [CrossRef]
  25. Fang, K.; Chen, D.; Gou, X.; D’Arrigo, R.; Davi, N. Influence of non-climatic factors on the relationships between tree growth and climate over the chinese loess plateau. Glob. Planet. Chang. 2015, 132, 54–63. [Google Scholar] [CrossRef]
  26. Gut, U.; Árvai, M.; Bijak, S.; Camarero, J.J. No systematic effects of sampling direction on climate-growth relationships in a large-scale, multi-species tree-ring data set. Dendrochronologia 2019, 57, 125624. [Google Scholar] [CrossRef]
  27. Wang, X.; Zhang, M.; Ji, Y. Temperature signals in tree-ring width and divergent growth of Korean pine response to recent climate warming in northeast Asia. Trees 2017, 31, 415–427. [Google Scholar] [CrossRef]
  28. Stokes, M.A.; Smiley, T.L. An Introduction to Tree-Ring Dating; University of Arizona: Tucson, AZ, USA, 1968. [Google Scholar]
  29. Holmes, R.L. User Manual for Program COFECHA; Laboratory of Tree-Ring Research, University of Arizona: Tucson, AZ, USA, 1999. [Google Scholar]
  30. Cook, E.R.; Holmes, R.L. User Manual for Program ARSTAN; Laboratory of Tree-Ring Research, University of Arizona: Tucson, AZ, USA, 1999. [Google Scholar]
  31. Dormann, C.F.; Elith, J.; Bacher, S. Collinearity: A review of methods to deal with it and a simulation study evaluating their performance. Ecography 2012, 36, 27–46. [Google Scholar] [CrossRef]
  32. Harrison, X.A. A brief introduction to mixed effects modelling and multi-model inference in ecology. PeerJ 2018, 6, e4794. [Google Scholar] [CrossRef] [Green Version]
  33. Buras, A.; van der Maaten-Theunissen, M.; van der Maaten, E.; Ahlgrimm, S.; Hermann, P.; Simard, S.; Heinrich, I.; Helle, G.; Unterseher, M.; Schnittler, M.; et al. Tuning the voices of a choir: Detecting ecological gradients in time-series populations. PLoS ONE 2016, 11, e0158346. [Google Scholar] [CrossRef]
  34. Mašek, J.; Tumajer, J.; Rydval, M.; Lange, J.; Treml, V. Age and size outperform topographic effects on growth-climate responses of trees in two Central European coniferous forest types. Dendrochronologia 2021, 68, 125845. [Google Scholar] [CrossRef]
  35. Stock, J.H.; Watson, M.W. Introduction to Econometrics; Prentice Hall: New York, NY, USA, 2003. [Google Scholar]
  36. Linares, J.C.; Camarero, J.J.; Carreira, J.A. Competition modulates the adaptation capacity of forests to climatic stress: Insights from recent growth decline and death in relict stands of the Mediterranean fir Abies pinsapo. J. Ecol. 2010, 98, 592–603. [Google Scholar] [CrossRef]
  37. Liu, M.; Mao, Z.J.; Li, Y.; Sun, T.; Li, X.H.; Huang, W.; Liu, R.P.; Li, Y.H. Response of radial growth of Pinus koraiensis in broad-leaved Korean pine forests with different latitudes to climatical factors. Chin. J. Appl. Ecol. 2016, 27, 1341–1352. [Google Scholar] [CrossRef]
  38. Kang, Y.; Liu, B.; Ren, J.Y.; Tan, K.L. Effect of Competitionon Tree Ring Growth and Climate Factors of Pinus koraiensis. J. Northeast For. Univ. 2019, 47, 6–10, 22. [Google Scholar] [CrossRef]
  39. Sidder, A. Topography and microclimate shape tree ring growth. Biogeosciences 2019, 100. [Google Scholar] [CrossRef]
  40. Andreu, L.; Gutiérrez, E.; Ribas, M.; Camarero, J.J. Climate increases regional tree-growth variability in Iberian pine forests. Glob. Chang. Biol. 2007, 13, 804–815. [Google Scholar] [CrossRef]
  41. Zhang, T.; Niinemets, Ü.; Sheffield, J.; Lichstein, J.W. Shifts in tree functional composition amplify the response of forest biomass to climate. Nature 2018, 556, 99–102. [Google Scholar] [CrossRef] [PubMed]
  42. Čermák, P.; Rybníček, M.; Žid, T.; Steffenrem, A.; Kolář, T. Site and age-dependent responses of picea abies growth to climate variability. Eur. J. For. Res. 2019, 138, 445–460. [Google Scholar] [CrossRef]
  43. Wang, X.; Zhang, Y.; Mcrae, D.J. Spatial and age-dependent tree-ring growth responses of Larix gmelinii to climate in northeastern China. Trees 2009, 23, 875–885. [Google Scholar] [CrossRef]
  44. Coomes, D.A. Effects of size, competition and altitude on tree growth. J. Ecol. 2007, 95, 1084–1097. [Google Scholar] [CrossRef]
  45. Rabbel, I.; Neuwirth, B.; Bogena, H.; Diekkrüger, B. Exploring the growth response of Norway spruce (Picea abies) along a small-scale gradient of soil water supply. Dendrochronologia 2018, 52, 123–130. [Google Scholar] [CrossRef]
  46. Benjamini, Y.; Hochberg, Y. Controlling the false discovery rate: A practical and powerful approach to multiple testing. J. R. Stat. Soc. B 1995, 57, 289–300. [Google Scholar] [CrossRef]
  47. Zhou, P.; Huang, J.G.; Liang, H.; Rossi, S. Radial growth of Larix sibirica was more sensitive to climate at low than high altitudes in the Altai Mountains, China. Agric. For. Meteorol. 2021, 304–305, 108392. [Google Scholar] [CrossRef]
Figure 1. Geographical location of the study site (red circle) and meteorological station (yellow triangle) in China. Green dots represent temperate coniferous and deciduous broad-leaved mixed forests.
Forests 12 01684 g001
Figure 2. The results of correlation analysis among tree ring index in four directions of individuals. Different colors and shapes represent different pairs of directions.
Forests 12 01684 g002
Figure 3. Directional differences in growth variability according to PCGA. p: p-value of Wilcoxon signed-rank tests. Orange arrows refer to northern, green arrows to eastern, yellow arrows to western, blue arrows to south. PC1 is the first principal component and PC2 is the second principal component.
Forests 12 01684 g003
Figure 4. Correlation analysis between climatic factors and mean standard chronologies of site, north, east, west, and south. Prep is precipitation, tday is the average daily temperature, tmax is the maximum daily temperature, and tmin is the minimum daily temperature. A ‘p’ before the number of the month (x-axis labels) represents previous year observations of each climate variable. A ‘c’ before the number of the month represents current year observations.
Forests 12 01684 g004
Figure 5. The relative importance of climate variable on radial growth in PC1 and PC2 groups.
Forests 12 01684 g005
Figure 6. Mean Δ r 2 between southern and western (SW), northern and western (NW), northern and southern (NS), northern and eastern (NE), eastern and western (EW), eastern and southern (ES) cores climate–growth correlations. Δ r 2 is obtained by subtracting r 2 of the direction represented by the last letter (abbreviation of direction) from r 2 of the direction represented by the previous letter.
Forests 12 01684 g006
Figure 7. Time series of current June maximum temperature. The heavy line is a trend line with a slop of 0.36 °C/decade (p < 0.01).
Forests 12 01684 g007
Publisher’s Note: MDPI stays neutral with regard to jurisdictional claims in published maps and institutional affiliations.

