Article

Effects of NaCl and CaCl2 Salinization on Morpho-Anatomical and Physiological Traits of Potted Callistemon citrinus Plants

1
Department of Agricultural Sciences, University of Naples Federico II, 80055 Portici, Italy
2
Department of Biology, University of Naples Federico II, 80126 Naples, Italy
*
Authors to whom correspondence should be addressed.
Forests 2021, 12(12), 1666; https://doi.org/10.3390/f12121666
Submission received: 28 October 2021 / Revised: 26 November 2021 / Accepted: 28 November 2021 / Published: 30 November 2021
(This article belongs to the Section Urban Forestry)

Abstract

:
The aim of this work was to assess the possible coordination mechanisms between leaf functional anatomical traits and physiological acclimation of potted Callistemon citrinus plants when subjected to two saline iso-osmotic solutions using NaCl or CaCl2. Digital image analysis was applied to quantify anatomical parameters with a specific focus on the occurrence of signs of structural damage as well as on alterations, such as the occurrence of shrunk tissues and accumulation of phenolic compounds. Morpho-anatomical analyses were accompanied by measurements of leaf gas exchange and chlorophyll fluorescence emission. Results showed that C. citrinus plants, when irrigated with the CaCl2 solution, induced a leaf morpho-anatomical structure which did not allow the maintenance of high photosynthetic performance under such conditions, compared to both controls and plants treated with the iso-osmotic solution of NaCl. Data collected seem to suggest a close relationship between anatomical traits and eco-physiological strategies in maintaining the photosynthetic efficiency under saline stress conditions and highlight the fundamental role of leaf anatomy in imposing the limits of plant physiology.

1. Introduction

Callistemon citrinus, also known as red bottlebrush, is an ornamental shrub belonging to the Myrtaceae family, commonly used in urban areas and in xeriscaping [1,2]. Indeed, it is known that this species is tolerant to drought stress and salinity, attributes making it suitable for cultivation in arid areas [3,4], although its flowering could be altered under prolonged water deficit [5]. The interest in understanding the mechanisms of plants’ response to drought is increasing for both food crops, due to a climate-change driven risk to food security, and ornamental species due to commercial and economic issues [6,7,8]. Especially in arid and semi-arid regions, like the Mediterranean area, climate change is causing the exacerbation of drought, also triggering the rising of the salinity levels in soil, bringing severe limitations to plant growth, development, and production [9,10]. For over 20 years now, salinity in both water and soil has been one of the major constraints to agriculture worldwide, costing about USD 27 billion per year, and also affecting ornamental plants’ value [6,7]. Indeed, woody ornamental species not only offer aesthetic pleasure in urban and peri-urban areas improving recreational and commercial sites, but they are also considered a key for restoring disturbed landscapes and controlling the erosion phenomenon [11]. In urbanized areas, however, landscapes could be jeopardized by poor-quality irrigation water, such as reclaimed water and industrial wastewater (with high salt concentration), used for irrigation in order to save high-quality water for human consumption [12,13,14]. Salinity stress, due to poor-irrigation water, could degrade the visual quality of ornamental plants bringing leaf necrosis, yellow spots, growth, and flowering reduction [15,16]. In this context, the study of the effect of salinity on different ornamental cultivars is therefore fundamental to increasing the possibility of finding the most resistant plants that can be used for landscaping especially in arid and semi-arid regions [17].
It is known that an electrical conductivity (EC) equal to or higher than 4 dS m−1 in the soil is responsible for a water deficit of the plants, since the high salinity levels impose osmotic stress on plants and particularly on their roots, constraining water absorption [18]. After this first “osmotic phase”, plants deal with specific ion toxicity in the shoot, particularly due to Na+ ion, resulting in nutritional imbalance and oxidative stress [19,20]. Plants already adapted to live in arid conditions rely on a morphological structure and on a metabolic ability allowing them to keep functioning without permanent damage [21]. These plants show different adaptation mechanisms to cope with salinity stress, changing not only their capacity of growing in terms of reduction in biomass, leaf size, relative water content and other leaf traits, but also by displaying a different coordination of their anatomical (e.g., enhanced leaf thickness, wax deposition), physiological (e.g., control of transpiration), and biochemical traits (e.g., production of enzymatic and non-enzymatic antioxidants against reactive oxygen species (ROS)) [8,22,23]. In the last years, several studies have been performed to test the effect of salinity on different crop and ornamental plants, most of the time assessing growth and physiological responses of plants to different concentrations of sodium chloride (NaCl). Among anatomical traits, stomatal density has appeared to be a plastic trait, fundamentally contributing to the control of transpiration under salinity stress. As examples, both Zhu et al. (2015) [24] and Hasauzzaman et al. (2018) [8] found an increased density of stomata in barley cultivars irrigated with different concentration of NaCl, which was negatively correlated with salinity damage, in a sort of “plant salt tolerance” to optimize the water use efficiency of the species under unfavorable conditions. Moreover, since stomata regulate both CO2 and water fluxes, several studies have showed that is possible to ameliorate drought and salinity tolerance by manipulating stomatal density on the leaf surface [25], leading to the hypothesis that morpho-anatomical traits can be key physiological markers for screening salinity tolerance in cereals [26].
The morpho-physiological mechanisms of response when ornamental plants are subjected to iso-osmotic solution of different salts is less studied. Iso-osmotic solutions could bring ion-specific effects strictly linked to the type of salt and the sensitivity of the species for that specific salt [27,28]. The aim of this work is to go deeper into the coordination mechanisms between leaf functional anatomical traits and physiological acclimation of C. citrinus plants subjected to the two iso-osmotic solutions. Since it is challenging to maintain good planting characteristics under salt-stress conditions and bearing in mind that landscaping plays a significant role in environmental protection and improvement, at the same time enhancing the quality of life in urban and peri-urban environment [29], the results of this study could be fundamental to add requirements to a scientific-based management of planting strategies in arid and semi-arid climates. Thus, in the present study we grew C. citrinus plants irrigated with two different isosmotic salt solutions (CaT, CaCl2 and NaT, NaCl salinity treatment). Plant responses in terms of growth, anatomical and physiological traits were analyzed and compared to control plants not subjected to salt stress but grew in the same environmental conditions and using the same agricultural practices.

2. Materials and Methods

2.1. Plant Material, Growth Conditions and Saline Treatments

The study was carried out on two-year-old Callistemon citrinus plants provided by a specialized nursery (Vivaio Torsanlorenzo, Ardea, Italy) as rooted cuttings. Plants were transplanted in pots (1.5 L), filled with peat moss, placed at a density of 2.4 per square meter in a greenhouse at the experimental station of the University of Naples Federico II, Southern Italy (43°31′ N, 14°58′ E; 60 m above the see level). Plants were cultivated for 4 months (from mid-March to mid-July) and conditions for cultivation were: average photosynthetically active radiation PAR 550 μmol m−2 s−1 (natural light conditions inside the greenhouse equipped with a 50% black shading net); daily air temperature in the range 17–34 °C; relative humidity 58/75% (day/night).
After 15-day acclimation, the plants were subjected to the salinity treatments (72 plants, arranged in a randomized complete-block design with four replicates, per treatment). Plants were irrigated with three nutrient solutions, namely: (1) a basic nutrient solution (C, control); (2) a saline nutrient solution, obtained by adding 53.3 mM CaCl2 to the basic nutrient solution (CaT, CaCl2 salinity treatment); (3) a saline nutrient solution, obtained by adding 80 mM NaCl to the control solution (NaT, NaCl salinity treatment). The total ion concentration of both saline solutions (NaCl and CaCl2) was 160 mM.
The composition of the basic nutrient solution (non-salt control) was: 13.6 mM N-NO3, 2.0 mM S, 1.4 mM P, 6.0 mM K, 4.5 mM Ca, 2.0 mM Mg, 20 μM Fe, 9 μM Mn, 1.5 μM Cu, 3 μM Zn, 20 μM B and 0.3 μM Mo [28], with an electrical conductivity (EC) of 2.0 dS m−1 and pH 6.0. The two chloride salt solutions were characterized by equimolar concentration, with EC values of 11.1 and 11.6 dS m−1 for the NaT and CaT, respectively. The pH in all nutrient solutions was 6.0 ± 0.2.

2.2. Biometry and Leaf Traits

For biometric determination, ten plants per treatment were sampled at the end of the experiment (127 Days after transplant, DAT), to measure the following parameters: canopy volume (CV), estimated by approximating the canopy to the volume of a cylinder, the area of the single leaf (ALA) measured using an electronic area meter (Li-Cor3000, Li- 182 Cor, Lincoln, NE, USA), total leaf area (TLA) measured as the sum of ALA of all leaves per plant, plant height (H), leaf dry weight (LDW) and stem dry weight (SDW) per plant measured by drying to a constant weight in a forced-air oven at 80 °C for 72 h, and specific leaf weight (SLW) measured as the ratio between leaf dry mass and leaf area [30] on six fully expanded leaves from 5 plants per each treatment.

2.3. Leaf Gas-Exchanges and Chlorophyll a Fluorescence Emission

Measurements of leaf gas exchanges and chlorophyll a fluorescence were performed at 93, 106 and 121 DAT, within 2 h across solar noon, on the youngest fully expanded leaves using six replicates per each treatment.
The net CO2 assimilation rate (PN), sub-stomatal CO2 concentration (Ci), stomatal conductance (gS), transpiration rate (E), and intrinsic water use efficiency (iWUE) were determined with a portable gas-exchange analyzer (LCA 4, ADC BioScientific Ltd., Hoddesdon, UK), equipped with a broad-leaf PLC (Plant Leaf Chamber).
For the chlorophyll a fluorescence measurements, a portable FluorPen FP100max fluorometer, equipped with a light sensor (Photon System Instruments, Brno, Czech Republic) was used following the procedure reported in Arena et al. (2020) [31]. The ground fluorescence (F0) was induced by an internal LED blue light (1–2 μmol photons m−2 s−1) on 30 min dark-adapted leaves.
The maximal fluorescence in the dark (Fm) was induced by a saturating pulse of 3000 μmol photons m−2 s−1. Potential activity of PSII (Fv/F0) was calculated as the ratio of variable to ground fluorescence according to Lichtenthaler and Babani (2004) [32].
For the fluorescence measurements in the light, the fluorometer FluorPen FP100max was equipped with an open leaf-clip suitable for measurements under ambient light. The quantum yield of PSII electron transport (ΦPSII) was determined according to Genty et al. (1989) [33]. The photochemical (qP) and non-photochemical quenching (qN) were calculated as described in Bilger and Björkman (1990) [34].

2.4. Microscopy Analyses and Quantification of Leaf Anatomical Traits

At the end of the experiment, 9 fully expanded mature leaves were collected from three plants per treatment and chemically fixed in FAA (40% formaldehyde, glacial acetic acid, 50% ethanol, %5:5:90 /5/90 by volume). The median portion of each leaf was dissected under a dissection microscope (SZX16, Olympus, Hamburg, Germany) to obtain subsamples of 5 × 5 mm leaf lamina. Half of the sub-samples were directly used to analyze the abaxial and adaxial epidermis following the process described by De Micco et al. (2011) [35]. In brief, portions of were flattened and mounted with distilled water on microscope slides that were observed under an epi-fluorescence microscope (BX60, Olympus) equipped with a Mercury lamp, a 330–385 nm band-pass filter, dichromatic mirror of 400 nm and above, and barrier filter of 420 nm and above in order to detect the different auto-fluorescence emissions of stomata, trichomes and glands. Images of the lamina surface, from three separate regions, were collected by means of a digital camera (CAMEDIA C4040, Olympus), taking care to avoid main veins. The digital images were analyzed with the image analysis software program AnalySIS® 3.2 (Olympus). Stomata, trichomes and glands were counted in each image and their frequency (number of objects per surface unit) was calculated. The length of stomata (guard-cell length, pole to pole) was measured in a 15 stomata per leaf sample.
The other group of sub-samples were dehydrated in an ethanol series and embedded in the acrylic resin JB4® (Polysciences, Warrington Township, PA, USA). Cross sections (5 µm thick) of the leaf lamina were cut with a rotative microtome. Sections were stained with 0.025% Toluidine blue in 0.1 M citrate buffer at pH 4 [36], mounted with mineral oil for microscopy, and observed under a transmitted light microscope (BX60, Olympus). Unstained sections were mounted with mineral oil for fluorescence microscopy and observed under the epi-fluorescence microscope equipped with the same settings reported above to detect the autofluorescence of simple phenolics [37,38]. Images were collected, as reported above, at various magnifications. For Callistemon leaves with an isobilateral structure, the thickness of both upper and lower palisade tissue, as well as of the median spongy parenchyma, were measured in 5 regions of the lamina. Cell size and shape of the spongy parenchyma were quantified in 15 cells per section. More specifically, the following parameters were measured: area, maximum, mean and minimum Feret diameters (the measured distance between parallel lines tangential to the cell’s perimeter). Cell shape was characterized by measuring the following indexes: aspect ratio (maximum width/height ratio of a bounding rectangle for the cell, defining to what extent it is elongated), sphericity (roundness of a particle: a spherical particle has a maximum value of 1), and convexity (the fraction of the cell’s area and the area of its convex: it is a measure of how a cell is shrunk) [39,40]. The area occupied by phenolics was quantified as a percentage of the spongy tissue occupied by phenolic compounds, appearing auto-fluorescent at the above-reported filter settings, over a given surface in five regions along the leaf lamina, as reported in De Micco et al. (2014) [41].

2.5. Ion and Organic Acid Analyses

From chemical analyses, 1 g of dried shoots and 1 g of dried roots (with replicates from 6 plants per treatment) were obtained after grinding them in a Wiley mill (IKA, MF10.1, Staufen, Germany) with 0.5 mm sieve. For the analysis of ions (Na+, K+, Ca2+, Mg2+ and Cl) and organic acids (quinic, acetic, formic, malic, tartaric, ossalic and citric acids) analysis, 250 mg of dried matter was extracted in 50 mL of ultrapure water (Milli-Q, Merck Millipore, Darmstadt, Germany) using a shaking water bath (ShakeTemp SW22, Julabo, Seelbach, Germany) at 80 °C for 10 min as described previously by Rouphael et al. (2017) [42]. The anions, cations and organic acids were separated and quantified by ion chromatography (ICS-3000, Dionex, Sunnyvale, CA, USA). Data are reported as content per shoot or root total dry biomass (multiplying the concentration by the dry biomass and referred to in the table as mg plant−1).

2.6. Statistical Analysis

Eco-physiological data were processed with a two-way ANOVA using the SPSS statistical package (SPSS Inc., Chicago, IL, USA) with the salt treatment and DAT used as independent factors, also showing their interactions. All the other experimental results were subjected to one-way ANOVA. Multiple comparison tests were performed with the Student–Newman–Keuls coefficient using p < 0.05 as the level of probability. Shapiro–Wilk and Kolmogorov–Smirnov tests were performed to check for normality. Percent data were transformed through an arcsine function before statistical analysis.

3. Results

3.1. Growth and Morphology

Plants subjected to the salinity treatments showed reduced growth, compared to the controls, in terms of all analyzed parameters except for the area of the single leaves (ALA) (Table 1). In particular, the canopy volume, total leaf area per plant height and leaf dry weight were significantly lower in plants treated with the CaCl2 salinity solution (CaT plants) than in those treated with the NaCl solution (NaT plants), which in turn shower significantly lower values than the not-saline control (C plants). Consequently, specific leaf weight was significantly higher in salinity-treated plants compared to the controls, with maximum values in CaT plants. As regards stem dry weight, both CaT and NaT plants showed significantly lower values than C plants (Table 1).

3.2. Leaf Gas-Exchanges and Photochemistry

The measured gas-exchange parameters were significantly influenced by both the salinity treatment and the DAT as main factors, with net photosynthetic rate (PN), stomatal conductance (gs), transpiration rate (E) and intrinsic water use efficiency (iWUE) significantly influenced also by the interaction between the two factors (Table 2). PN, gS, and E were significantly reduced by salinity treatments: CaT plants showed significantly lower values than NaT ones which in turn showed significantly lower values than the controls. PN was significantly higher at 106 DAT compared to the other two dates; gS and E were highest at 93 DAT and decreased along the season. Sub-stomatal CO2 concentration (Ci) was significantly increased only in CaT plants compared to the other two treatments and decreased at 160 DAT. Differently, iWUE was significantly higher in NaT plants compared to the other treatments and decreased along the season.
The chlorophyll a fluorescence analysis (Table 3) evidenced significant differences in photochemical parameters among salt treatments of C. citrinus plants. More specifically, the addition of NaCl in the nutrient solution (NaT plants) did not determine significant changes in quantum yield of PSII electron transport (ΦPSII), photochemical (qP) and non-photochemical quenching (qN), as well as in the maximum quantum yield of PSII photochemistry (Fv/F0) compared to the controls. On the other hand, CaCl2 in the nutrient solution (CaT plants) showed a strong decline in ΦPSII, qP, and Fv/F0 ratio compared to control and NaCl-treated plants. An opposite trend was observed for qN for CaT plants (Table 3). With the prolongation of treatments with both salts, plants reduced the photochemical processes and increased the thermal dissipation mechanisms showing a significant qP decline and increase in qN. Only for the maximum quantum yield of PSII photochemistry (Fv/F0) was the interaction S × D significant.

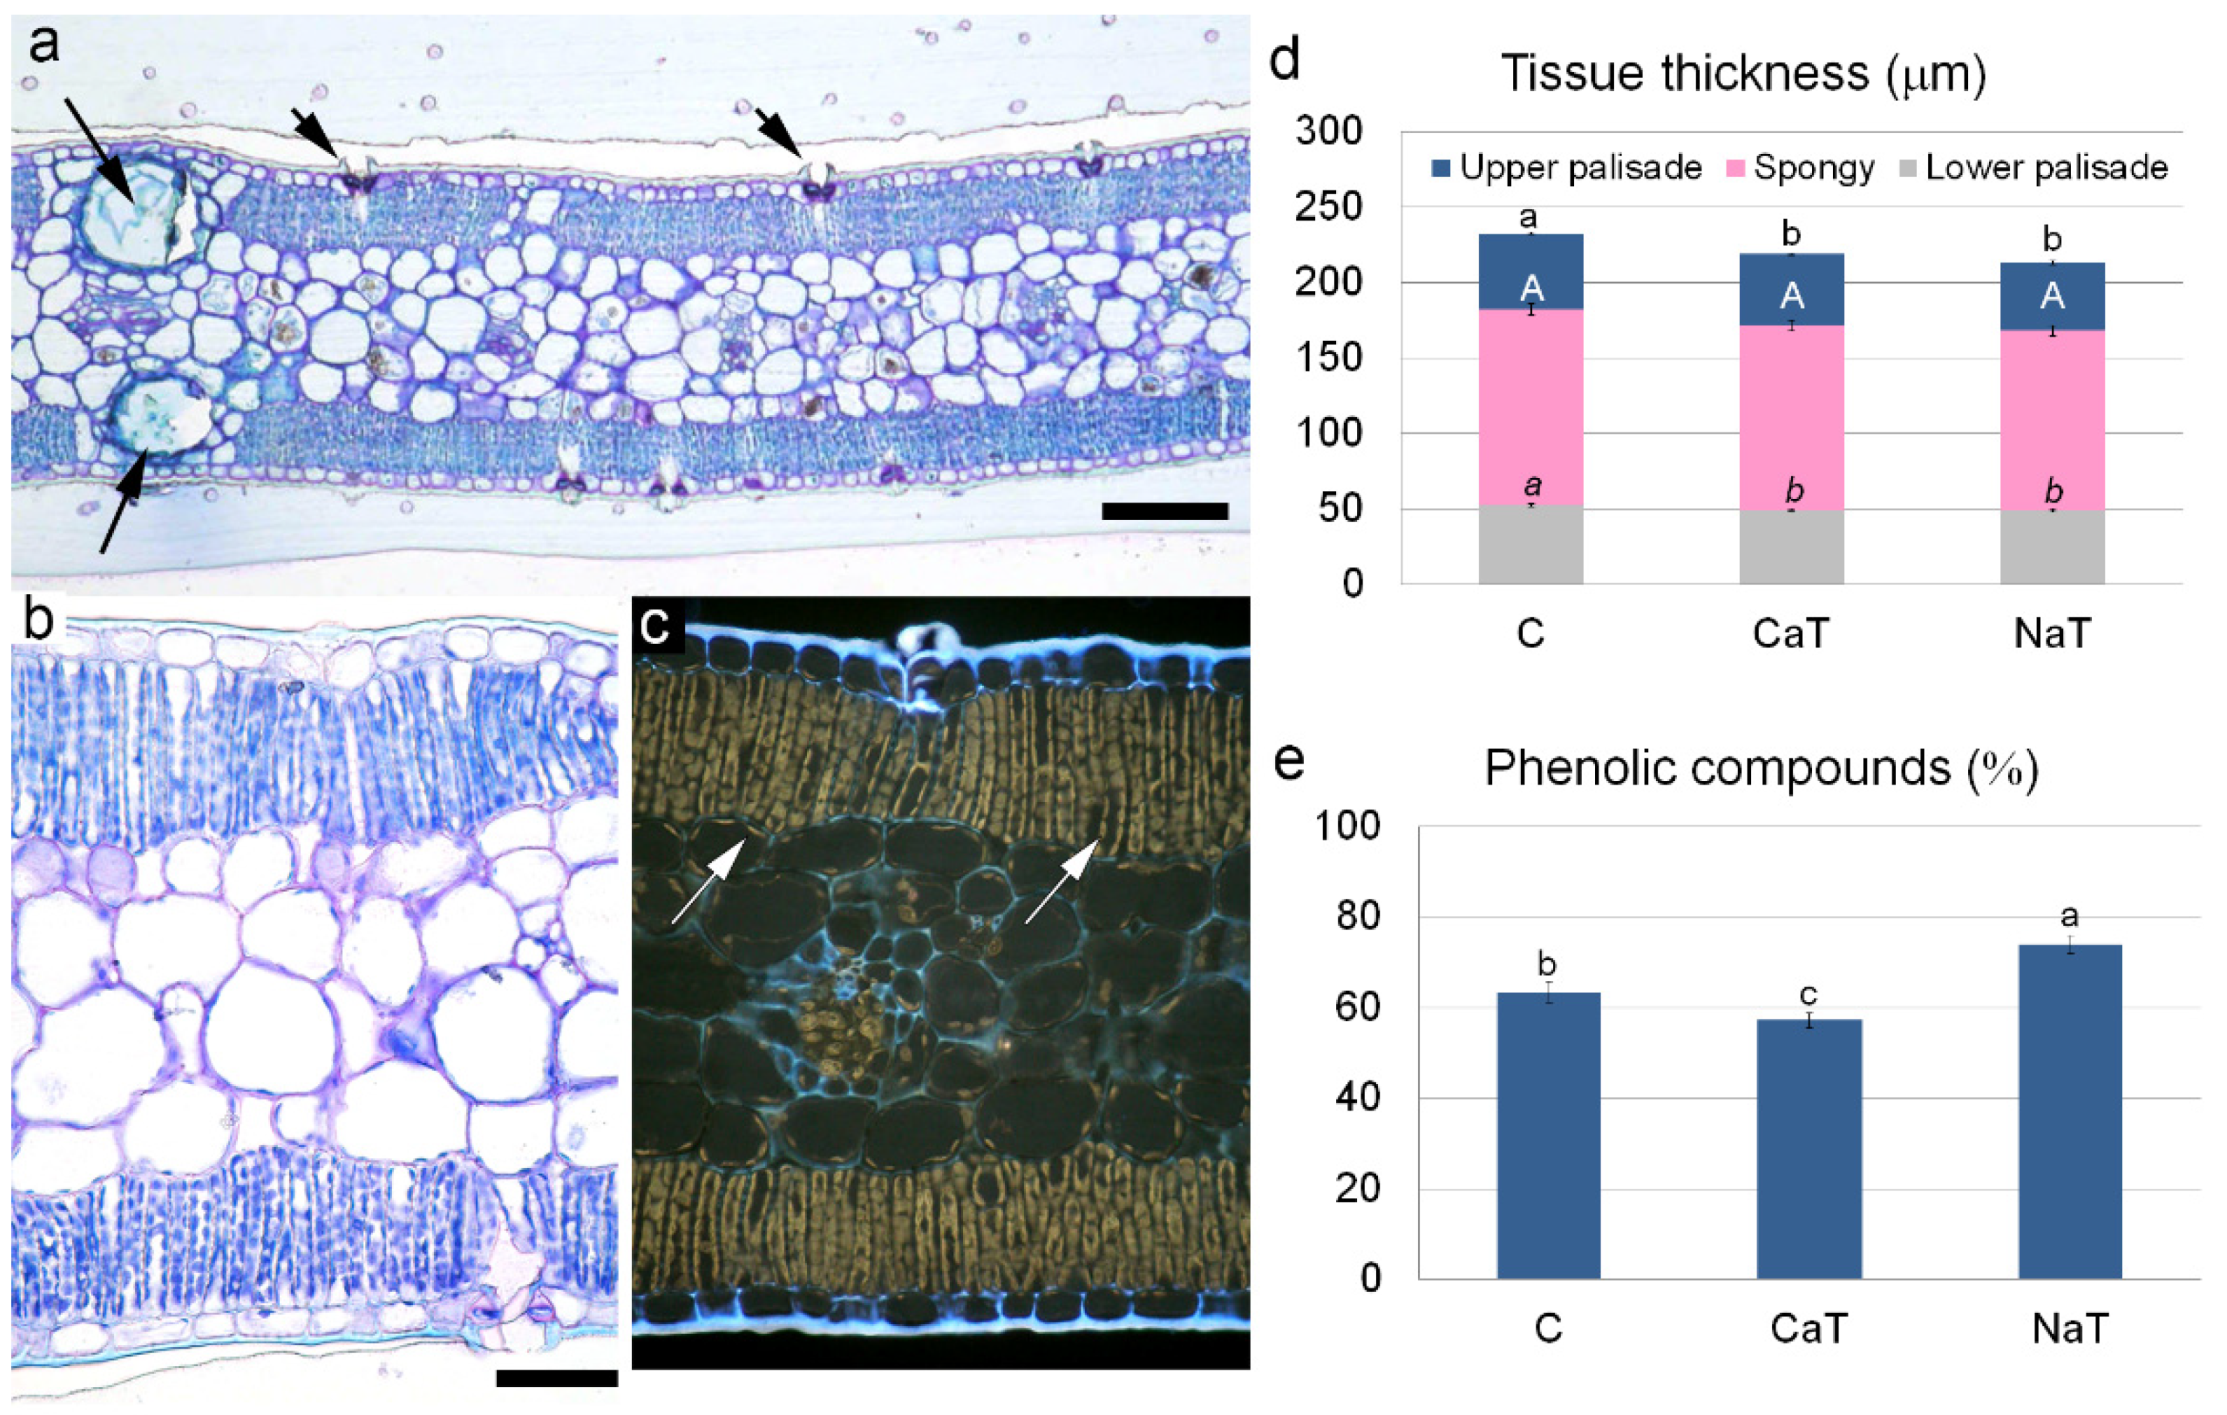
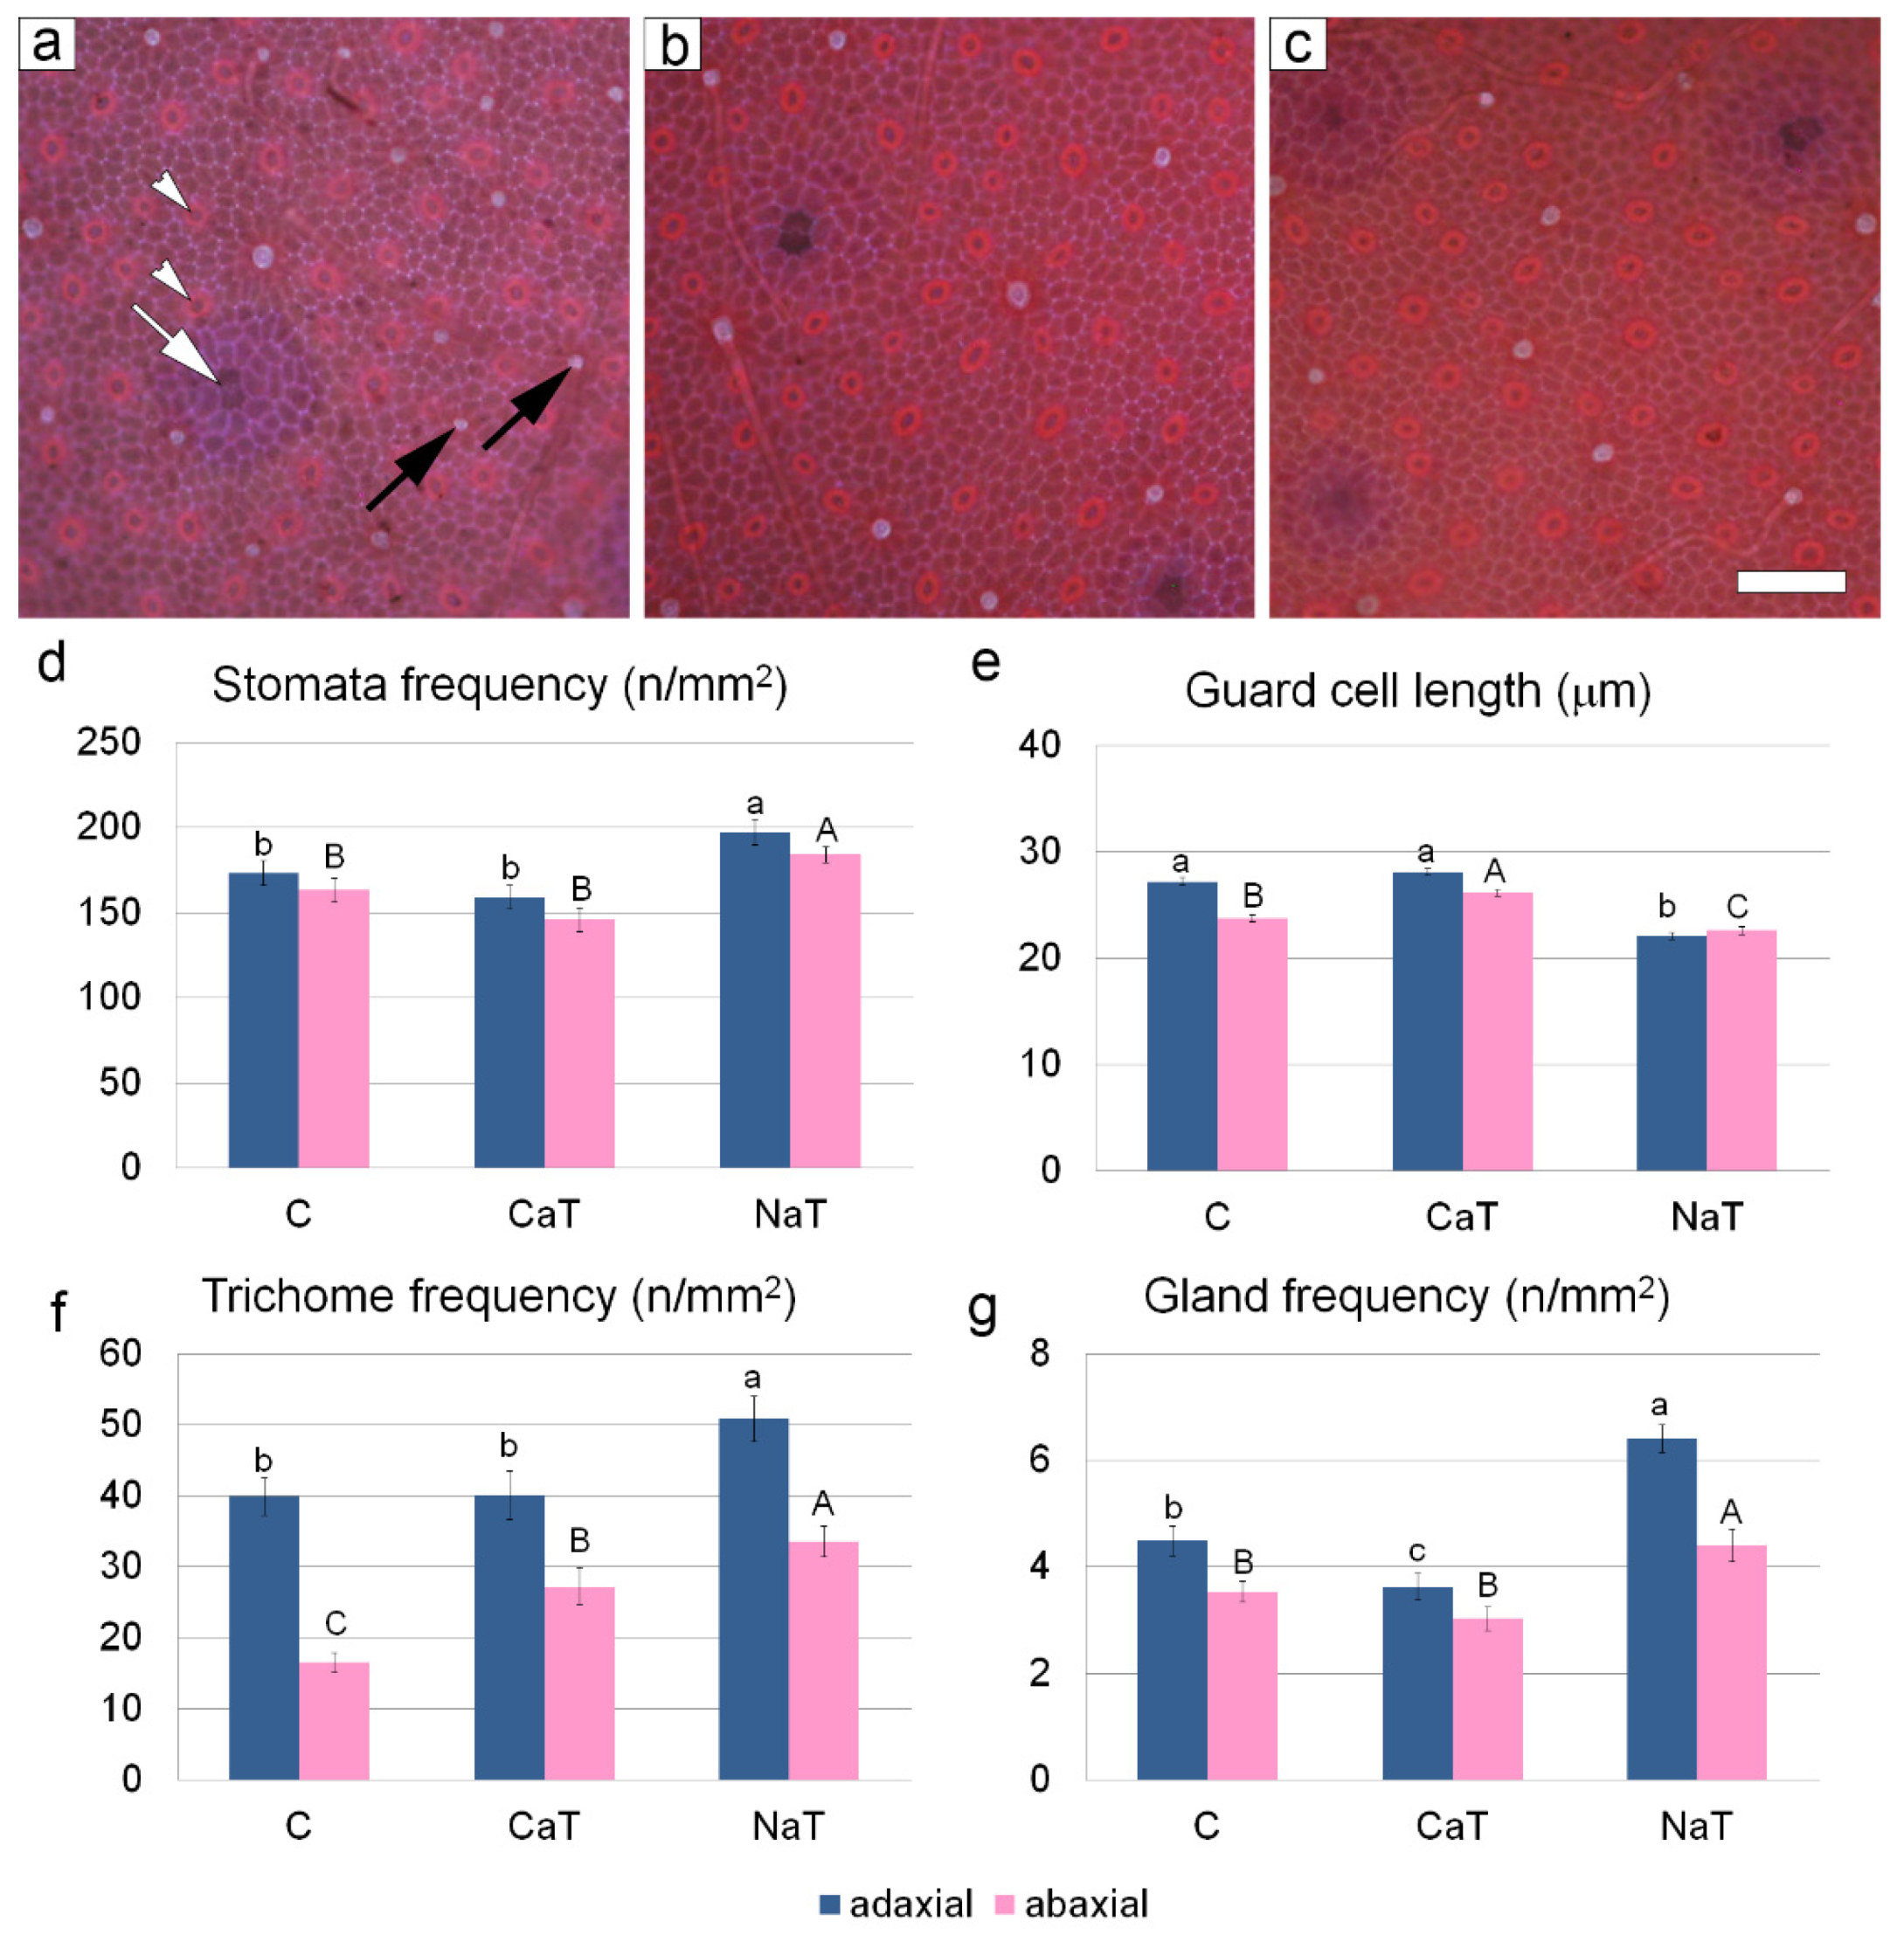
3.3. Quantitative Leaf Anatomy

The microscopy observation of histological and cytological features of C. citrinus leaves showed that mature leaves of the two different salts maintained the typical isobilateral structure (Figure 1a–c) with upper and lower epidermis showing specialized cells in the form of stomata, trichomes, and glands (Figure 2a–c), upper and lower palisade tissue (each of them made of one single layer of cells) and a median spongy tissue with reduced intercellular spaces (Figure 1a–c). Both NaT and CaT leaves seldom showed portions of the mesophyll with thickened cell walls and cell rupture which were excluded from the quantification of cell traits. Both salinity treatments significantly reduced leaf lamina thickness (Figure 1d). More specifically, both upper and lower palisade parenchyma were significantly thicker in leaves from controls compared to salinity-treated leaves which showed similar values; the thickness of the spongy parenchyma was not significantly influenced by salt treatments (Figure 1d).
Epi-fluorescence microscopy also highlighted the occurrence of yellow–orange-auto-fluorescent phenolic compounds localized along the cell membranes, especially at the chloroplast level, in both palisade and spongy parenchyma (Figure 1c). The area (%) of the palisade tissue occupied by phenolics was significantly higher in NaT than in C leaves which in turn showed significantly higher values than CaT leaves (Figure 1e).
Stomata were evident under epifluorescence microscopy due to the autofluorescence of cuticular waxes deposited on guard cells (Figure 1a–c and Figure 2a–c); trichomes were evident as well due to the white autofluorescence of their suberised cell wall, especially at the base of the cell (Figure 2a–c). Stomata frequency was significantly higher in NaT than C and CaT leaves on both upper and lower epidermis. However, stomata were smaller in leaves of plants subjected to NaT salinity, compared to C and CaT leaves (Figure 2d). More specifically, on the adaxial leaf lamina, guard cell length in NaT leaves was significantly reduced compared to both C and CaT leaves which showed similar values (Figure 2d), whereas, on the abaxial surface, guard cell length was significantly reduced in NaT leaves than in C ones which in turn showed significantly shorter stomata than CaT leaves (Figure 2d). Trichome frequency on the adaxial surface was higher in NaT than in C and CaT leaves (Figure 2e); on the abaxial surface, trichome frequency was significantly higher in NaT than in CaT leaves which showed significantly higher values than C leaves (Figure 2e). On the adaxial surface, also the frequency of glands was higher in NaT than in C and CaT leaves which showed the lowest values (Figure 2f). On the abaxial side, gland frequency in NaT leaves was significantly higher than in both C and CaT leaves (Figure 2f).
Cell size of spongy parenchyma was significantly influenced by both salts: significantly lower values of cell area and maximum and medium feret diameters were found in NaT leaves compared to CaT leaves whose cells were in turn significantly smaller than controls (Table 4). As regards the minimum feret diameter, no differences were found between the NaT and CaT treatments which were reduced compared to controls. Cell shape values in terms of elongation and sphericity did not change significantly among treatments, while convexity was significantly lower in NaT compared to both CaT and C leaves (Table 4).

3.4. Mineral and Organic Acids Profiling

From chemical analyses, both the ions and the organic acids contents were significantly influenced by the two the salinity treatments (Table 5 and Table 6). As reported in Table 5, the content of ions in both leaves and roots was significantly influenced by the addition of NaCl and CaCl2 in the nutrient solution, exception made for Mg2+ and K+ (only in roots). More specifically, NaT plants increased Na+ in both shoots and roots compared to the other two treatments (CaT and C). K+ in shoots resulted reduced in NaT plants compared to C, which in turn presented higher values than CaT. Concerning Ca2+, in both shoots and roots its concentration increased in CaT plants compared to both C and NaT. Whereas Cl had a different concentration in shoots and roots, with enhanced values in CaT shoots, higher than NaT, which in turn had higher Cl concentration than control plants. Differently, in roots, CaT and NaT plants showed increased Cl ions than C plants.
As reported in Table 6, organic acids content in shoots was significantly influenced by the addition of NaCl and CaCl2 in the nutrient solution, exception made for formic and tartaric acids. More specifically, quinic and citric acids were enhanced in C plants compared to NaT, which in turns had higher values than CaT plants. Differently, acetic and ossalic acids presented higher values in C and NaT than CaT plants. Concerning the malic acids, their content was enhanced in C plants compared to both NaT and CaT treatments.

4. Discussion

This research highlights a different physiological response of Callistemon citrinus plants when subjected to iso-osmotic solutions of NaCl and CaCl2, probably due to morpho-anatomical differences developed in these plants in response to the two salinity treatments.
The effect of salinity in water irrigation has been less investigated in ornamental species compared to edible crops, and most of the available information refers to salinity stress obtained with different concentrations of NaCl [43]. Nonetheless, research papers dealing with salinity in ornamental plants reported some common responses, such as growth decline, reduction in biomass allocation to the leaves, disturbed photosynthesis, and osmoregulation [43]. The exposure of C. citrinus plants to iso-osmotic solutions of CaCl2 (CaT plants) and NaCl (NaT plants), induced in both cases a reduction in growth compared to non-treated plants (C plants), with more pronounced effects in CaT plants which presented the strongest decrease in canopy volume, dry weight, and total leaf area (Table 1), indicating an important stress at physiological level. Higher salinity is proved to increase the Cl transport through the symplast pathway [44]. Therefore, the increased sensitivity of C. citrinus CaT plants compared to NaTs may be likely due to the occurrence of a stronger nutritional unbalance and toxic effect due to double Cl ionic content that is largely absorbed and translocated from root to shoot. These results are in agreement with Yu et al. (2021) [17] which found an inhibition of growth in Hibiscus rosa-sinensis and Mandevilla splendens plants when salinity concentration (NaCl treatments) in irrigation water was 7.0 dS m−1 and higher. Similarly, in Rabhi et al. (2018) [45] CaCl2 (40 mM) severely affected root, stem, and leaf expansion in Carthamus tinctorius L. plants. Usually, an EC > 4 dSm−1 is already considered potentially stressful for plants, imposing osmotic stress on roots and shoots [18]. In the present study, the two chloride salt solutions were characterized by equimolar concentration, with EC values of 11.1 and 11.6 dS m−1 for the NaT and CaT treatments, respectively, demonstrating an intrinsic capability by C. citrinus to withstand the salt stress, if compared to other species.
The reduction in growth in CaT plants was likely due to the greater reduction in gas-exchanges and photochemistry compared to NaT plants (Table 2) which indicated a significant decline of photosynthetic performance in these plants. Indeed, even if both salinity treatments induced a reduction in net-photosynthesis and stomatal conductance compared to control plants, the effects of CaCl2 on photosynthetic apparatus appeared more severe, as also demonstrated by the highest sub-stomatal CO2 concentration (Ci), which indicates that CO2 was not utilized at carboxylation sites. Usually, under mild and moderate drought/salt stress, plants undergo a decline in both PN and gS due to stomatal closure to prevent the worsening of water loss [46,47]. The progression of salt stress induced a common behavior in plants treated with the two types of salts. More specifically, at the beginning of the treatments the intrinsic water use efficiency (iWUE) and stomatal conductance start decreasing compared to controls and reach the lowest values at the end of treatments in concomitance with the increase in Ci (DAT 121; Table 2). These data suggest the occurrence of metabolic disorders in photosynthesis imposed by both stomatal and not stomatal limitations. Our results are consistent with findings of Marino et al. (2018) [48] which found a decline of iWUE and gs under prolonged condition of salt stress. However, the comparison between the two saline treatments evidenced that despite the strongest gas exchange decline, CaT plants exhibited an iWUE comparable to controls differently from NaT plants in which iWUE significantly declined. Generally, the stomatal closure represents an early response to osmotic stress, initially associated with high WUE, in order to save water in environment with limited water supply [49,50]. This probably explains why CaT plants maintained an iWUE comparable to control plants (Table 2). The dynamic regulation of stomatal apertures needs a large amount of K+ ion to change the guard cell turgor [51,52]. It has been reported that, in K+-deficient-plants, the velocity with which stomata react to environmental or biochemical feedbacks is lower; thus, gs is reduced [53,54]. However, in CaT plants we found reduced K+ content only in roots, which could be a sign of a higher translocation of this ion in order to speed up the stomatal movements. As a consequence, the lowest gs is probably due to the lower frequency of stomata associated to the highest dimension of stomata guard cells (Figure 2d,e). Indeed, it is well established that plants with a lower frequency of larger stomata regulate the opening/closure mechanism more slowly, gaining a less efficient control of gas-exchanges and water fluxes [55,56]. At the same time, the efficiency of photosystem II in light harvesting and conversion declined under CaCl2 treatment as well as the photochemical process, suggesting an alteration in electron transport activity and in turn a potential reduction in reductive power generation (ATP and NADPH). Contextually, in these plants, the excess of absorbed light not utilized in photochemistry was dissipated thermally as indicated by the increase in non-photochemical quenching (qN) in response to the CaCl2 treatment. In addition, the heat dissipation processes gained their importance during the stress exacerbation being more pronounced at the end of salt treatment. Indeed, under prolonged condition of salt stress, as well as under adverse environmental conditions (e.g., winter cold and summer drought), the dissipation of the absorbed light energy by heat acts as a safety valve for photosynthetic apparatus minimizing ROS generation [57,58] and avoiding photooxidation and photoinhibition. However, our data demonstrated that such a compensatory mechanism is not adequate to avoid the photodamage, as indicated by the significant drop of Fv/F0 in CaT plants compared to the respective controls. Based on this evidence, it cannot be excluded that CaCl2 salinity might have induced oxidative stress at the cellular level. Furthermore, organic acids also play a key role in the osmotic adjustment as cell osmolytes [54]. Here, we found that the salt stress diminished four organic acids (quinic, acetic, ossalic and citric acids) in CaT compared to NaT plants, probably indicating that CaT plants have fewer defense tools even at the metabolic level.
Mature leaves of C. Citrinus subjected to salinity showed limited portions of the mesophyll with thickened cell walls and signs of rupture which were not so severe as to prevent functionality. Probably, at this salinity level, this species is more resistant compared to others such as S. Tuberosum exposed to increasing concentration of NaCl up to 200 mM [59]. However, some alterations were evidenced by the quantification of anatomical traits highlighting significant differences between the NaCl and CaCl2 treatments. For example, the lowest percentage of phenolic compounds accumulated in CaT leaves (Figure 1c,e) could imply a lowest and slowest chemical protection to the cells in case of oxidative stress. Indeed, phenolics accumulate in plant tissue, especially at the periphery of plant organs, in order to be promptly released in case of their necessity as defence mechanisms [60], but they also have a role in protecting the membranes of chloroplasts and dissipating the excess of light, thus protecting the photo-inhibitory processes [61,62]. Moreover, at the leaf morpho-anatomical level, CaT plants presented fewer trichome and gland frequencies compared to NaT (Figure 1f,g). Halophytes plants, adapted to live in presence of salts, have morphological adaptations that allow them to settle on saline or alkaline soils, among those the presence of trichomes and glands play a key role [63]. Indeed, these adaptations allow plants to accumulate salts while growing, increasing the ability of tolerate high salinity concentration in the growth environment [64]. This might be another reason explaining the different physiological response of CaT plants, which reduced both their photosynthetic performance and growth rate, compared to NaT. Generally, an increase in palisade parenchyma over spongy parenchyma improves CO2 diffusion through the leaf, thus improving the photosynthetic rate [65]. For instance, this mechanism was described in Eugenia myrtifolia plants where prolonged salt stress changed the organization of leaf mesophyll, with increments in palisade parenchyma thickness which facilitated the CO2 diffusion towards carboxylation sites when stomatal aperture was reduced by the salt stress [66]. However, in C. citrinus such a mechanism has not been adopted, likely due to the isobilateral structure of the leaves. Thus, the differences in the physiological response of NaT and CaT plants were probably due to other many-sided mechanisms such as the maintenance of an unchanged spongy parenchyma thickness despite the significantly lower total leaf thickness. Indeed, the higher ratio between spongy and palisade parenchyma as in salt-treated leaves would ensure enough volume available for the vacuolar compartmentalization of the salts. The increased thickness of mesophyll is considered a typical response to salinity and related to higher cell size [67]. Franco-Navarro et al. (2016) [68] ascribed to chloride (Cl) ion the stimulation of leaf cell growth in Nicotiana tabacum L. With increasing Cl treatments, these plants developed higher spongy and epidermal cells diameters, probably due to the vacuolar compartmentalization of this ion from the tonoplast ATPase. The increments in cell size with increasing salt stress were considered also responsible for a higher mesophyll resistance. Similarly, in our study, CaT plants developed larger spongy cells than NaT ones (Table 4), likely due to higher Cl content. Indeed, CaT plants with bigger cells probably increased their leaf hydraulic resistance compared to NaT plants, slowing down their gas-exchange rates. The morphogenesis of the mesophyll cells is still not completely understood but the correlation between leaf hydraulic conductance (Kleaf) and number, dimensions and thickness of mesophyll cells has been studied [69,70]. For instance, a positive correlation between Kleaf and a higher number of cells per volume was reported in Populus tremula L. [71].

5. Conclusions

The overall results indicate that the exposure to NaCl induces the development of leaf quantitative anatomical traits in C. citrinus plants responsible for a better physiological acclimation under stress conditions compared to CaCl2, notwithstanding the same salinity level. This would explain the less severe effects on growth in NaT than CaT plants compared to controls, likely due to the occurrence of a stronger nutritional unbalance and toxic effect than osmotic response in CaT plants due to the double Cl ionic content that is largely translocated from root to shoot. Since salinity stress is increasing in the Mediterranean area, understanding the possible coordination among structural and eco-physiological strategies that C. citrinus plants apply in response to different salt stress types to maintain a good photosynthetic efficiency becomes pivotal for landscaping purposes and restoration of degraded areas.

Author Contributions

Conceptualization, C.C., V.D.M. and Y.R.; methodology, C.C., V.D.M., C.A. (Carmen Arena) and Y.R.; formal analysis, C.C., V.D.M. and C.A. (Carmen Arena); investigation, C.C., V.D.M., C.A. (Carmen Arena) and Y.R.; resources, C.C., V.D.M., C.A. (Carmen Arena), S.D.P. and Y.R.; data curation, C.C., V.D.M., C.A. (Carmen Arena) and C.A. (Chiara Amitrano); writing—original draft preparation, V.D.M., C.A. (Chiara Amitrano); writing—review and editing, all authors; visualization, all authors; supervision, C.C., V.D.M., C.A. (Carmen Arena) and Y.R.; project administration, C.C., C.A. (Carmen Arena) and S.D.P.; funding acquisition, C.C., V.D.M., C.A. (Carmen Arena), S.D.P. and Y.R. All authors have read and agreed to the published version of the manuscript.

Funding

This research received no external funding.

Institutional Review Board Statement

Not applicable.

Informed Consent Statement

Not applicable.

Data Availability Statement

The data presented in this study are available on request from the corresponding author.

Acknowledgments

The authors are grateful to Iolanda Busillo for technical support in the laboratory. We also wish to thank Giovanna Aronne for sharing the laboratory instruments.

Conflicts of Interest

The authors declare no conflict of interest.

References

  1. Wong, M. Xeriscape Plants; Cooperative Extension Service, College of Tropical Agriculture and Human Resources, University of Hawai’i at Manoa: Honolulu, HI, USA, 2008. [Google Scholar]
  2. Giordano, M.; Petropoulos, S.A.; Cirillo, C.; Rouphael, Y. Biochemical, physiological, and molecular aspects of ornamental plants adaptation to deficit irrigation. Horticulturae 2021, 7, 107. [Google Scholar] [CrossRef]
  3. Cirillo, C.; Rouphael, Y.; Caputo, R.; Raimondi, G.; Sifola, M.; De Pascale, S. Effects of high salinity and the exogenous application of an osmolyte on growth, photosynthesis, and mineral composition in two ornamental shrubs. J. Hortic. Sci. Biotechnol. 2016, 91, 14–22. [Google Scholar] [CrossRef]
  4. Rizzo, V.; Toscano, S.; Farieri, E.; Romano, D. Antioxidative defense mechanism in Callistemon citrinus (Curtis) Skeels and Viburnum tinus L. ‘Lucidum’ in response to seawater aerosol and surfactants. J. Agric. Sci. Technol. 2019, 21, 911–925. [Google Scholar]
  5. Álvarez, S.; Sánchez-Blanco, M.J. Changes in growth rate, root morphology and water use efficiency of potted Callistemon citrinus plants in response to different levels of water deficit. Sci. Hortic. 2013, 156, 54–62. [Google Scholar] [CrossRef] [Green Version]
  6. Colla, G.; Rouphael, Y.; Leonardi, C.; Bie, Z. Role of grafting in vegetable crops grown under saline conditions. Sci. Hortic. 2010, 127, 147–155. [Google Scholar] [CrossRef]
  7. Qadir, M.; Quillérou, E.; Nangia, V.; Murtaza, G.; Singh, M.; Thomas, R.J.; Drechsel, P.; Noble, A.D. Economics of Salt-Induced Land Degradation and Restoration. In Proceedings of Natural Resources Forum; Wiley Online Library: Hoboken, NJ, USA, 2014; pp. 282–295. [Google Scholar]
  8. Hasanuzzaman, M.; Shabala, L.; Zhou, M.; Brodribb, T.J.; Corkrey, R.; Shabala, S. Factors determining stomatal and non-stomatal (residual) transpiration and their contribution towards salinity tolerance in contrasting barley genotypes. Environ. Exp. Bot. 2018, 153, 10–20. [Google Scholar] [CrossRef]
  9. Gallé, A.; Haldimann, P.; Feller, U. Photosynthetic performance and water relations in young pubescent oak (Quercus pubescens) trees during drought stress and recovery. New Phytol. 2007, 174, 799–810. [Google Scholar] [CrossRef] [PubMed]
  10. America, I.; Zhang, C.; Werner, A.D.; van der Zee, S.E. Evaporation and salt accumulation effects on riparian freshwater lenses. Water Resour. Res. 2020, 56, e2019WR026380. [Google Scholar] [CrossRef]
  11. Toscano, S.; Ferrante, A.; Romano, D. Response of Mediterranean ornamental plants to drought stress. Horticulturae 2019, 5, 6. [Google Scholar] [CrossRef] [Green Version]
  12. Yeager, T.H.; von Merveldt, J.K.; Larsen, C.A. Ornamental plant response to percentage of reclaimed water irrigation. HortScience 2010, 45, 1610–1615. [Google Scholar] [CrossRef] [Green Version]
  13. Grieve, C.M. Irrigation of floricultural and nursery crops with saline wastewaters. Isr. J. Plant Sci. 2011, 59, 187–196. [Google Scholar] [CrossRef]
  14. Zhao, Z.; Li, T.; Cheng, Y.; Wang, F.; Zhao, X. Morphological and metabolic responses of four Iris germanica cultivars under salinity stress. Sci. Hortic. 2021, 281, 109960. [Google Scholar] [CrossRef]
  15. Niu, G.; Cabrera, R.I. Growth and physiological responses of landscape plants to saline water irrigation: A review. HortScience 2010, 45, 1605–1609. [Google Scholar] [CrossRef]
  16. Cai, X.; Sun, Y.; Starman, T.; Hall, C.; Niu, G. Response of 18 Earth-Kind® rose cultivars to salt stress. HortScience 2014, 49, 544–549. [Google Scholar] [CrossRef] [Green Version]
  17. Yu, X.; Her, Y.; Chang, A.; Song, J.-H.; Campoverde, E.V.; Schaffer, B. Assessing the Effects of Irrigation Water Salinity on Two Ornamental Crops by Remote Spectral Imaging. Agronomy 2021, 11, 375. [Google Scholar] [CrossRef]
  18. Chinnusamy, V.; Jagendorf, A.; Zhu, J.K. Understanding and improving salt tolerance in plants. Crop Sci. 2005, 45, 437–448. [Google Scholar] [CrossRef] [Green Version]
  19. Munns, R.; Tester, M. Mechanisms of salinity tolerance. Annu. Rev. Plant Biol. 2008, 59, 651–681. [Google Scholar] [CrossRef] [Green Version]
  20. Annunziata, M.G.; Ciarmiello, L.F.; Woodrow, P.; Maximova, E.; Fuggi, A.; Carillo, P. Durum wheat roots adapt to salinity remodeling the cellular content of nitrogen metabolites and sucrose. Front. Plant Sci. 2017, 7, 2035. [Google Scholar] [CrossRef] [Green Version]
  21. De Micco, V.; Aronne, G. Morpho-Anatomical Traits for Plant Adaptation to Drought. In Plant Responses to Drought Stress; Springer: Berlin/Heidelberg, Germany, 2012; pp. 37–61. [Google Scholar] [CrossRef]
  22. Shabala, S.; Munns, R. Salinity stress: Physiological constraints and adaptive mechanisms. Plant Stress Physiol. 2012, 1, 59–93. [Google Scholar]
  23. Shabala, S.; Hariadi, Y.; Jacobsen, S.-E. Genotypic difference in salinity tolerance in quinoa is determined by differential control of xylem Na+ loading and stomatal density. J. Plant Physiol. 2013, 170, 906–914. [Google Scholar] [CrossRef]
  24. Zhu, M.; Zhou, M.; Shabala, L.; Shabala, S. Linking osmotic adjustment and stomatal characteristics with salinity stress tolerance in contrasting barley accessions. Funct. Plant Biol. 2014, 42, 252–263. [Google Scholar] [CrossRef]
  25. Hughes, J.; Hepworth, C.; Dutton, C.; Dunn, J.A.; Hunt, L.; Stephens, J.; Waugh, R.; Cameron, D.D.; Gray, J.E. Reducing stomatal density in barley improves drought tolerance without impacting on yield. Plant Physiol. 2017, 174, 776–787. [Google Scholar] [CrossRef] [Green Version]
  26. Rahnama, A.; James, R.A.; Poustini, K.; Munns, R. Stomatal conductance as a screen for osmotic stress tolerance in durum wheat growing in saline soil. Funct Plant Biol. 2010, 37, 255–263. [Google Scholar] [CrossRef]
  27. Pagter, M.; Bragato, C.; Malagoli, M.; Brix, H. Osmotic and ionic effects of NaCl and Na2SO4 salinity on Phragmites australis. Aquat. Bot. 2009, 90, 43–51. [Google Scholar] [CrossRef]
  28. Cirillo, C.; De Micco, V.; Arena, C.; Carillo, P.; Pannico, A.; De Pascale, S.; Rouphael, Y. Biochemical, Physiological and Anatomical Mechanisms of Adaptation of Callistemon citrinus and Viburnum lucidum to NaCl and CaCl2 Salinization. Front. Plant Sci. 2019, 10, 742. [Google Scholar] [CrossRef] [PubMed]
  29. Gupta, K.; Kumar, P.; Pathan, S.K.; Sharma, K.P. Urban Neighborhood Green Index–A measure of green spaces in urban areas. Landsc. Urban Plan. 2012, 105, 325–335. [Google Scholar] [CrossRef]
  30. Cornelissen, J.; Lavorel, S.; Garnier, E.; Diaz, S.; Buchmann, N.; Gurvich, D.; Reich, P.B.; Ter Steege, H.; Morgan, H.; Van Der Heijden, M. A handbook of protocols for standardised and easy measurement of plant functional traits worldwide. Aust. J. Bot. 2003, 51, 335–380. [Google Scholar] [CrossRef] [Green Version]
  31. Arena, C.; Conti, S.; Francesca, S.; Melchionna, G.; Hájek, J.; Barták, M.; Barone, A.; Rigano, M.M. Eco-physiological screening of different tomato genotypes in response to high temperatures: A combined field-to-laboratory approach. Plants 2020, 9, 508. [Google Scholar] [CrossRef] [Green Version]
  32. Lichtenthaler, H.K.; Babani, F. Light adaptation and senescence of the photosynthetic apparatus. Changes in pigment composition, chlorophyll fluorescence parameters and photosynthetic activity. In Chlorophyll a Fluorescence; Springer: Berlin/Heidelberg, Germany, 2004; pp. 713–736. [Google Scholar]
  33. Genty, B.; Briantais, J.-M.; Baker, N.R. The relationship between the quantum yield of photosynthetic electron transport and quenching of chlorophyll fluorescence. Biochim. Biophys. Acta BBA Gen. Subj. 1989, 990, 87–92. [Google Scholar] [CrossRef]
  34. Bilger, W.; Björkman, O. Role of the xanthophyll cycle in photoprotection elucidated by measurements of light-induced absorbance changes, fluorescence and photosynthesis in leaves of Hedera canariensis. Photosynth. Res. 1990, 25, 173–185. [Google Scholar] [CrossRef]
  35. De Micco, V.; Arena, C.; Vitale, L.; Aronne, G.; Virzo De Santo, A. Anatomy and photochemical behaviour of Mediterranean Cistus incanus winter leaves under natural outdoor and warmer indoor conditions. Botany 2011, 89, 677–688. [Google Scholar] [CrossRef]
  36. Reale, L.; Gigante, D.; Landucci, F.; Ferranti, F.; Venanzoni, R. Morphological and histo-anatomical traits reflect die-back in Phragmites australis (Cav.) Steud. Aquat. Bot. 2012, 103, 122–128. [Google Scholar] [CrossRef]
  37. Ruzin, S.E. Plant Microtechnique and Microscopy; Oxford University Press New York: New York, NY, USA, 1999; p. 322. [Google Scholar]
  38. Fukazawa, K. Ultraviolet Microscopy. In Methods in Lignin Chemistry; Springer: Berlin/Heidelberg, Germany, 1992; pp. 110–121. [Google Scholar]
  39. Van Buggenhout, S.; Grauwet, T.; Van Loey, A.; Hendrickx, M. Structure/processing relation of vacuum infused strawberry tissue frozen under different conditions. Eur. Food Res. Technol. 2008, 226, 437–448. [Google Scholar] [CrossRef]
  40. De Micco, V.; Aronne, G. Combined histochemistry and autofluorescence for identifying lignin distribution in cell walls. Biotech. Histochem. 2007, 82, 209–216. [Google Scholar] [CrossRef] [PubMed]
  41. De Micco, V.; Arena, C.; Aronne, G. Anatomical alterations of Phaseolus vulgaris L. mature leaves irradiated with X-rays. Plant Biol. 2014, 16, 187–193. [Google Scholar] [CrossRef]
  42. Rouphael, Y.; Colla, G.; Giordano, M.; El-Nakhel, C.; Kyriacou, M.C.; De Pascale, S. Foliar applications of a legume-derived protein hydrolysate elicit dose-dependent increases of growth, leaf mineral composition, yield and fruit quality in two greenhouse tomato cultivars. Sci. Hortic. 2017, 226, 353–360. [Google Scholar] [CrossRef]
  43. García-Caparrós, P.; Lao, M.T. The effects of salt stress on ornamental plants and integrative cultivation practices. Sci. Hortic. 2018, 240, 430–439. [Google Scholar] [CrossRef]
  44. Geilfus, C.M. Chloride: From nutrient to toxicant. Plant Cell Phys. 2018, 59, 877–886. [Google Scholar] [CrossRef]
  45. Rabhi, M.; Farhat, N.; Msilini, N.; Rajhi, H.; Smaoui, A.; Abdelly, C.; Lachaâl, M.; Karray-Bouraoui, N. Physiological responses of Carthamus tinctorius to CaCl2 salinity under Mg-sufficient and Mg-deficient conditions. Flora 2018, 246, 96–101. [Google Scholar] [CrossRef]
  46. Moriana, A.; Pérez-López, D.; Prieto, M.; Ramírez-Santa-Pau, M.; Pérez-Rodriguez, J. Midday stem water potential as a useful tool for estimating irrigation requirements in olive trees. Agric. Water Manag. 2012, 112, 43–54. [Google Scholar] [CrossRef]
  47. Amitrano, C.; Rouphael, Y.; Pannico, A.; De Pascale, S.; De Micco, V. Reducing the Evaporative Demand Improves Photosynthesis and Water Use Efficiency of Indoor Cultivated Lettuce. Agronomy 2021, 11, 1396. [Google Scholar] [CrossRef]
  48. Marino, G.; Caruso, T.; Ferguson, L.; Marra, F.P. Gas exchanges and stem water potential define stress thresholds for efficient irrigation management in olive (Olea europea L.). Water 2018, 10, 342. [Google Scholar] [CrossRef] [Green Version]
  49. Hepworth, C.; Doheny-Adams, T.; Hunt, L.; Cameron, D.D.; Gray, J.E. Manipulating stomatal density enhances drought tolerance without deleterious effect on nutrient uptake. New Phytol. 2015, 208, 336–341. [Google Scholar] [CrossRef] [PubMed] [Green Version]
  50. Ouyang, W.; Struik, P.C.; Yin, X.; Yang, J. Stomatal conductance, mesophyll conductance, and transpiration efficiency in relation to leaf anatomy in rice and wheat genotypes under drought. J. Exp. Bot. 2017, 68, 5191–5205. [Google Scholar] [CrossRef] [PubMed] [Green Version]
  51. Roelfsema, M.R.G.; Hedrich, R. Studying guard cells in the intact plant: Modulation of stomatal movement by apoplastic factors. New Phytol. 2002, 153, 425–431. [Google Scholar] [CrossRef] [PubMed]
  52. Trankner, M.; Tavakol, E.; Jakli, B. Functioning of potassium and magnesium in photosynthesis, photosynthate translocation and photoprotection. Physiol. Plant 2018, 163, 414–431. [Google Scholar] [CrossRef] [Green Version]
  53. Erel, R.; Yermiyahu, U.; Ben-Gal, A.; Dag, A.; Shapira, O.; Schwartz, A. Modification of non-stomatal limitation and photoprotection due to K and Na nutrition of olive trees. J. Plant Phys. 2015, 177, 1–10. [Google Scholar] [CrossRef] [PubMed]
  54. Jákli, B.; Tavakol, E.; Tränkner, M.; Senbayram, M.; Dittert, K. Quantitative limitations to photosynthesis in K deficient sunflower and their implications on water-use efficiency. J. Plant Physiol. 2017, 209, 20–30. [Google Scholar] [CrossRef] [PubMed]
  55. Carillo, P.; Cirillo, C.; De Micco, V.; Arena, C.; De Pascale, S.; Rouphael, Y. Morpho-anatomical, physiological and biochemical adaptive responses to saline water of Bougainvillea spectabilis Willd. trained to different canopy shapes. Agric. Water Manag. 2019, 212, 12–22. [Google Scholar] [CrossRef]
  56. Amitrano, C.; Arena, C.; Cirillo, V.; De Pascale, S.; De Micco, V. Leaf morpho-anatomical traits in Vigna radiata L. affect plant photosynthetic acclimation to changing vapor pressure deficit. Environ. Exp. Bot. 2021, 104453. [Google Scholar] [CrossRef]
  57. Arena, C.; De Micco, V.; De Maio, A.; Mistretta, C.; Aronne, G.; Vitale, L. Winter and summer leaves of Cistus incanus: Differences in leaf morphofunctional traits, photosynthetic energy partitioning, and poly (ADP-ribose) polymerase (PARP) activity. Botany 2013, 91, 805–813. [Google Scholar] [CrossRef]
  58. Vitale, L.; Arena, C.; De Santo, A.V. Seasonal changes in hotosynthetic activity and photochemical efficiency of the Mediterranean shrub Phillyrea angustifolia L. Plant Biosyst. Int. J. Deal. Aspects Plant Biol. 2012, 146, 443–450. [Google Scholar]
  59. Gao, L.; Lu, Z.; Ding, L.; Xie, K.; Wang, M.; Ling, N.; Guo, S. Anatomically induced changes in rice leaf mesophyll conductance explain the variation in photosynthetic nitrogen use efficiency under contrasting nitrogen supply. BMC Plant Biol. 2020, 20, 527. [Google Scholar] [CrossRef] [PubMed]
  60. Cirillo, C.; Arena, C.; Rouphael, Y.; Caputo, R.; Amitrano, C.; Petracca, F.; De Francesco, S.; Vitale, E.; Erbaggio, A.; Bonfante, A. Counteracting the negative effects of copper limitations through the biostimulatory action of a tropical plant extract in grapevine under pedo-climatic constraints. Front. Environ. Sci. 2021, 9, 76. [Google Scholar] [CrossRef]
  61. Lattanzio, V.; Kroon, P.A.; Quideau, S.; Treutter, D. Plant phenolics—secondary metabolites with diverse functions. Recent Adv. Polyphen. Res. 2008, 1, 1–35. [Google Scholar]
  62. De Micco, V.; Amitrano, C.; Stinca, A.; Izzo, L.G.; Zalloni, E.; Balzano, A.; Barile, R.; Conti, P.; Arena, C. Dust accumulation due to anthropogenic impact induces anatomical and photochemical changes in leaves of Centranthus ruber growing on the slope of the Vesuvius volcano. Plant Biol. 2019, 22, 93–102. [Google Scholar] [CrossRef] [PubMed]
  63. Wahid, A. Physiological significance of morpho-anatomical features of halophytes with particular reference to Cholistan flora. Int. J. Agric. Biol. 2003, 5, 207–212. [Google Scholar]
  64. Rozentsvet, O.; Nesterov, V.; Bogdanova, E. Structural, physiological, and biochemical aspects of salinity tolerance of halophytes. Rus. J. Plant Phys. 2017, 64, 464–477. [Google Scholar] [CrossRef]
  65. Acosta-Motos, J.R.; Ortuño, M.F.; Bernal-Vicente, A.; Diaz-Vivancos, P.; Sanchez-Blanco, M.J.; Hernandez, J.A. Plant responses to salt stress: Adaptive mechanisms. Agronomy 2017, 7, 18. [Google Scholar] [CrossRef] [Green Version]
  66. Acosta-Motos, J.-R.; Diaz-Vivancos, P.; Álvarez, S.; Fernández-García, N.; Sanchez-Blanco, M.J.; Hernández, J.A. Physiological and biochemical mechanisms of the ornamental Eugenia myrtifolia L. plants for coping with NaCl stress and recovery. Planta 2015, 242, 829–846. [Google Scholar] [CrossRef] [Green Version]
  67. Longstreth, D.J.; Nobel, P.S. Salinity effects on leaf anatomy: Consequences for photosynthesis. Plant Physiol. 1979, 63, 700–703. [Google Scholar] [CrossRef] [PubMed] [Green Version]
  68. Franco-Navarro, J.D.; Brumós, J.; Rosales, M.A.; Cubero-Font, P.; Talón, M.; Colmenero-Flores, J.M. Chloride regulates leaf cell size and water relations in tobacco plants. J. Exp. Bot. 2016, 67, 873–891. [Google Scholar] [CrossRef] [PubMed] [Green Version]
  69. Aasamaa, K.; Sõber, A.; Rahi, M. Leaf anatomical characteristics associated with shoot hydraulic conductance, stomatal conductance and stomatal sensitivity to changes of leaf water status in temperate deciduous trees. Funct. Plant Biol. 2001, 28, 765–774. [Google Scholar] [CrossRef]
  70. Sack, L.; Cowan, P.; Jaikumar, N.; Holbrook, N. The ‘hydrology’of leaves: Co-ordination of structure and function in temperate woody species. Plant Cell Environ. 2003, 26, 1343–1356. [Google Scholar] [CrossRef] [Green Version]
  71. Aasamaa, K.; Sõber, A. Responses of stomatal conductance to simultaneous changes in two environmental factors. Tree Physiol. 2011, 31, 855–864. [Google Scholar] [CrossRef] [PubMed] [Green Version]
Figure 1. Light (a,b) and epi-fluorescence (c) microscopy views of leaf lamina cross sections of C. citrinus control leaves. In (a), long and short arrows point to glands and cuticular waxes on stomata guard cells, respectively. Effect of salinity on the thickness of upper palisade, spongy and lower palisade parenchyma (d), and on the percentage of phenolics (e). Mean values and standard errors are shown. In graphs (d,e), different letters correspond to significantly different values between treatments (p < 0.05). Images in (b,c) are at the same magnification; scale bar = 100 μm in (a) and 50 mm in (b).
Forests 12 01666 g001
Figure 2. Epi-fluorescence microscopy views of upper epidermis of leaves of C. citrinus plants subjected to the different salinity treatments: (a) not salt control (C); (b) CaCl2 salinity treatment (CaT); (c) NaCl salinity treatment (NaT). Stomata (white arrowheads), glands (white arrows) and the trichomes (black arrows) emit autofluorescence with different wavelengths. Effect of salinity on stomata frequency (d) and length of guard cells and size (e), trichome (f) and gland (g) frequency, on the adaxial and abaxial leaf lamina. Mean values and standard errors are shown. In graphs (dg), Different letters correspond to significantly different values between treatments (p < 0.05). Images in (ac) are at the same magnification; scale bar = 100 μm.
Forests 12 01666 g002
Table 1. Effects of salt treatment in the nutrient solution on canopy volume (CV), total leaf area (TLA) per plant height (H), leaf dry weight (LDW) and stem dry weight (SDW) per plant, average leaf area (ALA), and specific leaf weight (SLW) in C. citrinus plants. Mean values and standard errors are shown. Different letters correspond to significantly different values (p < 0.05).
CV
(m3 plant−1)
TLA/H
(cm2 cm−1)
LDW
(g plant−1)
SDW
(g plant−1)
ALA
(cm2)
SLW
(g DW cm−2)
Salt treatment
C9.44 ± 0.61 a1.47 ± 0.04 a 162.3 ± 7.61 a107.5 ± 3.96 a4.39 ± 0.22 a98.36 ± 3.59 c
CaT4.38 ± 0.30 c0.79 ± 0.06 c95.56 ± 5.52 c85.34 ± 2.44 b3.86 ± 0.20 a149.5 ± 4.93 a
NaT6.90 ± 0.37 b1.23 ± 0.04 b131.2 ± 4.0 b93.77 ± 2.80 b4.28 ± 0.19 a114.3 ± 1.93 b
Significance ************NS***
NS, ***, Not significant or significant at p < 0.05, 0.01, and 0.001, respectively.
Table 2. Effects of salt treatment in the nutrient solution on net-photosynthetic rate (PN), sub-stomatal CO2 concentration (Ci), stomatal conductance (gs), transpiration rate (E), and intrinsic water use efficiency (iWUE) in C. citrinus plants. Mean values and standard errors are shown. Different letters correspond to significantly different values (p < 0.05).
PN
(µmol CO2 m−2 s−1)
Ci
(µmol mol−1)
gs
(mmol m−2 s−1)
E
(mol H2O m−2 s−1)
iWUE
(µmol CO2 mmol−1 H2O)
Salt treatment
C7.55 ± 0.26 a210.3 ± 7.63 b119.4 ± 4.94 a2.23 ± 0.07 a72.92 ± 4.83 b
CaT1.96 ± 0.26 c228.9 ± 7.63 a28.89 ± 4.94 c0.83 ± 0.07 c73.46 ± 4.83 b
NaT4.75 ± 0.25 b189.8 ± 7.33 b61.41 ± 4.71 b1.36 ± 0.06 b94.41 ± 4.61 a
DAT
93 (12 June)4.86 ± 0.31 b209.5 ± 6.61 b92.18 ± 5.87 a2.05 ± 0.08 a104.1 ± 4.19 a
106 (25 June)5.25 ± 0.22 a175.4 ± 6.68 c73.62 ± 4.28 b1.21 ± 0.06 b80.76 ± 4.19 b
121 (10 July)4.16 ± 0.22 b244.2 ± 9.06 a43.92 ± 4.28 c1.15 ± 0.06 b55.91 ± 5.74 c
Significance
S**************
D**************
S × D***NS****
NS, *; **, ***, Not significant or significant at p < 0.05, 0.01, and 0.001, respectively.
Table 3. Effects of salt treatment on the quantum yield of PSII electron transport (ΦPSII), photochemical quenching (qP), non-photochemical quenching (qN) and maximum quantum yield of PSII photochemistry (Fv/F0) in C. citrinus plants. Mean values and standard errors are shown. Different letters correspond to significantly different values (p < 0.05).
ΦPSIIqPqNFv/Fo
Salt treatment
C0.652 ± 0.012 a0.917 ± 0.012 a0.443 ± 0.035 b2.082 ± 0.138 a
CaT0.525 ± 0.014 b0.874 ± 0.013 b0.515 ± 0.035 a1.161 ± 0.156 b
NaT0.658 ± 0.015 a0.917 ± 0.011 a0.379 ± 0.036 b2.176 ± 0.165 a
DAT
93 (12 June)0.605 ± 0.018 a0.886 ± 0.011 b0.498 ± 0.034 a1.759 ± 0.135 a
106 (25 June)0.609 ± 0.024 a0.909 ± 0.016 a0.403 ± 0.044 b1.753 ± 0.184 a
121 (10 July)0.620 ± 0.022 a0.905 ± 0.013 ab0.426 ± 0.037 b1.908 ± 0.205 a
Significance
S************
DNS***NS
S × DNSNSNS*
NS, *; **, ***, Not significant or significant at p < 0.05, 0.01, and 0.001, respectively.
Table 4. Effects of salt treatment in the nutrient solution on area, maximum feret diameter (MaFD), mean feret diameter (MeFD), minimum feret diameter (MiFD), elongation, sphericity, and convexity of spongy parenchyma cells of leaves of C. citrinus plants. Mean values and standard errors are shown. Different letters correspond to significantly different values (p < 0.05).
Area
(μm2)
MaFD
(μm)
MeFD
(μm)
MiFD
(μm)
ElongationSphericityConvexity
Salt treatment
C736.9 ± 1.04 a39.72 ± 1.02 a 34.47 ± 1.02 a27.57 ± 1.02 a1.50 ± 0.044 a0.535 ± 0.019 a0.905 ± 0.006 a
CaT649.3 ± 1.04 b37.29 ± 1.02 b32.31 ± 1.02 b25.77 ± 1.02 b1.47 ± 0.029 a0.530 ± 0.018 a0.904 ± 0.005 a
NaT488.0 ± 1.05 c33.39 ± 1.03 c28.71 ± 1.03 c22.62 ± 1.03 b1.53 ± 0.038 a0.513 ± 0.019 a0.880 ± 0.007 b
Significance ************NSNS**
NS, **, ***, Not significant or significant at p < 0.05, 0.01, and 0.001, respectively.
Table 5. Effects of salt treatment in the nutrient solution on shoot and root mineral uptake of the main ionic species (Na+, K+, Ca2+, Mg2+, Cl) in C. citrinus plants. Mean values and standard errors are shown. Different letters correspond to significantly different values (p < 0.05).
Na+
(mg plant−1)
K+
(mg plant−1)
Ca2+
(mg plant−1)
Mg2+
(mg plant−1)
Cl
(mg plant−1)
shootrootshootrootshootrootshootrootshootroot
Salt treatment
C120.4 ± 11.40 b81.88 ± 19.24 b1803 ± 143.4 a533.0 ± 77.49 a115.9 ± 7.550 b 77.4 ± 11.03 b178.0 ± 18.81 a52.12 ± 8.77 a518.8 ± 56.00 c86.42 ± 13.97 b
CaT83.21 ± 7.46 b64.27 ± 11.14 b1446 ± 142.9 ab342.3 ± 42.36 c434.6 ± 46.53 a159.2 ± 21.24 a150.1 ± 13.45 a59.05 ± 9.33 a2137 ± 316.6 a292.7 ± 43.10 a
NaT589.2 ± 65.72 a372.5 ± 60.97 a1232 ± 82.23 b389.7 ± 34.95 b87.0 ± 4.34 b 55.45 ± 8.33 b132.4 ± 10.46 a50.37 ± 5.13 a1242 ± 210.3 b356.6 ± 46.01 a
Significance *******NS******NSNS******
NS, *; ***, Not significant or significant at p < 0.05, 0.01, and 0.001, respectively.
Table 6. Effects of salt treatment in the nutrient solution on main organic acids (quinic, acetic, formic, malic, tartaric, ossalic and citric acids) leaf content in C. citrinus plants. Mean values and standard errors are shown. Different letters correspond to significantly different values (p < 0.05).
Quinic ac.
(g/kg DW)
Acetic ac.
(g/kg DW)
Formic ac.
(g/kg DW)
Malic ac.
(g/kg DW)
Tartaric ac.
(g/kg DW)
Ossalic ac.
(g/kg DW)
Citric ac.
(g/kg DW)
Salt treatment
C15.24 ± 1.38 a3.88 ± 0.37 a0.17 ± 0.01 a1.49 ± 0.16 a0.23 ± 0.02 a1.41 ± 0.07 a1.30 ± 0.11 a
CaT2.160 ± 0.67 c1.58 ± 0.43 b0.15 ± 0.02 a0.56 ± 0.07 b0.32 ± 0.04 a0.73 ± 0.10 b0.29 ± 0.04 c
NaT10.70 ± 1.51 b3.73 ± 0.41 a0.16 ± 0.02 a0.83 ± 0.13 b0.25 ±0.03 a1.17 ± 0.11 a0.70 ± 0.07 b
Significance *****NS***NS******
NS, **, ***, Not significant or significant at p < 0.05, 0.01, and 0.001, respectively.
Publisher’s Note: MDPI stays neutral with regard to jurisdictional claims in published maps and institutional affiliations.

