Article

Birds and the Fire Cycle in a Resilient Mediterranean Forest: Is There Any Baseline?

CEFE, CNRS, EPHE-PSL University, Montpellier University, IRD, 1919 Route de Mende, 34293 Montpellier, France
Forests 2021, 12(12), 1644; https://doi.org/10.3390/f12121644
Submission received: 28 September 2021 / Revised: 18 November 2021 / Accepted: 24 November 2021 / Published: 27 November 2021
(This article belongs to the Special Issue Forest Fires and Biodiversity in the Anthropocene)

Abstract

:
This study investigates the effects of recurrent wildfires on the resilience of a typical Mediterranean ecosystem. It is based on uninterrupted monitoring over 42 years of the avifauna in a cork oak forest that burned three times during this time interval. The monitoring involved two line-transect counts in spring accompanied by the simultaneous and independent estimation of the vegetation cover profile. One of the two transects was initially designed to serve as an unburned control before it also burned during the second fire. Many forest bird species were already present from the first spring postfire due to the rapid regeneration of the canopy. Some open-habitat bird species colonized the burned area during the first 2–4 years after the fire, resulting in an initial phase of high diversity. The postfire bird succession was mainly driven by sedentary species that recolonized the burned area after the first winter, whereas most migratory species present before the fire resettled as early as the first postfire spring, probably because of site tenacity. It was found that the impact of the second fire on avifauna was lower than that of the first or third fire. The return to an avifauna and forest structure successionally equivalent to the prefire control was achieved in about 15 years, which can be considered as the recovery time. Afterwards, both vegetation and avifauna in the burned areas tended to take on more forest characteristics than in the prefire control. These findings suggest that: (i) the recurrence of fire does not necessarily result in the cumulative degradation of the ecosystem at each repetition; (ii) the asymptotic resilience model is not adapted to the case of disturbances in non-mature environments; (iii) the notion of returning to an original undisturbed baseline is illusive in an area that has been under continuous human influence since ancient times.

1. Introduction

Resilience can be defined as the ability of an ecosystem to fully return to its pre-disturbance state [1,2] or the time required to do so [3,4,5,6]. In the absence of disturbance, an ecosystem is assumed to undergo only limited fluctuations around a fixed average corresponding to its baseline state. If the disturbance does not force it out of its stability domain or domain of attraction [2], the ecosystem is supposed to return to its baseline pre-disturbance state. The time needed for the ecosystem to recover to this state is its return time [7] or recovery time [8,9]. The most frequent implicit or explicit model of this rate of return is asymptotic resilience [10], in which the return to baseline occurs according to progressively slowing dynamics [11,12,13,14,15,16,17]. In practice, it is difficult to accurately estimate the return time because the changes induced by the disturbance progressively become barely distinguishable from the fluctuations around the pre-disturbance average [2,10]. One proposed criterion to measure this is when the system reaches a state where the deviation from the average control parameter is less than one standard deviation [14], or a 90% threshold relative to the prefire state [13]. However, the return to the pre-disturbance state may be considered as non-asymptotic and the disturbed system may potentially exceed the control value, which makes the choice of the control crucial [18].
When disturbances recur at short intervals, most observational evidence indicates decreased resilience [19,20,21]. This can lead to a transition towards an alternative equilibrium, i.e., different vegetation types [1,12,22,23,24,25,26]. In Mediterranean scrublands, the recurrence of fires compromises the regeneration of vegetation [27,28]. However, this can show strong resilience to recurrent fires [22,23,24,25,26,27,28,29,30], especially on acidic substrates [31]. In cork oak-dominated forests, fires occurring at short intervals (<11 years) have been shown to slow the reconstitution of plant biomass [32], but at longer intervals—e.g., areas that have burned twice in the last 50 years—the cork oak forests seem to have recovered a biomass and composition similar to the prefire state [33]. In a pine-dominated ecosystem, Wittenberg et al. [34] observed that the effects of three successive fires within 10 years were negligible after three years when considering vegetation cover values. This resilience of oaks to fire should logically give the animal component of the ecosystem an inertia to disturbances. The complexity in vegetation structure can act as moderator of fire effect on bird assemblages [35,36]. The persistence of living trees in the burned oak forest is likely to increase the tendency to site tenacity that has been demonstrated in neighbouring Mediterranean habitats [37]. However, the importance of this phenomenon compared to the colonization from undisturbed areas remains to be assessed.
While the response of birdlife to fire and its close relationship with vegetation is relatively well documented in the northern Mediterranean (e.g., [18,38,39,40,41]), the effects of recurrent fires are less known. However, given the current context of global warming, leading to higher temperatures and increased drought in the region, there is realistic concern about more frequent wildfires [42,43,44,45]. Studies have shown that previously burned areas often reburn [42], and it is feared this could impede resilience. In non-Mediterranean contexts, the data are ambiguous. Some studies have shown that the species richness of avifauna is not diminished by fire recurrence, but the effects on bird density are contradictory, and those on avifauna composition complex [46,47,48]. In all cases, the duration of monitoring adds further uncertainty, as most diachronic studies are limited to the initial phase of regeneration [38]. In order to provide consistent data that can explain long-term trends, studies of this type may require 10 or even more than 20 years [49].
This study sought to provide these long-term insights by exploring different aspects of avifauna and vegetation resilience using data from an uninterrupted 42-year successional sequence in a Mediterranean forest stand subjected to three consecutive severe wildfires. Monitoring vegetation structure together with avifauna has proven to be well suited for estimating the postfire resilience of such a forest ecosystem in the long term, as shown by a comparative 9-year study that compared ground data with remote-sensing data in the study area [15]. The objectives of this study were to discriminate between bird species on the basis of their responses to fire along the chronosequence, to assess independently the recovery times of the avifauna on the one hand and of the vegetation on the other, to compare these recovery times after one, two and three successive fires, and to raise the issue of a possible reference state for this typical Mediterranean environment.

2. Material and Methods
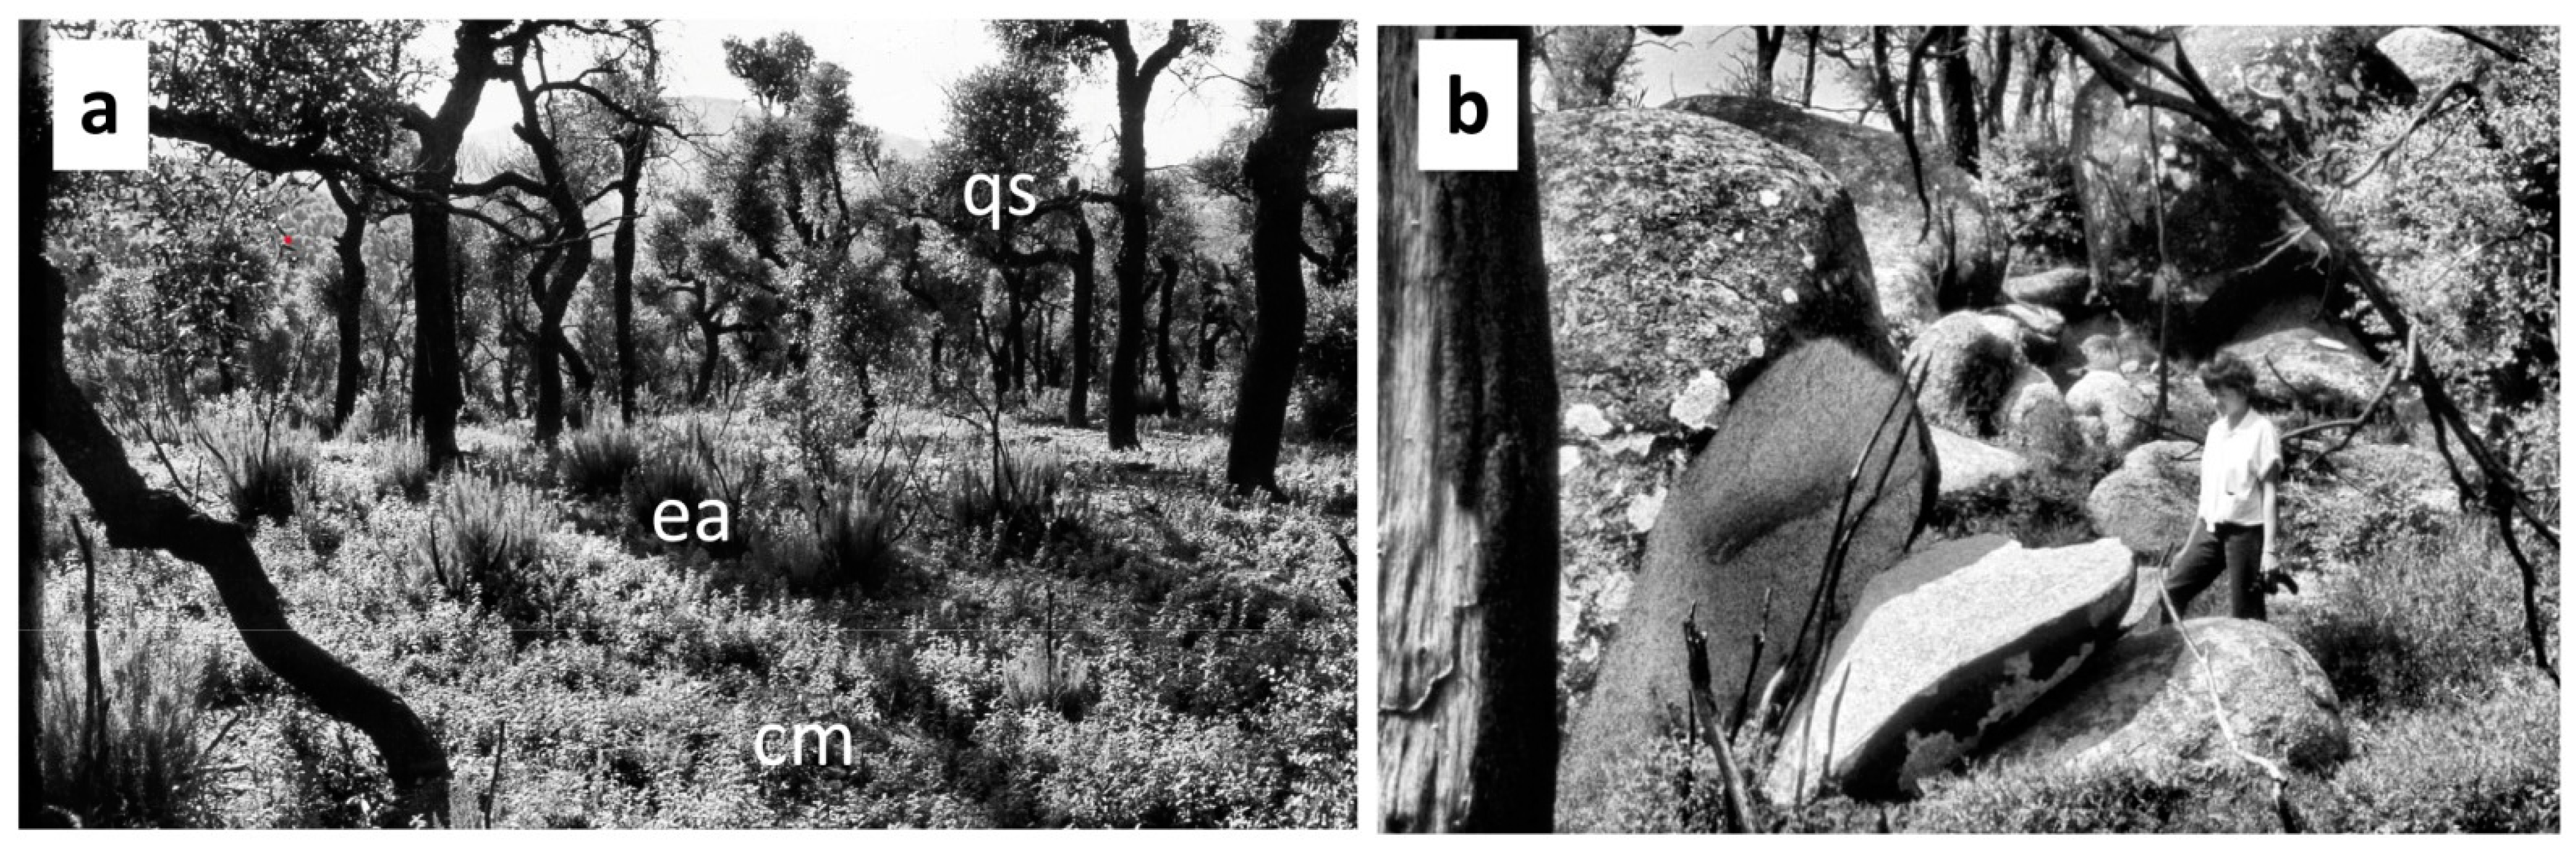
2.1. Study Site

The main study site was located in the Ampurdan region of Spain, near the border with France and the frontier city of La Junquera, at the foot of the Albera Massif (Figure A1). The climate is Mediterranean (annual rainfall 631 mm, average annual temperature 15.1 °C). The dominant forest type is cork oak, growing in acidic soils over granitic bedrock, with granite outcrops and boulders scattered throughout the forests.
While the cork oak stands appear relatively homogeneous, on closer view they present fine-grained heterogeneity. In contrast to the closed canopy of dense holm oak stands, the more open canopy of cork oaks allows a well-developed understory whose dominant species include Erica arborea, E. scoparia, Ulex parviflorus, Cistus monspeliensis, C. albidus, and Calicotome spinosa, especially in the gaps between trees (Figure 1a). The resulting fine-scale patchiness of the stands is characteristic of cork oak forests throughout their range, wherever they are not subject to human intervention. The studied forest is currently unmanaged, with the exception of the periodic clearing of tracks and paths and the occasional exploitation of cork over very limited surface areas.
Unfortunately, the historical fire regime in the study area before the 1970s is not known. Earlier data are scarce and unmapped (e.g., large wildfires in the region of the study site in 1919 and 1945 [50]. Between 1975 and 1998, for the whole of Catalonia, the mean interval between fires at any location was estimated at 133 years, and only 1% of the country burned three times [51]. With three fires in 43 years, the study area appears particularly fire prone because it is downwind of an area of heavy road traffic (Le Perthus-La Junquera), which explains the frequency of accidental fires. The prevailing wind is northwesterly and blows about 100 days a year. It can exceed 100 km/hour (in Ampurdan, 82% of fires are spread by winds from the north [52]). From 1978 to 2020, three large fires have raged on the southern slopes of the Albera. The 1978 fire (starting on 12 September) burned more than 4000 ha, the 1986 fire (starting on 19 July) burned more than 25,000 ha, and the 2012 fire (starting on 22 July) burned about 10,000 ha. These burned areas overlap to a large extent. The severity of the fires varied from place to place according to the landscape structure and the vegetation volume.
In the sampled area, the fires were very severe, with the heat peeling or even breaking some of the granite boulders and thoroughly burning the forest, leaving no residual scorched foliage, remnant scrub or bushes, and almost no litter (i.e., deep burning) (Figure 1b). Nevertheless, as cork oak is protected by thick insulating bark, it can regenerate its foliage from epicormic stem buds in the main branches of old trees, from basal stump lignotubers in young trees, or both (in trees of intermediate age) [53,54,55]. This regeneration begins as soon as the first autumn after a summer fire (Figure 1a). Other secondary disturbances during the study included a caterpillar outbreak that defoliated the oaks in the spring of 1985, a massive branch breakage that crushed the shrub layers due to snow in the winter of 1985–1986, several wind blasts that damaged the young shoots in the canopy, a heatwave in the summer of 2003, and path widening and clearance in the winter of 2013–2014.

2.2. Sampling Design

The sampling design was diachronic and consisted mainly of two line transects, one of which was originally selected as a control: (1) the Sierra Comunera transect (‘C’, hereafter) burned completely in 1978, 1986, and 2012 (coordinates: 42.3959 N, 2.9036 E to 42.3844, 2.8954; elevation 180–190 m asl; length 1.81 km); (2) the Canadal-Lucia transect (‘L’, hereafter) (coordinates: 42.418, 2.8973 to 42.4182, 2.8906; elevation 250–275 m asl; length 1.3 km), which was meant to be the control, but which itself burned in 1986 and 2012. The second transect is a little closer to the unburned slopes of the Albera than the first. These two transects used existing tracks as the vegetation was rapidly difficult to penetrate after the fire. They were used for as long as possible to avoid approaching heterogeneous or nearby unburned areas. Transect sampling was opted for because this method is more sensitive to variations in species abundance than point counts. The area of burned forest was insufficient to multiply samples with the constraint of remaining in the same homogeneous vegetation type (see Figure A1) but, given the rarity of long-term studies of this type, this case study is worth considering and the study site could become a pilot area.
The two transects were always sampled by the same observer, twice each year over a period of 42 years in the spring, typically at the end of May or the beginning of June with variations in dates due to various constraints. The average transect count speed was 2.2 km·h−1 (CV = 11%). Along each transect, three to six points were chosen, arbitrarily but far enough apart to avoid any interference during the bird surveys, were chosen to estimate the vegetation cover profiles. The meteorological data were taken from the Figueres station at a distance of 16 km from the site (https://static-m.meteo.cat/content/climatologia/series-climatiques/; accessed on 21 November 2020).
Data from two additional surveys were taken into account for comparison in certain analyses. Another line transect similar to the previous two was performed in 1979 in a forest without any trace of ancient fire, on the French slope of the Albera (Valmy forest near Argelès; ‘V’, hereafter; coordinates: 42.5203 N, 3.0382 E to 42.5250, 3.0329; elevation 190–225 m asl; length 0.9 km). In addition, a complete bird territory mapping was performed from 1987 to 1992 on a 16 ha quadrat that is crossed by transect L (at a place named Canadal; coordinates: 42.411 N, 2.893 E) in order to obtain reliable postfire bird density [56,57].

2.3. Sampling Methods

2.3.1. Avifauna

The birds were recorded on both sides of the line transect at an unlimited distance. Most of the records were acoustic (only ≈3% are sight records; 5.6% in the two first years after fire) but all had the same unit value. Birds of prey, nocturnal species, swallows, swifts, and some occasional species (Saxicola torquata, Turdus viscivorus, Petronia petronia, Muscicapa striata, Sturnus vulgaris) were excluded. On each transect, two visits were made in the same year on two different dates, often on two consecutive days. For each species, the maximum number of records was retained. Due to various constraints, neither the dates nor the weather conditions could be kept constant over the years. Variations in detectability due to various causes of disturbance, above all wind conditions, are assumed to affect all species equally, and it was assumed that detectability did not vary systematically over the years. As regards the territory mapping, the high sampling pressure (8–10 visits on the quadrat each year, each lasting 4 to 8 h) ensured a fairly accurate definition of the boundaries of bird territories, and therefore of species density. In contrast, the line transects were not intended to evaluate bird density, but to provide species-specific indices of abundance, whose relationship with the species density estimated by territory mapping was estimated a posteriori for certain common species.

2.3.2. Vegetation

The vegetation structure was quantified by visually estimating the cover percentage of seven vegetation layers in comparison with a reference template (0–0.25 m; 0.25–0.5 m; 0.5–1 m; 1–2 m; 2–4 m; 4–8 m; and 8–16 m), plus rock cover [57,58]. These estimations (measured with an estimate accuracy of about 10–15%) were performed within a radius around the observer varying from about 5–8 m for lower layers to about 20 m for higher layers. The values obtained on the three to six points on each transect each year were averaged, and some outliers or missing estimates were linearly interpolated. An index of foliage volume was calculated as the sum of the cover of the seven vegetation layers weighted by their thickness. In addition, although not systematically, the maximum height of some dominant plant species was measured within a radius of about 10 m around the observer.

2.4. Statistical Analyses

The data matrix had 83 sample lines, corresponding to 42 years of monitoring on transect C and 41 years of monitoring on transect L. The average prefire conditions on transect L from 1978 to 1986 were used as the benchmark to assess the rate of recovery.
The resilience measured at the community level is likely to be weakly related to that calculated at the species level, so a multidimensional measure is required [59]. Multivariate analyses are routinely used to monitor the dynamics of post-disturbance terrestrial ecosystems [60,61], in particular for postfire communities [62,63,64,65], reducing the complexity of a multi-species system to a single or a few variable(s). In the multivariate space, points representing a given sample can be connected sequentially to draw successional trajectories.

2.4.1. Gradient Analyses

The 83 × 36 sample–avifauna matrix (i.e., 36 bird species) and the 83 × 8 vegetation matrix (seven layers + rock cover) were independently subjected to correspondence analysis (CA). The bird and vegetation matrices were analysed independently from each other because there was no a priori reason why the postfire dynamics of the avifauna and the dynamics of the vegetation should be strictly correlated and synchronous. Correspondence Analysis is well suited to the ordination of post-fire profiles, regardless of their units of measurement because the chi-2 distance of the CA considers the relative values of variables within the samples, not their absolute values. The CA thus allowed the analysis of plant vs. bird dynamics, each with different units of measurement (bird species with their abundance in one case, percentages of vegetation cover in the other), independently but in parallel. The resulting ordinations are robust as they are based on averaging. They have the advantage of being relatively insensitive (i) to variations in detectability if these affected all bird species to about the same degree (which is the case for variability due to wind), (ii) to interannual variations in cover estimates (possible tendency to over- or underestimate in a given year) if they equally affect all layers. The axes of the analysis represent uncorrelated summaries of the change in avifauna composition and of the change in vegetation profiles. Only the axes of analysis that correlated significantly with time were retained. The Euclidian distance from the burned samples to the average 1978–1986 control was then calculated in the multidimensional space and plotted through time to estimate the time to recovery. Calculations were made with the ‘ade4’ package of R [66].

2.4.2. Alpha Diversity

The coexistence within the same sample of species that have more or less different positions on the axes of the analysis—i.e., different ecological optimums on the ecological gradients—represents an important form of alpha diversity [67,68]. This aspect of diversity is not directly related to species richness. For a given sample and a given CA axis, this alpha diversity was measured by the variance in the scores of the species belonging to this sample (conditional within-sample variance) and, for two axes, by the sum of the conditional variance of species scores on these two axes.

2.4.3. Indexation of Avifauna on a Reference Gradient

As the range of structural variation within the studied forest was limited, the avifauna changes resulting from the burning of the vegetation and its regeneration were interpreted by comparison with a complete structural gradient independently sampled in a larger area of the same region. This reference gradient ranges from rocky habitats with low and discontinuous herbaceous vegetation, to maquis of increasing height and density, and to dense forests with no understory. This represents the full structural range of available bird habitats in the region, apart from cultivated or urbanized areas. The corresponding dataset is available in the ‘ade4’ package of R, under the name ‘rpjdl’. This one-dimensional gradient was previously modelled by CA [58]. As this dataset shares a common set of bird species with the dataset for this study, the pre- and postfire samples of the study site were indexed using the species scores on this reference gradient weighted by the species abundances in the burned and unburned samples. The shifts of the samples on the reference gradient were tracked over time.

2.4.4. Analysis of the Vegetation

Apart from the analysis of species × samples, CA can also handle tables of variables that present unimodal curves along the gradient, which was the case for all the intermediate layers of the cover profiles. This analysis ordered the samples according to their vegetation profiles, i.e., the relative coverage of their different layers. This type of analysis has been shown to be highly correlated with the normalized difference vegetation index (NDVI), and may be even more sensitive than the latter over the long term [15]. The calculation of the distance between the burned samples and the average control was similar to that for the avifauna. In addition, a foliage volume index was calculated as the sum of the cover of all the layers of a profile weighted by their respective thickness.

3. Results

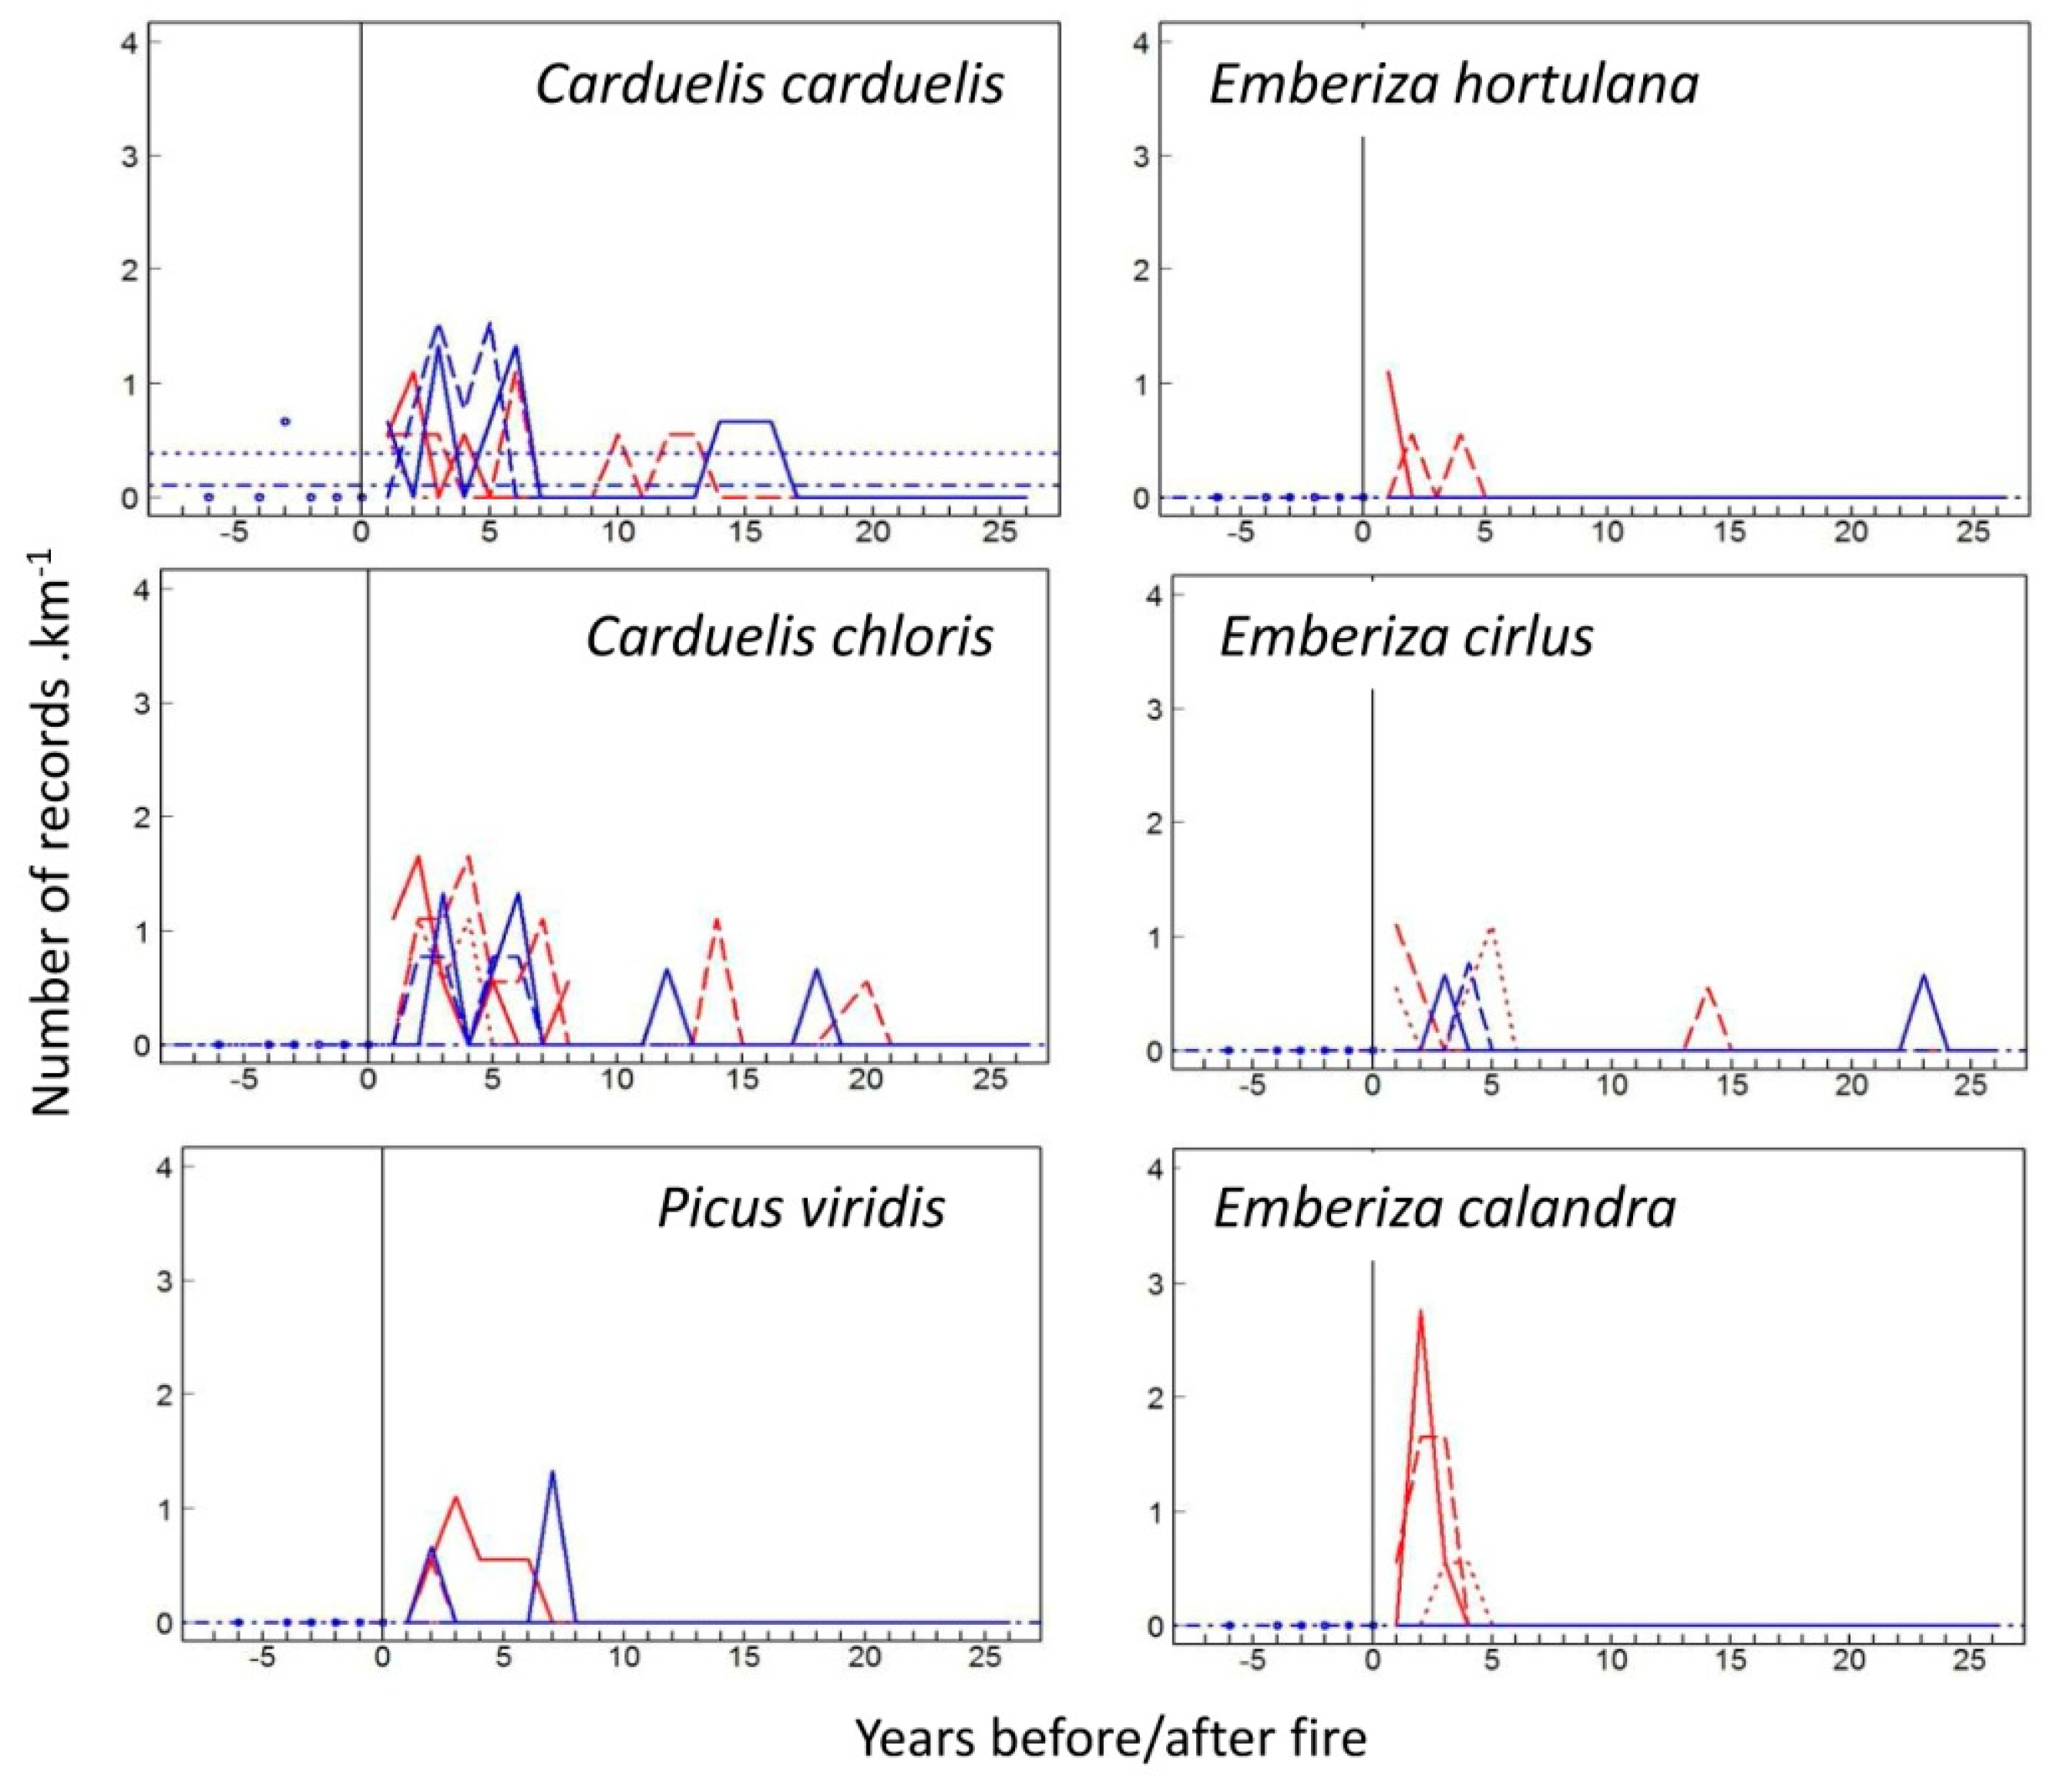
3.1. Species-Specific Postfire Responses of Birds

Of the bird species recorded over the monitoring period, 36 species were retained for the analyses, all presumed to breed in or nearby the study area (Table A1). These included 23 sedentary species (i.e., present year-round in the area) and 13 summer visitors (without any noticeable trend in the ratio between the two over the long term). All the species present before the fire were also recorded in the postfire surveys, except the occasional Emberiza cirlus, which were few in number. The number of records per species reached the maximal values of 14.9 individuals·km−1 for Luscinia megarhynchos (transect C, 1986), 12 for Sylvia melanocephala (transect C, 2021; transect L, 2000), and 7.3 for Sylvia undata (transect L, 1992). Of the species for which the number of records was sufficient to estimate the postfire dynamics (Figure 2, Figure A3 and Figure A4), the following groups could be schematically distinguished: (i) postfire colonizing species present only in the five first years (Carduelis [=Linaria] cannabina, Emberiza hortulana, Lullula arborea, Emberiza calandra, Carduelis carduelis); (ii) early successional species present in years 2–14 (Lanius senator, Picus viridis, Sylvia undata); (iii) mid-successional species that peak in years 8–20 (Sylvia melanocephala, Hippolais polyglotta, Luscinia megarhynchos); (iv) late-successional species whose abundance increases from 8 years onwards (Certhia brachydactyla, Erithacus rubecula, Troglodytes troglodytes, Regulus ignicapilla); (v) species whose postfire response is bimodal (Fringilla coelebs, and to a certain extent Dendrocopos major); and (vi) species frequently recorded but that did not show any clear postfire pattern (Parus major, Turdus merula, Sylvia cantillans, Serinus serinus). The quality and quantity of the data does not allow the quantification of the relationships between the numbers of records on transect L and the numbers of territories on the quadrat, and therefore reliable species-specific coefficients for converting the numbers of records on transects into absolute densities cannot be provided (Figure A5).

3.2. The Postfire Successional Gradient

The first CA axis of the bird matrix was significantly correlated with time-since-burn from year 1 to 15 (R = 0.78) and the second axis from year 8 to 26 (R = 0.91). These two axes were therefore considered to adequately summarize the successional gradient. In the corresponding two-dimensional space, the trajectories of the yearly surveys of each transect confirm that the postfire avifauna dynamics do not allow a one-dimensional summary (Figure 3a,b). As is frequent in post-disturbance studies, the initial divergence from the prefire state was due to the presence of species absent in the undisturbed forest state. The distance from the postfire samples to the average control as a function of time showed a fire impact whose magnitude markedly differed with sites and fires. The impact of the second fire (in 1986) was remarkably low. This was mainly due to the postfire abundance of the migratory species Luscinia megarhynchos and Sylvia cantillans, which respectively reached 6.75 and 8.75 territories·10 ha−1 in the burned quadrat during the 1987 spring. In the ordination space, the distance of the burned transect samples to the control decreased and became minimal 11–15 years after the fire on transect L, and 16–20 years on transect C (Figure 4a), indicating the recovery of the avifauna. However, subsequently this decrease was reversed, and the distance from the control started an increasing trend. This reversal was due to forest bird species, whose abundance exceeded those in the control after 8 or 9 years (Regulus ignicapilla), 10–12 years (Certhia brachydactyla), or 22–24 years (Phylloscopus bonelli, Erithacus rubecula). This was also due to early- or mid-successional species becoming less abundant than in the control (Sylvia undata, S. melanocephala).

3.3. Indexation on a Reference Structure Gradient

The projection of the annual samples on the reference grassland-to-forest gradient showed that, after an initial chaotic phase due to the irregular coexistence of open and forest species, after about 20 years, the avifauna progressively took on a more distinctly forest character in the burned area than in the control (Figure 4b). This ‘overshooting’ of the control appears to be an over-maturation phase in a successional sense. The species most responsible for this were the increasing Parus major, Phylloscopus bonelli, Troglodytes troglodytes, Certhia brachydactyla, and the decreasing Sylvia melanocephala. The avifauna of the comparative supposedly never-burned transect (Valmy) showed a more pronounced forest character than transects C and L: i.e., a higher degree of maturity from a successional point of view.

3.4. Migratory versus Sedentary Bird Species

The contributions of sedentary species to the first CA axis were significantly higher than migratory species (mean for sedentary species = 3.77 and for migratory species = 1.02, Welch t-test: p = 0.039). A CA restricted to sedentary species alone extracted a variance (cumulation of the eigenvalues of the two first axes) larger than the analysis of migratory species alone (0.45 and 0.28, respectively). The graph of the distance of the postfire samples to the control on the first two axes of the analysis of sedentary species alone as a function of time after fire showed a relatively similar pattern to that of the analysis of the whole dataset, whereas the corresponding graph of migratory species showed neither a clear pattern nor a tendency for the values of the control to return to the prefire state (not shown).

3.5. Bird Richness and Diversity

The unsophisticated sampling method used did not allow a correct estimation of variation in avifauna richness and density over time because it did not take into account differences in detectability. However, the number of species recorded peaked in all cases in the second year after the fire—except on transect C, where it peaked in year 4 after the third fire—after which it fluctuated irregularly. In the 16 ha quadrat, the maximum was observed in years 3 and 4 after fire (19 and 17 species, respectively). The within-sample variance of the species scores on the first two CA axes showed a strong but brief increase in diversity the first 3–4 years after the fire (Figure 4c). This increase measures, more clearly than the variation in richness, the temporary coexistence in the burned area of open habitat colonizers with forest species.

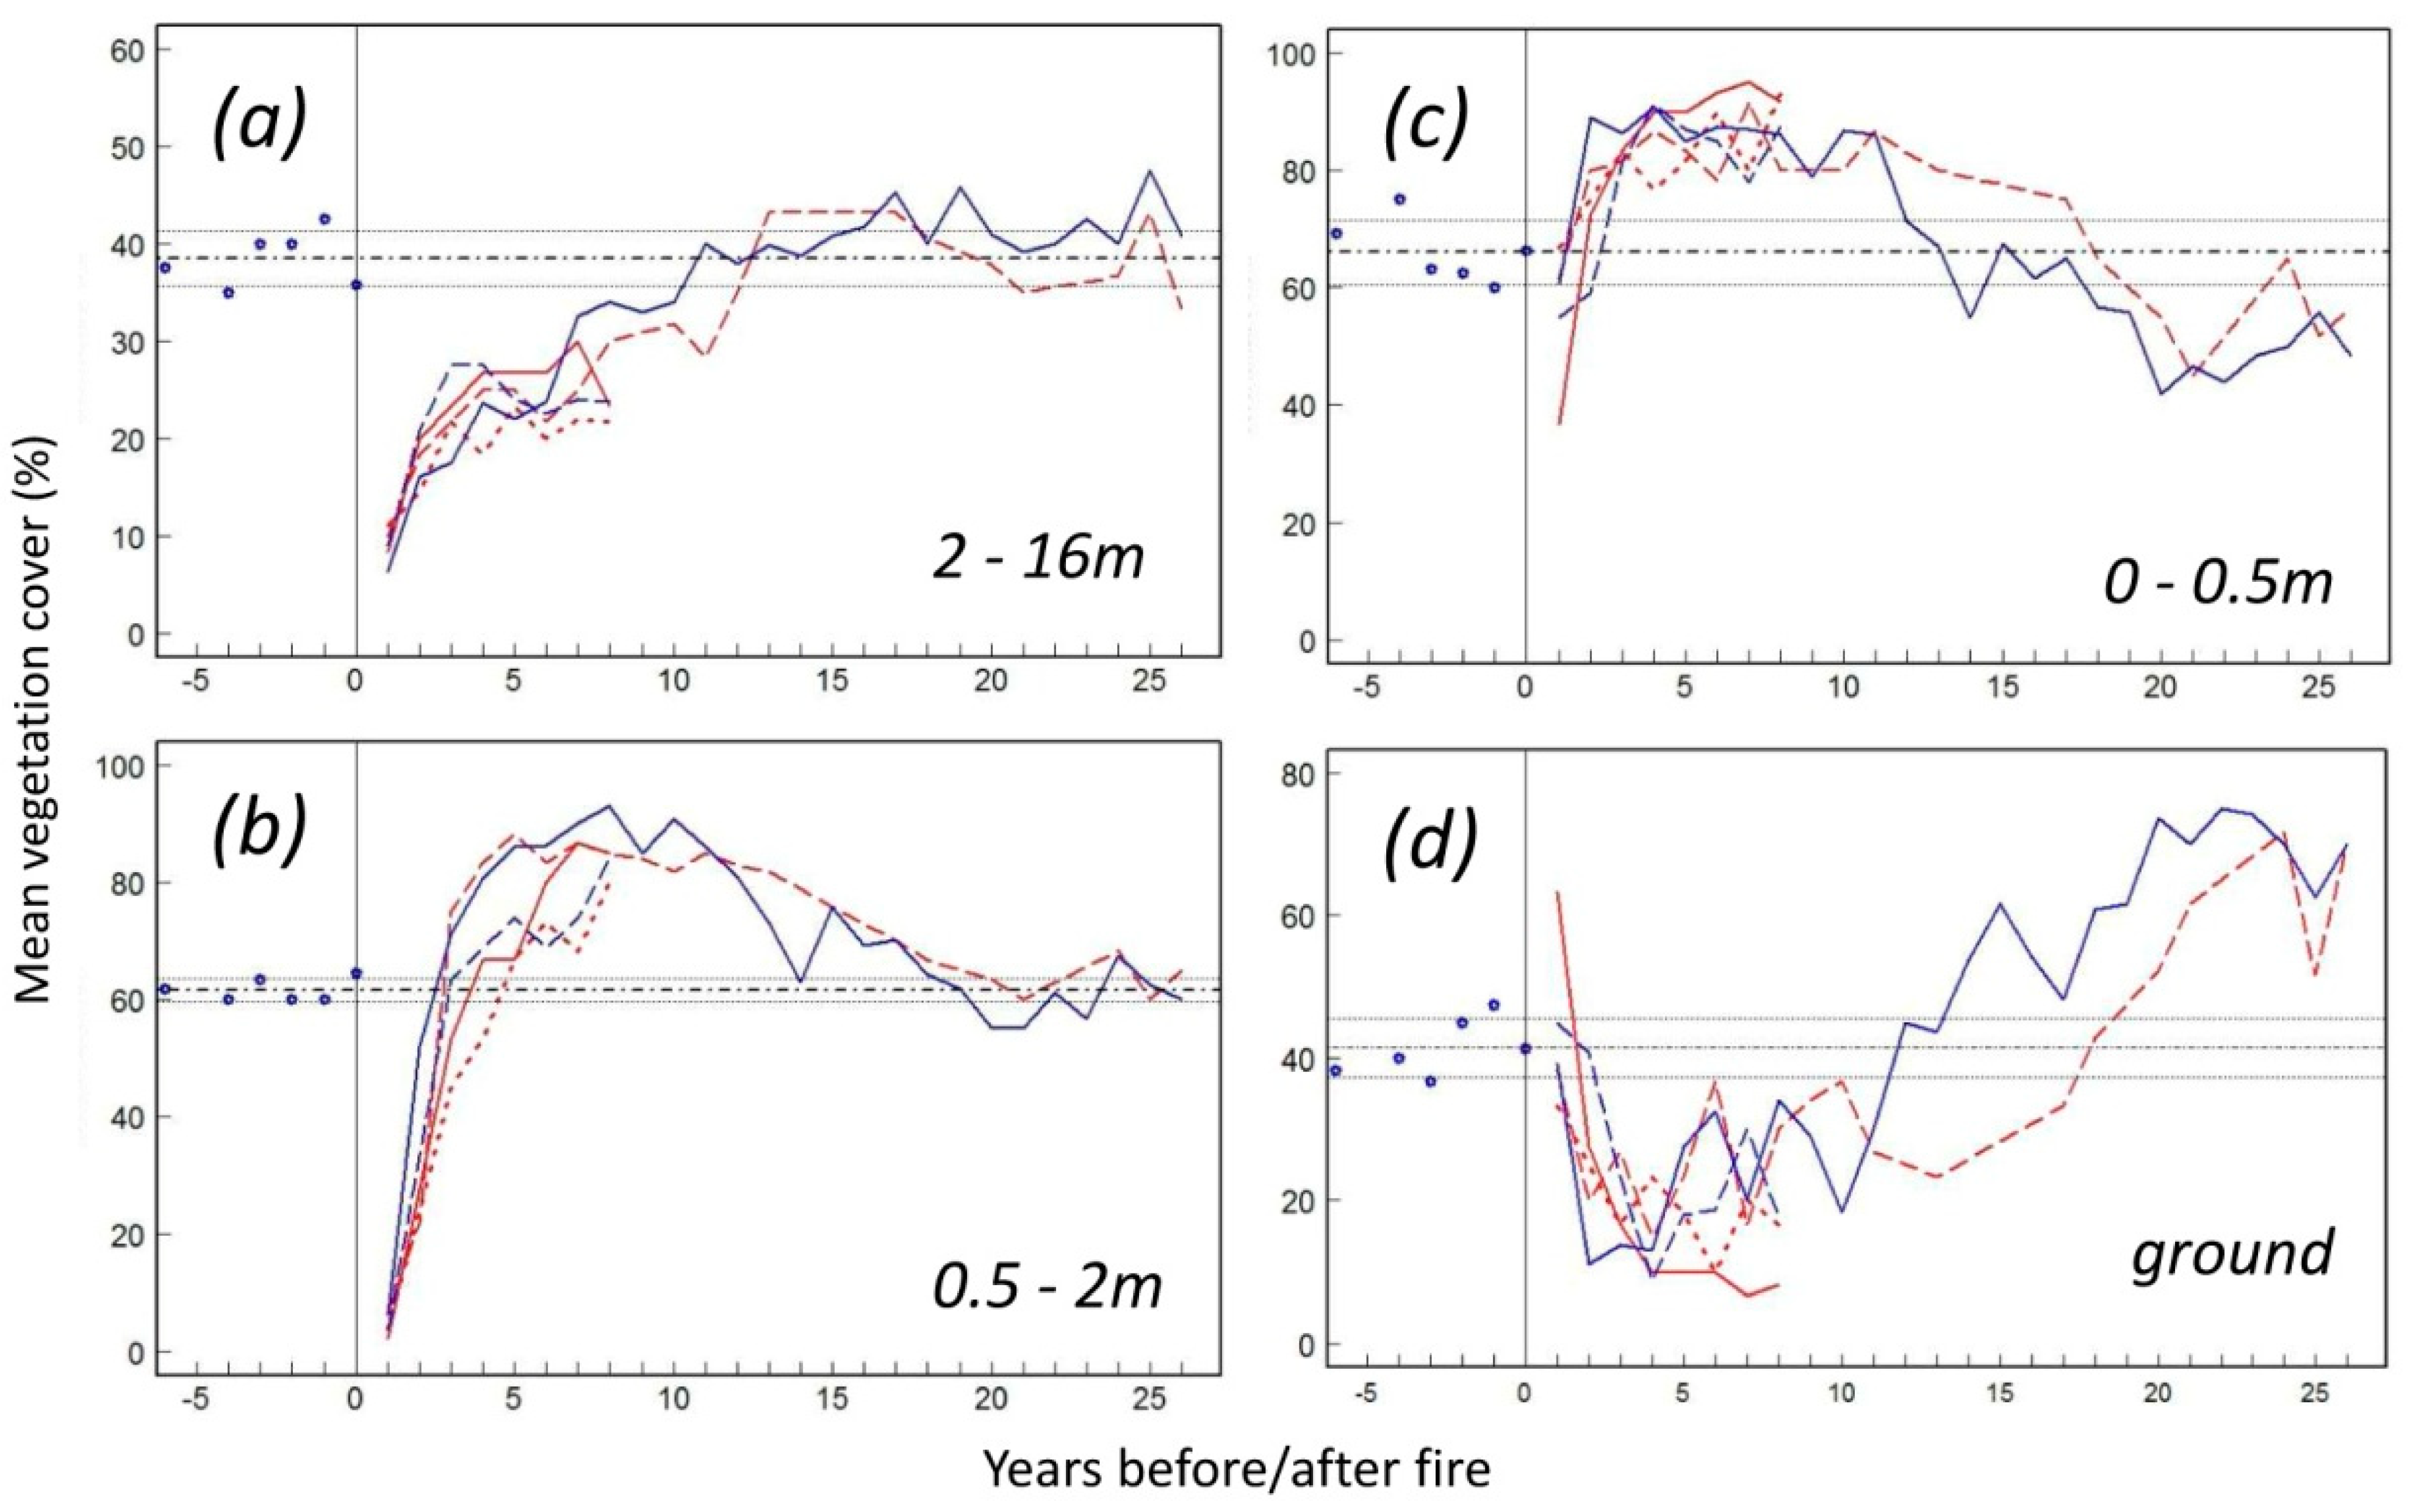
3.6. Vegetation Response

The foliage of the cork oak regenerated quickly from the large branches in the autumn following a fire. In particular, young oaks also regrew from their stumps at an average rate of about 25 cm per year. After the first two fires, the mortality rate of oaks remained very low, but it increased after the third fire and exceeded 20% in certain places. For certain individuals, this mortality was delayed for more than 5 years after the fire.
In the understory, the two dominant species, the gorse Ulex parviflorus and the rockrose Cistus monspeliensis, germinated at high density after a fire (Figure 1b). They formed thickets that were difficult to penetrate, and in burned areas exceeded their height in the control area 7 years after the fire. They then became senescent and relictual from years 15–20 after the fire. The heathers Erica arborea and E. scoparia regenerated from their stump, grew at an initial rate of about 40 cm per year, then slowed to reach the height of the controls, and became dominant in the understory from year 20 onwards.
The cover of the lowest layers (grass and seedlings < 0.5 m) greatly exceeded the control values from years 3 to 12 after the fire, then decreased and became lower than the control values from year 18 onwards. The cover of the intermediate bush layers (from 0.5 to 2 m) largely exceeded the control values from years 4 to 18 after the fire, with a maximum at years 8–12, after which it decreased to the control values. The cover of the upper layers (>2 m) increased monotonically after the fire, and even tended to slightly exceed the control, but remaining moderate as is typical of cork oak forests (Figure 5a–d).
The first CA axis of the cover × sample matrix was highly correlated with the foliar volume (R = −0.96), although the latter was disproportionately sensitive to the variation in cover estimates in the upper layers. On the first two axes of the analysis (90% of the inertia), the trajectories of the yearly samples of each transect show patterns relatively similar to that of the avifauna (Figure 3c,d). In this two-dimensional successional space, the distance from the postfire samples of transect L to the average control as a function of time showed a return to values close to those of the control in about year 13 on transect L and year 17 on transect C. Afterwards, however, the distance seemed to diverge again (Figure 4d). The foliage volume increased after fire and tended to exceed the control values 15–18 years after a fire on transect L; this was due to an increase in the >2 m layers, while the <1 m layers tended to thin out (Table 1). The postfire dynamics of the vegetation structure seemed relatively similar at all sites and for all fires, except for transect C, which showed a slowing in structural regeneration after the third fire.

4. Discussion

4.1. Postfire Bird Response Models: Colonization vs. Site Fidelity

The following classification was based on the comparison between the prefire and postfire situation, unlike Watson’s [69] which does not take into account prefire avifauna. Despite the variety of successional profiles, bird responses to fire in the study area fall into three behavioural categories:
(i) Colonization model: open-habitat bird colonizers, absent in the unburned forest, are few in number in burned cork oak forests due to the persistence of an open canopy. Due to their brevity, the early postfire stages are an ecological trap for these open-habitat bird species, as the suitability of the habitat decreases rapidly. Even if they succeed in reproducing, these species are quickly eliminated with the regrowth of vegetation.
(ii) Extinction–recolonization model: a second category consists of bird species present before the fire that disappear from the burned area (only for the first year after the fire in the case of Sylvia undata and S. melanocephala; the first 8–10 years for Regulus ignicapilla) and have to recolonize it later on from unburt areas. The first autumn, winter and early spring after a summer or late-summer fire, seedlings are absent and resprouting is still sparse, low and unbranched. This results in the complete disappearance of the sedentary shrub-dwelling bird species that constitute the majority of the forest’s prefire avifauna. The remarkable parallel between the responses of the dominant Sylvia melanocephala in three successive fires shows that the abundance of this scrub-dwelling species is directly correlated to the regrowth of shrubs and suggests that the species saturates its habitat as soon as it becomes favourable again (see [70]). In the case of Regulus ignicapilla, a species reluctant to cross gaps [71], the reconstitution of the canopy drives recolonization. Whatever the species, the source of recolonization by forest birds was close or contiguous to the burned area so that dispersion capacity was not a limiting factor [72].
(iii) Site-tenacity model: a third category includes bird species formerly breeding in the unburned forest, absent during the first postfire winter, but that resettle in good numbers as early as the first nesting season after a fire, despite the conflict between the cues they normally use to select a favourable habitat and the drastically altered site. This tendency towards site tenacity, and probably philopatry as well (Fringilla coelebs, Sylvia cantillans and Luscinia megarhynchos may be good representatives of this behaviour), exists in all Mediterranean ecosystems after a fire, whether coniferous [73] or deciduous [18], as well as in other contexts [36]. The persistence of pre-disturbance structures or ‘disturbance legacies’ [74,75,76,77] mitigates the impact, to the point that survivor bird species may dominate the post-disturbance early successional stages. This tendency is particularly marked in cork oak forests due to the survival of the trees and the very rapid regeneration of the canopy.
These three types of response are not always mutually exclusive. For example, the case of the chaffinch (Fringilla coelebs) is probably a mixture of categories (i) and (iii).

4.2. The Four Phases of Postfire Succession

The postfire successional process in the studied Mediterranean cork oak forests can be summarized in four main phases (the durations are approximate):
(i) The early phase: the first 2–3 years after a fire, the vegetation profile combines a very open canopy and a generally discontinuous herbaceous cover with numerous seedlings and low and unbranched sprouts. This transient structure, while unfavourable to scrub-dwelling species, is favoured by ground-feeding species. For certain of these (Lullula arborea, Fringilla coelebs), it represents an optimal habitat, better than any other in the region. The cohabitation of these open-habitat species with certain avifauna of the former forest produces a heterogeneous and transitory bird assemblage of high diversity, a characteristic of early-successional stages [77]. This diversity does not result from the juxtaposition of patches of different fire intensity (e.g., [76]), but from the vegetation structure itself.
(ii) The scrub phase: from years 3 to 10, the growth of shrubs—mainly Ulex parviflorus and Cistus monspeliensis, whose germination is stimulated by fire [78,79]—is first rapid, then slows down. The understory becomes very dense, making the ground barely accessible to birds that nest or feed on it. Scrub-dwelling bird species reach high density and avifauna diversity is low. The duration of this successional stasis corresponds to the lifespan of an even-aged population of gorses and rockroses [80]. However, the establishment of seedlings is inhibited by dense vegetation and possibly by allelopathy [81,82] and, despite the reconstitution of the seed bank [83], the seeds lack the necessary thermal stimulus to germinate [78,84]. As a result, this dense scrub cover does not regenerate itself.
(iii) The recovery phase: at around year 15 after a fire, the gorses tend to dry out [84,85], the rockroses wither away [80] with the decreasing production of seeds [83], and the heathers grow high and do not occupy all the space freed up by the other shrubs in the lowest layers. With the thinning of the understory and the increase in canopy cover, the vegetation profile tends to become more or less similar to what it was before the fire, and the avifauna composition becomes relatively equivalent, in terms of gradient, to that of the prefire control.
(iv) Over-maturation: in the longer term (from year 16 to 18 onwards), the system continues to mature. The upper layers (>4 m) tend to become denser than in the prefire control and the lower layers (<0.5 m) clear out, making the understory more penetrable and the ground more accessible. Accordingly, the avifauna takes on a more forest character than in the prefire control due to the increase in late-successional species.
The regeneration of the cork oak forest does not occur as a simple regrowth of the trees from the ground as in other forest types, but in the juxtaposition of regeneration from the ground and from the canopy, each at a different rate. In the event of a severe fire, the survival rate of an untapped cork oak trunk or branch is about 80% if the cork is 15 years old, and reaches near 100% if the cork is over 20 years old [53]. The estimated recovery time of the forest bird community of 15–20 years seems logically linked to these values.

4.3. Resilience after Repeated Disturbance

In the case of recurrent disturbance, the speed of recovery is generally assumed—explicitly or not—to decrease with each recurrence. Numerous field studies confirm a progressive decrease in the resilience of Mediterranean vegetation in the case of repeated fires (see ‘Introduction’). However, the results seem to contradict this prevailing model.
As regards vegetation, measurements (index of foliage volume and multivariate summaries of the avifauna and the vegetation profile) failed to detect any difference between the first and the second fire in the first phase of the recovery. As regards fauna, the low impact of the 1986 fire might be attributed to the occurrence of the 1978 fire [86], although there was no difference detected in the recovery of vegetation structure between these two fires. Neither temperature nor precipitation seemed to have any influence (cork oak growth is not very sensitive to variations in precipitation [87]). A deficit in regeneration only appeared after the third fire, due to both immediate and delayed mortality of the oaks, but not homogeneously on the forest stand (Figure A1).
With regard to avifauna, the impact differed from fire to fire and from transect to transect, but did not show any clear decrease in species richness [47,48,88], nor a slowdown in the responses of the avifauna to the repetition of fire. The impact of fire was stronger on transect C than on transect L, which is more topographically varied and closer to the unburned part of the forested massif. However, the low impact of the 1986 fire on avifauna—related to the abundance of forest migrants (Luscinia megarhynchos, Sylvia cantillans) as soon as the first spring after the fire—remains somewhat puzzling. A possible explanation is that the precocious fire of 1986 (17 July) allowed the better development of oak regrowth during the following autumn, but it cannot be excluded that the explanation may be partly external to the study site and linked, for example, to the 1986–1987 winter conditions.

4.4. Questioning the Control as a Benchmark

The choice of the control on which resilience is assessed can lead to bias in both estimates and interpretations of resilience [89]. Choosing an undisturbed control, as was done in previous studies [15,18], is somewhat challenging in natura, where distinct sites can hardly be considered to be equivalent ‘all else being equal’. Moreover, it is difficult to determine a site as in equilibrium since forest ecosystems may change over time in the long term even without evident disturbance [90,91]. This makes the notion of control somewhat illusive in long-term studies. While it is critical to increase the temporal scale and resolution of forest resilience assessments [89], as stated by Pimm et al. [92], “the longer I consider a time series, the more it may move away from those ‘prior conditions’ and neat limits to the fluctuations about them”, with the result that resilience is very difficult to define for unstable ecosystems [93]. In the long term, can an undisturbed cork oak forest be considered stable? On a decadal scale yes, on a secular scale probably not.
Thus, the control in this study (transect L before 1987) cannot be considered as in an undisturbed equilibrium state, but just the state of the system at the beginning of the observed cycle. There was no trace of fire, which implies that if there was a fire (there are no fire statistics before 1965), it was more than 30 years ago. Cork exploitation was intensive in the region in the 19th century and declined from the beginning of the 20th century [94]; there was no evidence of recent exploitation at the beginning of the study. Nevertheless, this control was not at a mature forest stage, as shown by the ‘overshooting’ of the successional indices after 18 years, and by the comparison with transect V. Could the supposedly never-burned transect V be considered as a really mature forest, and therefore as the real benchmark? This is unlikely because this transect is not very far from a village and the undergrowth shows traces of old exploitation (terraces, ruins, quarries; and a cadastral map divided into numerous parcels). It is likely that an even higher degree of forest maturity is possible in the absence of fire. The cork oak forest is fire-resilient, but not fire-dependent.
Although the daily maximum temperature in May in the region increased by about 2.6 °C during the study period (linear adjustment, R2 = 0.19), and the temperature in March by about 1.8 °C, no change in species composition seems to be attributable to this warming. On the contrary, the species that increased over the long term were those with latitudinal barycentres of their distribution areas north of the study area (Erithacus rubecula, Fringilla coelebs, Parus major, Certhia brachydactyla), a typical trend in Mediterranean forest successions [95,96].

4.5. Asymptotic Resilience vs. Overcompensation Hypothesis

In both theoretical publications and field studies (see ‘Introduction’), the rate of return to the pre-disturbance state is generally assumed to be asymptotic (Figure 6a). After disturbance, an ecosystem may fail to completely return to its previous state, but stop at a lower state of quasi-equilibrium, synonymous with lasting degradation [1,8,97] (Figure 6b). On the other hand, the recovery may continue until the initial state is surpassed (Figure 6c) as in the case study, where nothing permits to identify an asymptote. The undisturbed system may continue to mature so that a distinction must be made between the time of return to the pre-disturbance state (recovery time) and the time when the disturbed system becomes indistinguishable from the undisturbed matrix [18]) (Figure 6d). The standard asymptotic model is valid when the disturbance affects an ecosystem in assumed equilibrium such as old-growth forest [14]); however, such environments are very rare in mid-latitudes, and even rarer in the Mediterranean, where fires almost exclusively affect non-mature environments, i.e., formations subject to successional dynamics due to continuous human influence since ancient times.
In the present study, all the indicators, univariate (responses of forest birds and cover of upper vegetation layers) or multivariate (distances and indices derived from correspondence analyses of the bird and vegetation matrices), confirm a more forested ecosystem after 16–18 years than before the fire. Although the vegetation data do not allow the phenomenon to be measured more precisely, this apparent ‘over-recovery’ of the cork oak forests after a single or even a twice-repeated disturbance bears critical examination. This overshoot could be seen as the transition from the ecosystem’s postfire response to a normal successional process towards a quasi-stable mature forest. It may also be that the rejuvenation of the vegetation by fire promotes the growth of an arrested stage of succession, particularly if the environmental conditions during postfire regeneration are more favourable to the vegetation than those following the previous disturbance (although this hypothesis does not seem to be supported by the climatic data). Could the legacy of fire in fact be positive in terms of growth? A phenomenon of over-compensatory growth has been observed in trees after severe drought stress [89]. In a meta-analysis of 77 case studies, a comparison of the differences between the state after a disturbance (fire, drought, harvest, or storm) and the pre-disturbance state showed in certain cases a mean increase of 10% of the leaf area index and 35% of the net primary productivity [97]. In semi-desert environments, the growth of certain bushes increases after fire [98]. Postfire compensatory growth has also been observed in trees protected by their thick bark [99,100].
As regards the cork oak, there are no published data that relate to possible overcompensation growth after fire. To explain the increase of productivity after fire in an Australian forest, Wallace (in [101], pp. 90–91) suggested the production of a dense crown of vigorously photosynthesizing leaves following epicormic sprouting, a hypothesis that may also be relevant to cork oak. The reactivation of radial growth of the cork oaks after fire was visually apparent from the second spring after a fire—even after the third fire—by the white crevasses on the blackened, burned trunks; these crevasses widened rapidly in the following years (personal observation).

5. Conclusions

The present case study and the results obtained over 42 years suggest that: (i) the recurrence of fire does not necessarily result in the cumulative degradation of the ecosystem at each repetition; (ii) the asymptotic resilience model is not adapted to the case of disturbances in non-mature environments; (iii) the notion of returning to an original undisturbed baseline is illusive in an area that has been under continuous human influence since ancient times. The stabilizing mechanisms in two compartments of this forest ecosystem—namely, the presence of the subero-phellodermic generative layer of the cork oak, and the tendency towards site tenacity of many birds–explain the remarkable inertia and resilience of the avifauna in this ecosystem even after repeated fires. The fact remains that the studied forest is unlikely to reach a mature stage in the long term if the frequency of fires does not decrease. After the third fire, the immediate or delayed mortality of the oaks was significant, and the dense secondary scrub cover hinders the regeneration of the oak for at least the first 20 years postfire ([25], and personal observation). These factors make the future of the forest uncertain and, despite the duration of this study, the data are still insufficient to make sound predictions about the long-term trend.

Funding

This research received no external funding.

Institutional Review Board Statement

Not applicable.

Informed Consent Statement

Not applicable.

Data Availability Statement

Not applicable.

Acknowledgments

This study was initiated within the framework of the Arago research laboratory in Banyuls-sur-Mer (Paris-6 University, France). The fieldwork on the quadrat benefited from the collaboration of Pere Pons in the context of his PhD. I thank Elise Bradbury for reviewing the English text and Ariane Prodon for her help with the figures.

Conflicts of Interest

The author declares no conflict of interest.

Appendix A

Table A1. List of the recorded species taken into account in the calculations, with abbreviations.
SpeciesAbbreviation
Aegithalos caudatusaeca
Carduelis cachinanscach
Carduelis cannabinacacn
Carduelis cardueliscard
Certhia brachydactylacebr
Columba palombuscopa
Cuculus canoruscuca
Cyanistes [Parus] caeruleuscyca
Dendrocopos majordema
Emberiza [Miliaria] calandraemca
Emberiza cirlusemcr
Emberiza hortulanaemho
Erithacus rubeculaerru
Fringilla coelebsfrco
Garrulus glandariusgagl
Hippolais polyglottahipo
Jynx torquillajyto
Lanius senatorlase
Lophophanes [Parus] cristatuslocr
Lullula arborealuar
Luscinia megarhynchoslume
Oriolus oriolusorio
Parus majorpama
Phylloscopus bonelliphbo
Picus viridispivi
Regulus ignicapillusreig
Serinus serinusseri
Streptopelia turtursttu
Sylvia borinsybo
Sylvia cantillanssyca
Sylvia hortensissyho
Sylvia melanocephalasyme
Sylvia undatasyun
Troglodytes troglodytestrog
Turdus merulatume
Upupa epopsupep
Figure A1. Location of the study area, mapping of the three studied fires (1978, 1986, 2012) in their overlap area, and layout of the transects ‘L’ and ‘C’ (their coordinates are given in the text). Hand-drawn map; fire boundaries approximate.
Forests 12 01644 g0a1
Figure A2. A view of transect “C”, the first autumn after the third fire (22 July 2012), the first spring after this fire, and the 9th spring after this fire, respectively.
Forests 12 01644 g0a2
Figure A3. Postfire response curves of six open-habitat bird species; x-axis: years since the last fire; y-axis: number of individuals·km−1. In red: transect C; in blue: transect L. Solid line: first fire; dashed line: second fire; dotted line: third fire. Circles (and dash-dotted line): prefire control (and mean ± sd).
Forests 12 01644 g0a3
Figure A4. Postfire response curves of six other common bird species. Graphic conventions: see Figure A3.
Forests 12 01644 g0a4
Figure A5. Number of records on transect L (ordinate) as a function of the number of territories on the quadrat (abscissa; in number of pairs per 16 ha), all years 1987–1994 combined. For the warblers, two outliers correspond to particularly poor sampling conditions on the transect in 1991.
Forests 12 01644 g0a5

References

  1. Ratajczak, Z.; Carpenter, S.R.; Ives, A.R.; Kucharik, C.J.; Ramiadantsoa, T.; Stegner, M.A.; Williams, J.W.; Zhang, J.; Turner, M.G. Abrupt change in ecological systems: Inference and diagnosis. Trends Ecol. Evol. 2018, 33, 513–526. [Google Scholar] [CrossRef] [PubMed]
  2. Van Meerbeek, K.; Jucker, T.; Svenning, J.-C. Unifying the concepts of stability and resilience in ecology. J. Ecol. 2021. Available online: https://besjournals.onlinelibrary.wiley.com/doi/abs/10.1111/1365-2745.13651 (accessed on 5 April 2021).
  3. Holling, C.S. Resilience and stability of ecological systems. Annu. Rev. Ecol. Syst. 1973, 4, 1–23. [Google Scholar] [CrossRef] [Green Version]
  4. Holling, C.S. Engineering resilience. In Engineering within Ecological Constraints; Schulze, P.C., Ed.; National Academy of Engineering, National Academy Press: Washington, DC, USA, 1996; pp. 31–43. [Google Scholar]
  5. Westman, W.E. Resilience: Concepts and measures. In Resilience in Mediterranean-Type Ecosystems; Dell, B., Hopkins, A.J.M., Lamont, B.B., Eds.; Tasks for Vegetation Science; Springer: Dordrecht, The Netherlands, 1986; Volume 16. [Google Scholar] [CrossRef]
  6. Standish, R.J.; Hobbs, R.J.; Mayfield, M.M. Resilience in ecology: Abstraction, distraction, or where the action is? Biol. Conserv. 2014, 177, 43–51. [Google Scholar] [CrossRef] [Green Version]
  7. Hodgson, D.; McDonald, J.; Hosken, D.J. What do you mean, resilient? Trends Ecol. Evol. 2015, 30, 503–506. [Google Scholar] [CrossRef]
  8. Van de Leemput, I.A.; Dakos, V.; Scheffer, M.; van Nes, E.H. Slow recovery from local disturbances as an indicator for loss of ecosystem resilience. Ecosystems 2018, 21, 141–152. [Google Scholar] [CrossRef] [PubMed]
  9. Ingrisch, J.; Bahn, M. Toward a comparable quantification of resilience. Trends Ecol. Evol. 2018, 33, 251–259. [Google Scholar] [CrossRef]
  10. Arnoldi, J.-F.; Bideault, A.; Loreau, M.; Haegeman, B. How ecosystem recover from pulse perturbations: A theory of short- to long-term responses. J. Theor. Biol. 2018, 7, 79–92. [Google Scholar] [CrossRef] [PubMed] [Green Version]
  11. Viedma, O.; Meliá, J.; Segarra, D.; Garcia-Haro, J. Modeling rates of ecosystem recovery after fires by using landsat TM data. Remote Sens. Environ. 1997, 61, 383–398. [Google Scholar] [CrossRef]
  12. Christakopoulos, P.; Hatzopoulos, I.; Kalabokidis, K.; Paronis, D.; Filintas, A. Assessment of the response of a Mediterranean-type forest ecosystem to recurrent wildfires and to different restoration practices using Remote Sensing and GIS techniques. In Advances in Remote Sensing and GIS Applications in Forest Fire Management, Proceedings of the 6th International Workshop of the EARSeL, Thessaloniki, Greece, 27–29 September 2007; Gitas, I., Carmona-Moreno, C., Eds.; European Commission: Thessaloniki, Greece, 2007; pp. 213–216. [Google Scholar]
  13. Bastos, A.; Gouveia, C.M.; DaCamara, C.C.; Trigo, R.M. Modelling post-fire vegetation recovery in Portugal. Biogeosciences 2011, 8, 3593–3607. [Google Scholar] [CrossRef] [Green Version]
  14. Rydgren, K.; Halvorsen, R.; Töpper, J.P.; Auestad, I.; Hamre, L.N.; Jongejans, E.; Sulavik, J. Advancing restoration ecology: A new approach to predict time to recovery. J. Appl. Ecol. 2019, 56, 225–234. [Google Scholar] [CrossRef] [Green Version]
  15. Prodon, R.; Diaz-Delgado, R. Assessing the postfire resilience of a Mediterranean forest from satellite and ground data (NDVI, vegetation structure, avifauna). Écoscience 2021, 28, 81–91. [Google Scholar] [CrossRef]
  16. Jentsch, A.; White, P. A theory of pulse dynamics and disturbance in ecology. Ecology 2019, 100, e02734. [Google Scholar] [CrossRef] [PubMed]
  17. Lemoine, N.P. Unifying ecosystem responses to disturbance into a single statistical framework. Oikos 2021, 130, 408–421. [Google Scholar] [CrossRef]
  18. Jacquet, K.; Prodon, R. Measuring the postfire resilience of a bird-vegetation system: A 28yr study in a Mediterranean oak woodland. Oecologia 2009, 161, 801–811. [Google Scholar] [CrossRef] [PubMed]
  19. Malak, D.A.; Pausas, J.G. Fire regime and post-fire Normalized Difference Vegetation Index changes in the eastern Iberian peninsula (Mediterranean basin). Int. J. Wildland Fire 2006, 15, 407–413. [Google Scholar] [CrossRef]
  20. Del Moral, R.; Thomason, L.A.; Wenke, A.C.; Lozanoff, N.; Abata, M.D. Primary succession trajectories on pumice at Mount St. Helens, Washington. J. Veg. Sci. 2012, 23, 73–85. [Google Scholar] [CrossRef]
  21. Turner, M.; Braziunas, K.H.; Hansen, W.D.; Harvey, B.J. Short-term severe fire erodes the resilience of subalpine lodgepole pine forests. Proc. Natl. Acad. Sci. USA 2019, 116, 11319–11328. [Google Scholar] [CrossRef] [Green Version]
  22. Zedler, P.H.; Gautier, C.R.; McMaster, G.S. Vegetation Change in Response to Extreme Events: The Effect of a Short Interval between Fires in California Chaparral and Coastal Scrub. Ecology 1983, 64, 809–818. [Google Scholar] [CrossRef]
  23. Moreno, J.M.; Vázquez, A.; Vélez, R. Recent history of forest fires in Spain. In Large Forest Fires; Moreno, J.M., Ed.; Backhuys Publishers: Leiden, The Netherlands, 1998; pp. 159–185. [Google Scholar]
  24. Baeza, M.J.; Valdecantos, A.; Alloza, J.A.; Vallejo, V.R. Human disturbance and environmental factors as drivers of long-term post-fire regeneration pattern in Mediterranean forests. J. Veg. Sci. 2007, 18, 243–252. [Google Scholar] [CrossRef]
  25. Acacio, V.; Holmgren, M.; Jansen, P.A.; Schrotter, O. Multiple recruitment limitation causes arrested succession in Mediterranean cork oak systems. Ecosystems 2007, 10, 1220–1230. [Google Scholar] [CrossRef] [Green Version]
  26. Tessler, N.; Wittenberg, L.; Provizor, E.; Greenbaum, N. The influence of short-interval recurrent forest fires on the abundance of Aleppo pine (Pinus halepensis Mill.) on Mount Carmel, Israel. For. Ecol. Manag. 2014, 324, 109–116. [Google Scholar] [CrossRef]
  27. Vilà-Cabrera, A.; Saura-Mas, S.; Lloret, F. Effects of fire frequency on species composition in a Mediterranean shrubland. Écoscience 2008, 15, 519–528. [Google Scholar] [CrossRef]
  28. Paula, S.; Ojeda, F. Belowground starch consumption after recurrent severe disturbance in three resprouter species of the genus Erica. Botany 2009, 87, 253–259. [Google Scholar] [CrossRef]
  29. Eugenio, M.; Lloret, F. Effects of repeated burning on Mediterranean communities of the northeastern Iberian Peninsula. J. Veg. Sci. 2006, 17, 755–764. [Google Scholar] [CrossRef]
  30. Dugy, B.; Paula, S.; Pausas, J.G.; Alloza, J.A.; Gimeno, T.; Vallejo, R.V. Effects of climate and extreme events on wildfire regime and their ecological impacts. In Regional Assessment of Climate Change in the Mediterranean; Navarra, A., Tubiana, L., Eds.; Springer: Dordrecht, The Netherland, 2013; Volume 2, pp. 101–134. [Google Scholar]
  31. Mouillot, F.; Ratte, J.-P.; Joffre, R.; Mouillot, D.; Rambal, S. Long-term forest dynamic after land abandonment in a fire prone Mediterranean landscape (central Corsica, France). Landsc. Ecol. 2005, 20, 101–112. [Google Scholar] [CrossRef]
  32. Diaz-Delgado, R.; Lloret, F.; Pons, X.; Terradas, J. Satellite evidence of decreasing resilience in Mediterranean plant communities after recurrent wildfires. Ecology 2002, 83, 2293–2303. [Google Scholar] [CrossRef] [Green Version]
  33. Schaffhauser, A.; Curt, T.; Véla, E.; Tatoni, T. Recurrent fires and environment shape the vegetation in Quercus suber L. woodlands and maquis. Comptes Rendus Biol. 2012, 335, 424–434. [Google Scholar] [CrossRef] [PubMed]
  34. Wittenberg, L.; Malkinson, D.; Beeri, O.; Halutzy, A.; Tesler, N. Spatial and temporal patterns of vegetation recovery following sequences of forest fires in a Mediterranean landscape, Mt. Carmel Israel. Catena 2007, 71, 76–83. [Google Scholar] [CrossRef]
  35. Manning, A.D.; Fischer, J.; Lindenmayer, D.B. Scattered trees are keystone structures—Implications for conservation. Biol. Conserv. 2006, 132, 311–321. [Google Scholar] [CrossRef]
  36. Barton, P.S.; Ikin, K.; Smith, A.L.; MacGregor, C.; Lindenmayer, D.B. Vegetation structure moderates the effect of fire on bird assemblages in a heterogeneous landscape. Landsc. Ecol. 2014, 29, 703–714. [Google Scholar] [CrossRef]
  37. Pons, P.; Henry, P.-Y.; Gargallo, G.; Prodon, R.; Lebreton, J.D. Local survival after fire in Mediterranean shrublands: Combining capture-recapture data over several bird species. Popul. Ecol. 2003, 45, 187–196. [Google Scholar] [CrossRef]
  38. Prodon, R.; Pons, P. Postfire bird studies, methods, questions, and perspectives. In Fire in Mediterranean Ecosystems; Trabaud, L., Prodon, R., Eds.; Ecosystem Research Reports; ECSC-EEC-EAEC: Luxembourg, 1993; Volume 5, pp. 332–344. [Google Scholar]
  39. Pons, P.; Prodon, R. Short-term temporal pattern in a Mediterranean shrubland bird community after wildfire. Acta Oecol. 1996, 17, 29–41. [Google Scholar]
  40. Herrando, S.; Brotons, L. Forest bird diversity in Mediterranean areas affected by wildfires: A multi-scale approach. Ecography 2002, 25, 161–172. [Google Scholar] [CrossRef] [Green Version]
  41. Zozaya, E.L.; Brotons, L.; Vallecillo, S. Bird community response to vegetation heterogeneity following non-direct regeneration of Mediterranean forest after fire. Ardea 2011, 99, 73–84. [Google Scholar] [CrossRef] [Green Version]
  42. Pausas, J.G.; Fernández-Muñoz, S. Fire regime changes in the Western Mediterranean Basin: From fuel-limited to drought-driven fire regime. Clim. Chang. 2012, 110, 215–226. [Google Scholar] [CrossRef] [Green Version]
  43. Moriondo, M.; Good, P.; Durao, R.; Bindi, M.; Giannakopoulos, C.; Corte-Real, J. Potential impact of forest change on fire risk in the Mediterranean area. Clim. Res. 2006, 31, 85–95. [Google Scholar] [CrossRef]
  44. Ruffault, J.; Curt, T.; Moron, V.; Trigo, R.M.; Mouillot, F.; Koutsias, N.; Pimont, F.; Martin-StPaul, N.; Barbero, R.; Dupuy, J.-L.; et al. Increased likelihood of heat-induced large wilfires in the Mediterranean Basin. Sci. Rep. 2020, 10, 13790. Available online: https://10.1038/s41598-020-70069-z (accessed on 1 August 2021). [CrossRef] [PubMed]
  45. Mouillot, F.; Ratte, J.-P.; Joffre, R.; Moreno, J.M.; Rambal, S. Some determinant of the spatio-temporal fire cycle in a Mediterranean landscape (Corsica, France). Landsc. Ecol. 2003, 18, 665–674. [Google Scholar] [CrossRef]
  46. Slik, J.W.F.; Van Balen, S. Bird community changes in response to single and repeated fires in a lowland tropical rainforest of eastern Borneo. Biodivers. Conserv. 2006, 15, 4425. [Google Scholar] [CrossRef]
  47. Fontaine, J.B.; Donato, D.C.; Robinson, W.D.; Law, B.E.; Kauffman, J.B. Bird communities following high-severity fire: Response to single and repeat fires in a mixed-evergreen forest, Oregon, U.S.A. For. Ecol. Manag. 2009, 257, 1496. [Google Scholar] [CrossRef] [Green Version]
  48. Greenberg, C.H.; Waldrop, T.A.; Tomcho, J.; Phillips, R.J.; Simon, D. Bird response to fire severity and repeated burning in upland hardwood forest. For. Ecol. Manag. 2013, 304, 80–88. [Google Scholar] [CrossRef] [Green Version]
  49. Cusser, S.; Helms IV, J.; Bahlai, C.A.; Haddad, N.M. How long do population level field experiments need to be? Utilising data from the 40-year-old LTER network. Ecol. Lett. 2021, 24, 1103–1111. [Google Scholar] [CrossRef] [PubMed]
  50. Nadal, N. Reconstrucció D’incendis Històrics. 2012. Seminari PrincAlb, Mollet, 13–14 December 2012. Available online: http://agricultura.gencat.cat/web/.content/06-medi-natural/gestio-forestal/enllacos-documents/princalb/fitxers-binaris/PRINCALB_Presentacio_I-D_Bombers_incendis_historics.pdf (accessed on 7 January 2020).
  51. Díaz-Delgado, R.; Lloret, F.; Pons, X. Spatial patterns of fire occurrence in Catalonia, NE, Spain. Landsc. Ecol. 2004, 19, 731–745. [Google Scholar] [CrossRef] [Green Version]
  52. Nadal Saleillas, N. Prise en Compte de L’historique des feux dans la Planification DFCI. Séminaire sur le Retour D’expérience en Matière de Prévention des Incendies de Forêts dans la zone Méditerranéenne, 17–18 Novembre 2016. Available online: https://www.prevention-incendie66.com/sites/default/files/documents/seminaire_rex/intervention_forestal_catalana_nn.pdf (accessed on 7 January 2020).
  53. Dubois, C. Comportement du chêne-liège après incendie; Graduation Report; Ecole Nationale des Ingénieurs des Travaux des Eaux et Forêts: Nogent-sur-Vernisson, France, 1990; Available online: https://catalogue.cefe.cnrs.fr/index.php?lvl=notice_display&id=13778 (accessed on 18 March 2021).
  54. Dubois, C.; Prodon, R. Survie du Chêne-liège (Quercus suber) après incendie. Nat. Monspel. 1991, 596–597. [Google Scholar]
  55. Catry, F.X.; Moreira, F.; Pausas, J.G.; Fernandes, P.; Rego, F.; Cardillo, E.; Curt, T. Cork oak vulnerability to fire: The role of bark harvesting, tree characteristics and abiotic factors. PLoS ONE 2012, 7, e39810. [Google Scholar] [CrossRef] [Green Version]
  56. Pons, P. Dynamique de l’avifaune après incendie et brûlage dirigé en zone méditerranéenne: Importance de la territorialité. Ph.D. Thesis, University of Paris, Paris, France, 18 October 1996. [Google Scholar]
  57. Pons, P.; Clavero, M.; Bas, J.M.; Prodon, R. Time-window of occurrence and vegetation cover preferences of dartford and Sardinian warblers after fire. J. Ornith. 2012, 153, 921–930. [Google Scholar] [CrossRef] [Green Version]
  58. Prodon, R.; Lebreton, J.D. Breeding avifauna of a Mediterranean succession—The holm oak and cork oak series in the eastern Pyrenees.1. Analysis and Modeling of the Structure Gradient. Oikos 1981, 37, 21–38. [Google Scholar] [CrossRef]
  59. Kéfi, S.; Domínguez-García, V.; Donohue, I.; Fontaine, C.; Thébault, E.; Dakos, V. Advancing our understanding of ecological stability. Ecol. Lett. 2019, 22, 1349–1356. [Google Scholar] [CrossRef] [PubMed]
  60. Austin, M.P. Use of ordination and other multivariate descriptive methods to study succession. Plant Ecol. 1977, 35, 168–175. [Google Scholar] [CrossRef]
  61. Halpern, C.B. Early successional pathways and the resistance and resilience of forest communities. Ecology 1988, 69, 1703–1715. [Google Scholar] [CrossRef]
  62. Malanson, G.P.; Trabaud, L. Ordination Analysis of Components of Resilience of Quercus coccifera Garrigue. Ecology 1987, 68, 463–472. [Google Scholar] [CrossRef]
  63. Bloom, S.A. Multivariate quantification of community recovery. In The Recovery Process in Damaged Ecosystems; Cairns, J., Jr., Ed.; Ann Arbor Science Publishers: Ann Arbor, MI, USA, 1980; pp. 141–151. [Google Scholar]
  64. Day, N.J.; Carrière, S.; Baltzer, J.L. Annual dynamics and resilience in post-fire boreal understory vascular plant communities. For. Ecol. Manag. 2017, 401, 264–272. [Google Scholar] [CrossRef]
  65. Prodon, R. Animal communities and vegetation dynamics: Measuring and modelling animal community dynamics along forest successions. In Responses of Forest Ecosystems to Environmental Changes; Teller, A., Mathy, P., Jeffers, J.N.R., Eds.; Elsevier: Amsterdam, The Netherlands, 1992; pp. 126–141. [Google Scholar]
  66. Thioulouse, J.; Dray, S.; Dufour, A.-B.; Siberchicot, A.; Jombart, T.; Pavoine, S. Multivariate Analysis of Ecological Data; Springer Nature: New York, NY, USA, 2018. [Google Scholar]
  67. Chessel, D.; Lebreton, J.-D.; Prodon, R. Mesures symétriques d’amplitude d’habitat et de diversité intra-échantillon dans un tableau espèces-relevés. Cas d’un gradient simple. C. R. Acad. Sci. 1982, 295, 83–88. [Google Scholar]
  68. Thioulouse, J.; Chessel, D. A Method for Reciprocal Scaling of Species Tolerance and Sample Diversity. Ecology 1992, 73, 670–680. [Google Scholar] [CrossRef]
  69. Watson, S.J.; Taylor, R.T.; Nimmo, D.G.; Kelly, L.T.; Haslem, A.; Clarke, M.F.; Bennett, A.F. Effect of time since burn: How informative are generalized fire response curves for conservation management. Ecol. Appl. 2012, 22, 685–696. [Google Scholar] [CrossRef] [Green Version]
  70. Bas, J.M.; Pons, P.; Gómez, C. Home range and territory of the Sardinian warbler Sylvia melanocephala in Mediterranean shrubland. Bird Study 2005, 52, 137–144. [Google Scholar] [CrossRef]
  71. Creegan, H.P.; Osborne, P.E. Gap-crossing decisions of woodland songbirds in Scotland: An experimental approach. J. Appl. Ecol. 2005, 42, 678–687. [Google Scholar] [CrossRef]
  72. Brotons, L.; Pons, P.; Herrando, S. Colonisation of dynamic Mediterranean landscapes: Where do birds come from after fire. J. Biogeogr. 2005, 32, 789–798. [Google Scholar] [CrossRef]
  73. Llimona, E.; Matheu, F.; Prodon, R. Role of standing snags and of tree regeneration in postfire bird succession: Comparison of pine and oak forests of Montserrat (Catalonia). In Fire in Mediterranean Ecosystems; Trabaud, L., Prodon, R., Eds.; Ecosystem Research Reports; ECSC-EEC-EAEC: Luxembourg, 1993; Volume 5, pp. 315–331. [Google Scholar]
  74. Franklin, J.F.; Lindenmayer, D.; MacMahon, J.A.; McKee, A.; Magnuson, J.; Perry, D.A.; Waide, R.; Foster, D. Threads of Continuity, Ecological Disturbance, Biological Legacy and Recovery. Conserv. Biol. Pract. 2000, 1, 8–16. Available online: https://d1wqtxts1xzle7.cloudfront.net/44840112/ (accessed on 26 March 2021).
  75. Seidl, R.; Rammer, W.; Spies, T.A. Disturbance legacies increase the resilience of forest ecosystem structure, composition, and functioning. Ecol. Appl. 2014, 24, 2063–2077. [Google Scholar] [CrossRef] [Green Version]
  76. Swanson, M.E.; Franklin, J.F.; Beschta, R.L.; Crisafulli, C.M.; DellaSala, D.A.; Hutto, R.L.; Lindenmayer, D.B.; Swanson, F.J. The forgotten stage of forest succession: Early-successional ecosystems on forest sites. Front. Ecol. Environ. 2010, 9, 117–125. [Google Scholar] [CrossRef] [Green Version]
  77. Tingley, M.W.; Ruiz-Gutiérrez, V.; Wilkerson, R.L.; Howell, C.A.; Siegel, R.B. Pyrodiversity promotes avian diversity over the decade following fire. Proc. R. Soc. B 2016, 283, 20161703. [Google Scholar] [CrossRef] [PubMed] [Green Version]
  78. Trabaud, L.; Oustric, J. Heat requirements for seed germination of three Cistus species in the garrigue of southern France. Flora 1989, 183, 321–325. [Google Scholar] [CrossRef]
  79. Baeza, M.J.; Vallejo, V.R. Ecological mechanisms involved in dormancy breakage in Ulex parviflorus seeds. Plant Ecol. 2006, 183, 191–205. [Google Scholar] [CrossRef]
  80. Roy, J.; Sonie, L. Germination and Population Dynamics of Cistus Species in Relation to Fire. J. Appl. Ecol. 1992, 29, 647–655. [Google Scholar] [CrossRef]
  81. Nascimento Franco, J.D.; Rubido-Bará, M.; Horjales-Luaces, M.; Reigosa, M.J. Allelopathy between seeds of the Ulex L. and Genista L. genera. J. Allelochem. Interact. 2017, 3, 9–17. [Google Scholar]
  82. Pardo-Muras, M.; Puig, C.G.; López-Nogueira, A.; Cavaleiro, C.; Pedrol, N. On the herbicide potential of Ulex europeus and Cytisus scoparius. Profiles of volatile organic compounds and their phytotoxic effects. PLoS ONE 2018, 13, e0205997. [Google Scholar] [CrossRef]
  83. Clemente, A.S.; Rego, F.C.; Correia, O.A. Seed bank dynamics of two obligate seeders, Cistus monspeliensis and Rosmarinus officinalis in relation to time since fire. Plant Ecol. 2007, 190, 175–188. [Google Scholar] [CrossRef]
  84. Baeza, M.; Roy, J. Germination of an obligate seeder (Ulex parviflorus) and consequences for wildfire management. For. Ecol. Manag. 2008, 256, 685–693. [Google Scholar] [CrossRef]
  85. De Luis, M.; Baeza, M.J.; Raventos, J.; Gonzalez-Hidalgo, J.C. Fuel characteristics and fire behaviour in mature Mediterranean gorse shrublands. Int. J. Wildland Fire 2004, 13, 79–87. [Google Scholar] [CrossRef] [Green Version]
  86. Parks, S.A.; Miller, C.; Nelson, C.R.; Holden, Z.A. Previous fires moderate burn severity of subsequent wildland fires in two large western US wilderness areas. Ecosystems 2014, 17, 29–42. [Google Scholar] [CrossRef] [Green Version]
  87. Mokaddem, H. Contribution à l’étude de la relation indice d’accroissement du liège/paramètres pluviométriques de deux subéraies oranaises (M’Sila (W. Oran) et Hafir (W. Tlemcen)); Graduation Report; University of Tlemcen: Chetouane, Algeria, 2012; Available online: https://docplayer.fr/42801326-Memoire-de-fin-d-etudes-pour-l-obtention-du-diplome-d-ingenieur-d-etat-en-foresterie.html (accessed on 9 April 2021).
  88. Poizaridis, K.; Chaideftou, E.; Martinis, A.; Bontzorlos, V.; Galani, P.; Kalivas, D. Temporal shifts in floristic and avian diversity in Mediterranean pine forest ecosystems under different fire pressure: The island of Zakynthos as a case study. Ann. For. Res. 2018, 61, 19–36. [Google Scholar]
  89. Ovenden, T.S.; Perks, M.P.; Clarke, T.-K.; Mencuccini, M.; Jump, A.S. Life after recovery: Increased resolution of forest resilience assessment sheds new light on post-drought compensatory growth and recovery dynamics. J. Ecol. 2021, 109, 3157–3170. [Google Scholar] [CrossRef]
  90. Kampicher, C.; Angeler, D.G.; Holmes, R.T.; Leito, A.; Svensson, S.; Van der Jeugd, H.; Wesolowski, T. Temporal dynamics of bird community composition: An analysis of baseline conditions from long-term data. Oecologia 2014, 175, 1301–1313. [Google Scholar] [CrossRef] [PubMed] [Green Version]
  91. Chisholm, R.A.; Condit, R.; Rahman, K.A.; Baker, P.J.; Bunyavejchewin, S.; Chen, Y.-Y.; Chuyong, G.; Dattaraja, H.S.; Davies, S.; Corneille, E.N.; et al. Temporal variability of forest communities: Empirical estimates of population change in 4000 tree species. Ecol. Lett. 2014, 17, 855–865. [Google Scholar] [CrossRef]
  92. Pimm, S.L.; Donohue, I.; Montoya, J.M.; Loreau, M. Measuring resilience is essential if we are to understand it. Nat. Sustain. 2019, 2, 895–897. [Google Scholar] [CrossRef] [PubMed]
  93. Pimm, S.L. The complexity and stability of ecosystems. Nature 1984, 307, 321–326. [Google Scholar] [CrossRef]
  94. Manobens, J.B.; Gimeno, V.A.; Serrat, J.G. L’evolució del paisatge forestal (1950–2013) a l’Alt Empordà. Ann. Inst. Estud. Empord. 2015, 46, 343–368. [Google Scholar]
  95. Prodon, R. Une alternative aux “types biogéographiques” de Voous: La mesure des distributions latitudinales. Alauda 1993, 62, 83–90. [Google Scholar]
  96. Prodon, R. Consequences for avifauna of landscape encroachment by woody vegetation in northern Catalonia. Rev. Catalana d’Ornitol. 2020, 36, 1–9. [Google Scholar]
  97. Fu, Z.; Li, D.; Hararuk, O.; Schwalm, C.; Luo, Y.; Yan, L.; Niu, S. Recovery time and state change of terrestrial carbon cycle after disturbance. Environ. Res. Lett. 2017, 12, 104004. [Google Scholar] [CrossRef]
  98. Molinari, R.L.; Bishop, T.B.B.; Bekker, M.F.; Kitchen, S.G.; Allphin, L.; St. Clair, S.B. Creosote growth rate and reproduction increase in postfire environments. Ecol. Evol. 2019, 9, 12897–12905. [Google Scholar] [CrossRef]
  99. Mutch, L.S.; Swetnam, T.W. Effect of fire severity and climate on ring-width growth of Giant Sequoia after fire. In Proceedings of the Symposium on Fire in Wilderness and Park Management: Past Lessons and Future Opportunities, Missoula, MT, USA, 30 March–1 April 1993; Brown, J.K., Mutch, R.W., Spoon, C.W., Wakimoto, R.H., Eds.; Intermountain Research Station, Gen. Tech. Rep. INT-GTR-320. U.S. Department of Agriculture, Forest Service: Ogden, UT, USA, 1995. Available online: https://www.ltrr.arizona.edu/~tswetnam/tws-pdf/mutch.pdf (accessed on 11 February 2021).
  100. Hoffman, W.A. Direct and indirect effects of fire on radial growth of cerrado savanna trees. J. Trop. Ecol. 2002, 18, 137–142. [Google Scholar] [CrossRef] [Green Version]
  101. Wheylan, R.J. The Ecology of Fire; Cambridge University Press: Cambridge, UK, 1995. [Google Scholar]
Figure 1. The studied cork oak forest the first spring after the 1986 fire. (a) The cork oak stand and the beginning of the regeneration of the understory the first spring after fire (qs: Quercus suber; ea: Erica arborea clump; cm: Cistus monspeliensis seedlings). (b) Granite boulders peeled and broken by the heat.
Forests 12 01644 g001
Figure 2. Postfire response curves of eight common bird species; x-axis: years since the last fire; y-axis: number of individuals·km−1. In red: transect C; in blue: transect L. Solid line: number of records after the first fire; dashed line: after the second fire; dotted line: after the third fire. Circles (and dash-dotted line): prefire control (and mean ± 1 s.d.).
Forests 12 01644 g002
Figure 3. (a) Trajectories of the yearly surveys in the first two-dimensional space of the correspondence analysis of the bird matrix. (b) Ordination of the bird species in the same space (some species close to the origin have been omitted for the sake of clarity). (c) Trajectories of the surveys of burned areas in the first two-dimensional space of the correspondence analysis of the vegetation cover matrix. (d) Ordination of the seven vegetation layers plus the rock cover in the same space. Graphic conventions: see Figure 2; in black (a): trajectory of the 16-ha quadrat. Species abbreviation: see Table A1.
Forests 12 01644 g003
Figure 4. (a) Euclidian distance of the burned samples to the mean position of the prefire samples in the first two-dimensional space of the correspondence analysis of the bird matrix. (b) Indexation of the burned and unburned samples on the reference grassland-to-forest gradient; the position of the comparative control transect V is indicated. (c) Alpha diversity (sum of the conditional within-sample variances on the two first axes of correspondence analysis of the bird matrix). (d) Euclidian distance of the burned samples to the mean position of the prefire samples in the first two-dimensional space of the correspondence analysis of the vegetation cover matrix. (e) Index of foliage volume. x-axis: years since the last fire. Graphic conventions: see Figure 2.
Forests 12 01644 g004
Figure 5. Postfire variation of the vegetation cover within three layers summarizing the 8-layer profile; x-axis: years since the last fire; y-axis: estimated cover (in %). (a) Maximum cover within the layers 2–4 m, 4–8 m and 8–16 m. (b) Maximum cover within the layers 0.5–1 m and 1–2 m. (c) Maximum cover within the layers 0–0.25 m and 0.25–0.5 m. (d) Open ground (rock cover). Graphic conventions: see Figure 2.
Forests 12 01644 g005
Figure 6. Different models of disturbance response relative to the pre-disturbance state (baseline). (a) Asymptotic model with a quasi-equilibrium state. (b) Long-lasting degradation with alternative quasi-equilibrium state. (c) Overcompensation; arrow: recovery time. (d) Recovery with simultaneous maturation of the undisturbed control; in this case, the recovery time (blue arrow) is distinct from the time when the disturbed system reaches the level of the control. x-axis: time; y-axis: system state (successional index or any adequate biological attribute).
Forests 12 01644 g006
Table 1. Average vegetation profiles by layer (percentages averaged over six consecutive years) on transect L at three periods (L80–86 refers to the years 1980–1986, etc.). The period 12–17 years after the first fire (b) shows a slight deficit in the upper layers relative to the unburned control (a), the period 21–26 years later (c) shows an excess in the upper layers and a deficit in the lower layers.
16 m8 m4 m2 m1 m0.5 m0.25 mR
(a) L80–865.531.938.553.061.666.058.52.5
(b) L98–034.027.840.762.172.064.648.92.6
(c) L07–1210.034.541.758.558.848.929.72.1
Publisher’s Note: MDPI stays neutral with regard to jurisdictional claims in published maps and institutional affiliations.

