
Analysis of Factors Influencing Forest Loss in South Korea: Statistical Models and Machine-Learning Model

Abstract
:1. Introduction
2. Materials and Methods
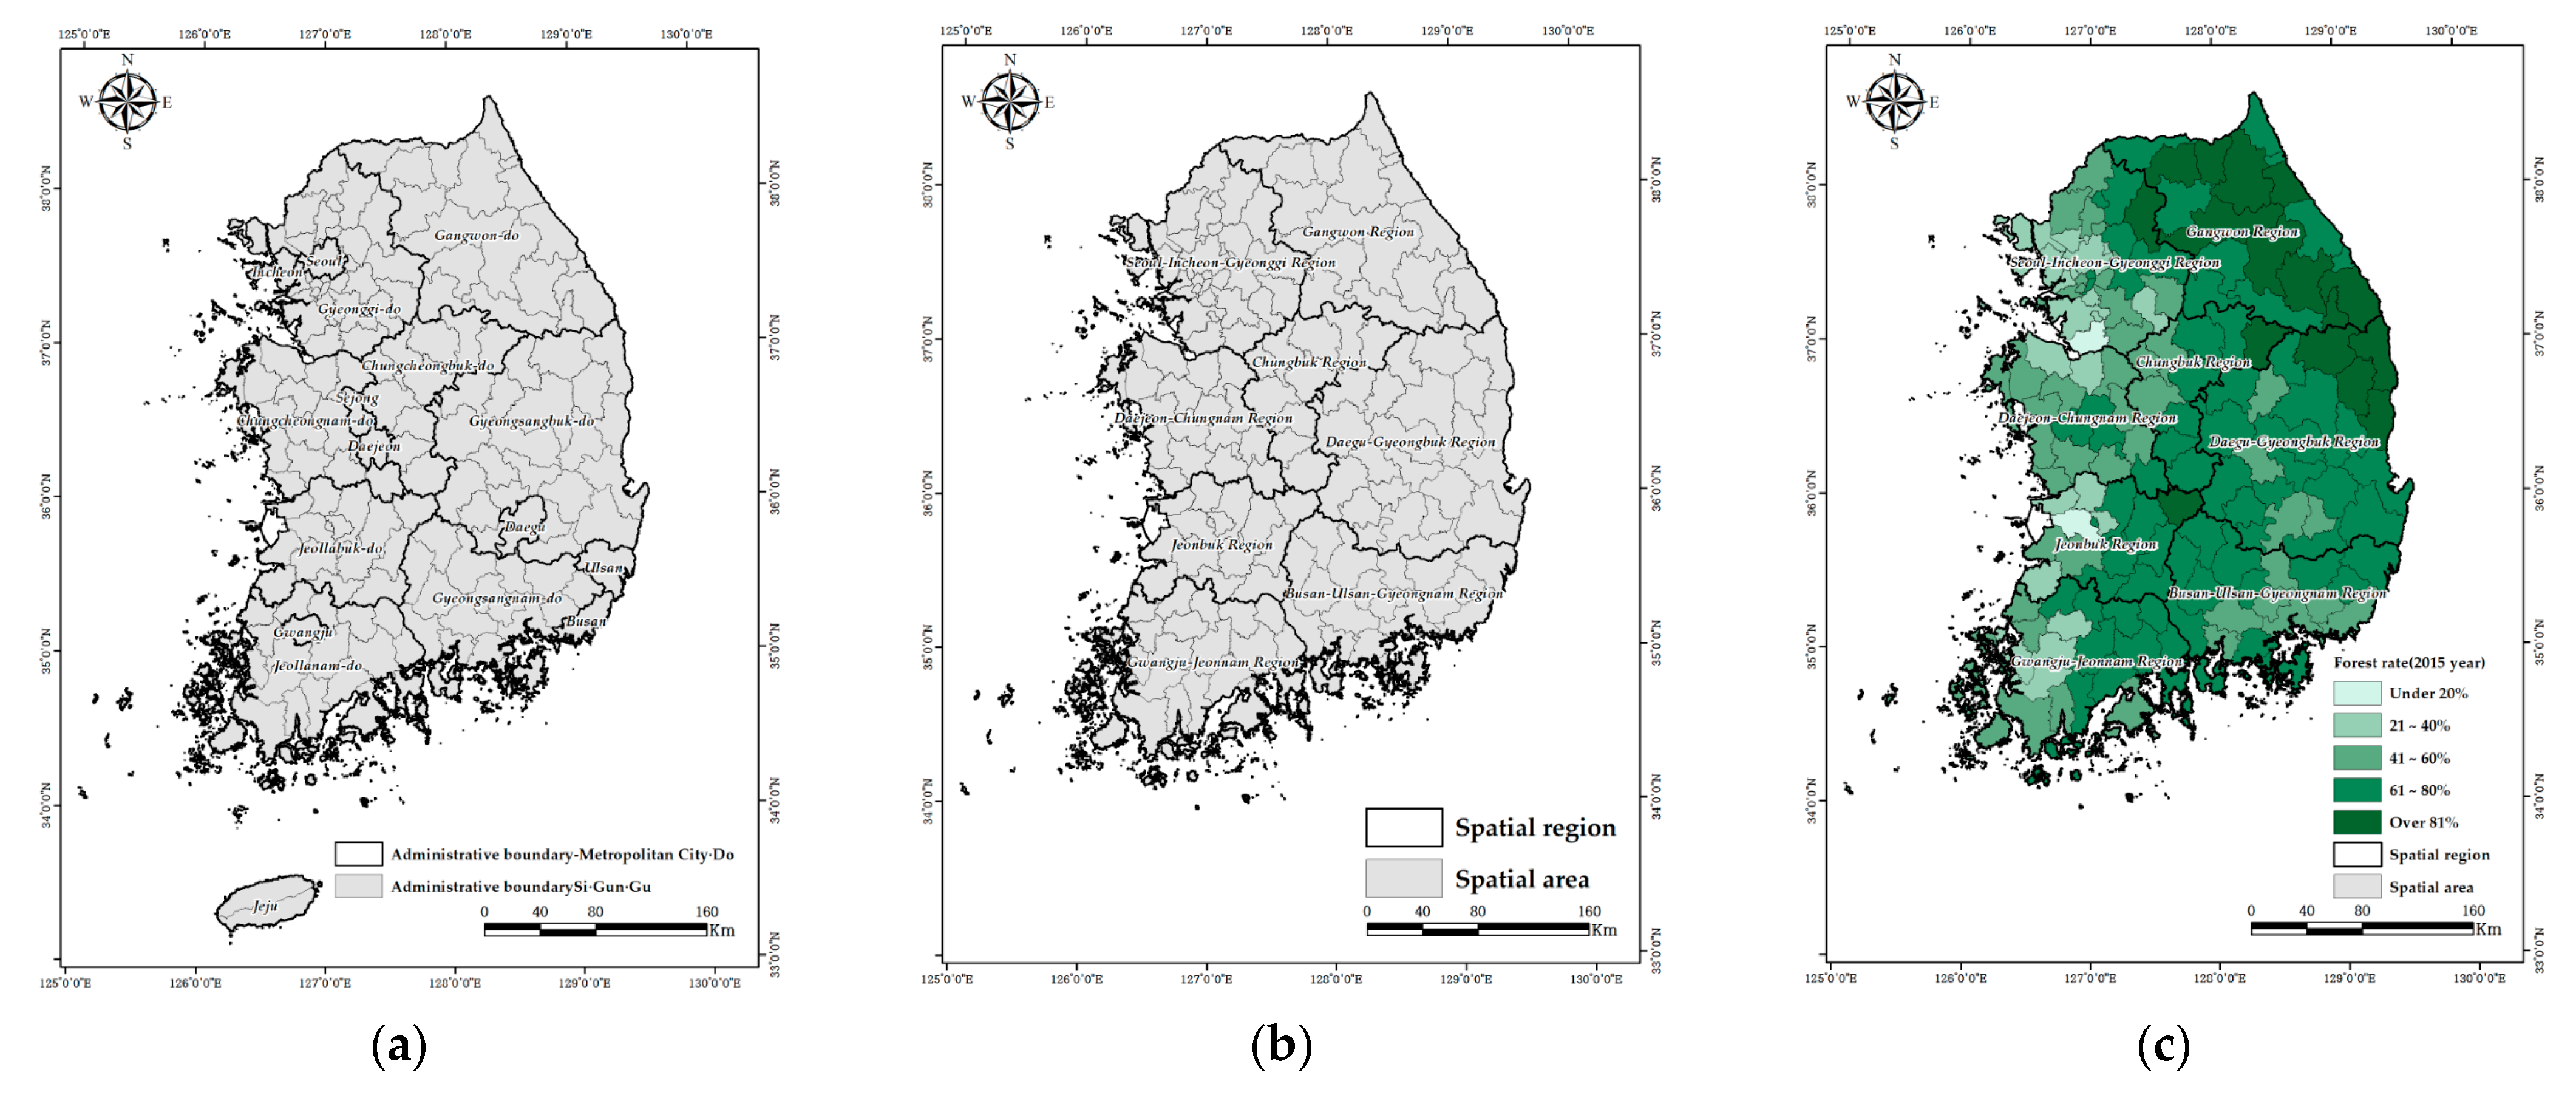
2.1. Study Site
2.2. Data Collection
2.3. Study Method
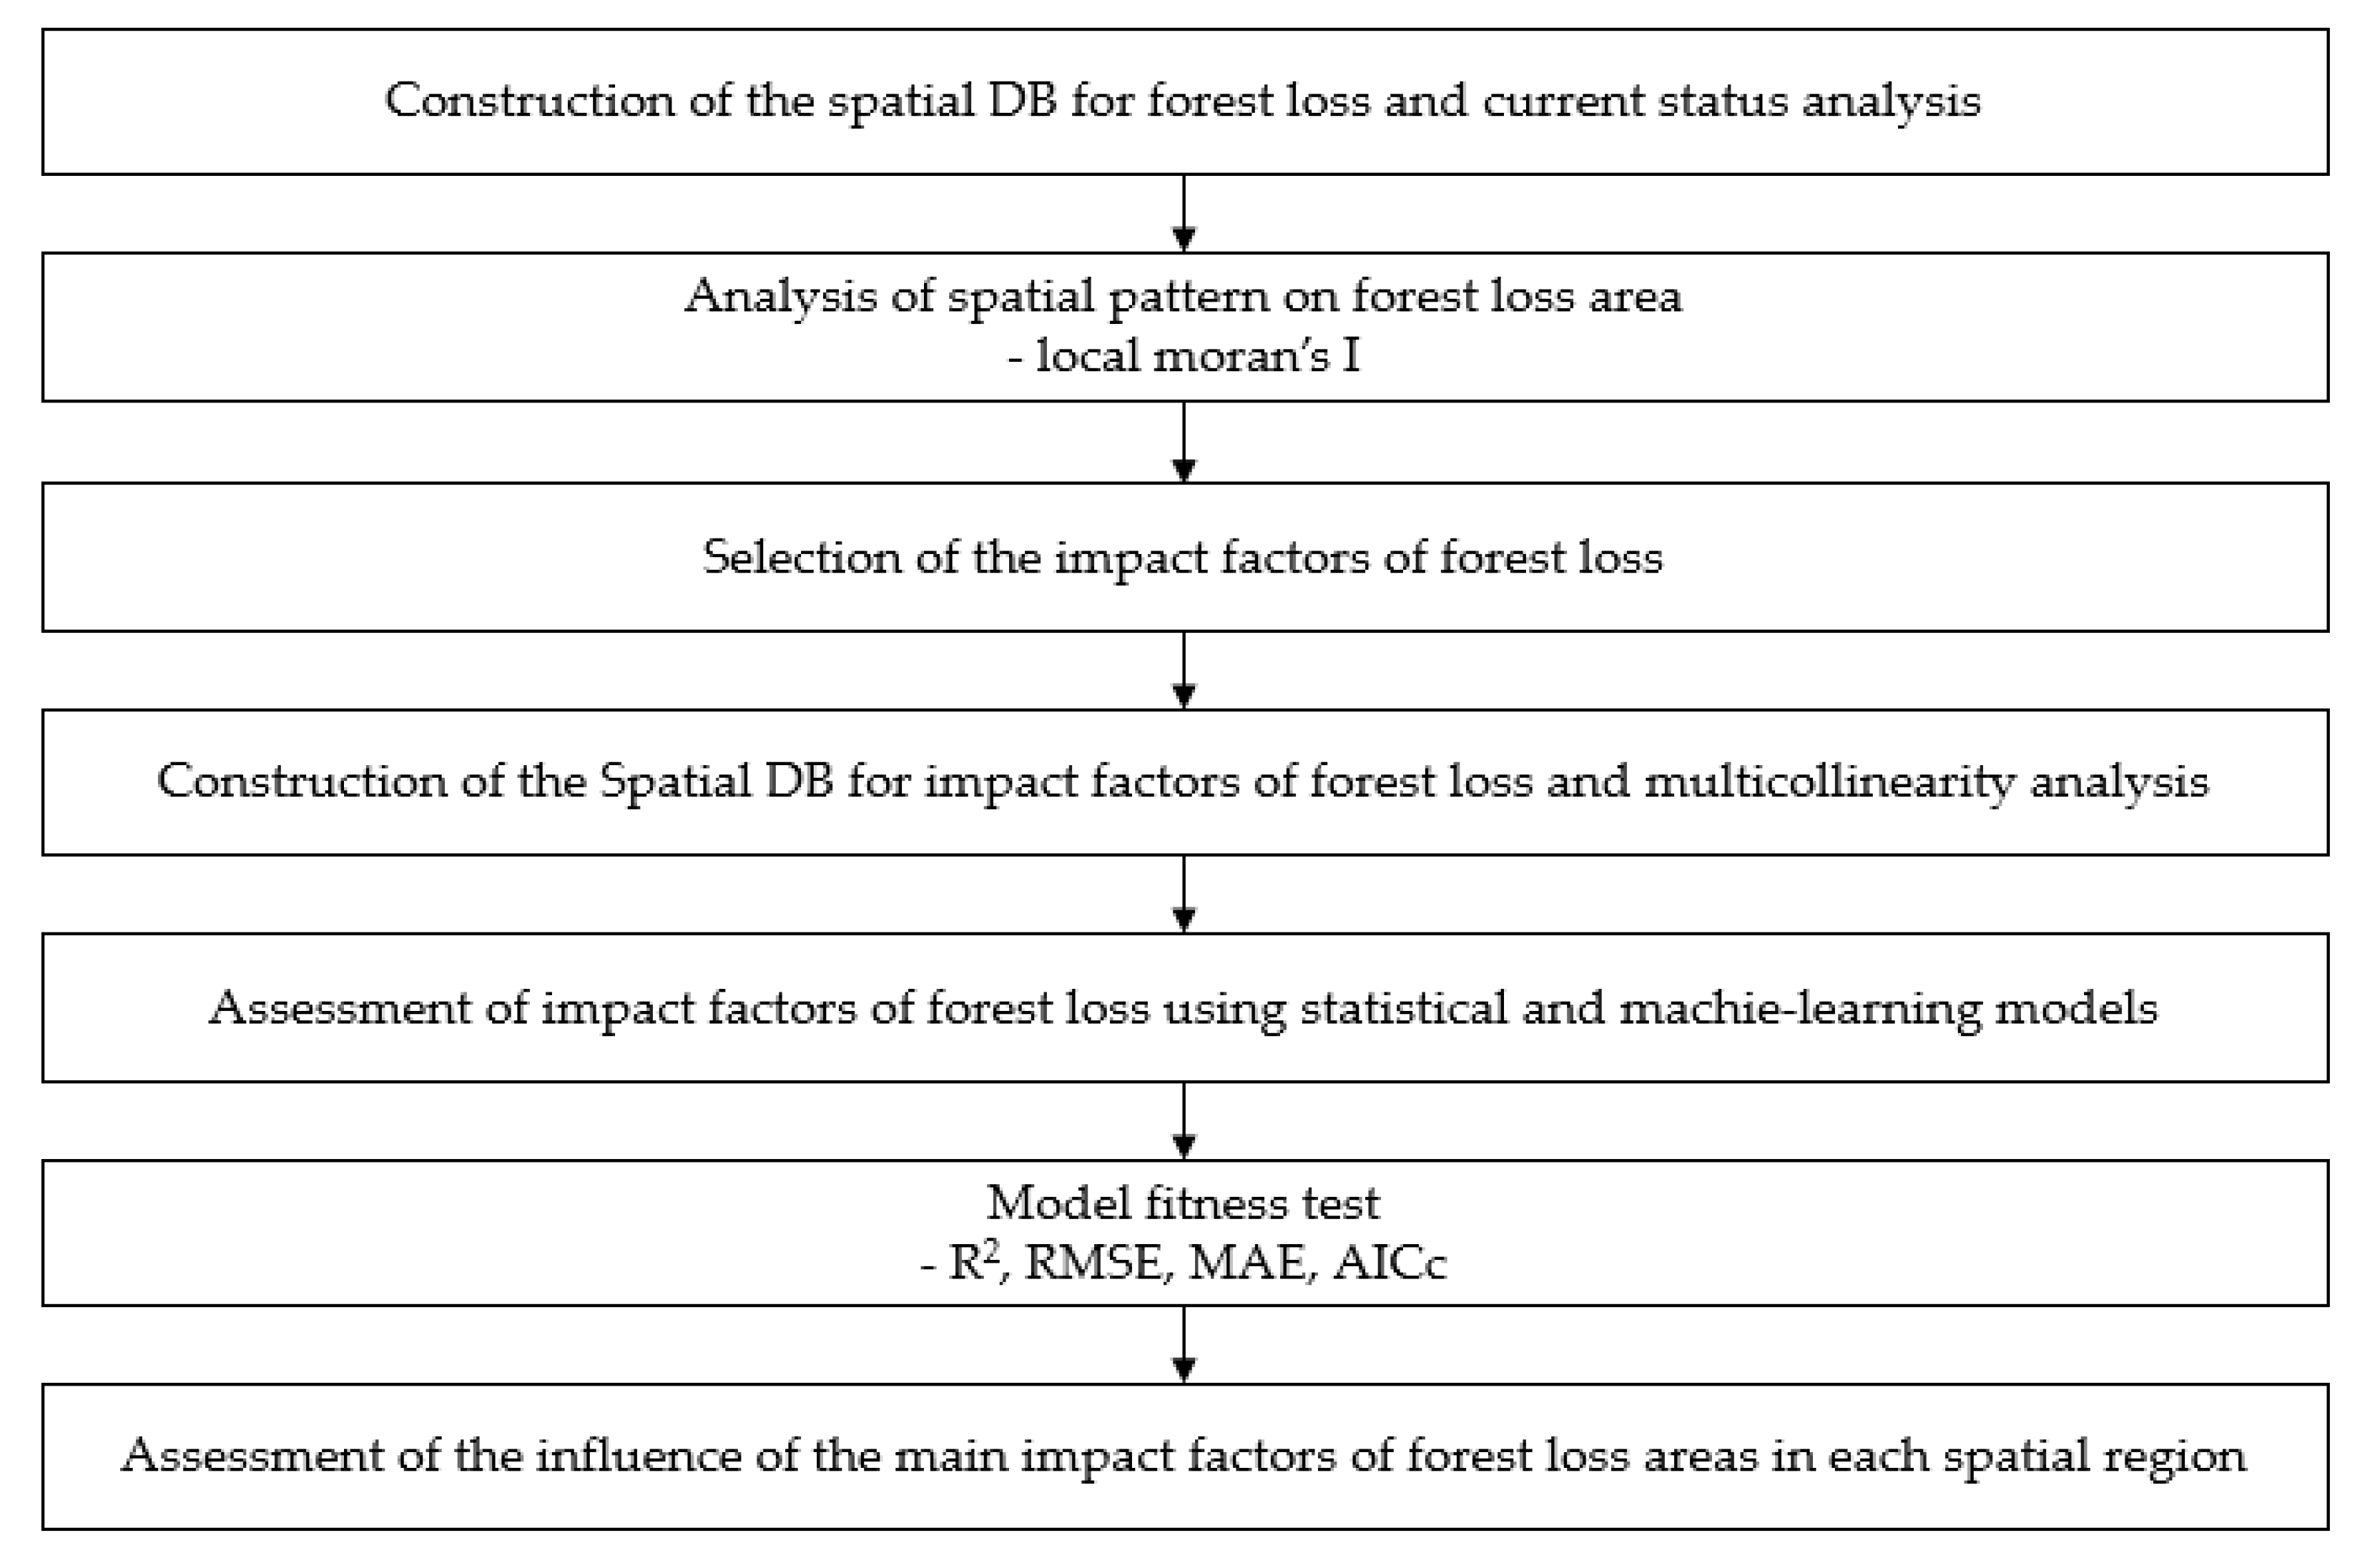
2.3.1. Construction of the Spatial DB for Forest Loss and Current Status Analysis
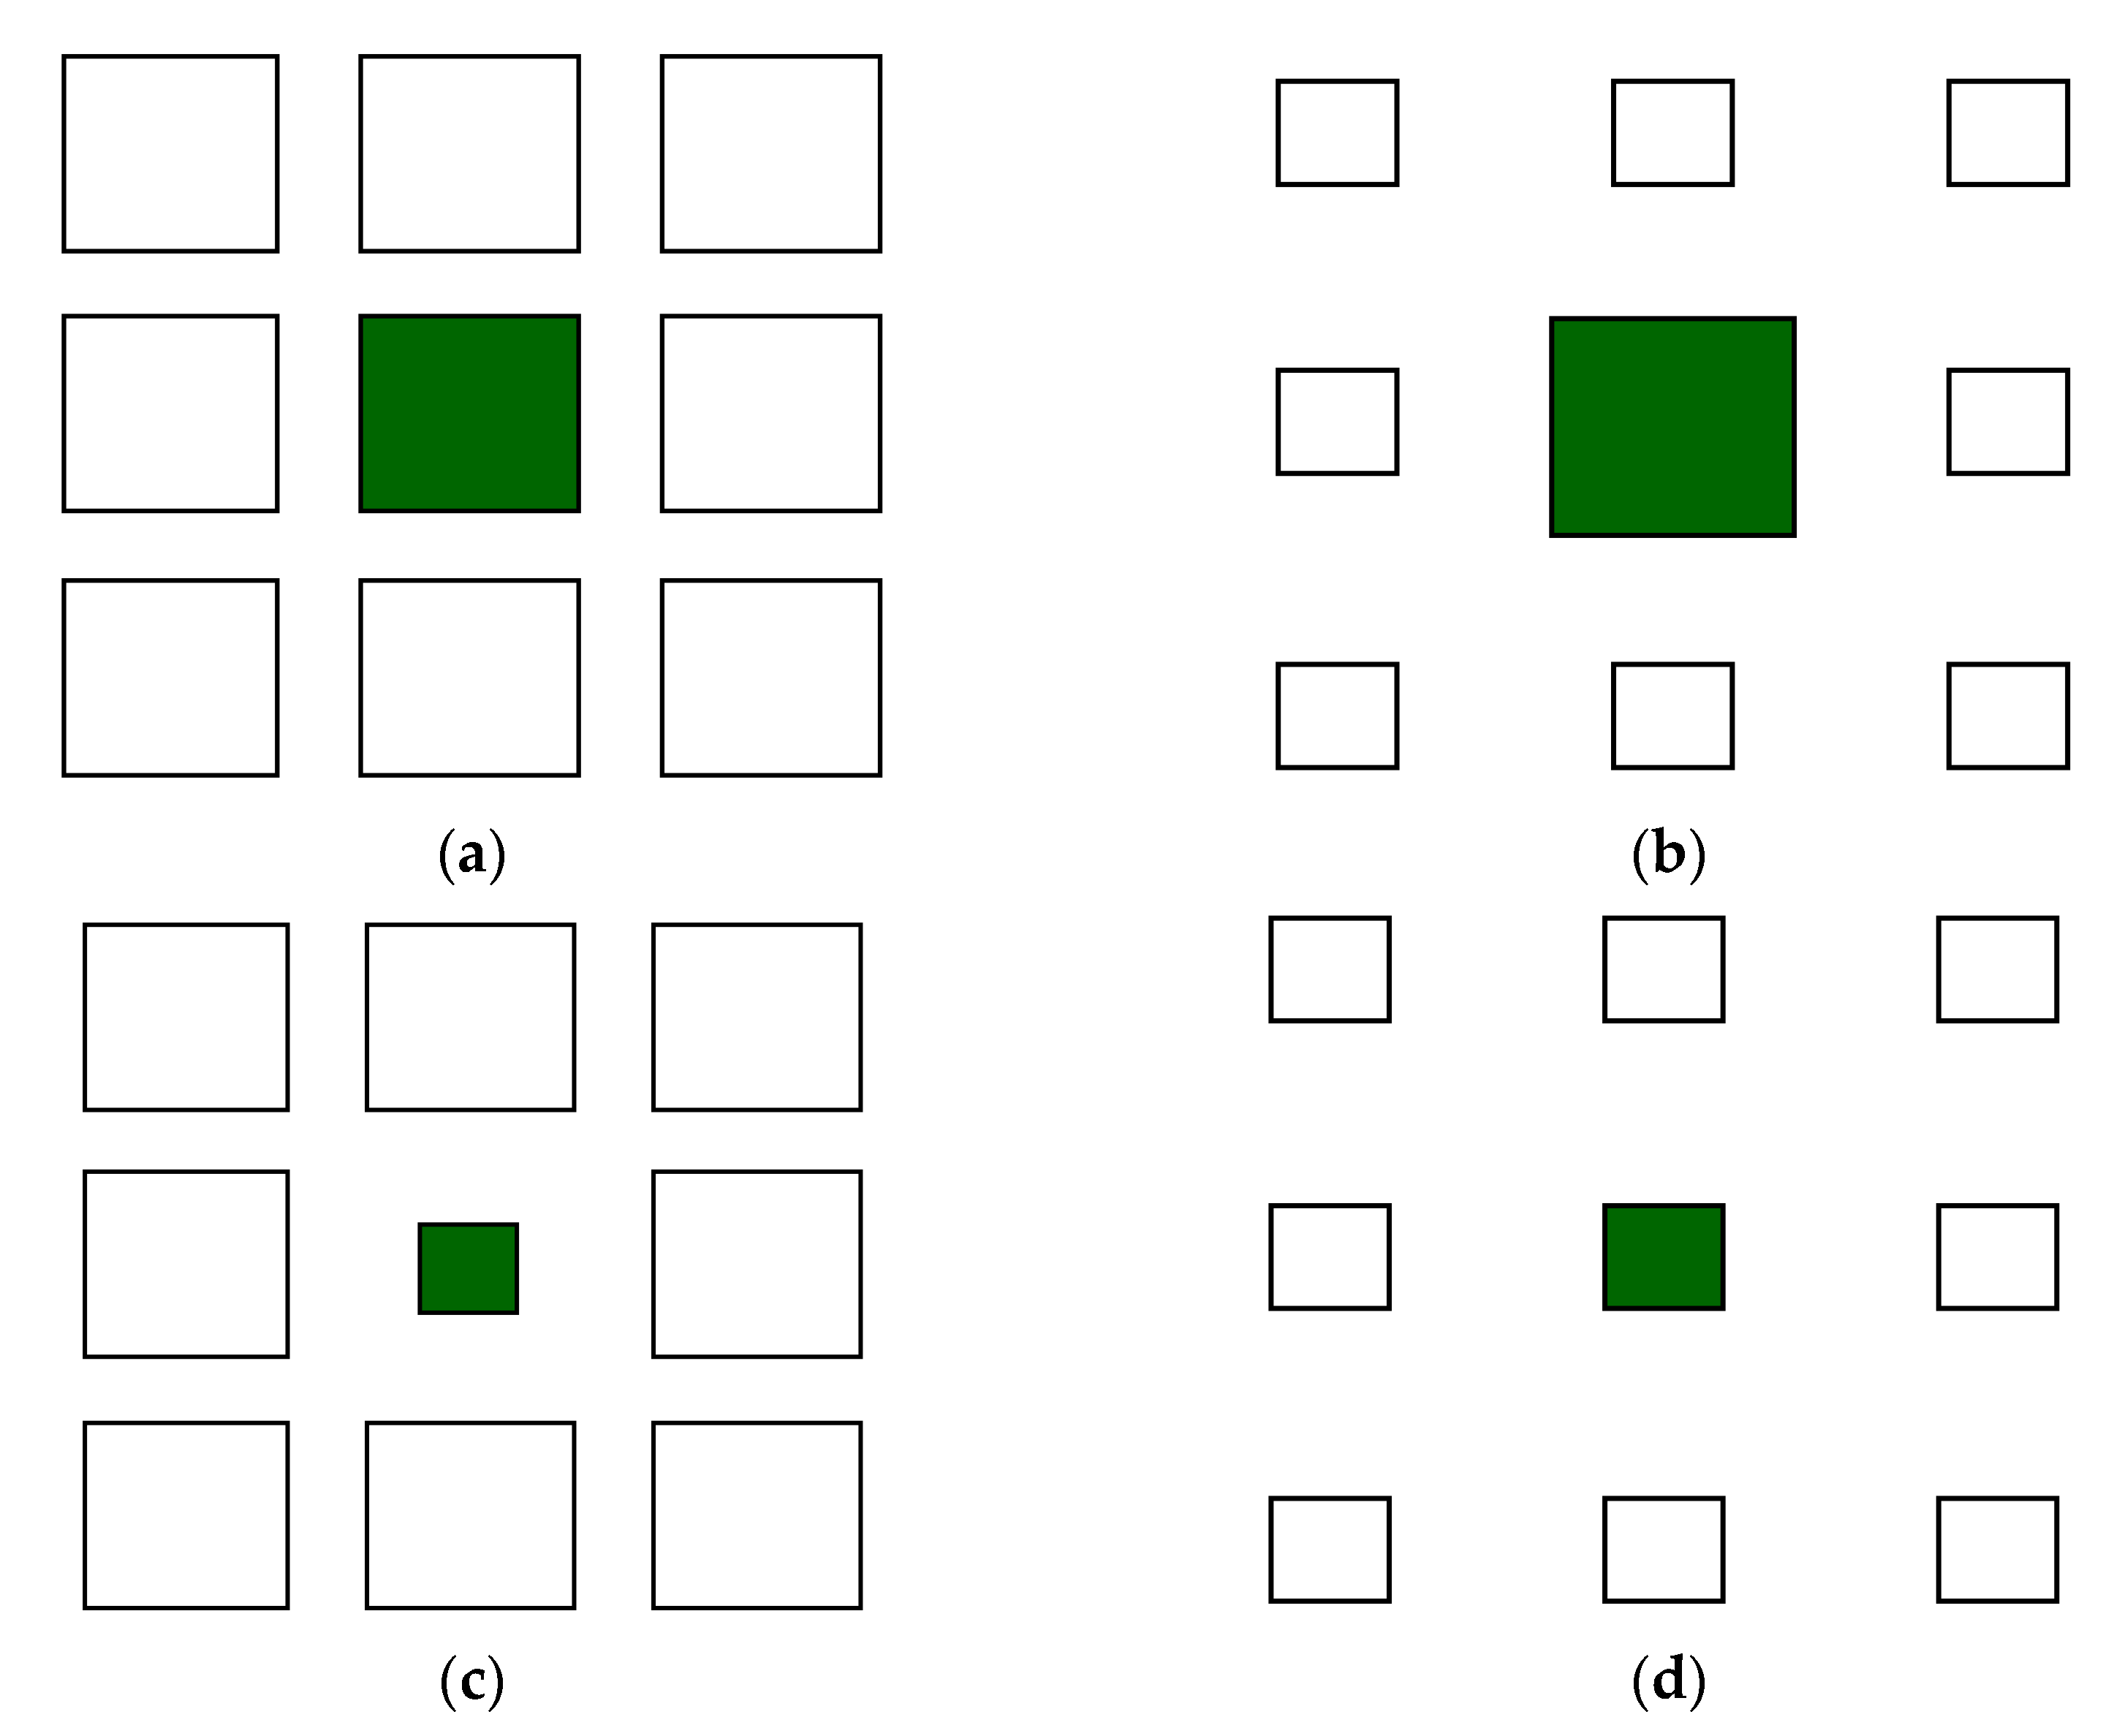
2.3.2. Analysis of Spatial Pattern on Forest Loss Area
2.3.3. Selection of Impact Factors
2.3.4. Concept of Statistical Learning (OLS and GWR Models)
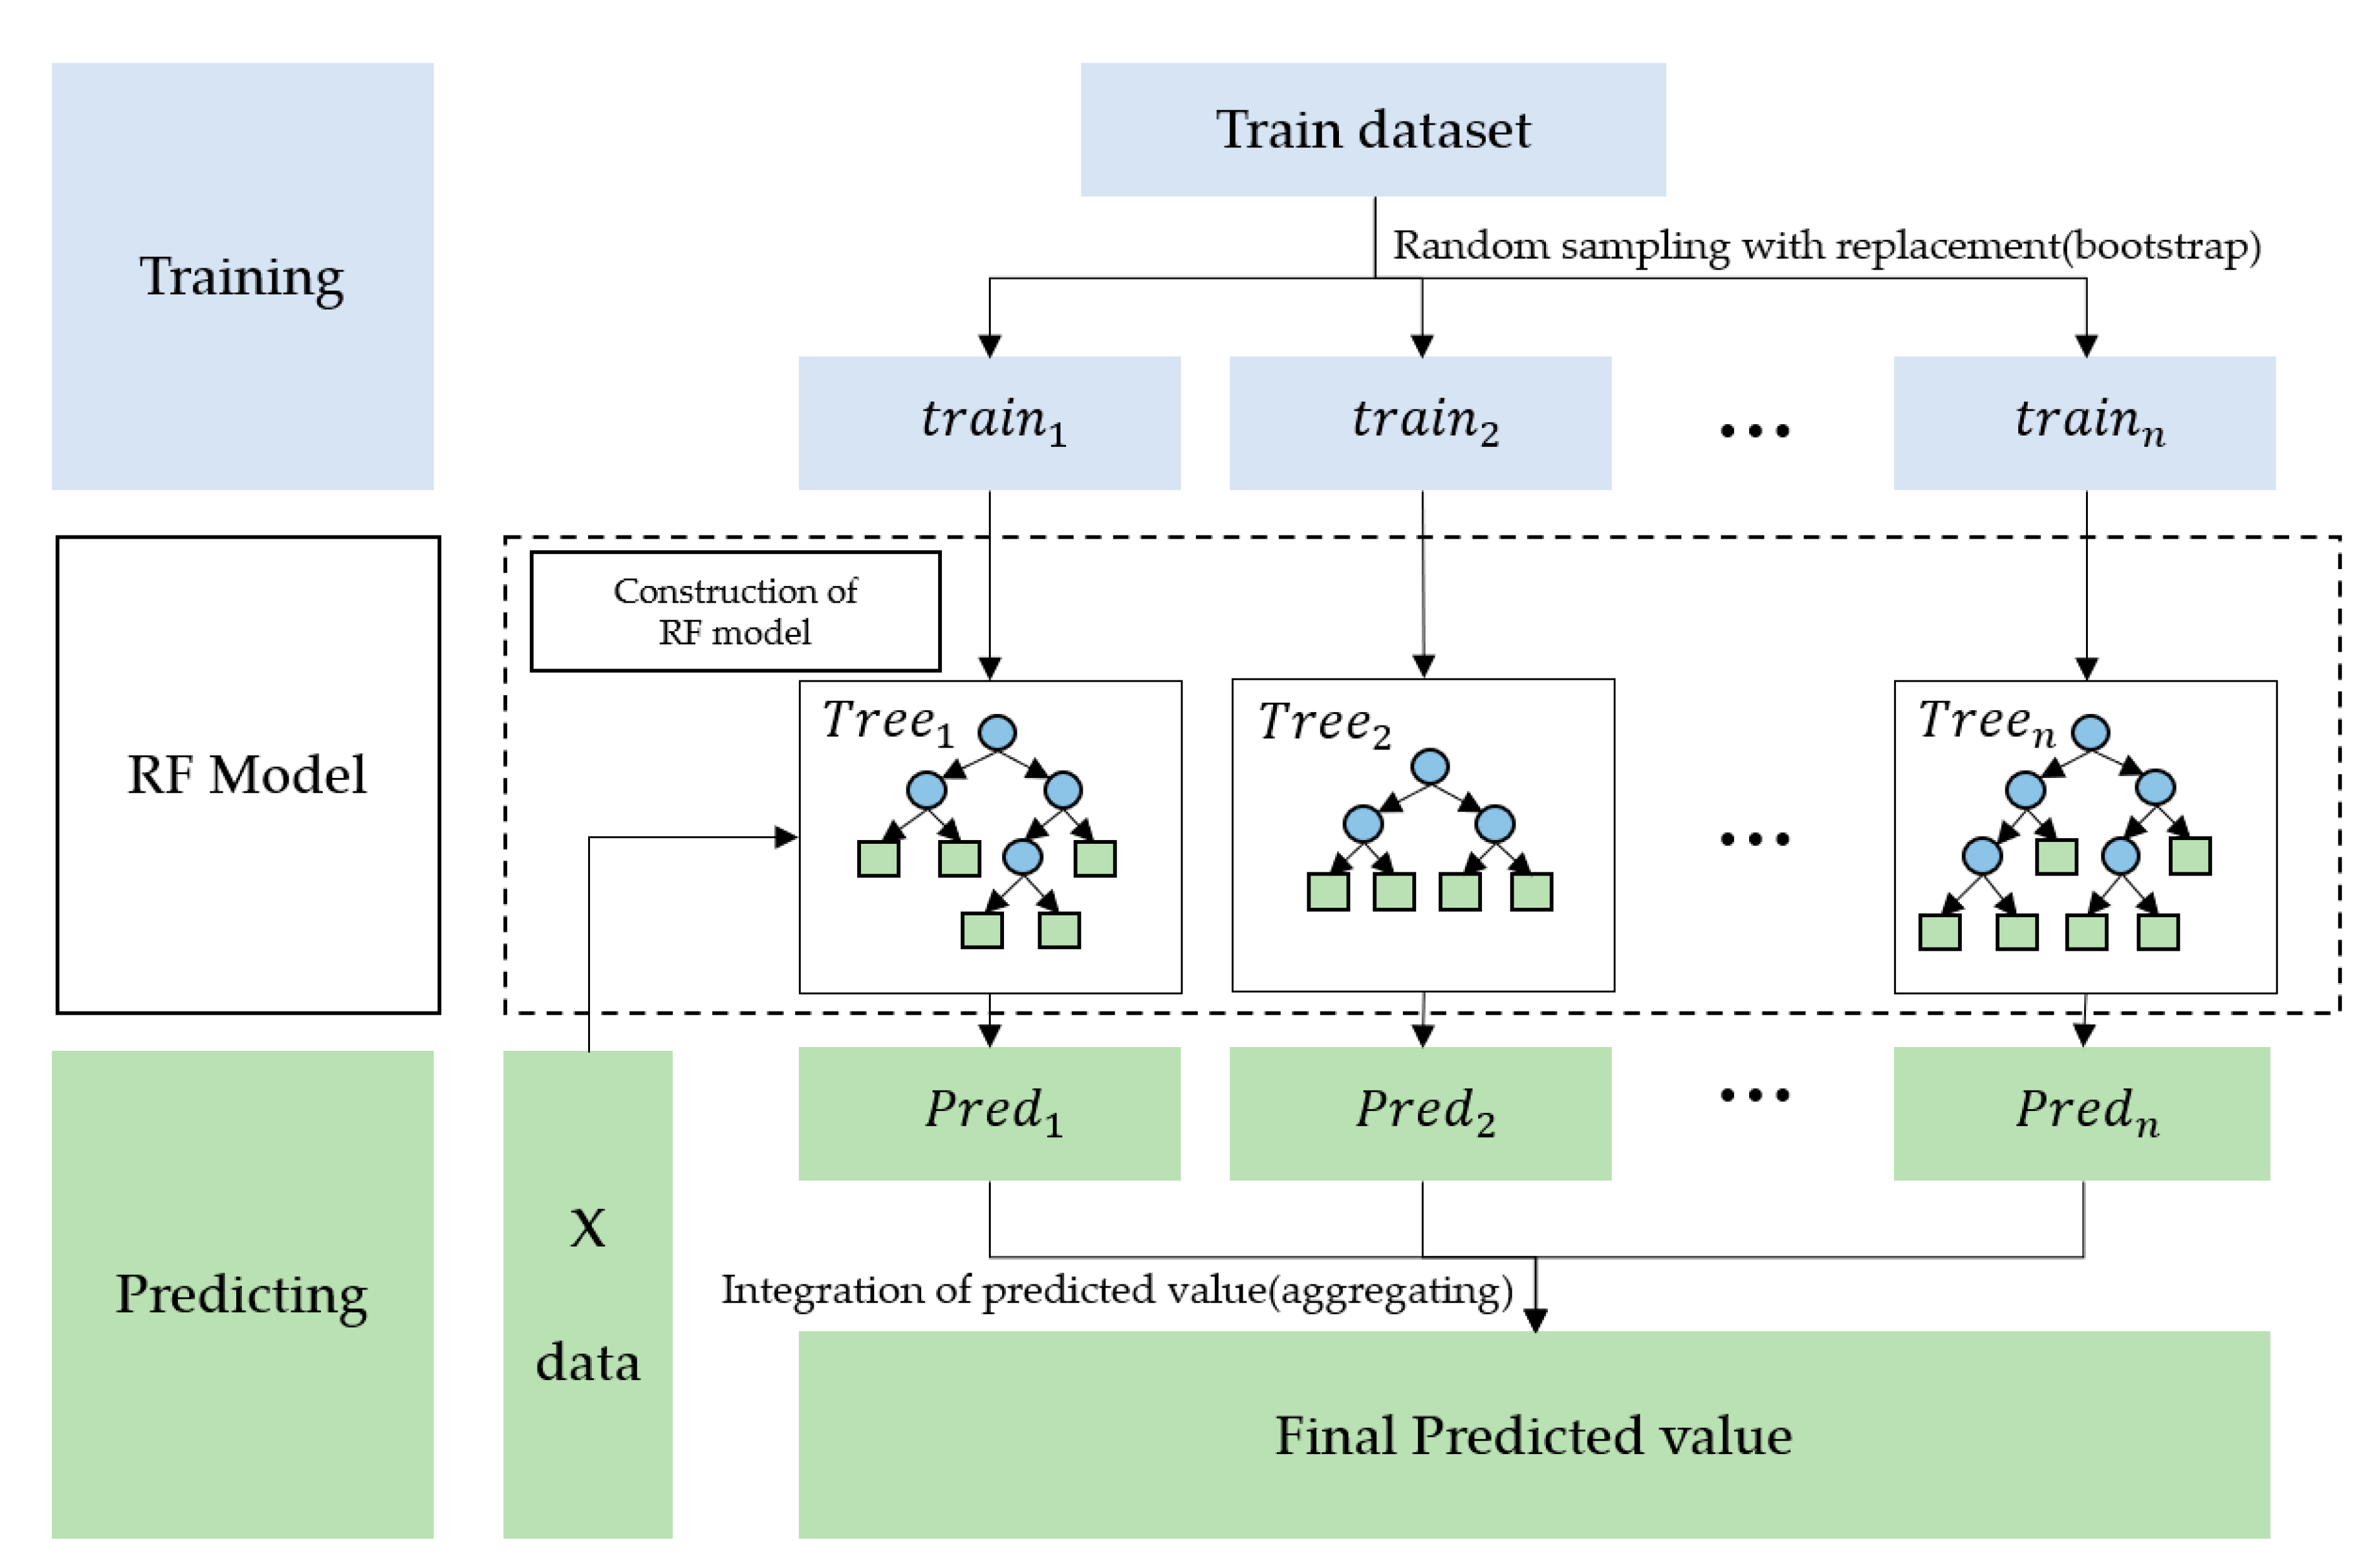
2.3.5. Machine-Learning Model (RF Model)
2.3.6. Model Fitness
3. Results and Discussion
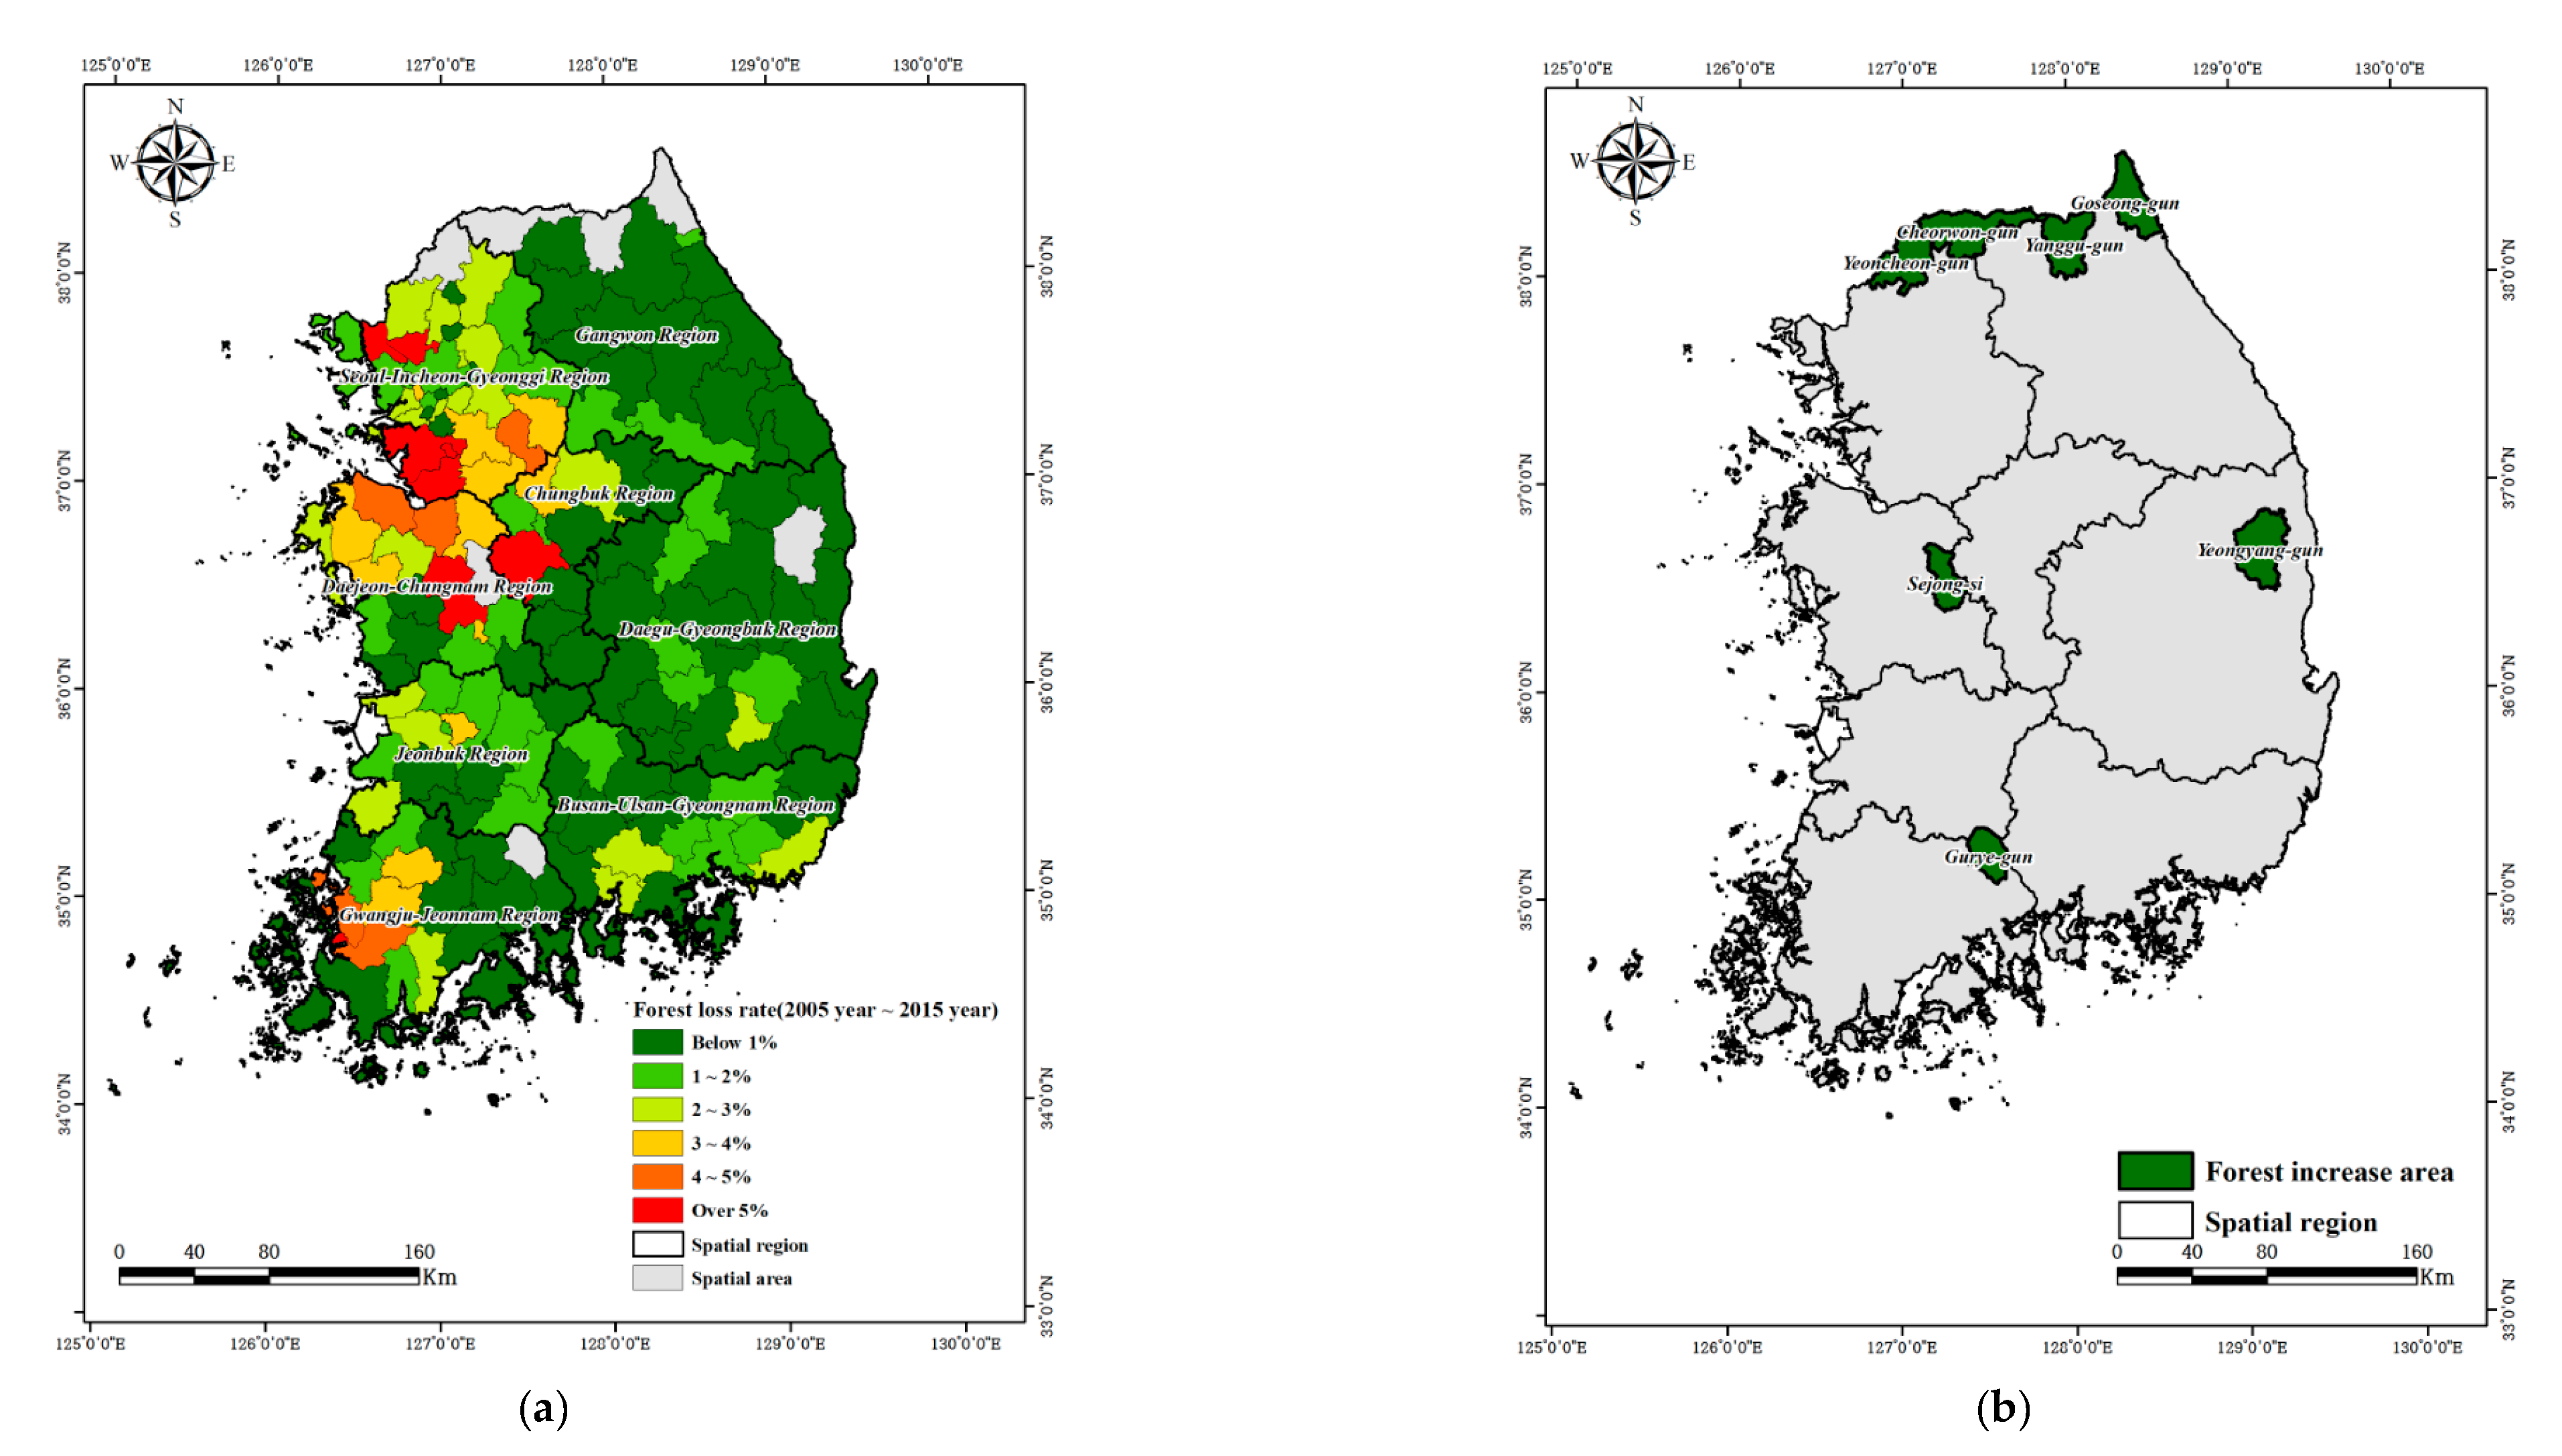
3.1. Spatial Distribution of Forest Loss during 2005–2015
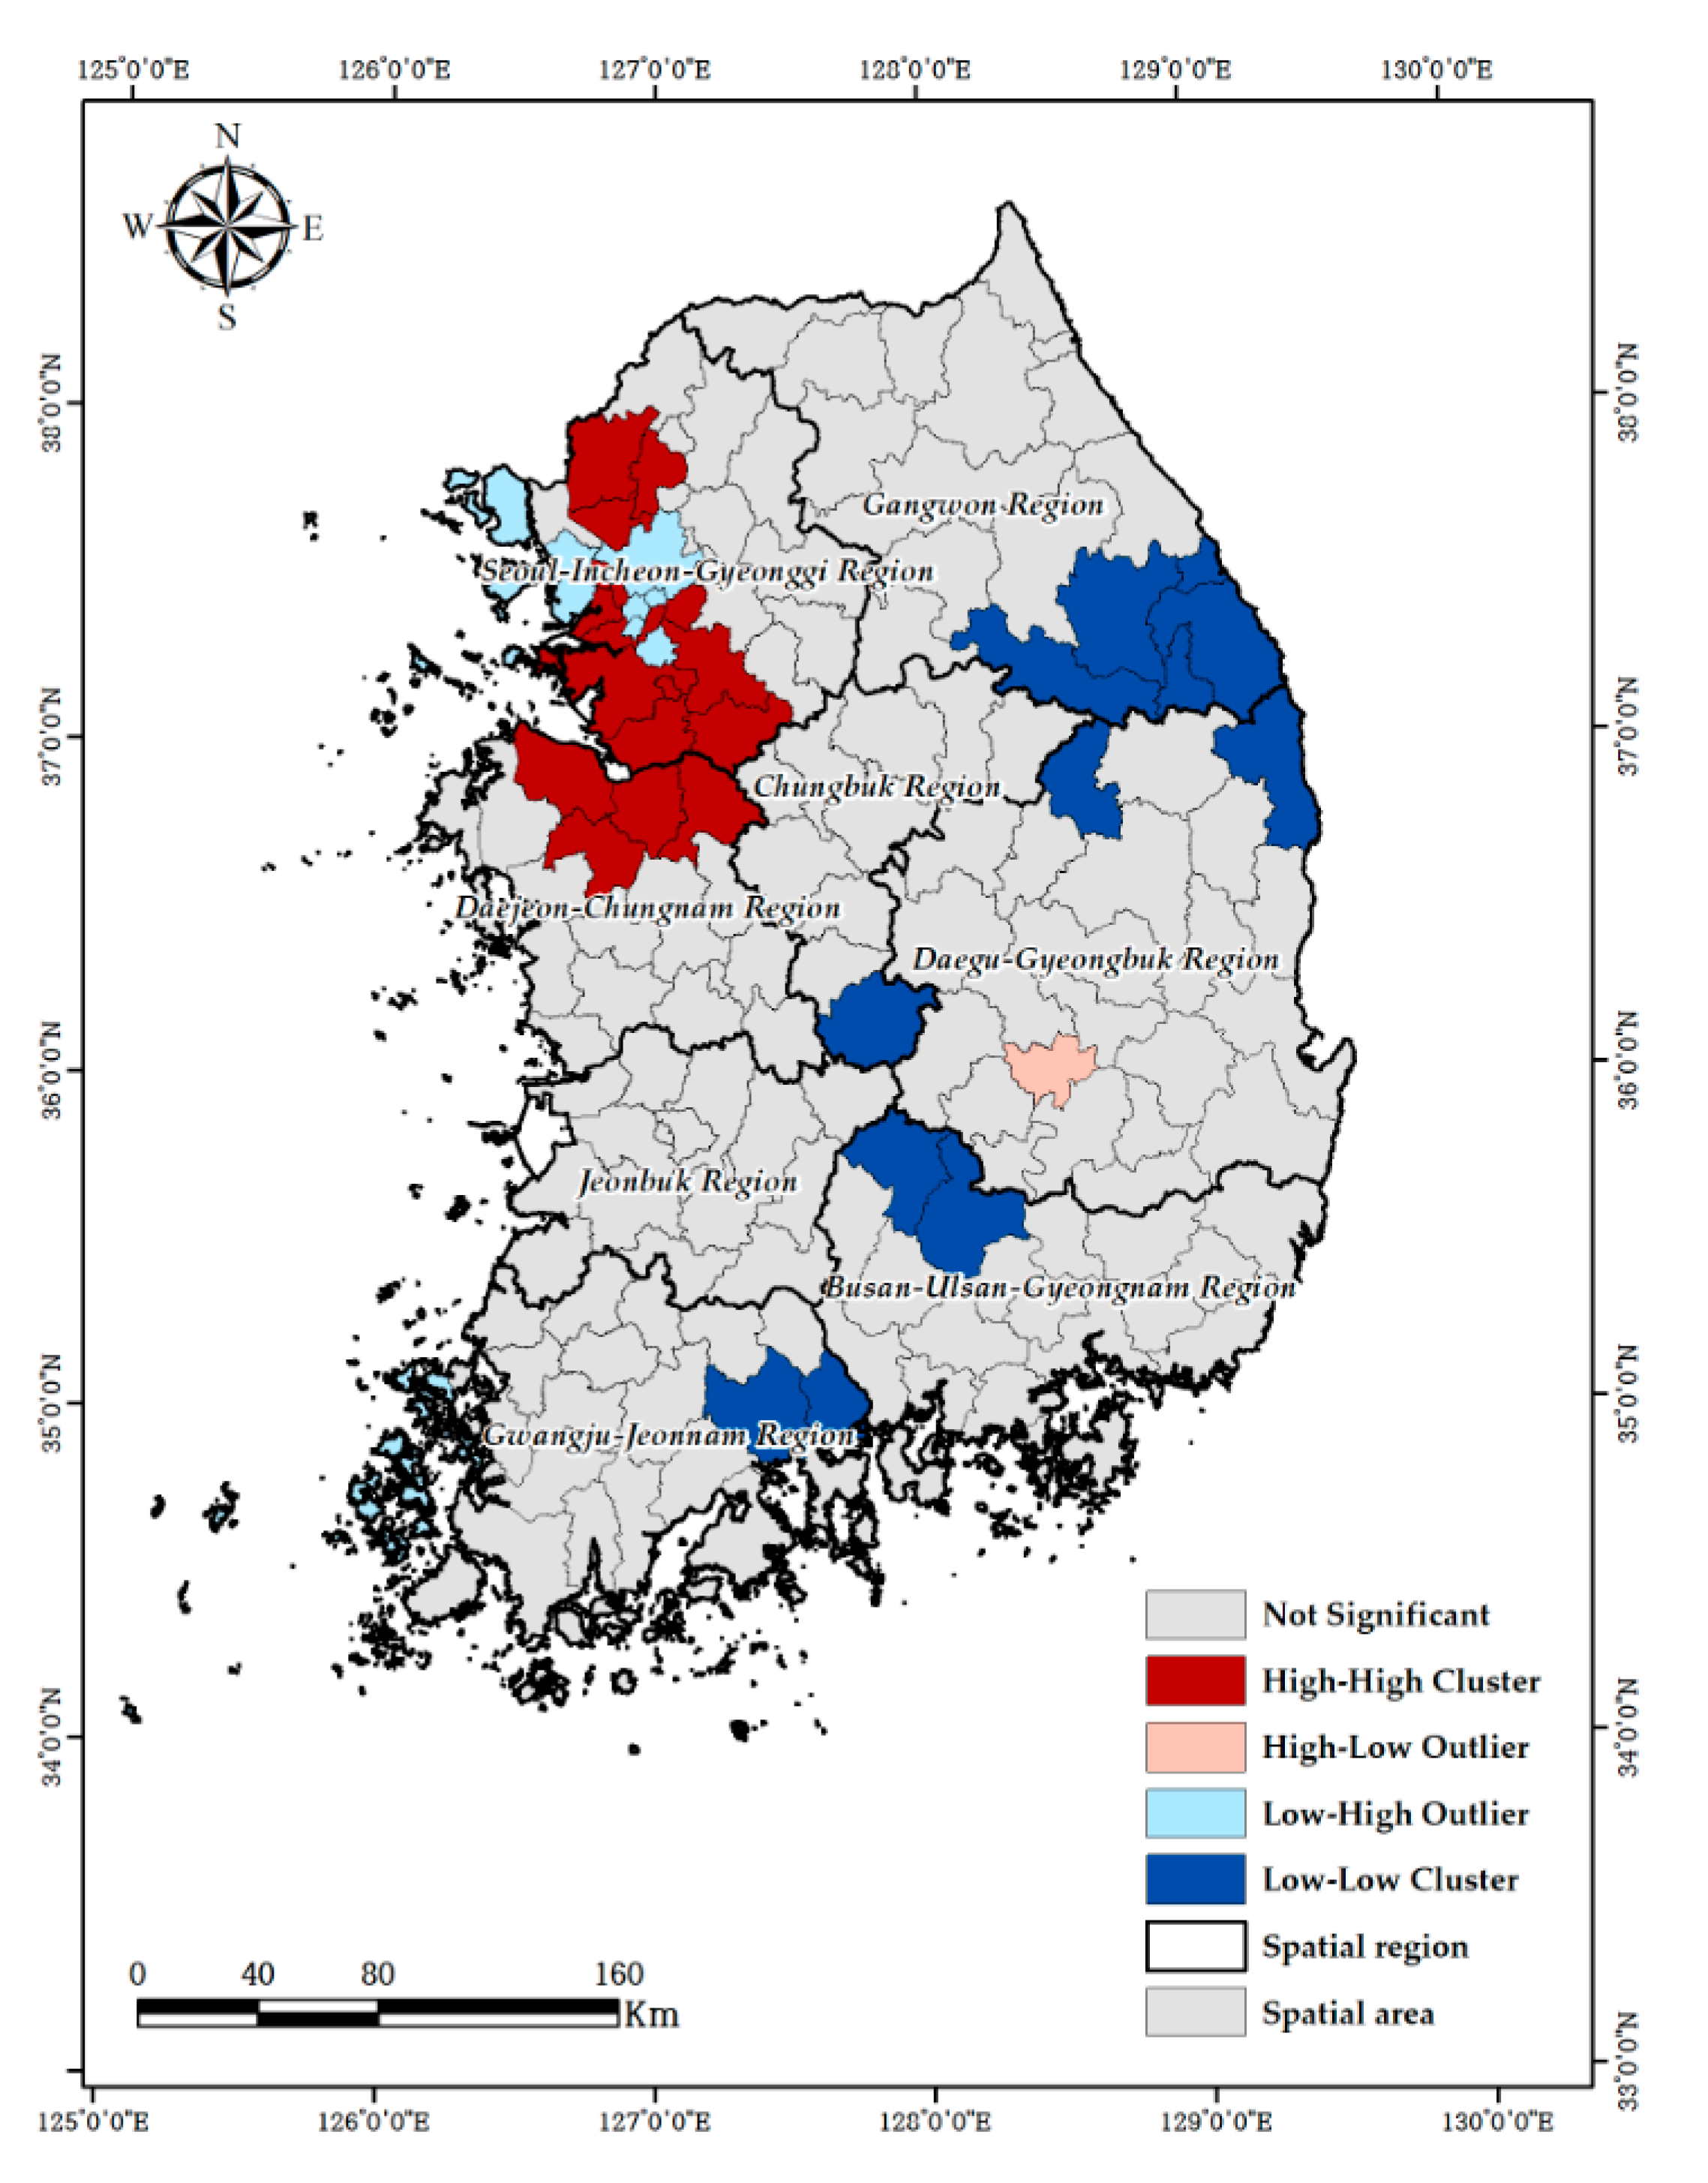
3.2. Spatial Patterns of Forest Loss
3.3. Assessment of Factors Impacting Forest Loss
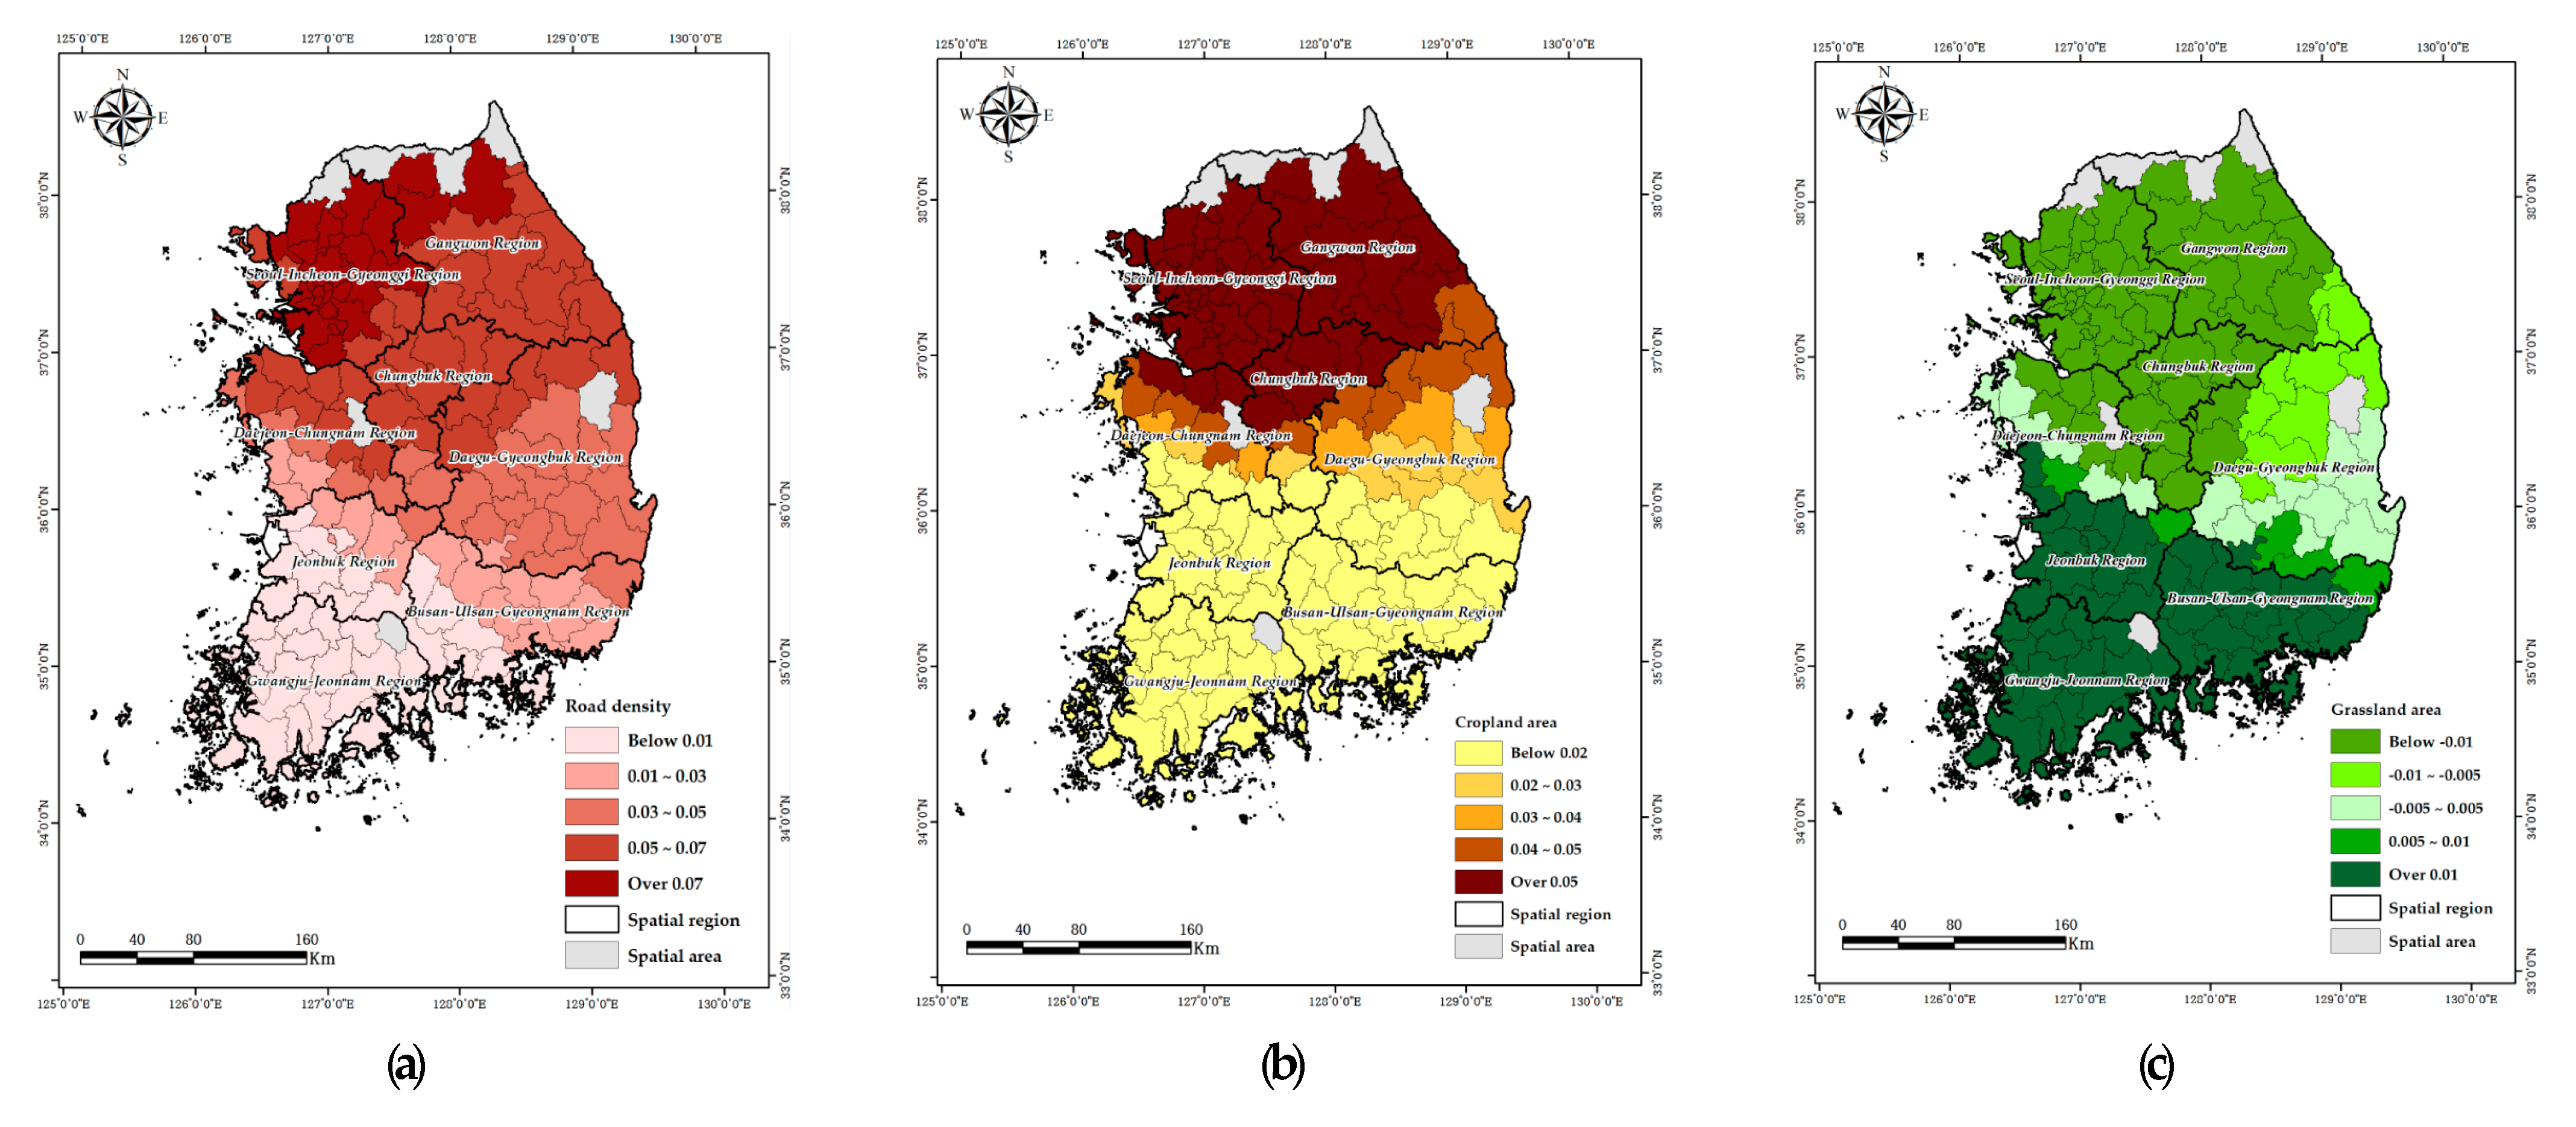
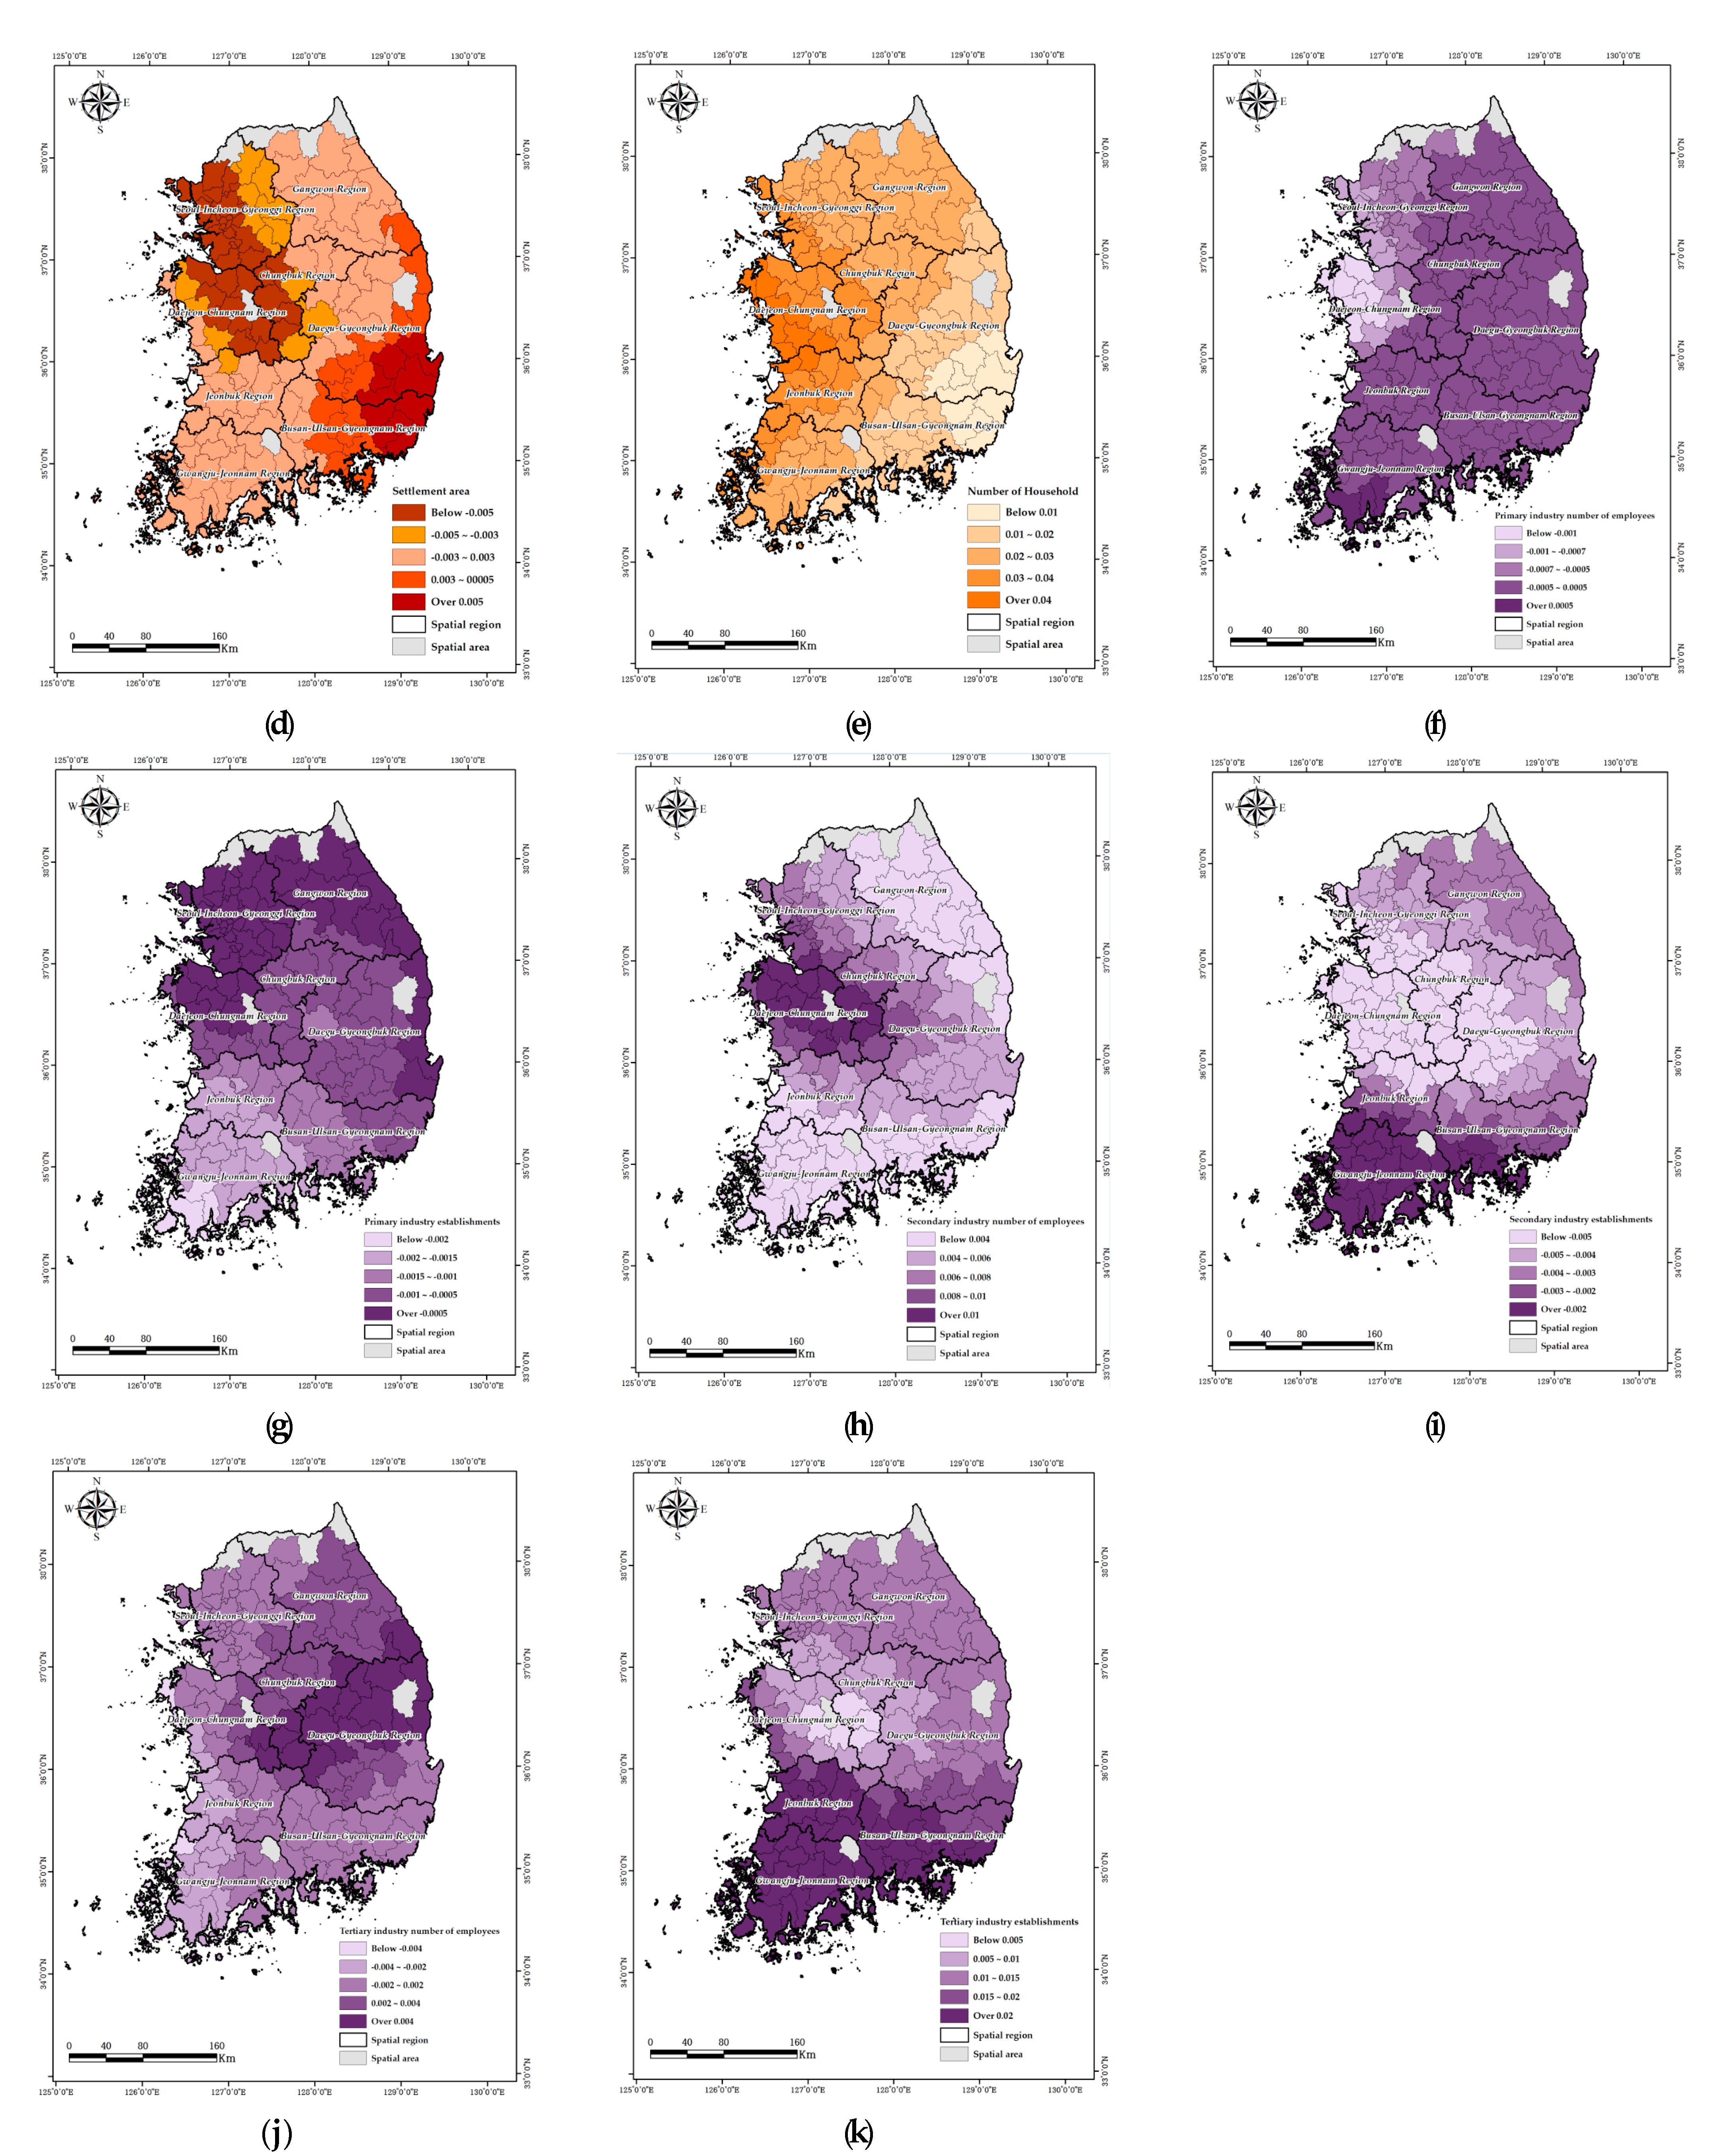
3.3.1. Selection of Variables Related to the Factors Impacting Forest Loss
3.3.2. Model Fitness Test
3.3.3. Assessment of Factors Impacting Forest Loss Areas in Each Spatial Region
3.4. Limitations of the Study
4. Conclusions
Author Contributions
Funding
Institutional Review Board Statement
Informed Consent Statement
Data Availability Statement
Conflicts of Interest
References
- Food and Agriculture Organization of the United Nations (FAO). Global Forest Resources Assessment 2020; Main Report; FAO: Rome, Italy, 2020. [Google Scholar]
- Prevedello, J.A.; Winck, G.R.; Weber, M.M.; Nichols, E.; Sinervo, B. Impacts of Forestation and Deforestation on Local Temperature Across the Globe. PLoS ONE 2019, 14, e0213368. [Google Scholar] [CrossRef] [Green Version]
- Intergovernmental Panel on Climate Change (IPCC). Climate Change 2014: Contribution of Working Groups I, II and III to the Fifth Assessment Report of the Intergovernmental Panel on Climate Change; Synthesis Report; IPCC: Geneva, Switzerland, 2014. [Google Scholar]
- Giesekam, J.; Tingley, D.D.; Cotton, I. Aligning carbon targets for construction with (inter) national climate change mitigation commitments. Energy Build. 2018, 165, 106–117. [Google Scholar] [CrossRef]
- Tyukavina, A.; Hansen, M.C.; Potapov, P.; Parker, D.; Okpa, C.; Stehman, S.V.; Kommareddy, I.; Turubanova, S. Congo Basin forest loss dominated by increasing smallholder clearing. Sci. Adv. 2018, 4, eaat2993. [Google Scholar] [CrossRef] [Green Version]
- Cohn, A.S.; Bhattarai, N.; Campolo, J.; Crompton, O.; Dralle, D.; Duncan, J.; Thompson, S. Forest loss in Brazil increases maximum temperatures within 50 km. Environ. Res. Lett. 2019, 14, 084047. [Google Scholar] [CrossRef] [Green Version]
- Zhu, Z.; Zhu, X. Study on Spatiotemporal Characteristic and Mechanism of Forest Loss in Urban Agglomeration in the Middle Reaches of the Yangtze River. Forests 2021, 12, 1242. [Google Scholar] [CrossRef]
- Zheng, Z.; Ma, T.; Roberts, P.; Li, Z.; Yue, Y.; Peng Huang, K.; Han, Z.; Wan, Q.; Zhang, Y.; Zhang, X.; et al. Anthropogenic impacts on Late Holocene land-cover change and floristic biodiversity loss in tropical southeastern Asia. Proc. Natl. Acad. Sci. USA 2021, 118, e2022210118. [Google Scholar] [CrossRef]
- Laurance, W.F.; Sayer, J.; Cassman, K.G. Agricultural expansion and its impacts on tropical nature. Trends Ecol. Evol. 2014, 29, 107–116. [Google Scholar] [CrossRef] [PubMed]
- Nobre, C.A.; Sampaio, G.; Borma, L.S.; Castilla-Rubio, J.C.; Silva, J.S.; Cardoso, M. Land-use and climate change risks in the Amazon and the need of a novel sustainable development paradigm. Proc. Natl. Acad. Sci. USA 2016, 113, 10759–10768. [Google Scholar] [CrossRef] [PubMed] [Green Version]
- Korea Forest Service. Forest Basic Statistics; Korea Forest Service: Daejeon, Korea, 2020.
- Korea Forest Service. Statistical Yearbook of Forestry; Korea Forest Service: Daejeon, Korea, 2020.
- Kim, S.B.; Hwang, S.T. A Study on Extraction and Classification of Unlawful Forest Land Diversion by Using GIS. Korean Public Adm. Q. 2015, 27, 513–542. [Google Scholar]
- Aide, T.M.; Clark, M.L.; Grau, H.R.; López-Carr, D.; Levy, M.A.; Redo, D.; Andrade-Núñez, M.J.; Muñiz, M. Deforestation and Reforestation of Latin America and the Caribbean (2001–2010). Biotropica 2012, 45, 262–271. [Google Scholar] [CrossRef]
- Dlamini, W.M. Analysis of Deforestation Patterns and Drivers in Swaziland using Efficient Bayesian Multivariate Classifiers. Model. Earth Syst. Environ. 2016, 2, 1–14. [Google Scholar] [CrossRef]
- Mayfield, H. Making the Most of Machine Learning and Freely Available Datasets: A Deforestation Case Study. Ph.D. Thesis, The University of Queensland, Queensland, Australia, 2015. [Google Scholar]
- Verburg, R.; Filho, S.R.; Lindoso, D.; Debortoli, N.; Litre, G.; Bursztyn, M. The Impact of Commodity Price and Conservation Policy Scenarios on Deforestation and Agricultural Land Use in a Frontier Area within the Amazon. Land Use Policy 2014, 37, 14–26. [Google Scholar] [CrossRef]
- Damnyag, L.; Saastamoinen, O.; Blay, D.; Dwomoh, F.K.; Anglaaere, L.C.; Pappinen, A. Sustaining Protected Areas: Identifying and Controlling Deforestation and Forest Degradation Drivers in the Ankasa Conservation Area, Ghana. Biol. Conserv. 2013, 165, 86–94. [Google Scholar] [CrossRef]
- Scullion, J.J.; Vogt, K.A.; Drahota, B.; Winkler-Schor, S.; Lyons, M. Conserving the Last Great Forests: A Meta-analysis Review of the Drivers of Intact Forest Loss and the Strategies and Policies to Save Them. Front. For. Glob. Change. 2019, 2, 62. [Google Scholar] [CrossRef]
- Echeverria, C.; Coomes, D.A.; Hall, M.; Newton, A.C. Spatially explicit models to analyze forest loss and fragmentation between 1976 and 2020 in southern Chile. Ecol. Modell. 2008, 212, 439–449. [Google Scholar] [CrossRef]
- Gayen, A.; Saha, S. Deforestation probable area predicted by logistic regression in Pathro river basin: A tributary of Ajay River. Spatial. Inf. Res. 2018, 26, 1–9. [Google Scholar] [CrossRef]
- Sharma, P.; Thapa, R.B.; Matin, M.A. Examining Forest cover change and deforestation drivers in Taunggyi District, Shan State, Myanmar. Environ. Dev. Sustain. 2020, 22, 5521–5538. [Google Scholar] [CrossRef] [Green Version]
- Geist, H.J.; Lambin, E.F. Proximate Causes and Underlying Driving Forces of Tropical Deforestation: Tropical Forests are Disappearing as the Result of Many Pressures, both Local and Regional, Acting in Various Combinations in Different Geographical Locations. Bioscience 2002, 52, 143–150. [Google Scholar] [CrossRef]
- Brondizio, E.S.; Moran, E.F. Level-Dependent Deforestation Trajectories in the Brazilian Amazon from 1970 to 2001. Popul. Environ. 2012, 34, 69–85. [Google Scholar] [CrossRef]
- Cochard, R.; Ngo, D.T.; Waeber, P.O.; Kull, C.A. Extent and Causes of Forest Cover Changes in Vietnam’s Provinces 1993–2013: A Review and Analysis of Official Data. Environ. Rev. 2017, 25, 199–217. [Google Scholar] [CrossRef] [Green Version]
- Jusys, T. Fundamental Causes and Spatial Heterogeneity of Deforestation in Legal Amazon. Appl. Geogr. 2016, 75, 188–199. [Google Scholar] [CrossRef]
- Trigueiro, W.R.; Nabout, J.C.; Tessarolo, G. Uncovering the Spatial Variability of Recent Deforestation Drivers in the Brazilian Cerrado. J. Environ. Manag. 2020, 275, 111243. [Google Scholar] [CrossRef] [PubMed]
- Anselin, L. Local Indicators of Spatial Association-LISA. Geogr. Anal. 1995, 27, 93–115. [Google Scholar] [CrossRef]
- Harris, N.L.; Goldman, E.; Gabris, C.; Nordling, J.; Minnemeyer, S.; Ansari, S.; Lippmann, M.; Bennett, L.; Raad, M.; Hansen, M.; et al. Using Spatial Statistics to Identify Emerging Hot Spots of Forest Loss. Environ. Res. Lett. 2017, 12, 024012. [Google Scholar] [CrossRef]
- Cushman, S.A.; Macdonald, E.A.; Landguth, E.L.; Malhi, Y.; Macdonald, D.W. Multiple-scale Prediction of Forest Loss Risk Across Borneo. Landsc. Ecol. 2017, 32, 1581–1598. [Google Scholar] [CrossRef] [Green Version]
- Uvsh, D.; Gehlbach, S.; Potapov, P.V.; Munteanu, C.; Bragina, E.V.; Radeloff, V.C. Correlates of Forest-cover Change in European Russia, 1989–2012. Land Use Policy. 2020, 96, 104648. [Google Scholar] [CrossRef]
- Mohamed, M.A. An Assessment of Forest Cover Change and Its Driving Forces in the Syrian Coastal Region during a Period of Conflict, 2010 to 2020. Land 2021, 10, 191. [Google Scholar] [CrossRef]
- Clement, F.; Orange, D.; Williams, M.; Mulley, C.; Epprecht, M. Drivers of Afforestation in Northern Vietnam: Assessing Local Variations using Geographically Weighted Regression. Appl. Geogr. 2009, 29, 561–576. [Google Scholar] [CrossRef]
- Chen, L.; Ren, C.; Zhang, B.; Wang, Z.; Xi, Y. Estimation of forest above-ground biomass by geographically weighted regression and machine learning with sentinel imagery. Forests 2018, 9, 582. [Google Scholar] [CrossRef] [Green Version]
- Breiman, L. Random forests. Mach. Learn. 2001, 45, 5–32. [Google Scholar] [CrossRef] [Green Version]
- Georganos, S.; Grippa, T.; Niang Gadiaga, A.; Linard, C.; Lennert, M.; Vanhuysse, S.; Mboga, N.; Wolff, E.; Kalogirou, S. Geographical Random Forests: A Spatial Extension of the Random Forest Algorithm to Address Spatial Heterogeneity in Remote Sensing and Population Modelling. Geocarto. Int. 2021, 36, 121–136. [Google Scholar] [CrossRef] [Green Version]
- Zamani Joharestani, M.; Cao, C.; Ni, X.; Bashir, B.; Talebiesfandarani, S. PM2. 5 prediction based on random forest, XGBoost, and deep learning using multisource remote sensing data. Atmosphere 2019, 10, 373. [Google Scholar] [CrossRef] [Green Version]
- Kim, C.K.; Jeong, S.Y.; Kwon, S.D.; Kim, W.K. A Study on the Possibility for the Introduction of Forest Land Reverse Mortgage System. J. KIFR 2014, 18, 39–47. [Google Scholar]
- Park, I.S.; Kim, E.J.; Hong, S.O.; Kang, S.H. A Study on Factors Related with Regional Occurrence of Cardiac Arrest Using Geographically Weighted Regression. Health Soc. Welf. Rev. 2013, 33, 237–257. [Google Scholar]
- Sung, J.H.; Chae, G.S. Analysis of Economic Impact in Drought: Focusing on Rice production. JRD 2018, 41, 1–23. [Google Scholar]
- Lee, C.W.; Yoo, D.G. Evaluation of Drought Resilience Reflecting Regional Characteristics: Focused on 160 Local Governments in Korea. Water 2021, 13, 1873. [Google Scholar] [CrossRef]
- Korea Forest Service. Forest Basic Statistics; Korea Forest Service: Daejeon, Korea, 2005.
- Korea Forest Service. Forest Basic Statistics; Korea Forest Service: Daejeon, Korea, 2015.
- Lee, S.J.; Yim, J.S.; Son, Y.M.; Kim, R.H. Recalculation of Forest Growing Stock for National Greenhouse Gas Inventory. J. Climate. Change. Res. 2016, 7, 485–492. [Google Scholar] [CrossRef]
- Park, J.M.; Lee, J.S.; Lee, H.S.; Park, J.W. Study on Timber Yield Regulation Method using Probability Density Function. J. Korean Soc. For. Sci. 2020, 109, 504–511. [Google Scholar]
- Ministry of Land, Infrastructure and Transport. Cadastral Statistic Annual Report; Ministry of Land, Infrastructure and Transport: Sejong, Korea, 2005.
- Ministry of Land, Infrastructure and Transport. Cadastral Statistic Annual Report; Ministry of Land, Infrastructure and Transport: Sejong, Korea, 2015.
- Statistics Korea. Agricultural Area Survey; Statistics Korea: Daejeon, Korea, 2005.
- Statistics Korea. Agricultural Area Survey; Statistics Korea: Daejeon, Korea, 2015.
- Statistics Korea. Agriculture, Forestry and Fishery Survey; Statistics Korea: Daejeon, Korea, 2005.
- Statistics Korea. Agriculture, Forestry and Fishery Survey; Statistics Korea: Daejeon, Korea, 2015.
- Ministry of Employment and Labor. Survey of Establishments; Ministry of Employment and Labor: Sejong, Korea, 2005.
- Ministry of Employment and Labor. Survey of Establishments; Ministry of Employment and Labor: Sejong, Korea, 2015.
- Park, E.B.; Song, C.H.; Ham, B.Y.; Kim, J.W.; Lee, J.Y.; Choi, S.E.; Lee, W.K. Comparison of Sampling and Wall-to-Wall Methodologies for Reporting the GHG Inventory of the LULUCF Sector in Korea. J. Climate Change Res. 2018, 9, 385–398. [Google Scholar] [CrossRef]
- Lee, H.M.; Goh, J.T. Factors Influencing Cultivated Area Decisions of the Rural Area in the Fringe of Small and Medium Sizes City. J. Korean Soc. Rural Plann. 2015, 21, 1–10. [Google Scholar] [CrossRef]
- Sim, S.Y.; Lee, K.W.; Kim, M.G.; Park, J.Y. The Case of Utilization on Regional Agricultural Statistics information. Korea Rural Econ. Inst. 2019, 1–151. [Google Scholar]
- Lee, J.M. Analysis of the Status of Agricultural Communities and Location Quotient (LQ) using Regional Survey Data in 2015 Census of Agriculture, Forestry, and Fisheries. J. Korean Soc. Rural Plan. 2020, 26, 83–93. [Google Scholar] [CrossRef]
- Kim, S.Y.; Park, H.; Koo, H.M.; Ryoo, D.K. The Effects of the Port Logistics Industry on Port City’s Economy. J. Navig. Port. Res. 2015, 39, 267–275. [Google Scholar] [CrossRef] [Green Version]
- Lee, Y.G.; Jung, C.G.; Kim, W.J.; Kim, S.J. Analysis of National Stream Drying Phenomena using DrySAT-WFT Model: Focusing on Inflow of Dam and Weir Watersheds in 5 River Basins. J. KAGIS 2020, 23, 53–69. [Google Scholar]
- Dai, W.; Li, Y.; Fu, W.; Jiang, P.; Zhao, K.; Li, Y.; Penttinen, P. Spatial Variability of Soil nutrients in Forest Areas: A Case Study from Subtropical China. J. Plant. Nutr. Soil. Sci. 2018, 181, 827–835. [Google Scholar] [CrossRef]
- Pan, P.; Sun, Y.; Ouyang, X.; Zang, H.; Rao, J.; Ning, J. Factors Affecting Spatial Variation in Vegetation Carbon Density in Pinus massoniana Lamb. Forest in Subtropical China. Forests 2019, 10, 880. [Google Scholar] [CrossRef] [Green Version]
- Ma, W.; Chen, J.; Chen, P. Illegal Activities Hotspot Analysis Based on GIS methods. In Proceedings of the 2nd IEEE International Conference on Emergency Management and Management Sciences, Beijing, China, 8–10 August 2011; Institute of Electrical and Electronics Engineers: Piscataway, NJ, USA, 2011; pp. 270–273. [Google Scholar]
- Sánchez-Martín, J.M.; Rengifo-Gallego, J.I.; Blas-Morato, R. Hot Spot Analysis Versus Cluster and Outlier Analysis: An Enquiry into the Grouping of Rural Accommodation in Extremadura (Spain). ISPRS Int. J. GeoInf. 2019, 8, 176. [Google Scholar] [CrossRef] [Green Version]
- Islam, A.; Sayeed, M.A.; Rahman, M.K.; Ferdous, J.; Islam, S.; Hassan, M.M. Geospatial Dynamics of COVID-19 Clusters and Hospots in Bangladesh. Transbound Emerg. Dis. 2021, 68, 3643–3657. [Google Scholar] [CrossRef] [PubMed]
- Kim, S.M.; Choi, Y. Assessment of Lead (Pb) and Zinc (Zn) Contamination in Beach Sands by Hot Spot Analysis. J. Coast. Res. 2019, 91, 321–325. [Google Scholar] [CrossRef]
- Zhang, C.; Luo, L.; Xu, W.; Ledwith, V. Use of Local Moran’s I and GIS to Identify Pollution Hotspots of Pb in Urban Soils of Galway, Ireland. Sci. Total. Environ. 2008, 398, 212–221. [Google Scholar] [CrossRef]
- Dilig, I.J.A.; San Juan, W.I.M. Geostatistical and Cluster Analysis of Earthquakes in the Philippines. Int. Arch. Photogramm. Remote. Sens. Spat. Inf. Sci. 2019, 42, 185–192. [Google Scholar] [CrossRef] [Green Version]
- Mena, C.F.; Bilsborrow, R.E.; McClain, M.E. Socioeconomic Drivers of Deforestation in the Northern Ecuadorian Amazon. Environ. Manag. 2006, 37, 802–815. [Google Scholar] [CrossRef]
- Ngwira, S.; Watanabe, T. An Analysis of the Causes of Deforestation in Malawi: A Case of Mwazisi. Land 2019, 8, 48. [Google Scholar] [CrossRef] [Green Version]
- Walker, N.F.; Patel, S.A.; Kalif, K.A. From Amazon Pasture to the High Street: Deforestation and the Brazilian Cattle Product Supply Chain. Trop. Conserv. Sci. 2013, 6, 446–467. [Google Scholar] [CrossRef] [Green Version]
- Jayathilake, H.M.; Prescott, G.W.; Carrasco, L.R.; Rao, M.; Symes, W.S. Drivers of Deforestation and Degradation for 28 tropical Conservation Landscapes. AMBIO 2021, 50, 215–228. [Google Scholar] [CrossRef] [PubMed]
- Godoy, R.; Franks, J.R.; Wilkie, D.; Alvarado, M.; Gray-Molina, G.; Roca, R.; Escóbar, J.; Cardenas, M. The Effects of Economic Development on Neotropical Deforestation: Household and Village evidence from Amerindians in Bolivia; Development Discussion Papers; Harvard Institute for International Development: Cambridge, MA, USA, 1996. [Google Scholar]
- Biswas, S.; Swanson, M.E.; Vacik, H. Natural Resources Depletion in Hill Areas of Bangladesh: A Review. J. Math. Sci. 2012, 9, 147–156. [Google Scholar] [CrossRef]
- Lata, K.; Misra, A.K.; Shukla, J.B. Modeling the Effect of Deforestation Caused by Human Population Pressure on Wildlife Species. Nonlinear. Anal. Modell. Control. 2018, 23, 303–320. [Google Scholar] [CrossRef]
- Fisher, A.G. Clash of Progress and Security; Macmillan and Co. Ltd.: London, UK, 1935. [Google Scholar]
- Freund, R.J.; Wilson, W.J.; Sa, P. Regression: Analysis; Elsevier: Amsterdam, The Netherlands, 2006. [Google Scholar]
- Tu, J. Spatial Variations in the Relationships Between Land Use and Water Quality across an Urbanization Gradient in the Watersheds of Northern Georgia, USA. Environ. Manag. 2013, 51, 1–17. [Google Scholar] [CrossRef]
- Foody, G.M. Geographical Weighting as a Further Refinement to Regression Modelling: An Example Focused on the NDVI–Rainfall Relationship. Remote Sens. Environ. 2003, 88, 283–293. [Google Scholar] [CrossRef]
- Xie, W.; Yi, S.; Leng, C.A. Study to Compare Three Different Spatial Downscaling Algorithms of Annual TRMM 3B43 Precipitation. In Proceedings of the 26th International. Conference on Geoinformatics, Kunming, China, 28–30 June 2018; Institute of Electrical and Electronics Engineers: Piscataway, NJ, USA, 2018; pp. 1–6. [Google Scholar]
- Wang, Q.; Ni, J.; Tenhunen, J. Application of a Geographically-weighted Regression Analysis to Estimate Net Primary Production of Chinese Forest Ecosystems. Glob. Ecol. Biogeogr. 2005, 14, 379–393. [Google Scholar] [CrossRef]
- Wang, J.; Wang, S.; Li, S. Examining the Spatially Varying Effects of Factors on PM2. 5 Concentrations in Chinese Cities using Geographically Weighted Regression Modeling. Environ. Pollut. 2019, 248, 792–803. [Google Scholar] [CrossRef]
- Kumari, M.; Singh, C.K.; Bakimchandra, O.; Basistha, A. Geographically Weighted Regression Based Quantification of Rainfall–Topography Relationship and Rainfall Gradient in Central Himalayas. Int. J. Climatol. 2017, 37, 1299–1309. [Google Scholar] [CrossRef]
- Tu, J.; Xia, Z.G. Examining spatially varying relationships between land use and water quality using geographically weighted regression I: Model design and evaluation. Sci. Total. Environ. 2008, 407, 358–378. [Google Scholar] [CrossRef] [PubMed]
- Shah, S.H.; Angel, Y.; Houborg, R.; Ali, S.; McCabe, M.F. A Random Forest Machine Learning Approach for the Retrieval of Leaf Chlorophyll Content in Wheat. Remote. Sens. 2019, 11, 920. [Google Scholar] [CrossRef] [Green Version]
- Abdulkareem, N.M.; Abdulazeez, A.M. Machine Learning Classification Based on Radom Forest Algorithm: A Review. Int. J. Sci. Bus. 2021, 5, 128–142. [Google Scholar]
- Bunn, C.; Talsma, T.; Läderach, P.; Castro, F. Climate Change Impacts on Indonesian Cocoa Areas. In Cocoa Climate Suitability Indonesia 2017 CIAT 50 and Mondelez International. Available online: https://www.cocoalife.org/progress/climate-change-impacts-on-indonesian-cocoa-areas-report (accessed on 3 November 2021).
- Liu, Y.; Wu, H. Prediction of Road Traffic Congestion Based on Random Forest. In Proceedings of the 10th International Symposium on Computational Intelligence and Design (ISCID), Hangzhou, China, 9–10 December 2017; Institute of Electrical and Electronics Engineers: Piscataway, NJ, USA, 2017; Volume 2, pp. 361–364. [Google Scholar]
- Krishnamurthy, N.; Maddali, S.; Hawk, J.A.; Romanov, V.N. 9Cr steel visualization and predictive modeling. Comput. Mater. Sci. 2019, 168, 268–279. [Google Scholar] [CrossRef]
- Song, X.; Long, Y.; Zhang, L.; Rossiter, D.G.; Liu, F.; Jiang, W. Spatial Accuracy Evaluation for Mobile Phone Location Data with Consideration of Geographical Context. IEEE Access. 2020, 8, 221176–221190. [Google Scholar] [CrossRef]
- Koh, E.H.; Lee, E.; Lee, K.K. Application of Geographically Weighted Regression Models to Predict Spatial Characteristics of Nitrate Contamination: Implications for an Effective Groundwater Management Strategy. J. Environ. Manag. 2020, 268, 110646. [Google Scholar] [CrossRef]
- Chen, F.W.; Liu, C.W. Estimation of the Spatial Rainfall Distribution using Inverse Distance Weighting (IDW) in the Middle of Taiwan. Paddy Water Environ. 2012, 10, 209–222. [Google Scholar] [CrossRef]
- Willmott, C.J. Some Comments on the Evaluation of Model Performance. Bull. Am. Meteor. Soc. 1982, 63, 1309–1313. [Google Scholar] [CrossRef] [Green Version]
- Khodadoust Siuki, S.; Saghafian, B.; Moazami, S. Comprehensive Evaluation of 3-hourly TRMM and Half-hourly GPM-IMERG Satellite Precipitation Products. Int. J. Remote Sens. 2017, 38, 558–571. [Google Scholar] [CrossRef]
- Burnham, K.P.; Anderson, D.R. Multimodel Inference: Understanding AIC and BIC in Model Selection. Soc. Methods Res. 2004, 33, 261–304. [Google Scholar] [CrossRef]
- Nashwari, I.P.; Rustiadi, E.; Siregar, H.; Juanda, B. Geographically Weighted Regression Model for Poverty Analysis in Jambi Province. Indones. J. Geogr. 2017, 49, 42. [Google Scholar] [CrossRef]
- Meng, D.; Xi, Z.; Zhao, J. Analysis on the Impacting Factors of Hand, Foot and Mouth Disease Incidence Using Random Forest. In Proceedings of the 10th Data Driven Control and Learning Systems Conference (DDCLS), Suzhou, China, 14–16 May 2021; Institute of Electrical and Electronics Engineers: Piscataway, NJ, USA, 2021. [Google Scholar]
- Park, S.; Choi, G.Y. Urban Sprawl in the Seoul Metropolitan Region, Korea Since the 1980s Observed in Satellite Imagery. JAKG 2016, 5, 331–343. [Google Scholar] [CrossRef]
- Zhou, W.; Zhang, S.; Yu, W.; Wang, J.; Wang, W. Effects of urban expansion on forest loss and fragmentation in six megaregions, China. Remote Sens. 2017, 9, 991. [Google Scholar] [CrossRef] [Green Version]
- Kim, S.H. The Analysis of Influence Factors on Vitalization of Large Scale Development Projects in Seoul Metropolitan Area. Korea Real Estate Acad. 2013, 55, 145–155. [Google Scholar]
- Jaimes, N.B.P.; Sendra, J.B.; Delgado, M.G.; Plata, R.F. Exploring the driving forces behind deforestation in the state of Mexico (Mexico) using geographically weighted regression. Appl. Geogr. 2010, 30, 576–591. [Google Scholar] [CrossRef]
- Mas, J.F.; Cuevas, G. Identifying Local Deforestation Patterns Using Geographically Weighted Regression Models. In Proceedings of the International Conference on Geographical Information Systems Theory, Applications and Management, Barcelona, Spain, 28–30 April 2015; SCITEPRESS—Science and Technology Publications: Setubal, Portugal, 2015; pp. 36–49. [Google Scholar]
- Kim, Y.H.; Jeong, G.O.; Kim, S.G. Comparison of Transport Infrastructure and Its Utilization Features in between Korean and Foreign Cities. KOTI 2013, 1, 1–158. [Google Scholar]
- Choi, E.Y. Analysis of the Changes in Rural Villages in Chungnam Province based on GIS(2005~2010); ChungNam Institute: Gongju-si, Korea, 2014; Volume 21, pp. 1–157. [Google Scholar]
- Yeo, C.H.; Kim, D.C.; Pyo, K.J. An Analysis of GRDP Growth Factors and Spatial Locational Characteristics of Growth-Leading Industries in Chungcheongnam-Do. Chungcheong Reg. Stud. 2009, 2, 25–42. [Google Scholar]
- Mo, S.W.; Lee, K.B. Industrial Competitiveness of Gwangju and Jeonnam. J. Ind. Econ. Bus. 2017, 30, 445–460. [Google Scholar] [CrossRef]
- Keleş, S.; Sivrikaya, F.; Çakir, G.; Köse, S. Urbanization and forest cover change in regional directorate of Trabzon forestry from 1975 to 2000 using landsat data. Environ. Monit. Assess. 2008, 140, 1–14. [Google Scholar] [CrossRef] [PubMed]
- Wakeel, A.; Rao, K.S.; Maikhuri, R.K.; Saxena, K.G. Forest management and land use/cover changes in a typical micro watershed in the mid elevation zone of Central Himalaya, India. For. Ecol. Manag. 2005, 213, 229–242. [Google Scholar] [CrossRef]
- Baehr, C.; BenYishay, A.; Parks, B. Linking Local Infrastructure Development and Deforestation: Evidence from Satellite and Administrative Data. J. Assoc. Environ. Resour. Econ. 2021, 8, 375–409. [Google Scholar] [CrossRef]
- BenYishay, A.; Parks, B.; Runfola, D.; Trichler, R. Forest cover impacts of Chinese development projects in ecologically sensitive areas. In Proceedings of the SAIS CARI 2016 Conference, Washington, DC, USA, 13–14 October 2016; China Africa Research Initiative: Washington, DC, USA, 2016; pp. 13–14. [Google Scholar]
- Chen, X.; Li, F.; Li, X.; Hu, Y.; Hu, P. Quantifying the Compound Factors of Forest Land Changes in the Pearl River Delta, China. Remote Sens. 2021, 13, 1911. [Google Scholar] [CrossRef]
- Tejaswe, G. Mannual on Deforestation, Degradation, and Fragmentation Using Remote Sensing and GIS. Strengthening Monitoring, Assessment and Reporting on Sustainable Forest Management in Asia (GCP/INT/988/JPN); MAR-SFM Working Paper 5; Food and Agriculture Organization: Rome, Italy, 2007. [Google Scholar]
- Angelsen, A. Policies for reduced deforestation and their impact on agricultural production. Proc. Natl. Acad. Sci. USA 2010, 107, 19639–19644. [Google Scholar] [CrossRef] [Green Version]
- Yang, R.; Luo, Y.; Yang, K.; Hong, L.; Zhou, X. Analysis of forest deforestation and its driving factors in Myanmar from 1988 to 2017. Sustainability 2019, 11, 3047. [Google Scholar] [CrossRef] [Green Version]
- Lim, C.L.; Prescott, G.W.; De Alban, J.D.T.; Ziegler, A.D.; Webb, E.L. Untangling the proximate causes and underlying drivers of deforestation and forest degradation in Myanmar. Conserv. Lett. 2017, 31, 1362–1372. [Google Scholar] [CrossRef] [PubMed] [Green Version]
- Xu, X.; Jain, A.K.; Calvin, K.V. Quantifying the biophysical and socioeconomic drivers of changes in forest and agricultural land in South and Southeast Asia. Glob. Chang. Biol. 2019, 25, 2137–2151. [Google Scholar] [CrossRef]
- Li, M.; Mao, L.; Zhou, C.; Vogelmann, J.E.; Zhu, Z. Comparing Forest fragmentation and its drivers in China and the USA with Globcover v2. 2. J. Environ. Manag. 2010, 91, 2572–2580. [Google Scholar] [CrossRef]
- Mwangi, N.; Waithaka, H.; Mundia, C.; Kinyanjui, M.; Mutua, F. Assessment of drivers of forest changes using multi-temporal analysis and boosted regression trees model: A case study of Nyeri County, Central Region of Kenya. Model Earth Syst. Environ. 2020, 6, 1657–1670. [Google Scholar] [CrossRef]
- Dos Santos, A.M.; da Silva, C.F.A.; de Almeida Junior, P.M.; Rudke, A.P.; de Melo, S.N. Deforestation drivers in the Brazilian Amazon: Assessing new spatial predictors. J. Environ. Manag. 2021, 294, 113020. [Google Scholar] [CrossRef]
- Armenteras, D.; Espelta, J.M.; Rodríguez, N.; Retana, J. Deforestation dynamics and drivers in different forest types in Latin America: Three decades of studies (1980–2010). Glob. Environ. Change 2017, 46, 139–147. [Google Scholar] [CrossRef]
- Lambin, E.F.; Geist, H.J.; Lepers, E. Dynamics of land-use and land-cover change in tropical regions. Annu. Rev. Environ. Resour. 2003, 28, 205–241. [Google Scholar] [CrossRef] [Green Version]
- Cai, J.; Huang, B.; Song, Y. Using Multi-source Geospatial Big Data to Identify the Structure of Polycentric Cities. Remote Sens. Environ. 2017, 202, 210–221. [Google Scholar] [CrossRef]
- Li, F.; Zhou, T.; Lan, F. Relationships Between Urban Form and Air Quality at Different Spatial Scales: A Case Study from Northern China. Ecol. Indic. 2021, 121, 107029. [Google Scholar] [CrossRef]
- Park, J.Y.; Lee, Y.J.; Lee, W.S.; Lee, B.K. Status of Photovoltaic Power Plant Installation Projects Proceeded through EIA and its Environmental Discussion. Korea Environ. Inst. 2018, 5, 1–78. [Google Scholar]
- Choi, J.S.; Kwak, D.A.; Kwon, S.D.; Baek, S.A. Study on Applicability of Slope Types to Permission Standard for Forestland Use Conversion. J. KAGIS 2018, 21, 145–157. [Google Scholar]
- Mori, K.; Tabata, T. Comprehensive Evaluation of Photovoltaic Solar Plants vs. Natural Ecosystems in Green Conflict Situations. Energies 2020, 13, 6224. [Google Scholar] [CrossRef]
- Liu, Y.; Feng, Y.; Zhao, Z.; Zhang, Q.; Su, S. Socioeconomic drivers of forest loss and fragmentation: A comparison between different land use planning schemes and policy implications. Land Use Policy. 2016, 54, 58–68. [Google Scholar] [CrossRef]


| Spatial Region | Seoul–Incheon–Gyeonggi Region | Gangwon Region | Busan– Ulsan– Gyeongnam Region | Daegu Gyeongbuk Region | Gwangju– Jeonnam Region | Jeonbuk Region | Daejeon– Chungnam Region | Chungbuk Region |
|---|---|---|---|---|---|---|---|---|
| Spatial area (n) | 32 | 15 | 20 | 22 | 22 | 14 | 16 | 11 |
| Forest rate (%) | 46 | 81 | 65 | 69 | 54 | 51 | 51 | 64 |
| Category | Data | Institution | Year of Data Collection | Detailed Data |
|---|---|---|---|---|
| Census Data | Forest Basic Statistics | Korea Forest Service (KFS) | 2005, 2015 | Forested area, accumulation of standing |
| Cadastral Statistics Chronology | Ministry of Land, Infrastructure and Transport (MOLIT) | 28 land categories, including Forestry, Dry paddy-field, Paddy-field, and Building site | ||
| Agricultural Area Survey | Statistics Korea (KOSTAT) | Current status of agricultural land | ||
| Agriculture, Forestry and Fishery Survey | Number of household members, and farms | |||
| Survey of Establishments | Ministry of Employment and Labor (MOEL) | Size, distribution of industry, industry type, | ||
| Spatial Data | Road network map | MOLIT | Spatial data | |
| Railway network map |
| Factor | Description | Unit | Data Source |
|---|---|---|---|
| Road density (Rd) | Forest loss is caused by the increased accessibility due to high road density | m/ha | Mena et al., 2006 [68] |
| Cropland area (Ca) | Forest loss is caused by the expansion of farms leading to increase in population and poverty | % | Ngwira and Watanbe, 2019 [69] |
| Grassland area (Ga) | Forest loss is caused by the expansion of industry to meet the increased demand for livestock animals | Walker et al., 2013 [70] | |
| Settlement area (Sa) | Forest loss is caused by the settlement and construction of infrastructure | Jayathilake et al., 2020 [71] | |
| Number of households (Nh) | Forest loss is caused by increase in number of households leading to expansion of croplands | n | Godoy et al., 1997 [72] |
| Population (P) | Forest loss is caused by increase in population leading to increased demand for food and housing | n | Biswas et al., 2012 [73] |
| Primary industry number of Employees (Pm) | Forest loss is caused by industrialization and subsequent population pressure | n | Lata et al., 2018 [74] |
| Primary industry Establishments (Pe) | |||
| Secondary industry number of Employees (Sm) | |||
| Secondary industry number of Establishments (Se) | |||
| Tertiary industry Employees (Tm) | |||
| Tertiary industry Establishments (Te) |
| Hyperparameter | Value |
|---|---|
| n_estimators | 100 |
| Max_depth | None |
| Min_sample_split | 2 |
| Min_samples_leaf | 1 |
| Category | Minimum Forest Loss Rate | Mean Forest Loss Rate | Maximum Forest Loss Rate | Standard Deviation |
|---|---|---|---|---|
| Seoul–Incheon–Gyeonggi region | 0.1% | 3.3% | 14.4% | 3.3% |
| Gangwon region | 0.2% | 0.6% | 1.5% | 0.4% |
| Busan–Ulsan–Gyeongnam region | 0.2% | 1.1% | 2.6% | 0.8% |
| Daegu–Gyeongbuk region | 0.1% | 0.8% | 2.8% | 0.6% |
| Gwangju–Jeonnam region | 0.1% | 1.6% | 7.7% | 1.9% |
| Jeonbuk region | 0.3% | 1.7% | 3.8% | 1.0% |
| Daejeon–Chungnam region | 0.3% | 2.7% | 8.1% | 2.0% |
| Chungbuk region | 0.1% | 1.5% | 5.3% | 1.5% |
| Category | Rd | Ca | Ga | Sa | P | Nh | Pm | Pe | Sm | Se | Tm | Te | VIF |
|---|---|---|---|---|---|---|---|---|---|---|---|---|---|
| Rd | 1 | - | - | - | - | - | - | 1.3 | |||||
| Ca | −0.312 ** | 1 | - | - | - | - | - | - | - | - | - | - | 1.5 |
| Ga | −0.059 | 0.143 | 1 | - | - | - | - | - | - | - | - | - | 1.0 |
| Sa | 0.047 | 0.145 | −0.044 | 1 | - | - | - | - | - | - | - | - | 1.6 |
| P | 0.333 ** | −0.267 ** | −0.166 * | 0.448 ** | 1 | - | - | - | - | - | - | - | 28.7 |
| Nh | 0.347 ** | −0.328 ** | −0.168 * | 0.455 ** | 0.976 ** | 1 | - | - | - | - | - | - | 26.5 |
| Pm | −0.039 | 0.093 | 0.025 | 0.089 | 0.011 | −0.012 | 1 | - | - | - | - | - | 3.1 |
| Pe | −0.121 | 0.174 | 0.025 | 0.097 | −0.036 | −0.067 | 0.812 ** | 1 | - | - | - | - | 3.2 |
| Sm | −0.033 | 0.138 | −0.033 | 0.340 ** | 0.206 * | 0.177 * | 0.058 | 0.049 | 1 | - | - | - | 1.8 |
| Se | −0.171 * | 0.186 * | −0.011 | 0.246 ** | 0.186 * | 0.153 | 0.092 | 0.176 * | 0.624 ** | 1 | - | - | 2.0 |
| Tm | 0.340 ** | −0.183 * | −0.171* | 0.373 ** | 0.811 ** | 0.769 ** | 0.049 | −0.032 | 0.245 ** | 0.292 ** | 1 | - | 6.7 |
| Te | 0.351 ** | −0.288 ** | −0.197* | 0.321 ** | 0.855 ** | 0.830 ** | 0.050 | −0.036 | 0.243 ** | 0.278 ** | 0.910 ** | 1 | 8.6 |
| Model | R2 | RMSE | MAE | AICc |
|---|---|---|---|---|
| OLS | 0.48 | 1.54 | 1.05 | 591.4 |
| GWR | 0.69 | 1.17 | 0.85 | 543.9 |
| RF | 0.69 | 1.17 | 0.88 | - |
| OLS Model | GWR Model | RF Model | |
|---|---|---|---|
| Rd | 0.016 | 0.0400 | 0.278 |
| Ca | 0.009 | 0.0245 | 0.012 |
| Ga | 0.019 | 0.0009 | 0.025 |
| Sa | 0.008 | −0.0013 | 0.057 |
| Nh | 0.033 | 0.0253 | 0.258 |
| Pm | −0.000 | −0.0002 | 0.020 |
| Pe | −0.000 | −0.0009 | 0.039 |
| Sm | 0.000 | 0.0056 | 0.022 |
| Se | −0.001 | −0.0042 | 0.046 |
| Tm | 0.000 | 0.0008 | 0.097 |
| Te | 0.023 | 0.0167 | 0.141 |
Publisher’s Note: MDPI stays neutral with regard to jurisdictional claims in published maps and institutional affiliations. |
© 2021 by the authors. Licensee MDPI, Basel, Switzerland. This article is an open access article distributed under the terms and conditions of the Creative Commons Attribution (CC BY) license (https://creativecommons.org/licenses/by/4.0/).
Share and Cite
Park, J.; Lim, B.; Lee, J. Analysis of Factors Influencing Forest Loss in South Korea: Statistical Models and Machine-Learning Model. Forests 2021, 12, 1636. https://doi.org/10.3390/f12121636
Park J, Lim B, Lee J. Analysis of Factors Influencing Forest Loss in South Korea: Statistical Models and Machine-Learning Model. Forests. 2021; 12(12):1636. https://doi.org/10.3390/f12121636
Chicago/Turabian StylePark, Jeongmook, Byeoungmin Lim, and Jungsoo Lee. 2021. "Analysis of Factors Influencing Forest Loss in South Korea: Statistical Models and Machine-Learning Model" Forests 12, no. 12: 1636. https://doi.org/10.3390/f12121636
APA StylePark, J., Lim, B., & Lee, J. (2021). Analysis of Factors Influencing Forest Loss in South Korea: Statistical Models and Machine-Learning Model. Forests, 12(12), 1636. https://doi.org/10.3390/f12121636