Article

Residents’ Spatial Image Perception of Urban Green Space through Cognitive Mapping: The Case of Beijing, China

1
School of Economics and Management, Beijing Forestry University, Beijing 100083, China
2
College of Tourism, Shanghai Normal University, Shanghai 200234, China
3
School of Economics and Management, South China Agricultural University, Guangzhou 510642, China
*
Author to whom correspondence should be addressed.
Forests 2021, 12(12), 1614; https://doi.org/10.3390/f12121614
Submission received: 12 September 2021 / Revised: 11 November 2021 / Accepted: 20 November 2021 / Published: 23 November 2021
(This article belongs to the Section Urban Forestry)

Abstract

:
The fundamental purpose of future urban development is to meet residents’ yearning for a better city life with the rapid development of urbanization. This study uses a multinomial logit model and cognitive map to evaluate residents’ spatial image perception of urban green space. A field study and data collection were conducted from July to August 2019, using the typical urban green space area in Beijing as the research object. Based on 375 valid questionnaires and 139 cognitive maps, the study analyzed and evaluated the image characteristics and differences of residents to the urban green space under different conditions. The results show the following. First, there is a close relationship between residents’ preference and the characteristics of urban green spaces, especially the working and living environment and characteristics will have a great influence on it. Second, the cognitive map drawn by Beijing residents can be divided into sequential and spatial cognitive maps, and the image perception shows diversified characteristics. However, the perception is relatively superficial overall, and most are simple line maps. Besides, according to the analysis of the elements of the cognitive map, the advantages and disadvantages of each type of urban green space are closely related to their geographical location and internal structure. This study has two key findings. First, the construction of urban green spaces in various cities should be carried out according to local conditions, considering the scientific basis and reasonableness of urban green space in terms of structural setting. Second, the multinomial logit model and cognitive map can effectively quantify the subjective evaluation of respondents’ spatial perceptions in a relatively simple manner, which can be further expanded in the application system design of the method.

1. Introduction

With the continuous development of cities, the degree of human intervention in the natural environment is increasing, and rapid urbanization has brought huge ecological problems to cities. In particular, various urban environmental problems have continued to emerge in recent years, and many cities have faced problems such as restrictive pressure on green space and destruction of the natural environment. For a large city like Beijing, building a greener environment and improving the functions of the urban ecosystem and the quality of urban life are essential to the sustainable development of the city [1,2].
The modern concept of urban open space appeared in the Metropolitan Open Space Act, enacted by the United Kingdom in 1877. Urban green space (UGS) is a central part of urban ecosystems [3], which is a special form of open space and plays an important role in regulating and optimizing urban functions, space, and structure. In particular, urban green space has a major ecological function, plays a key role in the coordinated development of urban people and nature, and has received increasing attention in recent years. Many studies show that urban green space type is an important factor affecting people’s well-being and health, and it should be considered in urban planning [4,5]. For example, research has shown that urban streets, parkland, and other types of green space have different effects on people’s emotions [6]. The scale and size of urban green space also affect people’s health [7].
In Beijing, the construction of urban green spaces mainly relies on parks, green spaces, green roads, as well as squares, trails, and various activity areas. Together, these constitute an urban green space with functions such as ecological protection, health and leisure, and resource utilization. The above facts show that urban green spaces are not isolated. Planners must not only place them in an open system but also fully consider the changes in the city’s environment, the ecological stability of the surrounding areas, and the relationship between urban development and residents’ lives [8]. Existing research has reported in-depth on public open space types and the classification of land use for green space system planning, the scope of related research basically covers the entire content of urban green space, it provides a good basis for the work of this research plan.
However, currently, the relationship between people and land in many cities is still showing conflicts. The root cause is the deterioration of the environment caused by the attenuation of the urban green space function [9]. Moreover, as urban residents have different basic needs for urban green spaces, they also have different perceptions and preferences for them. Simultaneously, with the continuous development of cities, the planning and design related to urban green spaces are constantly adapting to the changing needs of residents. Therefore, when discussing the development of urban green spaces, personal-level analysis needs to be considered. In general, the analysis of residents’ perceptions and preferences of urban green spaces and the corresponding influencing factors will have important significance in research and practice.
Moreover, as a rising developing country and after years of rapid urbanization, China’s large cities are facing the enormous pressure of severe population growth, resource reduction, and environmental degradation. The corresponding urban ecological initiatives are often affected by current social and economic conditions. However, despite many obstacles, with the improvement of the quality of urban life, residents’ awareness of urban green spaces is also deepening. Their understanding of urban green spaces has gradually changed from traditional aesthetics and practical functions to psychological and emotional satisfaction. Therefore, objective statistical model analysis can no longer fully explain the complexity of issues related to contemporary urban green spaces. Currently, the research objects of urban green space have gradually included concepts such as ‘perceptual space’ and ‘image map’ [10]. Cognitive mapping methods based on spatial cognition theory have also been widely used in decision-making processes related to spatial behavior and city planning, which significantly expands the research scope of subjective wishes of micro-subjects [11,12,13]. Simultaneously, some studies tend to take the vegetation landscape as a whole view to evaluate the regional landscape space and have drawn a series of important conclusions. For example, the relationship between the degree of surface exposure of the site space and its landscape attractiveness is strongly negative. Related to this, the public prefers urban landscapes with extensive vegetation, and individuals have different preferences for green plants in different types of landscapes [14].
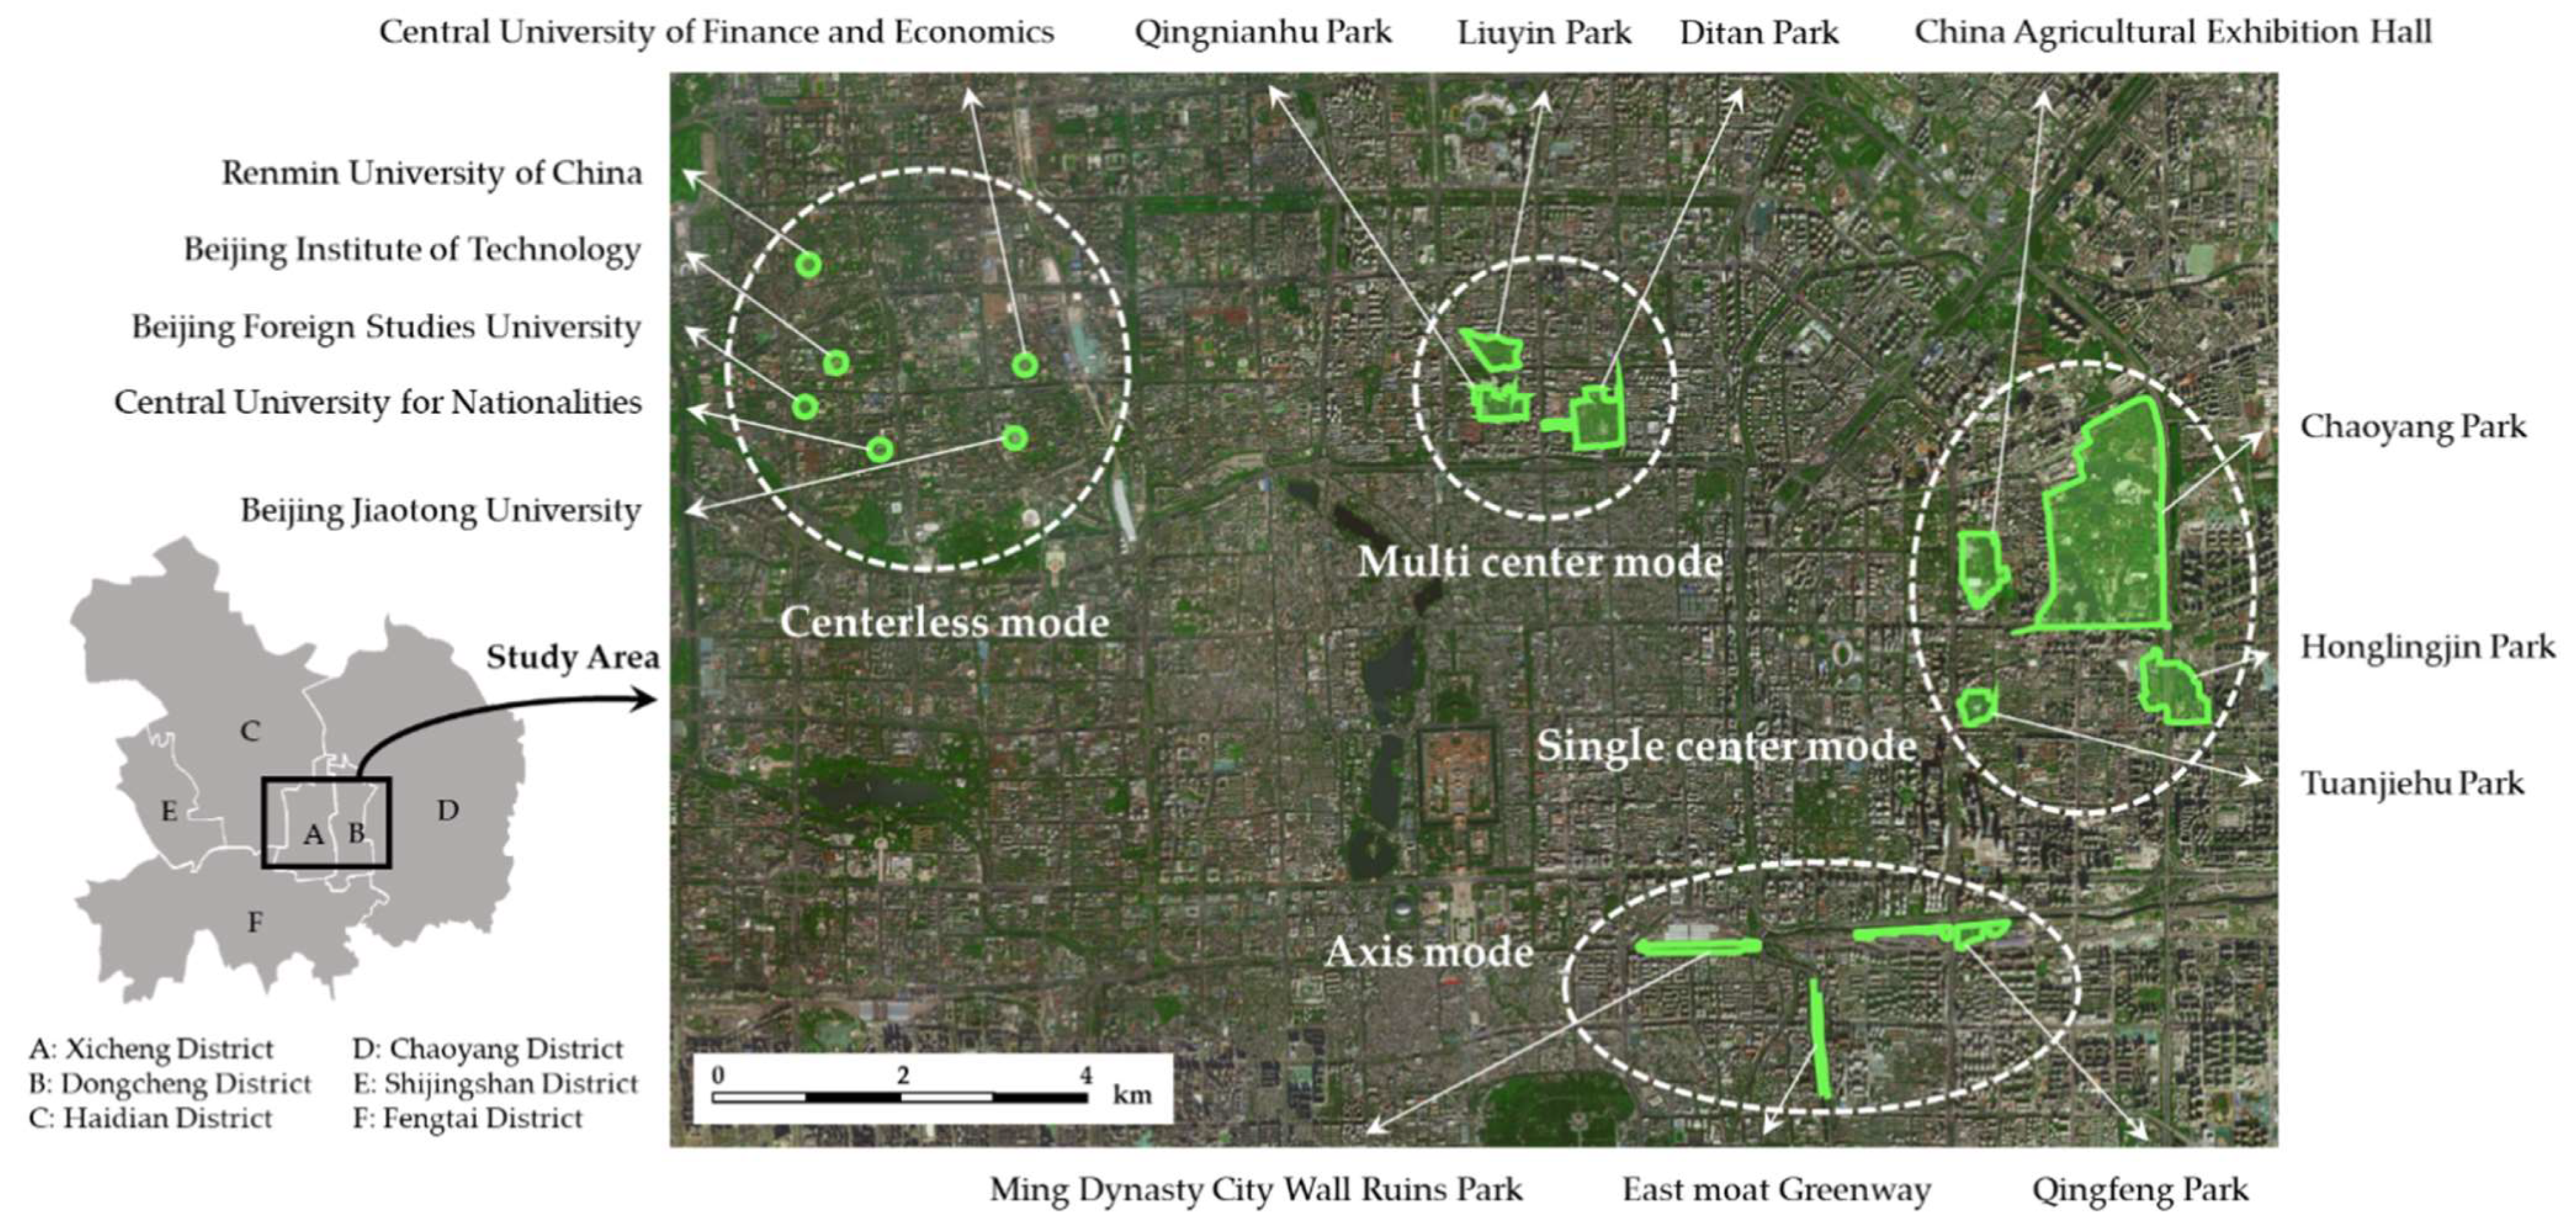
Based on existing research results, the purpose of this study is to analyze and evaluate the image characteristics and differences of residents to the urban green space under different conditions. We took four typical urban green spaces in Beijing as the research area and conducted field surveys and data collection from July to September 2020 with many rounds. Based on the obtained 375 valid questionnaires and 139 effective cognitive maps, we conducted a comprehensive analysis and evaluation of the image characteristics and differences of residents to the urban green space under different conditions.

2. Research Design

2.1. Experiment and Procedure

Previous research has different discussions on the scope of urban green space. However, the basic perspective is the same: any area covered by vegetation in and around the city, including forests, parks, community green spaces, wetlands, green roofs, and urban farmland, and other natural or semi-natural green areas that belong to the category of urban green space [15,16,17]. In this study, of the 16 urban districts of Beijing, six comprising the urban core of the city were used as the research area: Xicheng, Dongcheng, Haidian, Chaoyang, Shijingshan, and Fengtai. A typical urban green space was selected as the specific research area. It can be seen that the land in this area is relatively small, but the population is large, and the density is high. Nearly 60% of the city’s permanent population lives in these six districts, which account for 8.44% of the city’s total land area. Simultaneously, the regional GDP of the six districts accounts for more than 70% of the city’s total and plays a significant part in the overall economic development of Beijing. Although the quantity and structure of natural resources in the six districts have shown a gradual and reasonable development trend in recent years, the problems in urban population, social economy, and resource environment are still prominent. Therefore, this study takes Beijing’s six districts as the research area and conducts empirical discussions on urban green space based on residents’ spatial image perception, which is representative and typical.
Jorgenson and Gobster’s (2010) distinguished the types of urban green space according to descriptive/narrative, inventory, area/distance, biophysical, human perceptual, biodiversity and ecosystem services [3], suggesting that researchers should classify urban green space for the research needs. There are many types of urban green space in Beijing and we study people’s preferences and demand for different types of urban green space. Our ultimate goal is to provide a reference for the planning of urban green space. This study mainly considers the scale and ecosystem function of urban green space and the characteristics of Beijing’s urban green space, dividing the selected study area into four types: centerless, single center, multi-center, and axis, as shown in Figure 1.

2.1.1. Centerless Mode

This mode refers to the urban green space structure mode without any large-scale and attractive core nodes in the region. This type of urban green space has a small size, mainly including sporadic trees and small-scale shrubs, and the forest ecosystem structure of it is relatively simple. There are many public urban green spaces in the centerless mode, but the distribution is relatively scattered. The area of Haidian Zhongguancun in northwest Beijing is a typical representative of this mode. There are many universities in this area (Beijing Jiaotong University, Minzu University of China, Beijing Institute of Technology, Renmin University of China). Each university has its own green space, such as squares and sports fields, and the scale is about the same size. This area is the traditional distribution area of colleges and universities in Beijing, and their formation has certain historical factors. At the same time, this area is also an area with a high water system and forest coverage in Beijing in history. The west of this area is connected with Xiangshan Mountain and other mountains in Beijing, whose natural resource endowment is relatively good. However, schools are relatively scattered, and therefore, there is no large, clustered urban green space in this area. The advantage of the centerless mode is that it has a wide distribution range and is more convenient for residents to use. This area is the traditional gathering and distribution area of colleges and universities in Beijing, with a large number of students, and the population is dense, which leads to a high utilization rate of green space. This is precisely because of the numerous universities that the visitor structure of the area is relatively simple, and young people account for a large proportion. In addition, the scattered distribution of urban green spaces creates difficulties for their unified management in this mode.

2.1.2. Single Center Mode

This refers to a structural mode in which there is only one urban green space with large-scale, complete facilities and diverse site types within a certain area. The core urban green space in this area is often composed of large-scale parks or a combination of various spaces where urban green spaces such as parks and squares are considerably concentrated. This type of urban green space has a large size, totally being green with high forest coverage, complete forest ecosystem structure, and rich biodiversity. The Chaoyang Park and its surrounding areas is a representative area of this mode. Chaoyang Park has a total area of 288.7 hectares, and the coverage of green land is 87%, which is the largest urban park within the Fourth Ring Road in Beijing. Therefore, Chaoyang Park is the only core urban green space in this area. In addition, there are some smaller urban green spaces around Chaoyang Park, such as Honglingjin Park and Tuanjiehu Park. These parks are not as comprehensive as Chaoyang Park in terms of function, but they also provide residents with space for rest and activities. They are an indispensable part of green space in Beijing. The areas above together constitute the single center mode structure. The advantage of this mode is that the green area inside the core urban green space is considerably large and can accommodate numerous residents. Simultaneously, as an old city park, Chaoyang Park has acquired many functions over time, integrating culture, sports, fitness, leisure, and ecology. Amenities are extremely comprehensive, including a series of amusement facilities, which are suitable for activities such as parent-child excursions. However, this area also has some shortcomings: the excessive scale causes pressure to the surrounding area, which is not conducive to the balanced development and layout of the core and sub-core urban green space. In addition, numerous visitors to the core urban green space can easily cause traffic congestion in the surrounding area.

2.1.3. Multi-Center Mode

This refers to a structural mode with multiple urban green spaces of approximately the same size. It is mainly composed of multiple parks and squares that are relatively concentrated in a certain area. Therefore, this type of green space is composed of several relatively large urban green spaces to form some small urban forest ecosystems, which are relatively independent but similar. This type of green space has high forest coverage, a relatively complex ecosystem, and rich biodiversity. In this study, the Hepingli area was selected as the sample area of the multi-center mode. The Ditan Park, Qingnian Lake Park, and Liuyin Park in this area are all about the same size, distributed in the Hepingli area, and connected by the city’s main roads and leisure streets, showing the spatial distribution characteristics of the mode. These parks are deeply embedded in the urban community, and even become a part of the community. In other words, there are many residential communities in the area, and surrounding urban green spaces are conveniently situated. Simultaneously, there are many primary and secondary schools, and the existence of urban green spaces also provides a suitable place for conducting nature education. However, the acreage of urban green spaces in this area has changed little over the years, and its internal service facilities are outdated and can no longer adequately meet the current needs of residents. Similarly, due to the large population and dense buildings in Beijing, it is almost impossible to expand the area of such parks. In addition, the distance between the three urban green spaces in this area is relatively close, which leads to a certain degree of overlap of urban green space service functions.

2.1.4. Axis Mode

This comprises urban green spaces that are linear or organized into strips. In other words, the characteristics of this mode are obvious axes formed by main urban roads, rivers, or ancient city walls in the area. This type of green space has a small forest area. Trees are mainly planted along rivers and roads, constituting the main body of the park with the shrubs below, and the green space ecosystem structure is relatively simple. We selected the Ming City Wall Relics Park near the Beijing Railway Station, Qingfeng Park (including the west extension), and the East moat Greenway as sample areas. The urban green spaces within this area all show the distribution characteristics of the axis form. This type of urban green space is established on the basis of the ancient city wall and moat in Beijing. On the one hand, this structural form makes full use of space, on the other hand, it also protects cultural relics and historic sites. This area contains the characteristics of urban built-up areas and maximizes the use of urban space in a crowded city. It also adheres to the construction concept of repair the old as the old and preserves the relevant content of ancient Chinese history and culture in the green space and surrounding areas. The most notable feature of this mode is its linear distribution, which provides residents with access to exercises such as walking and cycling. However, the area of green space in this area is relatively small, the capacity is limited, and the service function is relatively simple.
To sum up, Beijing’s urban green space development process has fully considered the city’s resource endowment and cultural characteristics. On this point, this study has been described in detail. On this basis, the four types of creatively developed urban green space basically cover the urban green space in the core urban area of Beijing. As a research field, it is typical and representative.

2.2. Survey Design

In order to ensure the scientificity of the investigation process and the accuracy of the results, the 22 investigators participating in the survey were all graduate students with a professional knowledge background and field survey experience. To make the survey more efficient, we conducted a one-day training for all investigators before conducting the survey, including the research background purpose, implementation method, survey inquiry method, and tone. Based on this, we conducted field research and data collection from July to August of 2019, totally obtained 375 valid questionnaires and 139 effective cognitive maps for analysis (See Appendix A for the form of questionnaire). Moreover, the four types of urban green spaces have different characteristics of real-life distribution. Based on this, their structural models can be refined to better reflect the characteristics of different types of urban green spaces, and we can discuss the differences of residents’ preferences among them. Based on this, we extract four kinds of structural models. Table 1 shows the structural models of various urban green spaces and the number of questionnaires in different locations.
On this basis, we hope to know the residents’ preference for different urban green space modes. In order to facilitate comparison, we use a slide show to collect data. In the aspect of slide design, three modes are presented in the same slide, and the two modes in the previous slide will be replaced by the two new modes in the next slide, thus creating a slide combination of various modes. In the survey, we used tablet computers to present different slide pages for the interviewees. The interviewees were asked to rate each mode of each slide according to the Likert scale with a score of 1 to 5 (1 = most least favorite; 5 = most favorite). Examples of slides used in the survey of this study are shown in Figure 2.
After the survey, the respondents will get some small gifts, such as umbrellas, small fans, etc. It can also be seen that interviewers are mainly responsible for collecting data, thus they know the types of urban green space represented by different photos, while interviewees do not know this information. Their scores are completely based on their own subjective preferences. In our analysis, we assume that the four urban green space modes are independent, and we further analyze the residents’ preference for different urban green space models by using multiple logit models.

3. Methods and Model Design

3.1. Cognitive Map Methods

The cognitive map is a dynamic, three-dimensional, comprehensive representation of the spatial environment encoded and stored in the person’s brain. The cognitive map can describe the structure and composition of their experience. The concept was first proposed by the American behaviorist Tolman (1948) in the process of experimenting with rats walking a maze. He generalized the cognitive map as a comprehensive representation of a certain local environment and space [18]. Cognitive maps are significant in studying spatial behavior decision-making, urban planning, and geographic information system-practicing [19]. They are presented in the form of paintings, words, or talks and are a person’s perception and image of the space environment. It has the characteristics of intuitiveness, vividness, ambiguity, and fragmentation. The result is not necessarily correct, but it is the most important part of the environment subjectively considered by the individual [20,21,22,23]. In addition, in the same spatial environment, different individuals will have different cognitive maps, depending on their personality, age, occupation, social status, lifestyle, and other characteristics. Through extensive research, the public image of the environment is formed by superimposing the interviewee’s cognitive maps of the material environment.
Hand-drawing is one of the more direct graphical methods for creating cognitive maps, which only require the surveyed person to show the shape, location, and structural layout of the features in painting [24,25]. Regarding the content of the research on the material form in the city image, Lynch (1960) summarized it into five elements: landmarks, paths, nodes, regions, and boundaries [26]. The five elements together form the structure of the city in the mind; therefore, this type of information also has the character of a cognitive schema. Based on this, Appleyard (1970) proposed that the hand-drawn cognitive maps of the surveyed person can be roughly divided into two types: a sequential cognitive map oriented by road elements (including Linear, Branch, Chain), and spatial cognitive maps (including scattered, mosaic, connected) oriented by regional elements [27].
In our study, we asked the same resident to complete the questionnaire and hand-painted map. In terms of obtaining hand-painted maps, we ask residents to draw cognitive maps of the green space where they are in, including distribution characteristics and structural models of the specific type of urban green space. In this process, we did not provide relevant guiding information to residents, such as the map of the park, that is to say, the cognitive map drawn by residents completely depends on their own subjective cognition. However, influenced by factors such as painting technology, not every resident can draw a qualified cognitive map for this study. Therefore, we screened and classified the cognitive maps drawn by residents. The interviewers participating in the survey are responsible for this work, and they have received corresponding training before this work. Based on the data provided by the cognitive map, we divide and analyze the types and characteristics of the cognitive map, further extract the familiar elements in the residents’ cognitive map, then determine the most prominent elements in the four urban green spaces, and consider the differences in the distribution of these elements, Then the cognitive map is associated with the characteristics and functions of urban green space.

3.2. The Multinomial Logit Model

In this study, two multinomial logit models were applied to analyze residents’ preference for four urban green space modes (Y1) and the results of residents’ drawing of six cognitive map forms (Y2). Among them, Y1 and Y2 are functions of the personal characteristics of residents to make choices. Y1 includes residents’ preferences for four urban green spaces: centerless mode, single center mode, multi-center mode and axis mode, Y2 indicates the types of cognitive maps drawn by residents, including linear cognitive map, branch cognitive map, chain cognitive map, scattered cognitive map, mosaic cognitive map and connected cognitive map. In the multinomial logit model, Y1 and Y2 are dependent variables, and the individual characteristics of residents are independent variables, including Gender (X1), Age (X2), Residential area (X3), Marital status (X4), Family size (X5), Health status (X6), Beijing residence registration status (X7), Occupation (X8) and Months of residence in Beijing every year (X9). Detailed variable settings and values are shown in Table 1. The purpose of the model design has two aspects: one is to compare the relative importance of different schemes, the other is to compare the differences between the objective structural characteristics of urban green space and residents’ subjective spatial perception.
For both Y1 and Y2, the categories used for comparison are unordered. Specifically, multiple logit regression involves more than two types of nominal response variables, and its model is composed of multiple formulas. There are (j + 1) types of response variables that will produce j formulas, each of which is a binary logit regression process compared with the control group. In addition, in multiple logit regression, the above j binary logit regression is estimated at the same time. If the last group is set as the control group and the other groups as the experimental group, P (yi = j) is the probability of the experimental group and P (yi = 0) is the probability of the control group, β It represents the log odds of the experimental group to the control group, and the multivariate logit model of the study can be set as Formula (1) and Formula (2):
P ( y i = j ) = e x i β j 1 + k = 1 j e x i β k
P ( y i = 0 ) = 1 1 + k = 1 j e x i β k
In estimating each model, the coefficients of the reference group were normalized to zero (Maddala, 1990; Greene, 1993). This is because the sum of the probabilities of all choices must be uniform (Greene, 1993). Based on the multivariate logit model, the following probability relative reference groups can be obtained as shown in Formula (3) and its final form Formula (4):
P ( y i = j ) P ( y i = 0 ) = e x i β j
l n P ( y i = j ) P ( y i = 0 ) = x i β j
There are also corresponding calculation methods in the parameter estimation process of unordered multivariate logit selection model. For the resident i, if the scheme j is selected, then dij = 1, otherwise dij = 0. At the same time, for the resident i, only one of the alternatives can be selected, that is, only one dij = 1 can exist. According to this, we can write yij (I = 1, 2, …, n; j = 0, 1, 2, …, m) and the likelihood function is obtained. The final log likelihood function is shown in Formula (5):
l n L = i = 1 n j = 1 m d i j l n P ( y i = j )

4. Results

4.1. Data Description

In terms of personal characteristics shown in Table 2, the proportion of men and women in the respondents was basically the same, more than 80% of the respondents are between 18 and 49 years old, and the proportion of the elderly is low. Among those surveyed, a larger proportion of the total were married. We infer the possible reason is that married couples often take their children to perform daily outdoor activities in urban green spaces. The physical condition of the sample group is relatively average, and more people were not permanent residents in Beijing, this is in line with the reality of a large floating population in Beijing. From the perspective of family population, the sample is dominated by families with 3–4 people, this has something to do with the liberalization of China’s ‘two-child’ birth policy in recent years, which has led to an increase in the population of many families. This is also one of the characteristics of population distribution in Beijing. In addition, 70% of the sample group live in Beijing for more than nine months each year, with their residences being mainly between the Fourth Ring Road and the Fifth Ring Road.

4.2. Multinomial Logit Model: Urban Green Space Modes

The results based on urban green space modes reveal many typical conclusions (Table 3). For example, respondents aged 30–39 are mostly young white-collar workers, according to the interview, we learned that those people spend less time going to urban green spaces, they seem more willing to go to scattered green spaces around their workplace and public green space in the community. These urban green spaces are usually centerless mode; from the perspective of living area, residents living within 2nd–3rd Ring Road seems more willing to go to Axis urban green spaces, one possible reason is the area within 2nd–3rd Ring Road is the old city area of Beijing. Due to the limitation of land resources, much green space here is developed along the old city walls and moat, with the characteristics of axis type; within 3rd–4th Ring Road, each will have at least one large park in the area, but the large parks are widely distributed, so these respondents prefer single center mode; within 4rd–5th Ring Road, in recent years Beijing vigorously developed urban green space, many newly established parks are distributed in this area, many areas often form multiple parks close distribution, it may be affected by this factor that respondents living in this area prefer the multi-center mode. In this study, unmarried residents have a higher preference for axis mode. One possible reason is that many unmarried young people often live near work places for the convenience of work, so more in the more prosperous urban areas, which is mainly type Axis green space. Families with Beijing residence registration status and large population are more inclined to go to multi-center urban green spaces. The results show that residents with larger family sizes prefer multi-center modes. We believe that the possible reasons are as follows: families with a large population have a higher demand for urban green spaces, a single green space cannot meet its diversified needs, and the multi-center-type green space can provide them with more choices.

4.3. Multinomial Logit Model for Cognitive Map Types

Further, this study uses cognitive maps to compare and analyze residents’ spatial image perceptions of different types of urban green spaces. The purpose is to analyze and verify whether residents’ spatial perception of cognitive maps of various modes is consistent with the structural characteristics of various modes. Figure 2 shows examples of hand-drawn cognitive maps. The individuals will have different perceptions of urban green spaces. The classification method of cognitive maps in this study refers to the detailed classification of cognitive maps proposed by Appleyard (1970) [27,28,29]. In this survey, 139 cognitive map sketches were obtained. Figure 3 presents an example of hand-drawn cognitive maps. The cognitive maps obtained by our study can be roughly divided into sequential cognitive maps (including linear, branch, and chain) and spatial cognitive maps (including scattered, mosaic, and connected).
In general, the number of sequential maps accounted for 58.99%, slightly more than the number of spatial maps, accounting for 41.01%, as shown in Table 4. In general, Beijing residents have a relatively balanced perception of the spatial image of the urban green space, which also reflects the diverse characteristics of the respondents’ perceptions of the spatial image from the side. However, their perceptions of the spatial image of the urban green space were generally relatively shallow, and there was still a large part of the area that they did not perceive.
Specifically, (1) the linear map includes the main roads inside and around the urban green space. Most respondents could only outline the main road, while some can draw more detailed linear perception maps. These accounted for 31.06% of the total sample; (2) the branched map contains the elements of the urban green space, which respondents thought were notable and can be connected through paths. This type of map generally reflected that the respondents had a deep memory of scenic spots and the various scenic spots are mainly connected through the passage line to form a rough branch map. There were relatively few maps of this type, accounting for only 10.84% of the total sample; (3) the chain map is a continuous map based on the main roads around the urban green space of the city. Respondents integrated the fragments of each scenic spot through the chain fragments developed by multiple corridors to form a perception space in the impression. This type of map accounted for only 17.27% of the total sample; (4) the scattered map contains a combination of scenic spots or areas where respondents have had a specific impression, which roughly reflects their perception of the image of the city’s urban green space. There were 31 maps of this type, accounting for 22.24%. In one case, after the respondents drew an area boundary of the scenic spot, they added the distribution of multiple point-like features. In another case, most of the respondents who drew this type of map used a serial combination of multiple scenic spots to describe their general spatial concept of the entire scenic spot; (5) the mosaic cognitive map combines the urban green spaces in different areas of the visitors’ memory and then integrates them into the perception of the overall image of the urban green space. Respondents combined different areas in the space of the scenic spot. This type accounted for approximately 10.75% of the sample; (6) the connected map represents the urban green space connected by necessary traffic roads and facilities. Respondents made effective connections between the fragments through the necessary traffic lanes and the spatial fragments of the scenic spot. This type of perceptual map belongs to a higher level, and their proportion in the sample was extremely small (only 7.84%).
The maximum likelihood method was used to classify the types of hand-drawn cognitive maps based on residents’ individual characteristics, and to estimate the degree and significance of their impact. A disordered multivariate logit model was constructed to calculate the types of cognitive maps and compare them. Linear, branched, chain, scattered, mosaic, and connected cognitive maps were set up for P1, P2, P3, P4, P5 and P6, respectively. P1 to P5 were set as an experimental group and P6 was set as the reference group. Based on the Wald test results, the results were obtained by eliminating the variables for which parameter estimates were zero (Table 5).
It is shown that young residents can produce mosaics of different regions of urban green spaces in memory and draw cognitive maps of mosaic types, thus gaining a more comprehensive understanding of urban green spaces. In contrast, the aged travel more frequently to urban green spaces, but the aged have a limited range of activity and a generally weaker memory, so that their cognition on urban green spaces is more focused on certain areas and attractions, and is reflected in scattered and chain cognitive maps.
In terms of residential areas, residents draw more advanced cognitive maps as the distance from the city center increase. According to the interview, the possible reason is that the area within 2nd–3rd Ring Road is the old town of Beijing, where the green space is less, and the distribution is relatively scattered, the residents living in this area can only draw a relatively simple scattered cognitive map. In contrast, the urban green space created by Beijing in modern times is mostly between 3rd–5th Ring Road, which is also an area with a relatively concentrated population in Beijing. Thus, in this area, the Residential inhabitants have a deep perception of the spatial image of urban green spaces, who can produce relatively advanced mosaic-type cognitive maps.
The cognitive maps drawn by unmarried residents are mostly linear, which is also what most respondents can draw. Such type of map contains only major roads associated with urban green spaces and is a relatively simple type of cognitive map. Residents in better health are more energetic, relatively utilize more urban green spaces, and are more impressed with all kinds of internal elements, and their cognitive map can be connected through the main traffic road to form an approximate branch map.
Similarly, residents with a Beijing hukou and residents living in Beijing for 6–9 months a year can draw relatively advanced mosaic cognitive maps, while residents living in Beijing for less than 3 months a year can only draw relatively simple chain cognitive maps. In fact, there is a large number of floating population, and their stay in Beijing is not fixed, so they can only describe the most impressive elements of urban green spaces as scattered cognitive maps, which is quite different from those who have a Beijing hukou.
In addition, occupation is one of the influencing factors of residents’ cognitive maps. Among them, the administrative organ personnel have a more understanding of urban development and regional situation and can draw a relatively advanced connected cognitive map. The cognitive maps made by residents of other types of work are relatively simple, mainly by connecting more impressive locations or segments through traffic routes to form branch or chain cognitive maps.

4.4. Analysis of Cognitive Map Elements

Based on Lynch’s (1960) urban image theory and combined with cognitive sketches drawn by respondents, we extracted the five basic elements of landmarks, paths, nodes, regions, and boundaries of Beijing’s urban green space imagery. We identified, classified, and counted the elements that appeared in all of the respondent’s cognitive maps. Our statistical analysis included all the elements in the maps and calculated the frequency of the five basic elements. Based on the extraction of elements, the frequency, and relative frequency were calculated separately. In our results, the cognitive frequency of image elements refers to the number of times a specific element appears in the cognitive map, and the cognitive relative frequency refers to the ratio of the cognitive frequency of tourism image elements to the number of cognitive maps (139 copies). The higher the frequency of a certain element, the deeper the memory of the respondent, and the higher the probability of the element being recognized.
Figure 4 indicates that when respondents draw a cognitive map, they can generally reflect that they have the highest degree of awareness of the element of paths, followed by landmarks; the other three types of elements have a relatively low degree of awareness. Specifically, the distribution of green spaces in different types of cities has certain differences. As far as the centerless mode is concerned, while the awareness of nodes and landmarks is low, the awareness of other elements is relatively high, and the difference between them is not significant. In the single center mode, the proportion of nodes is obviously lower, at only 9.35%, and the cognitive difference of the other elements is also not large. In the multi-center mode, the awareness of regions is significantly lower (6.26%), and the awareness of other elements is again relatively evenly distributed. In the axis mode, the awareness of paths and landmarks is higher, followed by nodes. Conversely, the awareness of regions and boundaries is significantly lower (5.83%, 8.24%), and both are lower than other types of urban green space.
Based on the data shown in Figure 4, we further discuss the familiar elements of the respondents’ cognitive maps. By classifying the five dimensions of the cognitive map image elements, we identified the most prominent elements in the four types of urban green spaces (Figure 5). Different types of urban green spaces have differences in the distribution of familiar elements in the respondents’ cognitive maps, and this difference is related to the inherent form of urban green space.

4.4.1. Landmarks

Landmarks are reference points given to the outside world. They are prominent and have intuitive significance, which can be easily perceived by visitors and make a deep impression. The difference in landmark types are the main reasons for the differences in public perception. On the one hand, the core area in the single center mode is larger. As a large-scale regional green public space (for example, Chaoyang Park), its internal landscape infrastructure, facilities, equipment, and cultural carrying content are richer. Thus, landmarks are mostly distributed inside the single center mode area. On the other hand, about the multi-center mode, the main landmarks are community service buildings such as stadiums and service centers around green public spaces. In the axis mode, they are mostly green office buildings, shopping malls, government agencies, and other buildings around the public space. Thus, in the multi-center and axis mode, different types of large buildings or complexes of buildings will make a deeper impression on visitors. For example, the Beijing International Hotel, Ditan Gymnasium, and other well-known buildings will attract visitors to stay for a certain period; therefore, they are easy to be remembered. Simultaneously, skyscrapers such as the International Trade Building and buildings such as the China Zun Building will become extremely eye-catching due to their height. In contrast, landmarks are least distributed in the centerless mode and are scattered only in some areas outside the area, the possible reason is that the distribution of all kinds of landmarks is relatively small in this mode.

4.4.2. Regions

Regions are mainly certain parts of the scenic spot that visitors can enter and have a psychological perception of entering its ‘interior’. Research shows that the regional distribution of the centerless mode basically overlaps with the sample regions selected in this study; that is, most of the school regions are accessible. These regions have a clear scope, and the themes of different types of colleges and universities are obvious. Coupled with the influence of their cultural heritage and popularity, they are perceived by residents more frequently than in other regions. Conversely, although the single center and multi-center mode regions also have relatively clear boundaries, their boundaries are irregular, which also leads to a relatively lower perception of the visitors to this type of region. As far as the axis mode is concerned, the regions are mostly long strips, such as the east-west strip of the Ming City Wall Relics Park or the north-south strip of the east moat greenway. This is not conducive to the visitors having a complete and regional spatial perception.

4.4.3. Paths

Paths connect different destinations as well as roads, overpasses, or trails that can be used by residents on foot or their means of transportation (cars, bicycles, etc.), or belt-shaped passages formed by vegetation in certain areas. Paths were more obvious in the cognitive maps drawn by respondents, which can be proved by the largest number of linear cognitive maps. Regarding the differences in the paths of the four types of urban green space, the paths in the centerless mode are mostly large roads and are relatively horizontal and vertical, which can evenly divide the boundaries of each area. Similarly, the paths in single center mode are mostly loops, which cannot be set in a straight line owing to the geometry, but different areas can still be clearly divided. Conversely, the multi-center mode paths are mostly small roads whose main function is to separate different green spaces and surrounding residential areas. Paths in the axis mode are the most complicated, with main and secondary paths, and are affected by the presence of the Beijing moat. The design of the overpass is extremely complicated, and there are many curved roads so that the paths are irregularly distributed. Notably, paths in certain areas are often overlooked by visitors because these paths are located inside parks or green spaces. They have visual concealment and perceptual complexity, so they are often ignored.

4.4.4. Boundaries

Boundaries refer to the reference of the boundary lines of the two regions. The results of the research show that the frequency of recognition of the boundaries between centerless and multi-center modes is high. In other words, most residents can have a clear perception of the overall space near the boundaries of such urban green spaces. For example, the school area in centerless mode has clear gates, but there is often only one main entrance. For another example, different areas in the multi-center mode have clear entrances and exits; nevertheless, these entrances and exits are small-scale, and their main purpose is to facilitate their use by visitors. However, in the single center mode, the core sample area has multiple clear entrances and exits with large parking lots. The visitor’s perception of the boundary of the core sample is relatively accurate, but the boundary of the sub-core sample is not so obvious to them. In the axis mode, the urban green space presents a striped distribution. This type of distribution determines that there are no clearly perceptible entrances and exits in this type of area; however, the start and end points of the striped area can be used instead. For example, the start and end points of the East Moat Greenway or the east and west end points of the Ming City Wall Relic Park are essentially marked with boundaries, but the public’s perception of them needs to be improved.

4.4.5. Nodes

Nodes are mainly the key points on the route that visitors can enter and have a connection function, such as subway stations, squares, parking lots, and so on. In general, the frequency of node elements is often related to the presence of obvious landmarks, paths, or boundaries around the node. For example, in the multi-center and axis modes, nodes are widely distributed, and the number of subway stations is considerably large. This is because there are more intersections between main paths and secondary paths, and there are more landmarks around the region. Therefore, the demand for nodes is greater, and the corresponding settings will be higher. Conversely, each region in the centerless and single center mode is often clearly divided by the main path, and the boundary of a single area is relatively clear. Thus, the nodes only exist at the intersection of the main paths, and the number is relatively small. Even if the frequency of use of some nodes is high, the perception of visitors is also reduced due to their relatively small absolute number.

5. Discussion

As far as the overall process of regional modernization is concerned, the population is undergoing a process of gradual concentration from rural areas and suburbs to cities. Over the past 40 years of reform and opening up, China’s urban economy and society have developed rapidly. However, urbanization has also brought about environmental pollution and ecological damage, which have seriously affected the health and quality of life of its residents [30]. Currently, China’s large cities are often faced with a huge population, resources, and environmental pressures, and the corresponding urban ecological construction is often restricted by existing social and economic conditions. Nevertheless, the main body of the city is, in the final analysis, urban residents. In addition to considering the construction and productive functions of the city itself, the development of the city also needs to consider the residents’ needs for a higher quality of life. Accommodating their desires while urbanization is developing rapidly is the fundamental purpose of future urban development. The urban green space is like a mirror, reflecting the comfort and civilization of a city. It integrates the urban built-up area and the natural environment, improves the urban green coverage, and is a concentrated expression of the ‘people-oriented’ urban development concept [31]. Simultaneously, with the improvement of the quality of urban life, residents’ awareness of urban green spaces is also deepening. Contemporary understanding of urban green space has gradually shifted from traditional aesthetics and practical functions to psychological and emotional aspects. The above meets the transition [32]. Therefore, research focusing on the perception of the city’s democracy is equally important.
This study shows that different types of urban green spaces will have different characteristics; therefore, various urban green spaces can be constructed according to local conditions. Simultaneously, the Japanese architect Kisho Kurokawa argues that a ‘symbiosis’ between people and the landscape is the goal, and the only way to win the identification of the subject of experience and the identification of the object of the landscape is society [33]. We found that the four types of urban green spaces have different styles and functions. However, surveys of residents’ evaluations and perceptions of urban green spaces are often conducted simplistically from the perspective of service recipients. Therefore, in the process of construction and improvement of urban green spaces, a balanced distribution method and rational structural model should be sought among various urban green spaces to meet the multi-dimensional needs of residents.
Urban green spaces provide a brand-new interactive platform for the city. Therefore, in the actual urban green space form, we should be able to see a good interaction and reciprocal relationship between urban green spaces and residents. In other words, urban green spaces are related to the vital interests of the general public, and the increase in public attention and participation is conducive to the construction and improvement of urban green space [34]. To better realize the well-being of urban green space to residents, it is necessary to strengthen publicity work to enhance their perception of urban green space so that they can feel the benefits of urban green space. Further, it is essential to provide innumerable opportunities for them to truly participate in the construction process of urban green spaces in the city and provide feedback on their needs, preferences, and existing problems in the use of urban green space at any time.

6. Conclusions

With the development of cities, the increasing degree of human intervention in the natural ecological environment and rapid urbanization have brought huge ecological problems to cities. As the beneficiaries of the construction of urban green spaces, residents’ perceptions and preferences are crucial to the development and improvement of urban green spaces. This study starts from four typical urban green space forms: centerless, single center, multi-center, and axis. Based on this, we used a multinomial logit model and cognitive map to explore residents’ spatial image perceptions comprehensively. Compared with research based on image analysis and other studies that only proceed from subjective vision, the conclusions of this study are richer and more reasonable.
The results of the preference analysis show that the residents ‘age, place of residence, marital status, family population, occupation, and other factors all have a certain impact on the residents’ preference to choose the green space type. These effects are mainly determined by the work and life characteristics of the residents. Specifically, older residents (40–49 years old), living 3rd–4th Ring Road prefer single center mode. The main reason is that single center mode is able to provide a huge recreational entertainment function, can meet their needs; in contrast, residents with small family population and residents with short actual living time in Beijing prefer the centerless mode, which is closely related to their work and life characteristics, they often bear greater work pressure and limited leisure and entertainment time, so their frequency of traveling to urban green space is very low, they only do small activities in scattered green space near work and residence, thus showing their preference for the centerless mode; residents living in 4th–5th Ring Road, residents with large family population and residents with Beijing hukou showed their preference for the multi-center mode, possibly because multi-center mode is more diverse and most distributed in more concentrated residential areas, so multi-center mode is preferred; residents living in 2nd–3rd Ring Road, unmarried, living there for a period of 3–9 months showed a higher preference for the axis mode, mainly determined by their work and life characteristic, where they work or live is in the old town, urban green space often features axis mode due to scarcity of land resources and historical reasons.
On this basis, the results of cognitive map analysis show that the cognitive maps drawn by residents of Beijing can be divided into two categories: sequential cognitive maps and spatial cognitive maps. The proportions of the two were 58.99% and 41.01%, respectively. In general, residents have a relatively balanced perception of the spatial image of the urban green space, which also reflects the diverse characteristics of their perception of the spatial image from the side view. However, sequential cognitive maps account for a larger proportion of residents’ perceptions of urban green space imagery. That is, their perception of the spatial image of the urban green space is generally relatively shallow. For example, in sequential cognitive maps, the number of simple linear cognitive maps is larger, accounting for 31.06% of the total sample. However, in spatial cognitive maps, higher-level connected cognitive maps account for a small proportion of the total sample—only 7.84%. In other words, there are still some large areas that cannot be perceived by residents. Therefore, in the future construction of urban green spaces, planners should also pay attention to the improvement of relevant service facilities and landmarks.
Regarding the factors influencing the structure of cognitive maps, clear differences existed among the four types of urban green spaces. These differences were reflected in the six types of cognitive maps drawn by residents. Specifically, young residents have a more comprehensive understanding of urban green spaces, while the cognition of elderly residents is more focused on some areas and scenic spots. The perception of spatial images in urban green spaces is negatively correlated with the distance from residents’ residential area to the city center. Residents who have registered permanent residence in Beijing and have lived in Beijing for a long time each year have a deeper perception of the spatial image of urban green spaces. At the same time, unmarried residents also have certain spatial image perceptions. In addition, occupation is also one of the influencing factors for residents to draw cognitive maps, which depends on the residents’ understanding of urban green spaces.
To sum up, residents’ spatial perception of various modes is different from their structural characteristics. In terms of the constituent elements of cognitive maps, residents’ perception of urban green spaces can be reflected in their familiarity with the six types of cognitive map elements. Among them, the markers are mostly distributed inside the single center mode area and the periphery of the multi-center and axis mode areas, which reflects the difference in the perception rate of visitors. The distribution of the centerless mode basically coincides with the selected sample site; therefore, the frequency of being perceived by the visitors is higher. The boundaries of the other three types of urban green spaces are irregular, which also leads to a relatively low rate of perception of this type of area. Passages are more obvious in all kinds of cognitive maps drawn by respondents, which proves that the number of linear cognitive maps is the largest. Simultaneously, the four types of urban green spaces also have their own characteristics in terms of channel distribution. The borders of centerless and multi-center modes are recognized more frequently. Although the respondents’ perception of the boundaries of the core sample area of the single center mode is relatively accurate, their perceptions of the boundaries of the sub-core sample area is not obvious. The frequency of occurrence of nodes is often related to whether there are obvious markers, channels, or boundaries around them. The distribution of nodes in the multi-center and axis modes is relatively wide, while the number of nodes in centerless and single center modes is relatively small, mainly because of its relatively small absolute quantity. The advantages and disadvantages of various types of urban green spaces are closely related to their geographical location and the internal structure of green spaces. Planners can design various types of urban green spaces in accordance with local conditions and consider the scientific and rational structure of urban green spaces.
This study shows that the multinomial logit model and cognitive map can effectively quantitatively analyze the subjective evaluation of people’s spatial perception in a relatively simple manner. However, in terms of the limitations of this study, the relevant results obtained in this study are based on the typical research in Beijing, and there are not enough relevant studies, so there are some limitations in the promotion of the conclusion. Secondly, for all kinds of urban green spaces, this study does not reflect the level of tree coverage in residents’ spatial perception. Third, this study did not consider the use frequency of residents in the preference analysis, which may have a certain impact on the final calculation results. The above problems are the contents that need to be improved in the future. In addition, the cognitive map method has certain requirements for the interviewee’s spatial understanding ability and hand-painting skill, which also limits the number of effective samples to some extent. Future surveys need to be given more time to ensure the quantity and quality of the survey samples. Moreover, studies have shown that human responses to the environment are based on the sensory response law, and perception is the combination of sensory input and interaction to obtain environmental information. It is the comprehensive subjective feelings and psychological judgments by humans about their surrounding environment and its changes [35,36]. As Beijing’s urban development and environmental construction are also constantly changing, research on the residents’ perception and spatial models still needs to be supplemented and improved. For example, classification of the types of urban green spaces in Beijing can be further refined, and the research area can also be expanded or focused accordingly to draw more targeted conclusions.

Author Contributions

Conceptualization, Y.H.; Data curation, Y.W.; Formal analysis, Y.H., Y.Q. and J.S.; Investigation, Y.Q. and Z.Z.; Methodology, Z.Z.; Project administration, Y.W.; Software, J.S.; Supervision, Y.W.; Writing—original draft, Y.H. and Y.Q. All authors have read and agreed to the published version of the manuscript.

Funding

This research was funded by the Social Science Foundation of Beijing (19GLA005).

Institutional Review Board Statement

Not applicable.

Informed Consent Statement

Informed consent was obtained from all subjects involved in the study.

Data Availability Statement

The original data used in this study comes from the empirical research of the research group. The relevant empirical research is funded by the Social Science Foundation of Beijing (19GLA005), which is described in detail in the Funding section. The research group has the right to use the data.

Acknowledgments

We would like to express our gratitude to the anonymous reviewers. We are grateful to Yaoyin Chang, Yutong Qiu, Yuqing Jia, Xiang Guan, Ji Feng, and Li Ma from Beijing Forestry University for their participation in our investigation. Any remaining errors are solely our own.

Conflicts of Interest

The authors declare no conflict of interest. The founding sponsors had no role in the design of the study, in the collection, analyses, or interpretation of data, in the writing of the manuscript, or in the decision to publish the results.

Appendix A. Questionnaire on Residents’ Spatial Image Perception of Urban Green Space (Brief Version)

Place of investigation (filled in by investigator):
Please provide your personal basic information. (Please fill in the number of the corresponding option in the box).
Item1. Gender2. Age3. Residential Area4. Marital Status5. Family Size
Options1 = Men
2 = Women
1 = Age 17 and under
2 = 18–29 years old
3 = 30–39 years old
4 = 40–49 years old
5 = 50–59 years old
6 = Age 60 and over
1 = Within 2nd Ring Rd.
2 = 2nd–3rd Ring Road
3 = 3rd–4th Ring Road
4 = 4th–5th Ring Road
5 = 5th–6th Ring Road
1 = Unmarried
2 = Married
1 = 1 person
2 = 2 persons
3 = 3 persons
4 = 4 persons
5 = 5 persons or more
Your choice
Item6. Health Status7. Beijing Residence Registration Status8. Occupation9. Months of Residence in Beijing Every Year
Options1 = Unclear
2 = Relatively good
3 = Commonly
4 = Relatively poor
1 = Have
2 = No
1 = Public Institution Personnel
2 = Administrative organ personnel
3 = Enterprise unit personnel
4 = Students
5 = Retirement and unemployment
1 = Within 3 months
2 = 3–6 months
3 = 6–9 months
4 = More than 9 months
Your choice
Please choose the answer based on your preference for different urban green space modes. (Please fill in the number of the corresponding option in the box).
Options (Real scene distribution and structural modes)1 = Centerless mode2 = Single center mode3 = Multi-center mode4 = Axis mode
Forests 12 01614 i001 Forests 12 01614 i002 Forests 12 01614 i003 Forests 12 01614 i004
Your choice
Please outline the urban green space map of your favorite type according to your own cognition (If attempt 1 fails, a second attempt can be made):
Attempt 1Attempt 2
If you can’t complete the cognitive map, please write down the elements of urban green space that you are most familiar with:

References

  1. Janeczko, E.; Bielinis, E.; Wójcik, R.; Woźnicka, M.; Kędziora, W.; Łukowski, A.; Elsadek, M.; Szyc, K.; Janeczko, K. When urban environment is restorative: The effect of walking in suburbs and forests on psychological and physiological relaxation of young Polish adults. Forests 2020, 11, 591. [Google Scholar] [CrossRef]
  2. Li, F.; Zheng, W.; Wang, Y.; Liang, J.; Xie, S.; Guo, S.; Li, X.; Yu, C. Urban green space fragmentation and urbanization: A spatiotemporal perspective. Forests 2019, 10, 333. [Google Scholar] [CrossRef] [Green Version]
  3. Jorgensen, A.; Gobster, P.H. Shades of green: Measuring the ecology of urban green space in the context of human health and well-being. Nat. Cult. 2010, 5, 338–363. [Google Scholar] [CrossRef]
  4. Burgess, J.; Harrison, C.M.; Limb, M. People, parks and the urban green: A study of popular meanings and values for open spaces in the city. Urban Stud. 1988, 25, 455–473. [Google Scholar] [CrossRef]
  5. Hunter, A.J.; Luck, G.W. Defining and measuring the social-ecological quality of urban greenspace: A semi-systematic review. Urban Ecosyst. 2015, 18, 1139–1163. [Google Scholar] [CrossRef]
  6. Van den Berg, A.E.; Jorgensen, A.; Wilson, E.R. Evaluating restoration in urban green spaces: Does setting type make a difference? Landsc. Urban Plan. 2014, 127, 173–181. [Google Scholar] [CrossRef]
  7. Akpinar, A.; Barbosa-Leiker, C.; Brooks, K.R. Does green space matter? Exploring relationships between green space type and health indicators. Urban For. Urban Green. 2016, 20, 407–418. [Google Scholar] [CrossRef]
  8. John, O.S. Landscape Architecture: A Manual of Site Planning and Design; McGraw-Hill: New York, NY, USA, 1983; pp. 154–196. [Google Scholar]
  9. Hildebrand, F. Designing the City: Towards a More Sustainable Urban Form; Routledge: London, UK, 1999; pp. 97–118. [Google Scholar]
  10. Li, X. Geographical Study of Human Settlement Environment; Science Press: Beijing, China, 2015; pp. 106–113. [Google Scholar]
  11. Fakeye, P.C.; Crompton, J.L. Image differences between prospective, first-time, and repeat visitors to the Lower Rio Grande Valley. J. Travel. Res. 1991, 30, 10–16. [Google Scholar] [CrossRef]
  12. Golledge, R.; Stimpson, R.J. Spatial Behavior: A Geographic Perspective; The Guilford Press: New York, NY, USA, 1997; pp. 58–74. [Google Scholar]
  13. Choi, W.M.; Chan, A.; Wu, J. A qualitative and quantitative assessment of Hong Kong’s image as a tourist destination. Tour. Manag. 1999, 20, 361–365. [Google Scholar] [CrossRef]
  14. Ma, B.; Hauer, R.J.; Xu, C. Effects of design proportion and distribution of color in urban and suburban green space planning to visual aesthetics quality. Forests 2020, 11, 278. [Google Scholar] [CrossRef] [Green Version]
  15. Grahn, P.; Stigsdotter, U.K. The relation between perceived sensory dimensions of urban green space and stress restoration. Landsc. Urban Plan. 2010, 94, 264–275. [Google Scholar] [CrossRef]
  16. Wolch, J.R.; Byrne, J.A.; Newell, J.P. Urban green space, public health, and environmental justice: The challenge of making cities ‘just green enough’. Landsc. Urban Plan. 2014, 125, 234–244. [Google Scholar] [CrossRef] [Green Version]
  17. Ives, C.D.; Oke, C.; Hehir, A.; Gordon, A.; Wang, Y.; Bekessy, S.A. Capturing residents’ values for urban green space: Mapping, analysis and guidance for practice. Landsc. Urban Plan. 2017, 161, 32–43. [Google Scholar] [CrossRef] [Green Version]
  18. Tolman, E.C. Cognitive maps in rats and men. Psychol. Rev. 1948, 55, 189–208. [Google Scholar] [CrossRef] [Green Version]
  19. Golledge, R.G.; Stimson, R.J. [BOOK REVIEW] Spatial behavior, a geographic perspective. Econ. Geogr. 1998, 74, 83–85. [Google Scholar]
  20. Epstein, R.A.; Patai, E.Z.; Julian, J.B.; Spiers, H.J. The cognitive map in humans: Spatial navigation and beyond. Nat. Neurosci. 2017, 20, 1504. [Google Scholar] [CrossRef]
  21. Montello, D.R. Cognitive map-design research in the twentieth century: Theoretical and empirical approaches. Cartogr. Geogr. Inf. Sci. 2002, 29, 283–304. [Google Scholar] [CrossRef]
  22. Liu, Z.Q.; Satur, R. Contextual fuzzy cognitive map for decision support in geographic information systems. IEEE Trans. Fuzzy Syst. 1999, 7, 495–507. [Google Scholar]
  23. Wills, T.J.; Cacucci, F.; Burgess, N.; O’Keefe, J. Development of the hippocampal cognitive map in preweanling rats. Science 2010, 328, 1573–1576. [Google Scholar] [CrossRef] [Green Version]
  24. Zhao, Z.; Ren, J.; Wen, Y. Spatial perception of urban forests by citizens based on semantic differences and cognitive maps. Forests 2020, 11, 64. [Google Scholar] [CrossRef] [Green Version]
  25. Sturm, J.M.; Rankin-Erickson, J.L. Effects of hand-drawn and computer-generated concept mapping on the expository writing of middle school students with learning disabilities. Learn. Disabil. Res. Pract. 2002, 17, 124–139. [Google Scholar] [CrossRef]
  26. Lynch, K. The Image of the City; The MIT Press: Cambridge, MA, USA, 1960. [Google Scholar]
  27. Appleyard, D. Styles and methods of structuring a city. Environ. Behav. 1970, 2, 100–117. [Google Scholar] [CrossRef]
  28. Feng, J. Spatial cognition and the image space of Beijing’s residents. Sci. Geog. Sin. 2005, 25, 142–154. [Google Scholar]
  29. Jiang, Z.; Zhang, J.; Han, G.; Cao, J. A study review of cognitive maps of tourists. Tour. Trib. 2009, 24, 77–85. [Google Scholar]
  30. Liang, W.; Yang, M. Urbanization, economic growth and environmental pollution: Evidence from China. Sustain. Comput. Inform. Syst. 2019, 21, 1–9. [Google Scholar] [CrossRef]
  31. Morancho, A.B. A hedonic valuation of urban green areas. Landsc. Urban Plan. 2003, 66, 35–41. [Google Scholar] [CrossRef]
  32. Paul, A.; Nath, T.K.; Noon, S.J.; Islam, M.M.; Lechner, A.M. Public open space, green exercise and well-being in Chittagong, Bangladesh. Urban For. Urban Green. 2020, 55, 126825. [Google Scholar] [CrossRef]
  33. Selman, P. Sustainable Landscape Planning: The Reconnection Agenda; Routledge: New York, NY, USA, 2012. [Google Scholar]
  34. Fors, H.; Jansson, M.; Nielsen, A.B. The impact of resident participation on urban woodland quality—A case study of Sletten, Denmark. Forests 2018, 9, 670. [Google Scholar] [CrossRef] [Green Version]
  35. Bell, S. Landscape: Pattern, Perception and Process; Taylor & Francis: London, UK, 2013. [Google Scholar]
  36. Kaplan, R. The nature of the view from home. Environ. Behav. 2001, 33, 507–542. [Google Scholar] [CrossRef]
Figure 1. Research area of this study.
Forests 12 01614 g001
Figure 2. The example of slides used in the survey of this study.
Forests 12 01614 g002
Figure 3. The example of hand-drawn cognitive maps of this study. Among which, (a) is the linear map, it includes the main roads inside and around the urban green space. (b) is the branched map, it contains the elements of the urban green space, which respondents thought were notable and can be connected through paths. (c) is the chain map, which is a continuous map based on the main roads around the urban green space of the city. (d) is the scattered map, it contains a combination of scenic spots or areas where respondents have had a specific impression, which roughly reflects their perception of the image of the city’s urban green space. (e) is the mosaic cognitive map, it combines the urban green spaces in different areas of the visitors’ memory and then integrates them into the perception of the overall image of the urban green space. (f) is theconnected map, it represents the urban green space connected by necessary traffic roads and facilities.
Forests 12 01614 g003
Figure 4. Statistics of the cognitive map elements.
Forests 12 01614 g004
Figure 5. Familiar units in the cognitive maps of four types of urban green space modes.
Forests 12 01614 g005
Table 1. Real-world distribution characteristics and structural modes of various urban green spaces.
CenterlessSingle CenterMulti-CenterAxis
Real scene distribution Forests 12 01614 i005 Forests 12 01614 i006 Forests 12 01614 i007 Forests 12 01614 i008
Structural modes Forests 12 01614 i009 Forests 12 01614 i010 Forests 12 01614 i011 Forests 12 01614 i012
Actual landscape photos Forests 12 01614 i013
Green plaza inside the university campus
Forests 12 01614 i014
Green activity space inside the park
Forests 12 01614 i015
Green and spacious passage inside the park
Forests 12 01614 i016
Green areas along the ancient city wall
Number of questionnaire distributedBeijing Jiaotong University (27)
Minzu University of China (29)
Beijing Institute of Technology (30)
Renmin University of China (25)
Chaoyang Park (28)
Honglingjin Park (33)
Tuanjiehu Park (27)
Ditan Park (28)
Qingnian Lake Park (31)
Liuyin Park (27)
Ming City Wall Relics Park (33)
Qingfeng Park (29)
East moat Greenway (28)
Table 2. Descriptive statistics of respondents and demographic characteristics.
VariableFrequency (%)
(N = 375)
VariableFrequency (%)
(N = 375)
Modes preferences (X4) Marital status
Y1 = 142 (11.2)Unmarried166 (44.27)
Y1 = 298 (26.13)Married209 (55.73)
Y1 = 3143 (38.13)(X5) Family size
Y1 = 492 (24.53)1 person31 (8.27)
Cognitive map preferences 2 persons51 (13.6)
Y2 = 165 (17.33)3 persons133 (35.47)
Y2 = 277 (20.53)4 persons101 (26.93)
Y2 = 361 (16.27)5 persons or more59 (15.73)
Y2 = 449 (13.07)(X6) Health status
Y2 = 554 (14.4)Unclear18 (4.80)
Y2 = 669 (18.4)Relatively good93 (24.8)
(X1) Gender Commonly175 (46.67)
Men188 (50.13)Relatively poor89 (23.73)
Women187 (49.87)(X7) Beijing residence registration status
(X2) Age Have148 (39.47)
Age 17 and under6 (1.6)No227 (60.53)
18–29 years old162 (43.2)(X8) Occupation
30–39 years old97 (25.87)Public Institution Personnel41 (10.93)
40–49 years old46 (12.27)Administrative organ personnel118 (31.47)
50–59 years old35 (9.33)Enterprise unit personnel50 (13.33)
Age 60 and over29 (7.73)Students48 (12.8)
(X3) Residential area Retirement and unemployment118 (31.47)
Within 2nd Ring Rd.9 (2.4)(X9) Months of residence in Beijing every year
2nd–3rd Ring Road40 (10.67)Within 3 months25 (6.67)
3rd–4th Ring Road84 (22.4)3–6 months21 (5.6)
4th–5th Ring Road170 (45.33)6–9 months66 (17.6)
5th–6th Ring Road72 (19.2)More than 9 months263 (70.13)
Table 3. Maximum likelihood estimation of multinomial logit regression for four urban green space modes.
IndexMultinomial Logit Model (N = 375)The Most Popular Mode
ln P ( y i = 1 ) P ( y i = 4 )   ln P ( y i = 2 ) P ( y i = 4 )   ln P ( y i = 3 ) P ( y i = 4 )  
BExp(B)BExp(B)BExp(B)
Gender
Male−0.0490.952−0.0850.919−0.4610.631Axis
Age
18–29 years old0.2571.2930.4591.5830.2871.333Single center
30–39 years old0.2371.2670.1791.1960.0681.07Centerless
40–49 years old0.2411.2721.1483.1530.5661.762Single center
Residential area
2nd–3rd Ring Road−0.9550.385−0.6460.524−0.0390.962Axis
3rd–4th Ring Road−0.1570.8550.2921.3390.2521.286Single center
4th–5th Ring Road0.2541.2890.0721.0740.3851.469Multi-center
Marital status
Unmarried−0.8640.421−1.309 **0.27−0.6560.519Axis
Family size
1 person1.982 **7.261.0312.8051.603 **4.967Centerless
3 persons0.2781.321−0.640.5270.2921.339Multi-center
4 persons−0.3080.735−0.2770.7580.3481.417Multi-center
Health status
Unclear1.0372.821.788 *5.980.5251.69Single center
Relatively good−0.0810.9220.0931.097−0.0940.911Single center
Commonly−0.2760.7590.0311.031−0.2820.755Single center
Beijing residence registration status
Yes0.551.734−0.4990.6070.1441.155Multi-center
Occupation
Public Institution Personnel0.3361.4−0.4390.6450.5321.702Multi-center
Administrative organ personnel0.6261.8710.8572.3560.9362.549Multi-center
Enterprise unit personnel−0.6190.5391.469 *4.3460.4381.55Single center
Student1.0662.905−0.4080.6650.2611.298Centerless
Months of residence in Beijing every year
Within 3 months0.6531.921−2.127 ***0.119−0.8920.41Centerless
3–6 months−1.5650.209−2.882 ***0.056−1.47 **0.23Axis
6–9 months−0.4890.613−0.5270.591−0.951 **0.386Axis
C−0.843-0.553-0.221--
Note: ***, **, and * represent significant levels of 1%, 5%, and 10%, respectively.
Table 4. Statistics of the cognitive maps (%).
TypesSequential Cognitive MapsSpatial Cognitive Maps
Mode LinearBranchChainScatteredMosaicConnected
Centerless35.298.8220.5920.598.825.88
Single center27.0310.8116.2221.6210.8113.51
Multi-center28.578.5717.1428.5714.292.86
Axis33.3315.1515.1518.189.099.09
Average31.0610.8417.2722.2410.757.84
Table 5. Maximum likelihood estimation of multinomial logit regression for six types of hand-drawn cognitive maps.
IndexMultinomial Logit Model (N = 375)Type of Cognitive Maps
ln P ( y i = 1 ) P ( y i = 6 ) ln P ( y i = 2 ) P ( y i = 6 )   ln P ( y i = 3 ) P ( y i = 6 )   ln P ( y i = 4 ) P ( y i = 6 )   ln P ( y i = 5 ) P ( y i = 6 )  
BExp(B)BExp(B)BExp(B)BExp(B)BExp(B)
Gender
Male0.2051.2280.21.2220.3761.457−0.270.763−0.0310.969Chain
Age
18–29 years old0.1441.1551.4854.4140.411.5071.4654.3281.7155.557Mosaic
30–39 years old0.551.7330.7672.1531.0282.7961.4314.1830.82.226Scattered
40–49 years old0.2021.2240.7982.2210.9232.5161.6765.3450.611.841Scattered
50–59 years old0.9242.5190.3531.4230.9432.5690.6141.848−0.6180.539Chain
Residential area
2nd–3rd Ring Road−0.8130.444−0.2280.796−0.7750.4610.5481.73−0.2080.812Scattered
3rd–4th Ring Road−1.062 *0.346−0.3410.711−0.3790.684−0.9140.401−0.4260.653Connected
4th–5th Ring Road−0.8220.439−0.5550.574−0.3640.6950.2081.231−0.5280.59Mosaic
Marital status
Unmarried1.628 **5.0920.3891.4760.8972.4530.5881.80.6841.981Linear
Family size
1 person0.2841.3281.505 *4.5030.431.5373.258 ***26.011.0122.751Scattered
2 persons1.0512.861.642 **5.1660.6751.9642.858 ***17.4341.651 **5.21Scattered
3 persons0.7842.1891.205 **3.3370.5341.7052.65 ***14.1531.69 ***5.417Scattered
4 persons−0.0940.910.8612.3640.8512.3412.306 ***10.0330.5951.813Scattered
Health status
Relatively good−0.5290.5890.1271.136−0.1790.836−0.7070.493−0.6460.524Branch
Commonly0.2551.291−0.170.843−0.0770.926−0.180.836−0.1610.851Linear
Beijing residence registration status
Yes0.3721.451−0.2160.8060.3441.411−0.5350.5850.4431.558Mosaic
Occupation
Public institution personnel−0.0980.9061.163 *3.1990.6351.8860.7892.2010.4521.572Branch
Administrative organ personnel−0.1280.879−0.7890.454−0.0940.91−0.8630.422−1.631 *0.196Connected
Enterprise unit personnel−0.0350.965−0.7010.4960.3221.38−2.583 **0.076−0.8760.417Chain
Students−0.9210.398−1.371 *0.2540.6341.886−1.749 *0.174−1.0840.338Chain
Months of residence in Beijing every year
Within 3 months0.4711.6010.4631.5891.2123.3612.309 *10.0631.7825.942Scattered
6–9 months0.0571.059−0.1760.8380.4931.638−0.4460.640.6691.951Mosaic
C−0.807−1.028−1.861−2.842−1.757
Note: ***, **, and * represent significant levels of 1%, 5%, and 10%, respectively.
Publisher’s Note: MDPI stays neutral with regard to jurisdictional claims in published maps and institutional affiliations.

