Abstract
Soil organic carbon (SOC) is the largest terrestrial organic carbon pool. Plant litter is an important source of SOC, but the knowledge gap between SOC fractions and plant litter input remains inconsistent. Here, a litter input control experiment was conducted at three subalpine forest types (coniferous forest, mixed forest, and broadleaved forest). We assessed the variations of total organic C, active organic C (easily oxidizable C, labile organic C), recalcitrant organic C, and microbial biomass C under litter input or removal. The results showed that soil total organic C decreased greatly under litter input. It was mainly caused by the change of easily oxidizable C and labile C, while the influence of recalcitrant C was small. At the same time, this effect varied among different forest types. Among them, the effect of litter input on SOC was weak and slow in the coniferous forest with low-quality litter input, while a quick effect was observed in the mixed and broadleaved forests with high-quality litter input. Microbial biomass C declined under litter input in most cases, and its variation was strongly controlled by soil temperature and freeze-thaw events. Overall, our results provide new evidence that forest type would strongly control SOC dynamics, in concert with litter quality shifts, with potential consequences for long-term C sequestration. We highlighted that litter input could reduce microbial biomass carbon which might limit the native SOC decomposition, but the loss of active C ultimately changed the SOC in the subalpine forests. It suggested that the interaction of multiple mechanisms should be considered in the study of SOC in this region.
1. Introduction
Soil contains twice as much carbon as the atmosphere and two to three times more than the amount stored in the vegetation biomass [1,2]. Thus, a small change in the SOC pool may profoundly affect the concentration of atmospheric carbon dioxide (CO2) [3]. SOC is primarily derived from plant litter debris through partial degradation or preservation [4]. Mounting evidence has shown that litter input has complex effects on the dynamic balance of SOC [5,6,7]. For example, short-term increases in litter inputs could enhance SOC stocks and C fluxes [8,9]. However, some chronically increased litter experiments obtained increases in SOC concentrations over longer time scales, and others showed slight changes [10,11]. The current uncertainty surrounding the SOC response to litter input indicates that we need to detect different SOC fractions with contrasting behavior.
At present, most researchers have focused on the relationships between litter input and total organic C [12], with little evaluation of the dynamics of different C fractions. SOC can be separated by physical or chemical operations in different turnover times and stabilization mechanisms [13]. These fractionation protocols could separate the active pool from the recalcitrant pool of SOC effectively. It is generally accepted that the active SOC pool features rapid turnover and high bioavailability, while the recalcitrant SOC pool has a relatively long mean residence time [2]. In addition, it is well-known that active C is more vulnerable than recalcitrant C [3,14], and recalcitrant compounds are vital for soil organic matter stabilization [13]. However, a recent observation showed that soil recalcitrant C substances (e.g., humus, lignin) could be decomposed in dissolved organic matter [15]. This indicated that both active and recalcitrant C pools might be affected by litter input, making it difficult to predict the short- and long-term impact of litter input on SOC stocks. Furthermore, the soil microbial community is an important biotic factor for soil C outflows and inflows [16]. For example, increasing litter input affects soil CO2 flux via increased activity of microbe active SOC mining [17,18]. Meanwhile, recent studies have shown the dominant role of microbe-driven C in regulating SOC formation of forest soils [19,20]. Therefore, it is important to elucidate how active C, recalcitrant C, or microbial biomass C respond to litter input.
Forest type is considered to affect soil C concentrations through a variety of traits that are closely correlated with C sequestration, i.e., tree species, litter quality, and net primary production [19,21]. Needle and twig litter of lower quality (high C/N ratio, low nitrogen availability) from the coniferous forest have been considered to fix more C in soil organic matter compared with broadleaved litter [22,23]. This conventional hypothesis was mainly based on those different types of litter exhibiting a variable stoichiometric ratio and decomposition resistance [24]. Recently, it has been hypothesized that high-quality (low C/N ratio) litter would initially decompose faster than low-quality litter; no litter compounds accumulate, but a high amount of microbial residues due to high C use efficiency [4]. However, this does not necessarily lead to higher C stocks. The changing quantity and chemistry of litter in different forest types may also be reflected in SOC storage and stability shifts. Therefore, more detailed knowledge of relationships between litter input and SOC dynamics is needed for increasing SOC storage in forest management.
The subalpine forest in southwestern China contains a typical coniferous forest, a mixed forest, and a broadleaved forest [25]. This region is sensitive to climate change due to its unique microclimatic characteristics, such as seasonal snow cover, frequent freeze-thaw cycles, and long-term freezing cold in winter [26,27]. These climatic factors may directly or indirectly regulate SOC fraction dynamics in response to litter input. Especially in winter, intense leaching and frequent freeze-thaw cycles promote litter cellulose/lignin degradation and change the structure/activity of microorganisms [28]. In cold biomes, the key factors affecting SOC are still uncertain, few studies have focused on whether litter input induced a priming effect and reduced SOC. Hence, more comprehensive research of the response of subalpine forests to litter input is necessary to understand SOC cycles better.
Here, we selected three typical forest types (coniferous forest, mixed forest, and broadleaved forest) of the eastern Tibetan Plateau to investigate the dynamics of SOC fractions under litter input from May 2017 to May 2018. We aimed to answer the following questions: (1) In what way does litter input change soil organic carbon and its fractions (MBC, EOC, LCP, and RCP)? (2) Does this change differ between different forests? What are the main factors?
2. Materials and Methods
2.1. Study Site
The in situ experiment was conducted in the Wanglang National Nature Reserve, Pingwu County, Sichuan Province, China (Figure 1). The mean annual temperature and precipitation are 2.9 °C and 826 mm, respectively. The maximum and minimum temperatures are 26.2 °C and −17.8 °C, respectively. Three forest types located at 2540–2600 m a.s.l, including coniferous forest, mixed forest, and broadleaved forest, were selected with similar slope (22–30°), aspect, and canopy density. Dominant species and understory vegetation of three study sites are shown in the Table 1. Soils in three forests are classified as Cambisols (according to IUSS Working Group WRB, 2006) [25]. Soil initial properties of three study sites are shown in Table 2.
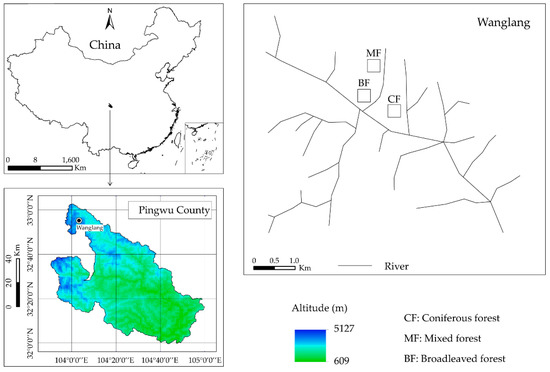
Figure 1.
Schematic diagram showing the location of our study in the subalpine forest.

Table 1.
Dominant species and understory vegetation of three forest types.
Table 2.
Soil initial properties of three forest soils (mean ± standard error, n = 3).
2.2. Experimental Design
Three 15 m × 15 m plots were randomly established under complete forest canopy cover in each forest type in May 2017 (Supplementary Figure S1) [29]. Five in situ incubation boxes (length 70 cm, width 43 cm, and depth 51 cm) were installed at each plot throughout the study period, a total of 45 boxes (5 × 3 plots × 3 sites = 45). A perforated plastic sheet was fixed 3 cm above the bottom of each box, and a drainage hole (diameter 3 mm) was punched in the base of each box (Supplementary Figure S1). These devices ensured adequate drainage during the experiment. We collected soil from 50 cm depth and then loaded it back to the corresponding layer into incubation boxes after removing rocks, plant tissues, roots, and impurities (unrecognized semi-decomposition products). In situ incubation boxes were positioned so that the levels of the soil surface inside the boxes were equivalent to that of the surrounding soil. Grasses and forbs were removed by hand monthly to exclude the influence of the aboveground plant.
The experiment consisted of two treatments: litter input (control) and litter removed. We set one incubation box as the permanent litter input box in each plot, three replicates in each forest (Supplementary Figure S1). The other four incubation boxes were used to removed fresh litter by the nylon mesh (size 1 mm) installed 20 cm above each box. All incubation boxes were left from May 2017 to October 2017 to equilibrium. Air temperature and humidity at three study sites were measured by air temperature and humidity recorders (MicroLite5032P, Fourtrc). iButton thermometers (DS1921G-F5, Maxim/Dallas Semiconductor Inc., TX, USA) were randomly buried in the boxes at the three study sites to record soil temperature. Temperature and humidity were measured each hour. Freeze-thaw cycles were defined as periods where the temperature was above or below freezing for 3 h until it changed to below or above freezing again [30]. Most freeze-thaw cycles occurred from October 2017 to March 2018 [29].
2.3. Samples Collection
The sampling periods included the growing season (GS, May 2017–October 2017), the early freezing season (EFS, October 2017–January 2018), the freezing season (FS, January 2018–March 2018), and the thawing season (TS, March 2018–May 2018). At the end of each sampling period, all litter on the nylon mesh of litter removed incubation boxes were collected, mixed with all the litter from the same plot evenly and transited to the laboratory (three replicates in each site). The collected litter materials were classified as coniferous leaves, broadleaves, twigs, reproductive organs (flowers or seed), and others (unidentifiable plant residues and animal waste). In each plot, soil samples (0–20 cm) were collected by a soil collector (3 cm in diameter) from the litter input and one litter removal box (randomly selected) (Supplementary Figure S1). There were three replicates collected from each forest site for each treatment. After removing the visible roots, all fresh soil samples were brought back to the laboratory and passed through a 2 mm sieve. Soil total nitrogen and phosphorus were analyzed following the Kjeldahl digestion procedure and the phosphomolybdenum yellow colorimetry method, respectively. Soil pH was measured with a Calmel electrode at 1:5 soil-to-water ratio [31]. Soil moisture and bulk density was determined by the oven-dry method (at 105 °C for 24 h) [32].
2.4. Samples Analysis
The soil samples were divided into two aliquots for fresh processing and air-drying separately. Fresh soil samples were used for microbial biomass C (MBC) analysis. The soil MBC was estimated by the chloroform fumigation extraction method: 10 g of fumigated or unfumigated soil sample (with a soil solution ratio of 1:2.5) was extracted with 0.5 mol/L K2SO4, and after shaking for 1 h, purified with filter paper. The filtrate solution was analyzed for organic C. Soil MBC was calculated as the difference between the organic C in the fumigated and unfumigated soil samples [33]. Air-dried soil samples were used for measuring active SOC pools and recalcitrant C pools (RCP). In the present study, the active C pools included (1) easily oxidizable carbon (EOC) extracted from potassium permanganate [34] and (2) the labile carbon pool (LCP) extracted by two-step hydrolysis with H2SO4 [35,36]. Two-step acid hydrolysis was used to determine labile C, and H2SO4 was the extractant. LCP can be divided into two parts by the hydrolysis procedure [35,37]. The first part hydrolysis with 2.5 mol/L H2SO4 was taken as labile C pool-I (LCP-I), and further hydrolysis with 13 mol/L H2SO4 was taken as labile C pool-II (LCP-II). The concentrations of labile pools (LCP-I and LCP-II) in the hydrolysate were analyzed with a TOC analyzer. RCP was calculated as the difference between the concentration of the TOC and the labile pools (LCP-I and LCP-II summed together). TOC of soil and litter was determined by using the dichromate oxidation-sulfate-ferrous titration method [32]; total nitrogen (N) concentrations of litter were determined by the macro-Kjeldahl method [32]. The amount of litter input was measured by the gravimetric method (dried at 50 °C to the constant weight).
2.5. Statistical Analysis
Three-way repeated-measures analysis of variance (RANOVA) was used to examine the effects of litter treatment, forest type, sampling period, and their interactions on SOC fractions (MBC, TOC, EOC, LCP, and RCP). Independent sample t-test with a post hoc Tukey’s test was used to evaluate the difference between litter input and control at each season. Pearson correlation was conducted to detect the relationship between environmental factors and SOC fractions under different litter treatments. The amounts of change in TOC concentration were calculated as the concentrations of TOC under litter input minus the concentrations of TOC under control. Structural equation modeling (SEM) was conducted to determine the comprehensive effects of environmental factors (temperature, moisture, and freeze-thaw cycle) on the SOC fractions (MBC, EOC, LCP, TOC). The above-mentioned analyses were performed using IBM SPSS statistics 20.0 (IBM Crop., Armonk, NY, USA), statistically significant differences were determined at p < 0.05. The figures were drawn with Origin Pro 9.0 (Origin Lab, Northampton, MA, USA).
3. Results
3.1. Litter C Input
Litter C input showed significant (p = 0.016) seasonal dynamics in three forests throughout the research period, and the peak occurred in the early freezing season and the freezing season (Figure 2a). The cumulative litter C inputs were 400.2 kg ha−2, 362.3 kg ha−2, and 138.3 kg ha−2, in coniferous, mixed, and broadleaved forests, respectively (Figure 2b). The C input percentages of different litter components displayed obvious variation during the research (Figure 2c). Leaves were dominant in the growing and early freezing seasons, while twigs were dominant in the freezing and thawing seasons (Figure 2c). Except in the thawing season, the litter C/N ratio of the coniferous forest was significantly higher than that of the mixed forest and the broadleaved forest (Table 3).
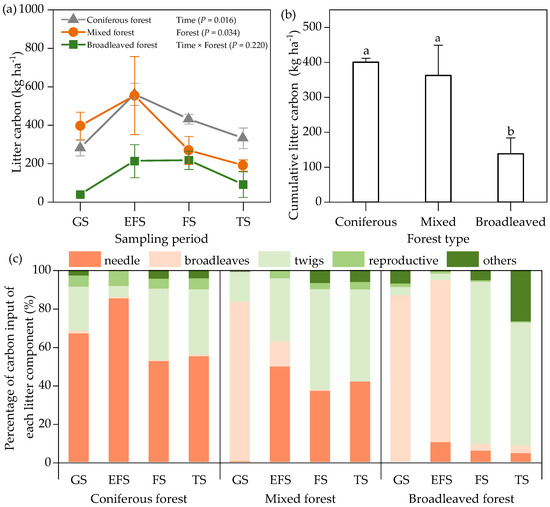
Figure 2.
Content of litter carbon input of three forests at different critical sampling periods (a), cumulative litter carbon input during the experiment (b), and percentage of carbon input of each litter component (c). GS: growing season, EFS: early freezing season, FS: freezing season, TS: thawing season. Error bars mean standard error, different lowercase letters indicate significant differences between different forest types.
Table 3.
Ratio of carbon to nitrogen of litter input at each sampling period of three forest types.
3.2. Soil Microbial Biomass C
The highest and lowest concentrations of MBC were in the early freezing and the freezing seasons, respectively (Figure 3). Sampling time had significant effect on MBC dynamics (Table 4). In the coniferous forest, the MBC concentrations of the litter input plot were significantly higher than that of the litter removed plot in the early freezing and lower in the thawing season (Figure 3, p < 0.05). In the mixed forest, the MBC concentrations of the litter input plot were significantly lower than that of the litter removed plot in the growing season, the early freezing season, and the thawing season, but higher than that of the litter removed plot in the freezing season (Figure 3, p < 0.05). In the broadleaved forest, the MBC concentrations of the litter input plot were significantly lower than that of the litter removed plot in the growing and the early freezing seasons (Figure 3, p < 0.05). In addition, there was a significant correlation between MBC concentration and temperature, the number of freeze-thaw cycles (Table 5, p < 0.05). MBC had a positive relationship with moisture (Figure 4).
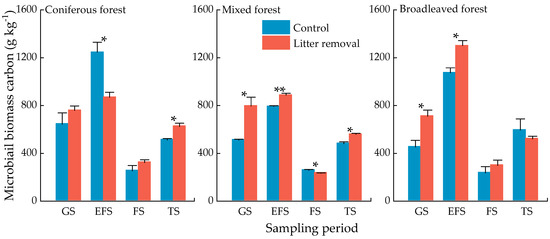
Figure 3.
Concentrations of soil microbial biomass C of three forests at different sampling periods. Values indicate means ± standard error, n = 3. Asterisks indicate significant differences between the two treatments in the same forest type at the same season. * p < 0.05, ** p < 0.01. GS: growing season, EFS: early freezing season, FS: freezing season, TS: thawing season.
Table 4.
Results of three-way RANOVA showing the p-values concerning the effects of sampling time (T), forest type (F), litter treatment (L), and their interactions on soil organic carbon fractions.
Table 5.
Results of correlation analysis between the soil organic carbon fractions and environmental factors with different litter treatments.
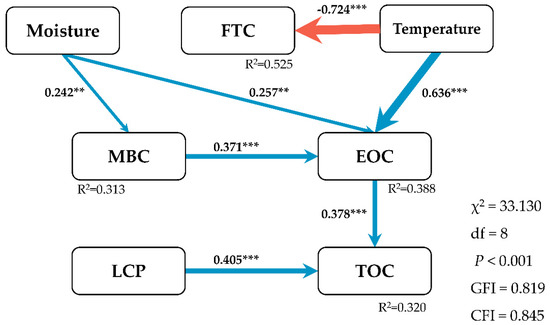
Figure 4.
Structural equation model (SEM) describes multivariate effects of environmental factors and SOC pools on the soil total organic carbon (TOC). FTC, number of freeze-thaw cycles; MBC, microbial biomass carbon; EOC, easily oxidizable carbon; LCP, labile carbon pool; χ2, chi-square; P, probability level; df, degrees of freedom; GFI, goodness of fit index; CFI, comparative fit index. Blue and red arrows indicate positive and negative relationships, respectively. Numbers next to arrows represent standardized regression weights (** p < 0.01, *** p < 0.001), the magnitudes of which are proportional to the thickness of the arrows. R2 values alongside each variable represent the estimates of multiple correlations, interpreted as proportion of variance explained for a given response variable.
3.3. Soil Organic C Pools
Litter input significantly decreased TOC concentrations in the growing season (p < 0.01) and the freezing season (p < 0.05) in the mixed and broadleaved forest, but it did not influence the TOC concentration in the coniferous forest (Figure 5). In most periods, the TOC concentrations in the coniferous forest were higher than those in the mixed and broadleaved forests (Figure 5). Forest type significantly influenced TOC concentrations (Table 4, p = 0.004). Compared with the litter removed, TOC concentrations were higher under litter input during the growing season and early freezing season in the coniferous forest and lower during the freezing season and the thawing season. However, in the mixed and broadleaved forest, the TOC concentrations were always lower in litter input than that in litter removed (Figure 5). In addition, TOC was significantly negatively related to the number of freeze-thaw cycles (Table 5, p < 0.01) and significantly positive related to EOC and LCP (Figure 4).
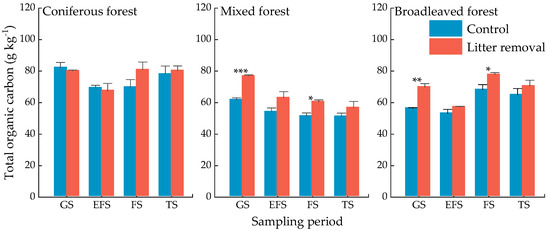
Figure 5.
Concentrations of soil total organic C of three forests at different sampling periods. Values indicate means ± standard error, n = 3. GS: growing season, EFS: early freezing season, FS: freezing season, TS: thawing season. Asterisks indicate significant differences between the two treatments in same forest type in the same season. * p < 0.05, ** p < 0.01, *** p < 0.001.
The concentrations of EOC in the freezing season were lower than that in the growing season (Figure 6a). In the mixed forest and broadleaved forest, litter input significantly decreased EOC concentrations during the growing season (Figure 6a, p < 0.05). In the coniferous forest and broadleaved forest, litter input significantly decreased EOC concentrations during the thawing season (Figure 6a, p < 0.05). Soil EOC was positive correlated with positive accumulated temperature, negative accumulated temperature, and the number of freeze-thaw cycles in both treatments (Table 5). LCP-I concentration was significantly affected by litter input during the experiment (Table 4, p = 0.011). In the coniferous forest, litter input significantly decreased LCP-I concentration during the thawing season (Figure 6b, p < 0.001). In the mixed forest and broadleaved forest, litter input significantly decreased the LCP-I concentrations during the growing (p < 0.01) and freezing seasons (p < 0.05). There was no obvious change of soil LCP-II in the three forest types, and litter inputs showed a slight effect (Figure 6c). Soil temperature was significantly positively related to EOC (Figure 4).
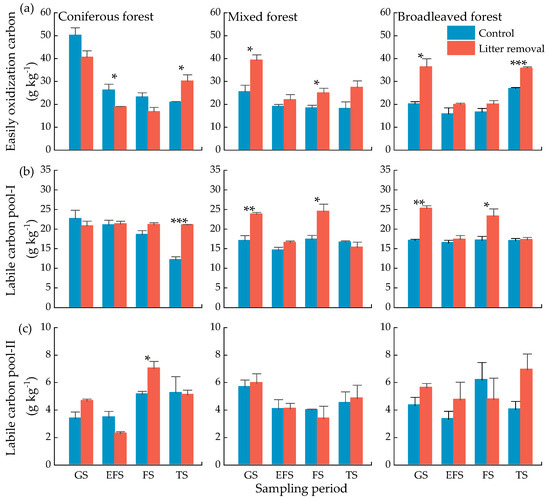
Figure 6.
Concentrations of soil active organic C of three forests at different sampling periods. Easily oxidization carbon (a), labile carbon pool-I (b), labile carbon pool-II (c). Values indicate means ± standard error, n = 3. GS: growing season, EFS: early freezing season, FS: freezing season, TS: thawing season. Asterisks indicate significant differences between the two treatments in same forest type at the same season. * p < 0.05, ** p < 0.01, *** p < 0.001.
Litter input had no significant effect on the RCP concentrations for all periods except for the growing season in the mixed forest. The RCP concentrations in coniferous forest were higher than that in the mixed and coniferous forests (Figure 7).
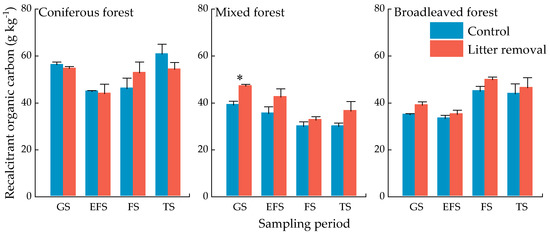
Figure 7.
Concentrations of soil recalcitrant organic C pool of three forests at different sampling periods. Values indicate means ± standard error, n = 3. GS: growing season, EFS: early freezing season, FS: freezing season, TS: thawing season. Asterisks indicate significant differences between the two treatments in same forest type at the same season. * p < 0.05.
4. Discussion
Our results showed that soil TOC and active organic C (EOC, LCP) mainly decreased in different degrees with the litter input treatment. Meanwhile, litter input also decreased MBC concentrations, related to restricted microbial activity [38]. The effect of litter input on SOC was weak and slow in the coniferous forest with low-quality litter input, while a quick impact was observed in the mixed and broadleaved forests with high-quality litter input.
4.1. Effect of Litter Input on Microbial Biomass Carbon
Litter input (approximately 18 Pg·C·year−1 on the global scale) is a key source of terrestrial C and nutrient cycles [39,40]. Although researches have focused on plant-derived C over the past decades, particularly for those derived from decomposing litter [22], the relationship between litter input and TOC in different forest types remains unclear. The priming effect means strong short-term changes in the turnover of native soil C that could be triggered by litter input [41]. The size of the microbial community is related to the strength of the priming effect, microbial activities (i.e., respiration, microbial growth, mineralization potential), which may be enhanced under a positive priming effect [42,43]. Following this paradigm, MBC can be used to predict the magnitude and direction of the priming effect with isotopic labeling [44]. We found the reduction in MBC under litter input in the mixed and broadleaved forests in most periods (Figure 3), but whether there was a negative priming effect and the magnitude of the priming effect need further verification [45,46]. However, it was observed that there were significant relationships between MBC and soil temperature and freeze-thaw cycle (Table 5). Low temperature and low litter quality, both of which retard plant litter decomposition rates, have been generally accepted as principal drivers of organic C accumulation in cold biomes [47].
These results indicate that despite the negative priming not being confirmed, soil C degradation by microorganisms is indeed limited by the low temperature, especially in winter [48]. Thus, the status of soil carbon assimilated by microbes does not change. Still, litter input causes more C to be respired through microbial maintenance metabolic compared with that of litter removal, leading to a reduction of MBC [38]. Furthermore, various C/N ratios of substrates are recommended to predict whether sequestration or mineralization of C will prevail during litter decomposition [12,49]. This may be explained by a microbial substrate utilization strategy, where opportunistic microbes may decline C decomposition via the production of inhibitors or uptake of inorganic nutrients [50]. Therefore, we suggest that both microbes and environmental factors should be simultaneously considered as key controllers of the mechanism of TOC storage in the subalpine region.
4.2. Effect of Litter Input on Soil Organic Carbon and Its Fractions
The increase in forest productivity leads to increase in litter input on the forest floor, which is generally assumed to increase TOC storage in SOC cycle models [8]. However, the complex relationship between different resistant soil C pools and plant litters has led to conflicting reports on the effects of altering litter input on soil C pools [51,52]. Our results showed that litter input decreased the TOC concentration of the mixed and broadleaved forests during the growing season and the freezing season (Figure 5). Terrestrial soil C storage depends on two contrasting processes: C releases through gaseous, physical, and hydrological processes; C is protected in the soil within the form that is not easily accessible to microorganisms. For decades, soil C storage has been thought to be driven primarily by the stabilized compound due to its inherent chemical recalcitrance [11,53]. C in the recalcitrant pool is composed of supramolecular structures or mineral-associated fractions, which indicated that RCP is stable and not vulnerable to attack [54]. Despite the study addressing that RCP should be included in the predicting TOC dynamics [55], RCP usually has a long turnover time and a small proportion of changes [14].
Thus, we only observed changes in EOC and LCP (Figure 6), but not in RCP (Figure 7) in the present study. A previous study has reported that active C (e.g., polysaccharides, and simple sugars) was lower in the double litter treatment [51]. Because active C is sensitive to changing environmental conditions and easily available for microorganisms, labile compounds such as starch, proteins, and cellulose are digested [3]. Studies in the subalpine region have investigated that mechanical disruption and intense leaching could lead to absolute losses of cellulose and lignin from litter decomposition [28], root growth during the growing season, and the changes of freeze-thaw events in winter will cause the loss or the mineralization of the active C pools [48]. In addition, this accessible C might enhance rhizosphere activities (root biomass and exudate) and ultimately stimulate soil organic C decomposition rates by 380% [56].
Meanwhile, based on a recent finding that a common root exudate, oxalic acid, stimulated soil C loss by liberating mineral-protected organic compounds [57], it is reasonable to explain that litter input reduces soil easily decomposable C and ultimately decreases soil TOC. Thus, the turnover of active C regulated by special environmental conditions in subalpine forests drives TOC storage (Figure 4). Considering microbial activity, greater insight into these mechanisms and their interdependencies, priority and sensitivity to litter input could provide future levers of action for C sequestration in soil.
4.3. Litter Quality Regulates the Response of Soil Carbon Pools to Litter Input
Dynamics of TOC concentrations under litter input varied with forest types. Our results revealed that diminishing nitrogen availability (Table 3) after the addition of low-quality litter induced a slow effect at the coniferous forest and a quick effect after the addition of high-quality litter (Figure 5) [16]. It is generally accepted that water-soluble and unshielded holocellulose is decomposed quickly when nitrogen is available in the coniferous forest, while lignin dominates the litter decomposition rate in the broadleaved forest [22], which explains the slow effect in the coniferous forest. In the present study, needle litter accounted for 55–85% of litter C input in the coniferous forest, but only for 0–50% in the mixed forest. The largest proportion of litter input was broadleaves and twigs in the broadleaved forest (Figure 2). Thus, through differences in litter quality, forest types can affect soil TOC concentrations and their response to litter input. Contrary to the result of a broadleaved forest accompanying soil TOC buildup [19], lower concentrations of TOC in the broadleaved forest were found in this study. Meanwhile, the changes in plant community composition, C allocation, and microbial ecological strategies create uncertainty in predicting soil TOC dynamics in different forests [58]. Thus, additional studies are needed to clarify how the shifts of litter chemical traits due to different forest types would influence soil TOC dynamics in the subalpine region.
5. Conclusions
Our results suggested that TOC loss was amplified by soil active C in the subalpine forests, although the utilization of soil C by microorganisms was inhibited. It indicated that the TOC dynamic is the result of multiple mechanisms. Among forest types, the effect of litter input on SOC was weak and slow in the coniferous forest with low-quality litter input, while a quick effect was observed in the mixed and broadleaved forests with high-quality litter input, implying that the different effects resulted from litter original chemistry diversity. We propose that the loss of soil active C leading to the decrease in TOC needs to be taken into consideration, especially in the area where microbial activity is limited by poor climate conditions in cold region.
Supplementary Materials
The following are available online at https://www.mdpi.com/article/10.3390/f12111479/s1, Figure S1: Sample collection diagram.
Author Contributions
Conceptualization, L.Z. and X.N.; methodology, L.Z.; formal analysis, Y.Y., Z.C.; field investigation, Z.C., Y.S., X.W., and B.T.; writing—original draft preparation, Z.C., L.Z.; writing—review and editing, L.Z., C.Y., and B.T.; Z.X., B.T., H.L., and L.Z. contributed resources. All authors have read and agreed to the published version of the manuscript.
Funding
This project was funded by the National Natural Science Foundational of China (31700542, 31901295, 32071745, and 31870602); Program of Sichuan Excellent Youth Sci-Tech Foundation (2020JDJQ0052); and the National Key Research and Development Program of China (2016YFC0502505 and 2017YFC0505003), Science and Technology Development Project of the Central Government Guided in Sichuan (2020ZYD049).
Institutional Review Board Statement
Not applicable.
Informed Consent Statement
Not applicable.
Data Availability Statement
Not applicable.
Conflicts of Interest
The authors declare no conflict of interests. The founding sponsors had no role in the design of the study; in the collection, analyses, or interpretation of data; in the writing of the manuscript, and in the decision to publish the results.
References
- Köchy, M.; Hiederer, R.; Freibauer, A. Global distribution of soil organic carbon–part 1: Masses and frequency distributions of SOC stocks for the tropics, permafrost regions, wetlands, and the world. SOIL 2015, 1, 351–365. [Google Scholar] [CrossRef] [Green Version]
- Stockmann, U.; Adams, M.A.; Crawford, J.W.; Field, D.J.; Henakaarchchi, N.; Jenkins, M.; Minasny, B.; McBratney, A.B.; de Courcelles, V.; Singh, K.; et al. The knowns, known unknowns and unknowns of sequestration of soil organic carbon. Agric. Ecosyst. Environ. 2013, 164, 80–99. [Google Scholar] [CrossRef]
- Kuzyakov, Y.; Horwath, W.R.; Dorodnikov, M.; Blagodatskaya, E. Review and synthesis of the effects of elevated atmospheric CO2 on soil processes: No changes in pools, but increased fluxes and accelerated cycles. Soil Biol. Biochem. 2019, 128, 66–78. [Google Scholar] [CrossRef]
- Cotrufo, M.F.; Wallenstein, M.D.; Boot, C.M.; Denef, K.; Paul, E. The microbial efficiency-matrix stabilization (MEMS) framework integrates plant litter decomposition with soil organic matter stabilization: Do labile plant inputs form stable soil organic matter? Glob. Chang. Biol. 2013, 19, 988–995. [Google Scholar] [CrossRef] [Green Version]
- Basile-Doelsch, I.; Balesdent, J.; Pellerin, S. Reviews and syntheses: The mechanisms underlying carbon storage in soil. Biogeosciences 2020, 17, 5223–5242. [Google Scholar] [CrossRef]
- Topa, D.; Cara, I.G.; Jităreanu, G. Long term impact of different tillage systems on carbon pools and stocks, soil bulk density, aggregation and nutrients: A field meta-analysis. CATENA 2021, 199, 105102. [Google Scholar] [CrossRef]
- Haddix, M.L.; Paul, E.A.; Cotrufo, M.F. Dual, differential isotope labeling shows the preferential movement of labile plant constituents into mineral-bonded soil organic matter. Glob. Chang. Biol. 2016, 22, 2301–2312. [Google Scholar] [CrossRef] [PubMed]
- Gottschalk, P.; Smith, J.U.; Wattenbach, M.; Bellarby, J.; Stehfest, E.; Arnell, N.; Osborn, T.J.; Jones, C.; Smith, P. How will organic carbon stocks in mineral soils evolve under future climate? global projections using RothC for a range of climate change scenarios. Biogeosciences 2012, 9, 3151–3171. [Google Scholar] [CrossRef] [Green Version]
- Lajtha, K.; Townsend, K.L.; Kramer, M.G.; Swanston, C.; Bowden, R.D.; Nadelhoffer, K. Changes to particulate versus mineral-associated soil carbon after 50 years of litter manipulation in forest and prairie experimental ecosystems. Biogeochemistry 2014, 119, 341–360. [Google Scholar] [CrossRef]
- Bowden, R.D.; Deem, L.; Plante, A.F.; Peltre, C.; Nadelhoffer, K.; Lajtha, K. Litter input controls on soil carbon in a temperate deciduous forest. Soil Sci. Soc. Am. J. 2014, 78, S66–S75. [Google Scholar] [CrossRef]
- Lajtha, K.; Bowden, R.D.; Crow, S.; Fekete, I.; Kotroczó, Z.; Plante, A.; Simpson, M.J.; Nadelhoffer, K.J. The detrital input and removal treatment (DIRT) network: Insights into soil carbon stabilization. Sci. Total Environ. 2018, 640–641, 1112–1120. [Google Scholar] [CrossRef]
- Di, L.D.P.; De, B.W.; Klein, G.P.J.A.; Hannula, S.E.; Van der Wal, A. Priming of soil organic matter: Chemical structure of added compounds is more important than the energy content. Soil Biol. Biochem. 2017, 108, 41–54. [Google Scholar] [CrossRef]
- von Lützow, M.; Kögel-Knabner, I.; Ekschmitt, K.; Flessa, H.; Guggenberger, G.; Matzner, E.; Marschner, B. SOM Fractionation methods: Relevance to functional pools and to stabilization mechanisms. Soil Biol. Biochem. 2007, 39, 2183–2207. [Google Scholar] [CrossRef]
- Wu, J.; Zhang, D.; Chen, Q.; Feng, J.; Li, Q.; Yang, F.; Zhang, Q.; Cheng, X. Shifts in soil organic carbon dynamics under detritus input manipulations in a coniferous forest ecosystem in subtropical China. Soil. Biol. Biochem. 2018, 126, 1–10. [Google Scholar] [CrossRef]
- Yoshida, H.; Sazawa, K.; Wada, N.; Hata, N.; Marumo, K.; Fukushima, M.; Kuramitz, H. Changes in the chemical composition of soil organic matter including water-soluble component during incubation: A case study of coniferous and broadleaf forest soils. CATENA 2018, 171, 22–28. [Google Scholar] [CrossRef]
- Fanin, N.; Alavoine, G.; Bertrand, I. Temporal dynamics of litter quality, soil properties and microbial strategies as main drivers of the priming effect. Geoderma 2020, 377, 114576. [Google Scholar] [CrossRef]
- Blagodatsky, S.; Blagodatskaya, E.; Yuyukina, T.; Kuzyakov, Y. Model of apparent and real priming effects: Linking microbial activity with soil organic matter decomposition. Soil Biol. Biochem. 2010, 42, 1275–1283. [Google Scholar] [CrossRef]
- Zhang, Y.-L.; Yao, S.-H.; Cao, X.-Y.; Schmidt-Rohr, K.; Olk, D.C.; Mao, J.-D.; Zhang, B. Structural evidence for soil organic matter turnover following glucose addition and microbial controls over soil carbon change at different horizons of a mollisol. Soil Biol. Biochem. 2018, 119, 63–73. [Google Scholar] [CrossRef]
- Shao, S.; Zhao, Y.; Zhang, W.; Hu, G.; Xie, H.; Yan, J.; Han, S.; He, H.; Zhang, X. Linkage of microbial residue dynamics with soil organic carbon accumulation during subtropical forest succession. Soil Biol. Biochem. 2017, 114, 114–120. [Google Scholar] [CrossRef]
- Ni, X.; Liao, S.; Tan, S.; Peng, Y.; Wang, D.; Yue, K.; Wu, F.; Yang, Y. The vertical distribution and control of microbial necromass carbon in forest soils. Glob. Ecol. Biogeogr. 2020, 29, 1829–1839. [Google Scholar] [CrossRef]
- Bai, Z.; Wu, X.; Lin, J.-J.; Xie, H.-T.; Yuan, H.-S.; Liang, C. Litter-, Soil-, and C:N-Stoichiometry-associated shifts in fungal communities along a subtropical forest succession. CATENA 2019, 178, 350–358. [Google Scholar] [CrossRef]
- Berg, B. Decomposition patterns for foliar litter—A theory for influencing factors. Soil Biol. Biochem. 2014, 78, 222–232. [Google Scholar] [CrossRef]
- Lehmann, J.; Kleber, M. The contentious nature of soil organic matter. Nature 2015, 528, 60–68. [Google Scholar] [CrossRef]
- Prescott, C.E. Litter decomposition: What controls it and how can we alter it to sequester more carbon in forest soils? Biogeochemistry 2010, 101, 133–149. [Google Scholar] [CrossRef]
- Yang, W.; Wang, K.-Y.; Kellomaki, S.; Song, H.-D. Litter dynamics of three subalpine forests in Western Sichuan. Pedosphere 2005, 15, 653–659. [Google Scholar]
- Wu, F.; Yang, W.; Zhang, J.; Deng, R. Litter decomposition in two subalpine forests during the freeze–Thaw season. Acta Oecol. 2010, 36, 135–140. [Google Scholar] [CrossRef]
- Xu, Z.; Zhu, J.; Wu, F.; Liu, Y.; Tan, B.; Yang, W. Effects of litter quality and climate change along an elevational gradient on litter decomposition of subalpine forests, Eastern Tibetan Plateau, China. J. For. Res. 2016, 27, 505–511. [Google Scholar] [CrossRef]
- Li, H.; Wu, F.; Yang, W.; Xu, L.; Ni, X.; He, J.; Tan, B.; Hu, Y. Effects of forest gaps on litter lignin and cellulose dynamics vary seasonally in an alpine forest. Forests 2016, 7, 17. [Google Scholar] [CrossRef] [Green Version]
- Wei, X.; Yang, Y.; Shen, Y.; Chen, Z.; Dong, Y.; Wu, F.; Zhang, L. Effects of litterfall on the accumulation of extracted soil humic substances in subalpine forests. Front. Plant Sci. 2020, 11, 254. [Google Scholar] [CrossRef]
- Konestabo, H.S.; Michelsen, A.; Holmstrup, M. Responses of springtail and mite populations to prolonged periods of soil freeze-thaw cycles in a sub-arctic ecosystem. Appl. Soil Ecol. 2007, 36, 136–146. [Google Scholar] [CrossRef]
- Wei, X.; Yang, W.; Zhang, L.; Tan, B.; Chen, Y.; Dong, Y.; Wu, F. Effects of litter addition on soil humification during freeze-thaw cycles in a subalpine forest. Acta Ecol. Sin. 2018, 38, 6521–6529. [Google Scholar] [CrossRef]
- Soil Sampling and Methods of Analysis, 2nd ed.; Carter, M.R.; Gregorich, E.G. (Eds.) Canadian Society of Soil Science: Pinawa, MB, Canada; CRC Press: Boca Raton, FL, USA, 2008; ISBN 978-0-8493-3586-0. [Google Scholar]
- Vance, E.D.; Brookes, P.C.; Jenkinson, D.S. An extraction method for measuring soil microbial biomass C. Soil Biol. Biochem. 1987, 19, 703–707. [Google Scholar] [CrossRef]
- Blair, G.; Lefroy, R.; Lisle, L. Soil carbon fractions based on their degree of oxidation, and the development of a carbon management index for agricultural systems. Aust. J. Agric. Res. 1995, 46, 1459. [Google Scholar] [CrossRef]
- Rovira, P.; Ramón, V.V. Labile, recalcitrant, and inert organic matter in Mediterranean forest soils. Soil Biol. Biochem. 2007, 39, 202–215. [Google Scholar] [CrossRef]
- Xu, G.; Chen, J.; Berninger, F.; Pumpanen, J.; Bai, J.; Yu, L.; Duan, B. Labile, recalcitrant, microbial carbon and nitrogen and the microbial community composition at two abies faxoniana forest elevations under elevated temperatures. Soil Biol. Biochem. 2015, 91, 1–13. [Google Scholar] [CrossRef]
- Belay-Tedla, A.; Zhou, X.; Su, B.; Wan, S.; Luo, Y. Labile, recalcitrant, and microbial carbon and nitrogen pools of a tallgrass prairie soil in the us great plains subjected to experimental warming and clipping. Soil Biol. Biochem. 2009, 41, 110–116. [Google Scholar] [CrossRef]
- Xu, X.; Schimel, J.P.; Thornton, P.E.; Song, X.; Yuan, F.; Goswami, S. Substrate and environmental controls on microbial assimilation of soil organic carbon: A framework for earth system models. Ecol. Lett. 2014, 17, 547–555. [Google Scholar] [CrossRef]
- Malhi, Y.; Doughty, C.; Galbraith, D. The allocation of ecosystem net primary productivity in tropical forests. Phil. Trans. R. Soc. B 2011, 366, 3225–3245. [Google Scholar] [CrossRef] [PubMed] [Green Version]
- Chave, J.; Navarrete, D.; Almeida, S.; Álvarez, E.; Aragão, L.E.; Bonal, D.; Châtelet, P.; Silva-Espejo, J.E.; Goret, J.-Y.; von Hildebrand, P.; et al. Regional and seasonal patterns of litterfall in tropical South America. Biogeosciences 2010, 7, 43–55. [Google Scholar] [CrossRef] [Green Version]
- Kuzyakov, Y. Priming effects: Interactions between living and dead organic matter. Soil Biol. Biochem. 2010, 42, 1363–1371. [Google Scholar] [CrossRef]
- Kuzyakov, Y.; Blagodatskaya, E. Microbial hotspots and hot moments in soil: Concept & review. Soil Biol. Biochem. 2015, 83, 184–199. [Google Scholar] [CrossRef]
- Liu, X.-J.A.; Finley, B.K.; Mau, R.L.; Schwartz, E.; Dijkstra, P.; Bowker, M.A.; Hungate, B.A. The soil priming effect: Consistent across ecosystems, elusive mechanisms. Soil Biol. Biochem. 2020, 140, 107617. [Google Scholar] [CrossRef]
- Blagodatskaya, E.; Kuzyakov, Y. Mechanisms of real and apparent priming effects and their dependence on soil microbial biomass and community structure: Critical review. Biol. Fertil. Soils 2008, 45, 115–131. [Google Scholar] [CrossRef]
- Kuzyakov, Y.; Friedel, J.K.; Stahr, K. Review of mechanisms and quantification of priming effects. Soil Biol. 2000, 32, 1485–1498. [Google Scholar] [CrossRef]
- Kuzyakov, Y.; Subbotina, I.; Chen, H.; Bogomolova, I.; Xu, X. Black Carbon decomposition and incorporation into soil microbial biomass estimated by 14C labeling. Soil Biol. Biochem. 2009, 41, 210–219. [Google Scholar] [CrossRef]
- Brovkin, V.; van Bodegom, P.; Kleinen, T.; Wirth, C.; Cornwell, W.K.; Cornelissen, J.H.; Kattge, J. Plant-driven variation in decomposition rates improves projections of global litter stock distribution. Biogeosciences 2012, 9, 565–576. [Google Scholar] [CrossRef] [Green Version]
- Song, Y. Altered soil carbon and nitrogen cycles due to the freeze-thaw effect: A meta-analysis. Soil Biol. Biochem. 2017, 109, 35–49. [Google Scholar] [CrossRef]
- Blagodatskaya, E.; Khomyakov, N.; Myachina, O.; Bogomolova, I.; Blagodatsky, S.; Kuzyakov, Y. Microbial interactions affect sources of priming induced by cellulose. Soil Biol. Biochem. 2014, 74, 39–49. [Google Scholar] [CrossRef]
- Takriti, M.; Wild, B.; Schnecker, J.; Mooshammer, M.; Knoltsch, A.; Lashchinskiy, N.; Eloy, A.R.; Gentsch, N.; Gittel, A.; Mikutta, R.; et al. Soil Organic matter quality exerts a stronger control than stoichiometry on microbial substrate use efficiency along a latitudinal transect. Soil Biol. Biochem. 2018, 121, 212–220. [Google Scholar] [CrossRef] [Green Version]
- Crow, S.E.; Lajtha, K.; Bowden, R.D.; Yano, Y.; Brant, J.B.; Caldwell, B.A.; Sulzman, E.W. Increased coniferous needle inputs accelerate decomposition of soil carbon in an old-growth forest. For. Ecol. Manag. 2009, 258, 2224–2232. [Google Scholar] [CrossRef]
- Cao, J.; He, X.; Chen, Y.; Chen, Y.; Zhang, Y.; Yu, S.; Zhou, L.; Liu, Z.; Zhang, C.; Fu, S. Leaf litter contributes more to soil organic carbon than fine roots in two 10-year-old subtropical plantations. Sci. Total Environ. 2020, 704, 135341. [Google Scholar] [CrossRef] [PubMed]
- Thevenot, M.; Dignac, M.-F.; Rumpel, C. Fate of lignins in soils: A review. Soil Biol. Biochem. 2010, 42, 1200–1211. [Google Scholar] [CrossRef]
- Paul, E.A. The nature and dynamics of soil organic matter: Plant inputs, microbial transformations, and organic matter stabilization. Soil Biol. Biochem. 2016, 98, 109–126. [Google Scholar] [CrossRef] [Green Version]
- van Groenigen, K.; Xia, J.; Osenberg, C.W.; Luo, Y.; Hungate, B.A. Application of a two-pool model to soil carbon dynamics under elevated CO2. Glob Chang. Biol. 2015, 21, 4293–4297. [Google Scholar] [CrossRef] [PubMed]
- Cheng, W.; Parton, W.J.; Gonzalez-Meler, M.A.; Phillips, R.; Asao, S.; McNickle, G.G.; Brzostek, E.; Jastrow, J.D. Synthesis and modeling perspectives of rhizosphere priming. New Phytol. 2014, 201, 31–44. [Google Scholar] [CrossRef] [PubMed] [Green Version]
- Keiluweit, M.; Bougoure, J.J.; Nico, P.S.; Pett-Ridge, J.; Weber, P.K.; Kleber, M. Mineral protection of soil carbon counteracted by root exudates. Nat. Clim. Chang. 2015, 5, 588–595. [Google Scholar] [CrossRef]
- Han, T.; Ren, H.; Wang, J.; Lu, H.; Song, G.; Chazdon, R.L. Variations of leaf eco-physiological traits in relation to environmental factors during forest succession. Ecol. Indic. 2020, 117, 106511. [Google Scholar] [CrossRef]
Publisher’s Note: MDPI stays neutral with regard to jurisdictional claims in published maps and institutional affiliations. |
© 2021 by the authors. Licensee MDPI, Basel, Switzerland. This article is an open access article distributed under the terms and conditions of the Creative Commons Attribution (CC BY) license (https://creativecommons.org/licenses/by/4.0/).